Hostname: page-component-745bb68f8f-cphqk Total loading time: 0 Render date: 2025-01-09T22:33:39.684Z Has data issue: false hasContentIssue false

Progressive evolution of the viscous dissipation mechanism from the macroscale to the nanoscale

Published online by Cambridge University Press:  31 October 2024
Yi-Feng Wang
Affiliation:
State Key Laboratory of Alternate Electrical Power System with Renewable Energy Sources, North China Electric Power University, Beijing 102206, PR China Research Center of Engineering Thermophysics, North China Electric Power University, Beijing 102206, PR China
Zhi-Hui Cai
Affiliation:
State Key Laboratory of Alternate Electrical Power System with Renewable Energy Sources, North China Electric Power University, Beijing 102206, PR China Research Center of Engineering Thermophysics, North China Electric Power University, Beijing 102206, PR China
Yi-Bo Wang
Affiliation:
State Key Laboratory of Alternate Electrical Power System with Renewable Energy Sources, North China Electric Power University, Beijing 102206, PR China Research Center of Engineering Thermophysics, North China Electric Power University, Beijing 102206, PR China
Shu-Rong Gao
Affiliation:
State Key Laboratory of Alternate Electrical Power System with Renewable Energy Sources, North China Electric Power University, Beijing 102206, PR China Research Center of Engineering Thermophysics, North China Electric Power University, Beijing 102206, PR China
Yan-Ru Yang
Affiliation:
State Key Laboratory of Alternate Electrical Power System with Renewable Energy Sources, North China Electric Power University, Beijing 102206, PR China Research Center of Engineering Thermophysics, North China Electric Power University, Beijing 102206, PR China
Shao-Fei Zheng*
Affiliation:
State Key Laboratory of Alternate Electrical Power System with Renewable Energy Sources, North China Electric Power University, Beijing 102206, PR China Research Center of Engineering Thermophysics, North China Electric Power University, Beijing 102206, PR China
Duu-Jong Lee*
Affiliation:
Department of Mechanical Engineering, City University of Hong Kong, Kowloon Tong 999077, Hong Kong Department of Chemical Engineering & Materials Science, Yuan Ze University, Chung-Li 32003, Taiwan
Xiao-Dong Wang*
Affiliation:
State Key Laboratory of Alternate Electrical Power System with Renewable Energy Sources, North China Electric Power University, Beijing 102206, PR China Research Center of Engineering Thermophysics, North China Electric Power University, Beijing 102206, PR China
*
Email addresses for correspondence: [email protected], [email protected], [email protected]

Abstract

Recent studies of viscous dissipation mechanisms in impacting droplets have revealed distinct behaviours between the macroscale and nanoscale. However, the transition of these mechanisms from the macroscale to the nanoscale remains unexplored due to limited research at the microscale. This work addresses the gap using the many-body dissipative particle dynamics (MDPD) method. While the MDPD method omits specific atomic details, it retains crucial mesoscopic effects, making it suitable for investigating the impact dynamics at the microscale. Through the analysis of velocity contours within impacting droplets, the research identifies three primary contributors to viscous dissipation during spreading: boundary-layer viscous dissipation from shear flow; rim geometric head loss; and bulk viscous dissipation caused by droplet deformation. This prompts a re-evaluation of viscous dissipation mechanisms at both the macroscale and nanoscale. It reveals that the same three kinds of dissipation are present across all scales, differing only in their relative intensities at each scale. A model of the maximum spreading factor (βmax) incorporating all forms of viscous dissipation without adjustable parameters is developed to substantiate this insight. This model is validated against three distinct datasets representing the macroscale, microscale and nanoscale, encompassing a broad spectrum of Weber numbers, Ohnesorge numbers and contact angles. The satisfactory agreement between the model predictions and the data signifies a breakthrough in establishing a universal βmax model applicable across all scales. This model demonstrates the consistent nature of viscous dissipation mechanisms across different scales and underscores the importance of integrating microscale behaviours to understand macroscale and nanoscale phenomena.

Type
JFM Papers
Copyright
© The Author(s), 2024. Published by Cambridge University Press

1. Introduction

A droplet impacting a solid surface is a familiar occurrence in everyday life, offering a wide range of complex outcomes such as spreading, retraction, deposition, splashing, bouncing and breakup (Josserand & Thoroddsen Reference Josserand and Thoroddsen2016). Despite its commonplace nature, the study of droplet impact dynamics on solid surfaces remains a vibrant area of research. Since being initially documented by Worthington (Reference Worthington1876), this field has continued to thrive in recent years. Substantial efforts have been made to unravel the secret of impact dynamics, encompassing diverse approaches such as experimental studies (Bertola Reference Bertola2009; Visser et al. Reference Visser, Tagawa, Sun and Lohse2012, Reference Visser, Frommhold, Wildeman, Mettin, Lohse and Sun2015; Lee et al. Reference Lee, Derome, Dolatabadi and Carmeliet2016a; Yang et al. Reference Yang, Qi, Han, Zhang and Ni2018; Srivastava & Kondaraju Reference Srivastava and Kondaraju2020), numerical simulations (Eggers et al. Reference Eggers, Fontelos, Josserand and Zaleski2010; Kobayashi et al. Reference Kobayashi, Konno, Yaguchi, Fujii, Sanada and Watanabe2016; Lee et al. Reference Lee, Derome, Dolatabadi and Carmeliet2016a; Koishi, Yasuoka & Zeng Reference Koishi, Yasuoka and Zeng2017; Bordbar et al. Reference Bordbar, Taassob, Khojasteh, Marengo and Kamali2018; Du et al. Reference Du, Wang, Li, Min and Wu2021a) and theoretical analyses (Ukiwe & Kwok Reference Ukiwe and Kwok2005; Attané, Girard & Morin Reference Attané, Girard and Morin2007; Laan et al. Reference Laan, de Bruin, Bartolo, Josserand and Bonn2014; Lee et al. Reference Lee, Laan, de Bruin, Skantzaris, Shahidzadeh, Derome, Carmeliet and Bonn2016b; Wang et al. Reference Wang, Wang, Yang and Chen2019, Reference Wang, Wang, Gao, Yang, Wang and Chen2020a,Reference Wang, Wang, Xie, Liu, Wang, Yang, Gao and Wangb).

The vitality of studying droplet impact on solid surfaces stems from the various parameters governing this seemingly simple phenomenon. This includes a balance of competing forces and the influence of various surface characteristics. In the case of droplet impact, inertial, capillary and viscous forces are the primary influencers if the droplet diameter (D 0) is less than the capillary length (2.7 mm for water, for example). The key dimensionless numbers to quantify this interplay are the Weber number ($We = \rho {D_0}V_0^2/\gamma$), representing the ratio of inertial to capillary forces; the Reynolds number (Re = ρD 0V 0/μ), indicating the ratio of inertial to viscous forces; and the Ohnesorge number (Oh = We 1/2/Re = μ/(ρD 0γ)1/2), denoting the ratio of viscous to inertial-capillary forces. Surface features also play a crucial role, encompassing intrinsic wettability, roughness, microstructure and topography. The intrinsic wettability, in particular, is effectively quantified by the intrinsic contact angle, θ, which is the angle at the three-phase contact line of an equilibrium sessile droplet on a smooth surface. These diverse parameters mean that even the most straightforward scenario of a droplet impacting a smooth surface is governed by a complex group of dimensionless numbers, including We, Oh (Re) and θ. This richness of parameters endows the impact dynamics with fascinating mechanisms, continually inspiring in-depth studies and research in this area.

One of the critical areas of interest in droplet dynamics research is investigating the energy conversion mechanism of impacting droplets. This is often analysed by modelling the maximum spreading factor (βmax = Dmax/D 0), which is a ratio of the maximum spreading diameter (Dmax) to its original diameter (D 0). This modelling is frequently based on the energy conservation equation, which tracks the droplet's journey from its initial state to the maximum spreading state, as adopted and refined in various studies (Yarin & Weiss Reference Yarin and Weiss1995; Clanet et al. Reference Clanet, Béguin, Richard and Quéré2004; Laan et al. Reference Laan, de Bruin, Bartolo, Josserand and Bonn2014; Lee et al. Reference Lee, Laan, de Bruin, Skantzaris, Shahidzadeh, Derome, Carmeliet and Bonn2016b; Wildeman et al. Reference Wildeman, Visser, Sun and Lohse2016). The energy conservation equation can be expressed as

(1.1)\begin{equation}{E_{k,0}} + {E_{s,0}} = {E_{s,max}} + {E_{dis}},\end{equation}

where subscripts of k, s and dis represent the kinetic energy, surface energy and viscous dissipation; 0 and max stand for the initial state and the maximum spreading state, respectively. The initial spherical shape of droplets leads to simple expressions for initial kinetic and surface energy (Ek ,0 and Es ,0). The assumption of a cylindrical shape at the maximum spreading state, supported by most studies (Pasandideh-Fard et al. Reference Pasandideh-Fard, Qiao, Chandra and Mostaghimi1996; Ukiwe & Kwok Reference Ukiwe and Kwok2005; Du et al. Reference Du, Wang, Li, Min and Wu2021a), allows for the derivation of Es ,max. However, as compared with the surface energy, which depends only on shape, the viscous dissipation during spreading is also highly influenced by velocity gradients within impacting droplets, presenting a significant challenge in its quantification. Historically, assumptions about velocity gradients have evolved. Initially, there were assumptions of violent velocity gradients throughout droplets, considering only the ∂Vz/∂z (Chandra & Avedisian Reference Chandra and Avedisian1991) or ∂Vr/∂z (Madejski Reference Madejski1976) components, where Vz and Vr represent the velocities in the impact and spreading directions, respectively, and z stands for the coordinate in the impact direction. Recent studies, however, have recognised that the velocity gradient ∂Vr/∂z in the thin boundary layer near solid walls predominantly contributes to viscous dissipation during spreading (Mao, Kuhn & Tran Reference Mao, Kuhn and Tran1997; Ukiwe & Kwok Reference Ukiwe and Kwok2005; Attané et al. Reference Attané, Girard and Morin2007; Visser et al. Reference Visser, Frommhold, Wildeman, Mettin, Lohse and Sun2015; Srivastava & Kondaraju Reference Srivastava and Kondaraju2020; Du et al. Reference Du, Wang, Li, Min and Wu2021a). To estimate this dissipation, models for the thickness of the boundary layer (δ) have been proposed, such as δ = 2D 0Re −1/2, derived by analogising the plane stagnation flow with the flow inside impacting droplets (Pasandideh-Fard et al. Reference Pasandideh-Fard, Qiao, Chandra and Mostaghimi1996; Ukiwe & Kwok Reference Ukiwe and Kwok2005). In a comparison by Ukiwe & Kwok (Reference Ukiwe and Kwok2005) of theoretical βmax models based on the boundary-layer viscous dissipation assumption with experimental results on weak hydrophilic and hydrophobic surfaces, the models (Pasandideh-Fard et al. Reference Pasandideh-Fard, Qiao, Chandra and Mostaghimi1996; Ukiwe & Kwok Reference Ukiwe and Kwok2005) tend to overpredict the maximum spreading factor in a moderate range of Weber numbers (approximately from 30 to 100). Beyond this range, however, there is a better alignment between the theoretical predictions and experimental observations.

Contrary to previous assumptions, the groundbreaking study by Wildeman et al. (Reference Wildeman, Visser, Sun and Lohse2016) numerically analysed the impact of a droplet on free-slip solid surfaces. This analysis specifically aimed to exclude the boundary-layer viscous dissipation. Interestingly, the results revealed that significant dissipation of the initial kinetic energy still occurred during spreading, suggesting the presence of an alternative form of viscous dissipation. This dissipation was identified not as boundary-layer viscous dissipation but rather as a geometric head loss at the entrance of spreading rims, where a rapid reduction in velocity leads to the dissipation of nearly half of the initial kinetic energy. Crucially, this rim head loss was also observed in impacts on no-slip surfaces, where it similarly dissipated approximately half of the initial kinetic energy (Wildeman et al. Reference Wildeman, Visser, Sun and Lohse2016). This finding is further supported by the distribution of viscous dissipation observed by Lee et al. (Reference Lee, Derome, Dolatabadi and Carmeliet2016a).

These insights imply that viscous dissipation in millimetre-sized droplets impacting solid surfaces results from both the boundary layer and rim. This understanding may explain why models that only consider boundary-layer viscous dissipation tend to overestimate βmax in a moderate range of Weber numbers on weakly hydrophilic and hydrophobic surfaces (Pasandideh-Fard et al. Reference Pasandideh-Fard, Qiao, Chandra and Mostaghimi1996; Ukiwe & Kwok Reference Ukiwe and Kwok2005). After incorporating this additional mechanism of viscous dissipation, the βmax model proposed by Wildeman et al. (Reference Wildeman, Visser, Sun and Lohse2016) achieves a more accurate fit for a broad range of Weber numbers, from 30 to 3000, on surfaces with contact angles ranging from 90° to 180°.

Recently, there has been a surge in interest in the nanoscale impact dynamics on solid surfaces, principally due to the emergence of nanodroplet-based technologies such as nanoscale ink-jet printing (Galliker et al. Reference Galliker, Schneider, Eghlidi, Kress, Sandoghdar and Poulikakos2012) and the preparation of high-entropy materials (Glasscott et al. Reference Glasscott, Pendergast, Goines, Bishop, Hoang, Renault and Dick2019). Observing nanodroplet impact processes through direct experimentation is challenging due to the limitations of high-speed cameras. Consequently, molecular dynamics (MD) simulations, serving as ‘virtual experiments’ have become the primary investigative tool. Through MD simulations, several studies (Li, Zhang & Chen Reference Li, Zhang and Chen2015; Wang et al. Reference Wang, Wang, Yang and Chen2019, Reference Wang, Wang, Gao, Yang, Wang and Chen2020a,Reference Wang, Wang, Xie, Liu, Wang, Yang, Gao and Wangb Reference Wang, Wang, Yang, Wang and Chen2021a,Reference Wang, Wang, Wang, Zhang, Yang, Lee, Wang and Chenb, Reference Wang, Wang, He, Zhang, Yang, Wang and Lee2022a,Reference Wang, Wang, He, Zhang, Yang, Wang and Leeb, Reference Wang, Wang, Zhang, He, Yang, Zheng, Lee and Wang2023; Xie et al. Reference Xie, Lv, Yang and Wang2020) have identified that nanodroplets exhibit distinct dynamics compared with millimetre-sized droplets, highlighting significant scale effects. One notable scale effect is the presence of velocity gradients throughout the entire nanodroplet (Li et al. Reference Li, Zhang and Chen2015), as opposed to only in specific regions. This discovery implies that models developed for macroscale droplets fail to predict βmax at the nanoscale, which is subsequently proven by Li et al. (Reference Li, Zhang and Chen2015). In response, recent studies have reevaluated the estimation of viscous dissipation during spreading, accounting for velocity gradients across the entire droplet at the nanoscale. Various velocity distributions have been proposed to establish βmax models (Li et al. Reference Li, Zhang and Chen2015; Wang et al. Reference Wang, Wang, Yang and Chen2019, Reference Wang, Wang, Gao, Yang, Wang and Chen2020a,Reference Wang, Wang, Xie, Liu, Wang, Yang, Gao and Wangb, Reference Wang, Wang, He, Zhang, Yang, Wang and Lee2022b). For example, Wang et al. (Reference Wang, Wang, Gao, Yang, Wang and Chen2020a) suggested Vr = Vsrz/(RH) and Vz = −z 2Vs/(RH), where R is the spreading radius, H is the droplet height, r is the coordinate in the spreading direction and Vs is the spreading velocity. Despite differing assumptions among nanoscale studies, there is a consensus that viscous dissipation at this scale occurs throughout the entire droplet. However, the mechanism underlying these scale effects remains unclear. No studies have directly explored why the similarity in velocity gradients breaks down when transitioning from macroscale to nanoscale droplets. It is generally believed that due to their minimal diameters, nanodroplets are entirely within the boundary layer (Li, Li & Chen Reference Li, Li and Chen2017; Wang et al. Reference Wang, Wang, Gao, Yang, Wang and Chen2020a).

In droplet impact dynamics, the dominant forms of viscous dissipation vary significantly between the macroscale and nanoscale: at the macroscale, boundary-layer and rim viscous dissipation predominantly influence the dynamics, while at the nanoscale, viscous dissipation throughout the entire droplet becomes the critical factor, referring to as scale effects by recent studies. Nonetheless, it is essential to consider that the internal flow characteristics of droplets should seamlessly transition from the macroscale to the nanoscale. Within this context, the major obstacle to understanding scale effects is the lack of research on impacting droplets at the microscale. Achieving this comprehensive understanding of droplet impact dynamics across all scales presents significant challenges. Experimental studies to date have found it challenging to investigate the impact dynamics of droplets with diameters smaller than 40 μm approximately, primarily due to the limitations of high-speed camera technology (Visser et al. Reference Visser, Tagawa, Sun and Lohse2012, Reference Visser, Frommhold, Wildeman, Mettin, Lohse and Sun2015). On the computational front, the typical diameter of droplets studied in current MD simulations is of the order of 10 nm. This limitation is primarily due to computational performance constraints, as highlighted in studies by Li et al. (Reference Li, Zhang and Chen2015, Reference Li, Li and Chen2017), Wang et al. (Reference Wang, Wang, Yang and Chen2019, Reference Wang, Wang, Gao, Yang, Wang and Chen2020a,Reference Wang, Wang, Xie, Liu, Wang, Yang, Gao and Wangb, Reference Wang, Wang, Yang, Wang and Chen2021a,Reference Wang, Wang, Wang, Zhang, Yang, Lee, Wang and Chenb, Reference Wang, Wang, He, Zhang, Yang, Wang and Lee2022a,Reference Wang, Wang, He, Zhang, Yang, Wang and Leeb, Reference Wang, Wang, Zhang, He, Yang, Zheng, Lee and Wang2023), Xie et al. (Reference Xie, Lv, Yang and Wang2020) and Du et al. (Reference Du, Cheng, Yang, Xu, Lan, Wen and Ma2020). Therefore, a noticeable research gap exists for droplet diameters approximately between 10 nm and 40 μm. This range, referred to as the microscale in this study, remains a largely unexplored territory.

The recent development of the many-body dissipation particle dynamics (MDPD) method offers a promising avenue for advancing our understanding of droplet impact dynamics at the microscale. This innovative coarse-grained numerical method strategically omits specific atomic-level details while retaining crucial mesoscopic effects. Such an approach allows for studying larger-scale systems than those typically examined in MD simulations. This capability of MDPD has been supported by the studies of Warren (Reference Warren2001Reference Warren2003), Nie, Zhong & Fang (Reference Nie, Zhong and Fang2019), Chen, Nie & Fang (Reference Chen, Nie and Fang2020) and Zhao et al. (Reference Zhao, Chen, Zhang and Liu2021). Given its advantage, the MDPD method is expected to be particularly effective for investigating the impact dynamics of droplets within the microscale range. This fills the critical gap in current research methodologies, bridging the divide between nanoscale-focused MD simulations and the limitations of high-speed camera technology in capturing macroscale phenomena. The application of MDPD thus holds significant potential for providing new insights into droplet dynamics at this vital but previously inaccessible scale.

The primary goal of this research is to decipher the mechanisms of viscous dissipation during spreading across all scales. This work first addresses the research gap at the microscale using MDPD simulations. Through these simulations, the velocity distribution within impacting droplets is meticulously extracted and analysed, gaining insights into the viscous dissipation mechanisms at the microscale. This analysis is pivotal in revealing that the progressive flow characteristics shift from the macroscale to the microscale and eventually to the nanoscale. Tracing this transition reveals how viscous dissipation mechanisms evolve from the macroscale to the nanoscale. As a result of this comprehensive study, a full-scale βmax model is developed and validated. This model is supported by extensive data covering the macroscale, microscale and nanoscale, verifying the viscous dissipation mechanism throughout the full scales.

2. Simulation method

The MDPD method is a coarse-grained approach wherein each coarse particle symbolises a cluster of real atoms/molecules. This method ignores atomic details while maintaining mesoscopic effects (Zhao et al. Reference Zhao, Chen, Zhang and Liu2021). Consequently, MDPD simulations are particularly adept at exploring microscale dynamics. All simulations are implemented using the LAMMPS (large-scale atomic/molecular massively parallel simulator) software package. Each simulation includes three steps: the creation of initial systems; the establishment of interactions between particles; and the implementation of simulation procedures.

As figure 1 shows, the initial step features a water droplet (the map between the MDPD liquid and water to be discussed later) and a solid substrate. The droplet is positioned at a distance of 5 DPD units (the units will be elucidated later) from the solid substrate to avoid premature contact, where the DPD stands for dissipation particle dynamics. Moreover, the system is filled with gas particles to replicate a nitrogen environment of 100 kPa, similar to an atmospheric environment. The simulation's dimensions are 80 × 80 × 48, with periodic boundary conditions applied along the x- and y-axes and a fixed boundary condition on the z-axis. The droplet and solid substrate are initially generated using simple cubic crystal structures.

Figure 1. The schematic of the simulation system containing a droplet above a solid substrate after achieving equilibrium. The system is filled with nitrogen particles to replicate a nitrogen environment of 100 kPa, similar to an atmospheric environment.

In MDPD simulations, water–water (w-w), solid–solid (s-s) and water–solid (w-s) particle interactions are governed by three distinct forces, as proposed by Groot & Warren (Reference Groot and Warren1997) and Warren (Reference Warren2001, Reference Warren2003). These forces are the conservative force ($\boldsymbol{F}_{ij}^C$), the dissipative force ($\boldsymbol{F}_{ij}^D$) and the random force ($\boldsymbol{F}_{ij}^R$), i.e.

(2.1)\begin{equation}{\boldsymbol{F}_{ij}} = \boldsymbol{F}_{ij}^C + \boldsymbol{F}_{ij}^D + \boldsymbol{F}_{ij}^R,\end{equation}

where Fij represents the force exerted by particle j on particle i. The mathematical expressions for these forces are formulated as

(2.2) \begin{gather}\boldsymbol{F}_{ij}^{\boldsymbol{C}} = A{\omega _c}({r_{ij}}){\boldsymbol{e}_{ij}} + B({\rho _i} + {\rho _j}){\omega _d}({r_{ij}}){\boldsymbol{e}_{ij}},\end{gather}
(2.3)\begin{gather}\boldsymbol{F}_{ij}^D =- {\gamma _d}{\omega _D}({r_{ij}})({\boldsymbol{e}_{ij}}{\boldsymbol{v}_{ij}}){\boldsymbol{e}_{ij}},\end{gather}
(2.4)\begin{gather}\boldsymbol{F}_{ij}^R = \sigma {\omega _R}({r_{ij}}){\xi _{ij}}\Delta {t^{ - 1/2}}{\boldsymbol{e}_{ij}}.\end{gather}

The relative position and velocity vectors, denoted as eij and vij, are determined by rij/rij and vi − vj, respectively. In (2.2), the conservative force comprises two components: the attractive and repulsive forces, modulated by parameters A and B. The weight functions, ωc (for the attractive force) and ωd (for the repulsive force), are computed using the expressions 1 − rij/rc and 1 − rij/rd, respectively, where rc and rd signify the cutoff distances for these forces. For accurately simulating the liquid–vapour interface, the soft repulsion is tailored to depend on local density. The local density ρi is calculated using the formula ${\rho _i} = \sum\nolimits_{i \ne j} {{\omega _\rho }({r_{ij}})}$, where ωρ is defined as $15{(1 - {r_{ij}}/{r_d})^2}/2{\rm \pi} r_d^3$ with a cutoff distance of rd. According to the fluctuation–dissipation theorem, the dissipative and random force function is akin to a pairwise Brownian dashpot, and the coefficients can be expressed as σ 2 = 2γdkBT, where kB represents the Boltzmann constant, T is the temperature of the system, γd and σ are the coefficients for dissipative and random forces, respectively. When γd is given, σ can be calculated by the expression. In (2.3) and (2.4), the weight functions ωD and ωR, which are dependent on the distance r, are computed by ωD(rij) = ωR(rij)2 = (1 − rij/rc)2. The variable ξij is a Gaussian random number with zero mean and unit variance, and Δt denotes the time step used in the simulations.

The MDPD method, with its local-density-dependent soft repulsion, has been proven to successfully create a stable liquid–vapour interface (Ghoufi, Malfreyt & Tildesley Reference Ghoufi, Malfreyt and Tildesley2016). Additionally, the dynamics of bulk liquids have been validated through the Navier–Stokes (NS) equations (Arienti et al. Reference Arienti, Pan, Li and Karniadakis2011), bolstering confidence in the MDPD method's ability to simulate droplet behaviour accurately. Beyond the droplet, the interaction between solid and liquid is also critical. The MDPD method's soft potential is recognised as the reason for enabling the simulation of a more extensive system compared with MD simulations (Murtola et al. Reference Murtola, Bunker, Vattulainen, Deserno and Karttunen2009); however, this approach can lead to a challenge: when the density of solid is low, non-physical penetration by the liquid may occur. A high-density solid is employed in the present simulations to avoid non-physical penetration of liquid. Recent studies also proposed various methods to prevent non-physical penetration, such as modifying the solid–liquid potentials (Li et al. Reference Li, Bian, Tang and Karniadakis2018) and employing artificial bounce-back schemes (Li et al. Reference Li, Hu, Wang, Ma and Zhou2013). Nevertheless, these treatments tend to create a no-slip surface condition, contradicting the observed slip effect at small scales (Arienti et al. Reference Arienti, Pan, Li and Karniadakis2011). Hence, this study does not apply these methods.

The final challenge is establishing a correlation between MDPD-simulated liquids and their experimental counterparts. The MDPD method, being a coarse-grained approach, does not focus on specific liquids but on general interactions, as represented in (2.2)–(2.4). Consequently, while MDPD simulations accurately represent the general dynamics of liquids (Yamada, Yuan & Sunden Reference Yamada, Yuan and Sunden2015), this generality poses difficulties in directly mapping an MDPD-simulated liquid to an experimental liquid. Fortunately, a significant advancement was made by Jamali et al. (Reference Jamali, Boromand, Khani, Wagner, Yamanoi and Maia2015), who introduced a generalised equation of state for MDPD liquids. This equation enables the calculation of dimensionless compressibility, effectively bridging the gap between a simulated MDPD liquid and an experimental one. Based on this work, the simulation parameters are carefully chosen and set, as shown in table 1, to ensure that the dimensionless compressibility of the MDPD-simulated liquid aligns with that of water. The values of γd, rc and rd do not alter for different pairs of interactions in our simulations. Because the solid particles are fixed to their positions, the parameters of As -s and Bs -s are not included in this table. The interactions of nitrogen particles (n-n) and between nitrogen and other particles (n-w and n-s) are described in see supplementary material and table S1 available at https://doi.org/10.1017/jfm.2024.911. According to our tests, the density ratio of vapour to liquid in MDPD simulations is approximately 2.9 × 10−5 when phase equilibrium between liquid and vapour is achieved. This density ratio closely matches the experimental value of 2.5 × 10−5 for water, indicating that the MDPD liquid can be mapped to water in experiments. Additionally, the density ratio of nitrogen gas to liquid in the MDPD simulation is 1.1 × 10−3, aligning with that of a water droplet in a nitrogen environment at 100 kPa in experiments. Agreement on these properties facilitates a more accurate and meaningful comparison between simulations and experiments.

Table 1. The parameters of MDPD simulations.

Once the MDPD-simulated liquid is mapped to an experimental one, the relationship between the actual physical units and the DPD units can be determined using the following formulae: lreal = [L] × lDPD for length, mreal = [M] × mDPD for mass and treal = [T] × tDPD for time. The quantities in square brackets indicate the scaling relationships between the actual and DPD units. Using the parameters in table 1, the density, surface tension and viscosity of the MDPD liquid are calculated as ρDPD = 6.23, γDPD = 4 and $\mu^{DPD}=4.78$. In comparison, the properties of water at 300 K in experiments are as follows: ρ = 996 kg m3, γ = 72 mN m−1 and μ = 854 μPa s. By aligning these physical properties, the scaling relationships are determined to be [L] = 1.15 × 10−8 m, [M] = 2.43 × 10−22 kg and [T] = 1.16 × 10−10 s. The diameter of droplets with a DPD diameter of 20 is 230 nm in the actual physical units.

The parameter Aw -s is not included in table 1 because it is an adjustable parameter to generate a range of surface wettability. For each value of Aw -s, a droplet is gently placed on the surface, allowing it to spread and then reach an equilibrium state spontaneously. Subsequently, the intrinsic contact angle at this Aw -s is determined by fitting the outer contour of the droplet and measuring the angle at the three-phase contact line. Table 2 lists the contact angles used in this work and their corresponding values of Aw -s.

Table 2. Relationships between contact angles and the values of $A_{w\text{-}s}$.

The implementation of simulation comprises two processes. The first is the equilibrium process, during which the centre of mass of the droplet is held fixed while the system undergoes relaxation over 200 000 time steps. Once the equilibrium process is completed, the simulation transitions into the impact process. In this process, the control of the droplet is released. Concurrently, the droplet is given with a velocity directed towards the substrate, leading to a variety of outcomes based on impact conditions.

The rarefaction and compressibility effects are discussed at the end of this section. Recent advancements in small-scale ink-jet printing technology have revealed that ink droplets can attain high impact velocities of the order of 100 m s−1 (Galliker et al. Reference Galliker, Schneider, Eghlidi, Kress, Sandoghdar and Poulikakos2012). Similarly, this study also explores a broad velocity range from 25 to 600 m s−1, creating a wide range of We spanning three orders of magnitude. This wide range suggests that the compressibility effect might be significant. The Mach number (Ma = V 0/Vsound, where Vsound represents the speed of sound) is often used to quantify the compressibility effect. Considering that our simulation system is filled with nitrogen like an atmospheric environment, Vsound is approximately equal to 340 m s−1, so Ma ranges from 0.07 to 1.76. For Ma > 1.2, the droplet falls in a supersonic regime, indicating a possible strong compressibility effect. However, neither the experiments by Galliker et al. (Reference Galliker, Schneider, Eghlidi, Kress, Sandoghdar and Poulikakos2012) nor simulations from previous studies at the nanoscale (Li et al. Reference Li, Li and Chen2017; Wang et al. Reference Wang, Wang, Wang, Zhang, Yang, Lee, Wang and Chen2021b) report significant compressibility effects. This occurrence can be attributable to the rarefaction effect that counteracts the compressibility effect. The Knudsen number (Kn = L/D 0, where L is the mean free path of gas molecules) signifies the strength of rarefaction effects. Based on the kinetic theory of gases, L is computed as kBT/(21/2${\rm \pi}$d 2p) and is 64.5 nm, where the molecular diameter d is 0.38 nm for nitrogen and gas pressure p is 100 kPa. As a result, Kn is obtained as 0.28. This Kn value indicates that the gas environment is in the transitional flow regime, where rarefaction effects are pronounced (Gad-el-Hak Reference Gad-El-Hak1999).

In the context of a moving solid particle within a gas environment, several studies (Zarin Reference Zarin1970; Loth Reference Loth2008) have specifically examined the drag experienced by the particle across various gas environments and a broad spectrum of relative velocities between particles and gas environments. The particle Reynolds number, defined as $Re_{p}=\rho_{g}D_0V_0/\mu_{g}=({\rm \pi}\gamma_{h}/2)^{1/2}Ma/Kn$, where γh is the specific heat ratio, ρg is the gas density and $\mu_{g}$ is the gas viscosity, is used to evaluate the relative strengths of compressibility and rarefaction effects. With the help of experimental data and direct simulation Monte Carlo method results, Zarin (Reference Zarin1970) and Loth (Reference Loth2008) reported a nexus point of compressibility and rarefaction effects at a specific particle Reynolds number of Rep = 45. At Rep = 45, regardless of the values of Ma and Kn, the drag of a spherical particle remains constant. Furthermore, when Rep < 45, Ma is relatively small compared with Kn, so the rarefaction effect is dominant, thereby supporting the incompressibility of the gas. This is confirmed by the agreement between the drag data for Rep < 45 and the drag predicted by the incompressible theories by Loth (Reference Loth2008). Therefore, Rep < 45 can be a criterion indicating that compressibility effects will not take place and the gas still satisfies the incompressible assumption.

This criterion is applicable to droplet impacts because of the following reasons. The impact of droplets can be divided into two processes: the preimpact flight process and the impact process itself. In the preimpact flight process, droplets do not undergo significant deformation, remaining spherical throughout, which validates the applicability of the Rep < 45 criterion for determining no compressibility effect. In the impact process, although strong deformation of the droplet occurs, suggesting that the criterion might not be directly applicable, the rapid deceleration reduces the velocity of droplets below the threshold that could induce compressibility effects. Based on this reason, if compressibility effects do not occur during the flight process, they would not take place in the entire impact process either. Thus, the Rep < 45 criterion is considered effective for determining the absence of compressibility effects in droplet impacts and for confirming the incompressibility of the gas. The following aspect interprets the underlying mechanism of the rarefaction effect counteracting the compressibility effect (Loth et al. Reference Loth, Tyler Daspit, Jeong, Nagata and Nonomura2021). The compressibility effect tends to increase the pressure on the fore side of the particle, thereby increasing drag; however, the rarefaction effect can induce the velocity gradient on the surface, i.e. slip, therefore decreasing drag (Loth et al. Reference Loth, Tyler Daspit, Jeong, Nagata and Nonomura2021). Therefore, when the rarefaction effect is dominant, the possible compressibility effect can be effectively counteracted and make the gas still satisfy the incompressible assumption. In the nitrogen gas environment at 100 kPa, simulated in this work, with ρg = 1.14 kg m−3 and ${\mu_{g}=17.8}$ μPa s, even at the maximum velocity V 0 = 600 m s−1 in our study, Rep is only 8.9, considerably below the threshold of 45. Consequently, this confirms the dominance of the rarefaction effect and the gas is incompressible in our simulations.

3. Results and discussion

3.1. Evidence of the existence of scale effects

This section uses βmax as the key parameter to demonstrate the presence of scale-dependent viscous dissipation mechanisms. An established understanding is that spreading droplets on smooth surfaces is governed by dimensionless groups, including We, Oh and θ. According to this concept, if scale effects are absent and the values of all dominant dimensionless groups remain constant, βmax should be identical at all scales. Therefore, scale effects are tested by directly comparing βmax values at different scales while maintaining the same We, Oh and θ.

In MDPD simulations, the value of Oh is 0.21 for MDPD droplets with D 0 = 20 (DPD units). To maintain a consistent Oh of 0.21, the high-viscosity liquid (glycerol–water mixtures with 85 % glycerol concentration) at the macroscale and the extremely low-viscosity liquid (mW liquid, with a viscosity of just one-third that of water) at the nanoscale are chosen. Additionally, the surface wettability is also fixed at approximately 164°. Figure 2 shows the βmax versus We curves at different scales, with the macroscale data from the experimental study by Abolghasemibizaki et al. (Reference Abolghasemibizaki, Dilmaghani, Mohammadi and Castano2019) and the nanoscale data from this work using MD simulations (detailed method refer to Wang et al. (Reference Wang, Wang, He, Zhang, Yang, Wang and Lee2022b)). As We < 30, the maximum spreading factors at different scales show negligible divergence. However, as We exceeds 30, deviation among the βmax values at different scales grows with increasing We, contradicting the traditional scale-independent behaviour. Consequently, this disparity confirms the presence of scale effects between different scales.

Figure 2. Comparison of βmax for impacting droplets at the macroscale (Abolghasemibizaki et al. Reference Abolghasemibizaki, Dilmaghani, Mohammadi and Castano2019), the microscale and the nanoscale on superhydrophobic surfaces with θ = 163°, 164° and 165°, respectively.

3.2. Understanding viscous dissipation mechanisms at different scales

This section focuses on analysing the velocity contours of impacting droplets to decipher the viscous dissipation mechanism at the microscale. With an understanding at the microscale, the viscous dissipation mechanisms of the macroscale and the nanoscale could be revisited, and the whole picture of the viscous dissipation mechanism can be unveiled.

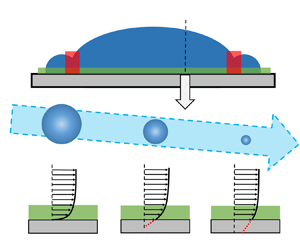
The velocity contours for an impacting droplet with a diameter of 230 nm on a surface with θ = 147° at We = 235.6 is shown in figure 3(ac). The left-hand sides of the figures illustrate the contours of Vz, while the right-hand sides display those of Vr. The velocity profile near the solid wall at r = 7.3 in figure 3(a) is also highlighted in figure 3(d) to exhibit near-wall velocity gradients. A few observations are noticeable. First, the velocity gradients in the region highlighted by the blue square resemble those in the boundary layer seen in macroscale scenarios, i.e. dVr/dz is dominant. The difference is that the velocity at the liquid–solid interface is non-zero at the microscale against the validity of the no-slip boundary condition. This occurrence results in a weaker boundary-layer viscous dissipation than at the macroscale. Second, the spreading rims still occur during spreading, and Vr peaks at the entrance of spreading rims, as shown in the region marked by the green square in figure 3(ac). When entering the rims, Vr rapidly decreases, offering a substantial gradient of dVr/dr, indicative of rim geometric head loss. Third, within the bulk droplet, the velocity gradients are also violent but differ markedly from those in the boundary layer. Unlike dVr/dz observed in the boundary layer, dVr/dr and dVz/dz dominate the bulk droplet. Such a feature of velocity distribution is named extensional flow, whose viscous dissipation is mainly attributable to the deformation of droplets. Consequently, the viscous dissipation mechanism at the microscale is governed by three types of viscous dissipation: boundary-layer viscous dissipation due to shear flow near solid surfaces (Edis ,boundary); rim head loss at the entrance of spreading rims (Edis ,rim); and bulk viscous dissipation caused by extensional flow from droplet deformation (Edis ,bulk). This mechanism has also been further corroborated by additional observations from MDPD simulations in broad ranges of We and θ at the microscale.

Figure 3. (ac) Velocity contours of microscale droplets impacting surfaces with θ = 147° at We = 235.6. (df) Velocity profiles near solid walls at the microscale, the macroscale and the nanoscale, respectively.

Previous studies have examined the viscous dissipation mechanisms at both the macroscale and nanoscale. However, due to the distinct characteristics of velocity gradients at these scales, they have traditionally been considered opposites (Li et al. Reference Li, Zhang and Chen2015; Wang et al. Reference Wang, Wang, Gao, Yang, Wang and Chen2020a). In this study, the viscous dissipation mechanism at the microscale has been uncovered, offering a valuable link that bridges the gap between the two extreme scales. This discovery presents a unique opportunity to explore how the viscous dissipation mechanism transitions from the macroscale to the nanoscale. To this end, the viscous dissipation mechanisms at the macroscale and the nanoscale are revisited below.

At the macroscale, only two types of dissipation, Edis ,boundary and Edis ,rim, have been reported (Wildeman et al. Reference Wildeman, Visser, Sun and Lohse2016), while Edis ,bulk is negligible, to our best knowledge. The no-slip condition is applicable to the boundary layer, as shown in figure 3(e). The model incorporating only Edis ,boundary and Edis ,rim accurately predicts βmax for low Oh droplets at the macroscale; however, the model would overestimate βmax for high Oh, with more pronounced overestimation on βmax with increasing Oh (Wildeman et al. Reference Wildeman, Visser, Sun and Lohse2016). This observation suggests that deformation-induced Edis ,bulk is significant at high Oh. In fact, the droplet-deformation-induced dissipation commonly participates in the natural and industrial processes. For instance, the freely decaying oscillations of levitated droplets serve as evidence of this mechanism. In such processes, both Edis ,boundary and Edis ,rim are absent due to the lack of solid surfaces and rim formation, leaving only deformation-induced Edis ,bulk as the dominating dissipation mechanism. Furthermore, as Oh increases, the damping of oscillations in levitated droplets is significantly enhanced (Kremer, Kilzer & Petermann Reference Kremer, Kilzer and Petermann2018), supporting the strong positive correlation between Edis ,bulk and Oh. Therefore, all three types of viscous dissipation coexist for the impact of macroscale droplets.

At the nanoscale, a consensus has emerged in recent studies acknowledging that velocity gradients are notably intense throughout entire nanodroplets, and that the viscous dissipation caused by spreading rims is relatively insignificant (Li et al. Reference Li, Zhang and Chen2015, Reference Li, Li and Chen2017). Given the minimal scale of nanodroplets, some studies posited that impacting nanodroplets entirely fall in the boundary layer during impact (Li et al. Reference Li, Li and Chen2017; Wang et al. Reference Wang, Wang, Gao, Yang, Wang and Chen2020a), suggesting that boundary-layer dissipation is the primary mechanism (Li et al. Reference Li, Li and Chen2017; Wang et al. Reference Wang, Wang, Gao, Yang, Wang and Chen2020a). However, this viewpoint is worth discussing. The dominant velocity gradient within the boundary layer is typically dVr/dz. Contrary to this, velocity contours from Li et al. (Reference Li, Zhang and Chen2015) and Wang et al. (Reference Wang, Wang, Yang and Chen2019) indicate that gradients dVr/dr and dVz/dz are violent throughout nanodroplets, contradicting the expected velocity characteristics of the boundary layer. Secondly, as the droplet scale decreases, the slip effect continuously enhances, diminishing the strength of boundary-layer dissipation. The slip effect has been observed at the microscale, as illustrated in figure 3(ad), and it is more pronounced at the nanoscale, as figure 3(f) shows, suggesting a further weak influence of boundary-layer dissipation. Therefore, it is improbable that the boundary layer alone governs viscous dissipation at the nanoscale. The observed velocity gradients dVr/dr and dVz/dz align more closely with deformation-induced gradients in the bulk droplet, indicating that deformation-induced dissipation might be the predominant mechanism at the nanoscale. This occurrence can be attributed to the naturally high Oh at the nanoscale. Moreover, although previous studies have not focused on viscous dissipation due to rims at the nanoscale, Wang et al. (Reference Wang, Wang, Zhang, He, Yang, Zheng, Lee and Wang2023) showed that the rims do form during nanoscale impacts, particularly at high We. The formation of these rims likely results in a sharp reduction in radial velocity (Vr) at the entrance of rims, generating Edis ,rim. For the boundary-layer dissipation, although the slip effect is strongly enhanced and almost no boundary-layer gradients are present in velocity contours at the nanoscale, indicating an almost negligible intensity of Edis ,boundary compared with other dissipation, it still exists owing to the presence of the solid walls. Therefore, the three types of viscous dissipation (Edis ,boundary, Edis ,rim and Edis ,bulk) also contribute to the impact at the nanoscale as well.

According to the above discussion, a comprehensive understanding of the viscous dissipation mechanisms across different scales can be articulated. The decreased scale of droplets would increase Oh, highlighting the significance of Edis ,bulk at both the nanoscale and microscale. Moreover, Edis ,bulk would also become increasingly important as the viscosity of liquid increases. Therefore, to accommodate a broad range of Oh, Edis ,bulk must be considered throughout the whole scale. Additionally, the presence of walls, which generate shear flow, ensures that boundary-layer dissipation (Edis ,boundary) occurs at all scales. The critical difference is that the slip effect becomes progressively more pronounced as the droplet scale decreases, so the strength of Edis ,boundary continuously weakens. Lastly, spreading rims are a consistent observation in impacts across all scales when We is sufficiently high, approximately 30, as Wildeman et al. (Reference Wildeman, Visser, Sun and Lohse2016) noted. Thus, the rim geometric head loss, Edis ,rim, also plays a crucial role throughout the scale.

3.3. Modelling the maximum spreading factor throughout the whole scale

Revealing the viscous dissipation mechanism is crucial for comprehending the impact dynamics of droplets; however, directly testing it is exceptionally intractable. The maximum spreading factor serves as an extensively concerned feature parameter, and modelling this factor requires a profound understanding of viscous dissipation mechanism, making it a valuable bridge for inspecting this mechanism within the scientific community focused on droplet impact. This section will establish a model of βmax to thoroughly check the full-scale viscous dissipation mechanism thoroughly. Moreover, this model is also expected to predict a full spectrum of βmax, covering droplet scales from the macroscale to the nanoscale.

The model of βmax is established using the energy conservation equation, i.e. (1.1). Based on the spherical shape of a droplet before impacts, Ek ,0 and Es ,0 can be expressed as

(3.1)\begin{gather}{E_{k,0}} = {\textstyle{1 \over {12}}}{\rm \pi} \rho D_0^3V_0^2,\end{gather}
(3.2)\begin{gather}{E_{s,0}} = \gamma {\rm \pi}D_0^2.\end{gather}

Assuming the cylindrical shape of the droplet at the maximum spreading state (Ukiwe & Kwok Reference Ukiwe and Kwok2005), the surface energy at this state could be obtained as

(3.3)\begin{equation}{E_{s,m}} = {\rm \pi}D_0^2\gamma \left[ {\frac{1}{4}\beta_{max}^2(1 - \textrm{cos}\,\theta ) + \frac{2}{{3{\beta_{max}}}}} \right],\end{equation}

where the first term, ${\rm \pi} D_0^2\gamma {\beta _{max}}^{2}(1 - \textrm{cos}\,\theta )/4$, represents the surface energy of the upper and lower surfaces of spreading films, and the second term, $2{\rm \pi} D_0^2\gamma /(3{\beta _{max}})$, stands for the surface energy of the periphery surface of spreading films. These terms are named Es ,m1 and Es ,m2, respectively, for discussion later.

The viscous dissipation during spreading is contributed by three terms, i.e. Edis ,boundary, Edis ,bulk and Edis ,rim. As a result, the viscous dissipation during spreading can be expressed as

(3.4)\begin{equation}{E_{dis}} = {E_{dis,boundary}} + {E_{dis,bulk}} + {E_{dis,rim}}.\end{equation}

The expressions of Edis ,boundary and Edis ,bulk can be obtained by the integration of the dissipation functions of the shear flow (ϕs) and the extensional flow (ϕe), respectively, expressed as

(3.5)\begin{gather}{E_{dis,boundary}} = \int_0^{{t_{sp}}} {\int_{{\varOmega _{boundary}}} {{\phi _s}\,\textrm{d}\varOmega \,\textrm{d}t} } ,\end{gather}
(3.6)\begin{gather}{E_{dis,bulk}} = \int_0^{{t_{sp}}} {\int_{{\varOmega _{bulk}}} {{\phi _e}\,\textrm{d}\varOmega \,\textrm{d}t} } ,\end{gather}

where $\varOmega_{bulk}$ is the volume occupied by the extensional flow, which approximates the volume of an entire droplet, and ${\varOmega _{boundary}}\sim D_{max}^2\delta$ is the volume of the boundary layer. The general dissipation function is

(3.7)\begin{equation}\phi = \mu \left( {\frac{{\partial {v_i}}}{{\partial {x_j}}} + \frac{{\partial {v_j}}}{{\partial {x_i}}}} \right)\frac{{\partial {v_i}}}{{\partial {x_j}}}.\end{equation}

Considering Vθ = 0, (3.7) can be simplified to

(3.8)\begin{equation}\phi = 2\mu \left[ {{{\left( {\frac{{\partial {V_r}}}{{\partial r}}} \right)}^2} + {{\left( {\frac{{{V_r}}}{r}} \right)}^2} + {{\left( {\frac{{\partial {V_z}}}{{\partial z}}} \right)}^2} + \frac{1}{2}{{\left( {\frac{{\partial {V_r}}}{{\partial z}} + \frac{{\partial {V_z}}}{{\partial r}}} \right)}^2}} \right].\end{equation}

At the macroscale, the no-slip condition holds so that ϕs can be simplified to ∼μ(V 0/δ)2, as recognised by previous studies (Pasandideh-Fard et al. Reference Pasandideh-Fard, Qiao, Chandra and Mostaghimi1996; Ukiwe & Kwok Reference Ukiwe and Kwok2005; Wildeman et al. Reference Wildeman, Visser, Sun and Lohse2016). However, when the droplet diameter decreases from the macroscale to the nanoscale, the slip effect takes place and is continuously enhanced. To obtain the whole-scale expression of Edis ,boundary, according to figure 3(d), the slip effect is incorporated to revise the ϕs to

(3.9) \begin{equation}{\phi _s}\sim \mu {\left( {\frac{{{V_0}}}{{\delta + \lambda }}} \right)^2} = {\left( {\frac{1}{{1 + \dfrac{\lambda }{\delta }}}} \right)^2} \times \mu {\left( {\frac{{{V_0}}}{\delta }} \right)^2} = {C_{slip}}\mu {\left( {\frac{{{V_0}}}{\delta }} \right)^2},\end{equation}

where λ is the average slip length, and Cslip is the slip factor to describe the slip effect with its value ranging from 0 (λ → ∞, free-slip) to 1 (λ = 0, no-slip). Integrating (3.5), the expression of boundary-layer dissipation is

(3.10)\begin{equation}{E_{dis,boundary}}\sim {C_{slip}}\mu {\left( {\frac{{{V_0}}}{\delta }} \right)^2}(\beta _{max}^2D_0^2\delta ){t_{sp}}.\end{equation}

According to Wildeman et al. (Reference Wildeman, Visser, Sun and Lohse2016), tsp = (D 0/V 0)(βmax − 1). This expression has been validated by impacts on both free-slip and no-slip surfaces, so it is expected to be universal throughout the scale. The thickness of the boundary layer is estimated by δ/D 0 ∼ [tsp/(Re D 0/V 0)]1/2 (Eggers et al. Reference Eggers, Fontelos, Josserand and Zaleski2010; Wildeman et al. Reference Wildeman, Visser, Sun and Lohse2016). Substituting them in (3.10), the whole-scale expression of Edis ,boundary is obtained as

(3.11)\begin{equation}{E_{dis,boundary}} = 0.6{C_{slip}}\frac{{\beta _{max}^2{{({\beta _{max}} - 1)}^{1/2}}}}{{R{e^{1/2}}}}{E_{k,0}},\end{equation}

where the prefactor of 0.6 is determined by Wildeman et al. (Reference Wildeman, Visser, Sun and Lohse2016) by data at the macroscale.

The velocity distribution in the bulk droplet meets the extensional flow, expressed as (Wang et al. Reference Wang, Wang, Xie, Liu, Wang, Yang, Gao and Wang2020b, Reference Wang, Wang, Cai, Ma, Yang, Zheng, Lee and Wang2024)

(3.12)\begin{equation}\left. {\begin{array}{*{20}{c@{}}} {{V_r} = \dfrac{r}{R}{V_{bulk}},}\\ {{V_z} =- \dfrac{{2z}}{R}{V_{bulk}},} \end{array}} \right\}\end{equation}

where Vbulk is an equivalent velocity characterising the strength of extensional flow. Substituting (3.12) in (3.8), the dissipation function for the extensional flow is obtained as

(3.13)\begin{equation}{\phi _e} = 48\mu \frac{{V_{bulk}^2}}{{{\beta ^2}D_0^2}}.\end{equation}

Subsequently, substituting (3.13) in (3.6) and integrating (3.6) with respect to space, the bulk dissipation is transformed into

(3.14)\begin{equation}{E_{dis,bulk}} = 8{\rm \pi} \mu {D_0}V_{bulk}^2\int_0^{{t_{sp}}} {\frac{1}{{{\beta ^2}(t)}}\,\textrm{d}t} .\end{equation}

To ensure consistent estimations of Edis ,boundary and Edis ,bulk, tsp for calculating Edis ,bulk is also tsp = (βmax − 1)D 0/V 0. Here, the integration of time can be replaced by the integration of spreading factor, i.e. dt = (D 0/V 0) dβ, expressed as

(3.15)\begin{equation}{E_{dis,bulk}} = 8{\rm \pi} \mu D_0^2C_{bulk}^2{V_0}\int_1^{{\beta _{max}}} {\frac{1}{{{\beta ^2}}}\,\textrm{d}\beta } = 8{\rm \pi} \mu D_0^2C_{bulk}^2{V_0}\left( {1 - \frac{1}{{{\beta_{max}}}}} \right),\end{equation}

where Cbulk = Vbulk/V 0.

For the rim dissipation, Wildeman et al. (Reference Wildeman, Visser, Sun and Lohse2016) found that it almost always consumes half of the initial kinetic energy when We > 30, expressed as

(3.16)\begin{equation}{E_{dis,rim}} = 0.5{E_{k,0}}.\end{equation}

This expression has been verified for impacting droplets on both free-slip and no-slip surfaces, so it is expected to be valid throughout the whole scale.

Substituting (3.1)–(3.3), (3.11), (3.15) and (3.16) in (1.1) and normalised by the initial surface energy, the model of βmax is finally obtained, expressed as

(3.17) \begin{align} \dfrac{1}{{12}}We + 1 & = \left[ {\dfrac{1}{4}\beta_{max}^2(1 - \textrm{cos}\,\theta ) + \dfrac{2}{{3{\beta_{max}}}}} \right] + \dfrac{1}{{20}}{C_{slip}}W{e^{3/4}}O{h^{1/2}}\beta _{max}^2{({\beta _{max}} - 1)^{1/2}}\notag\\ & \quad + 8C_{bulk}^2W{e^{1/2}}Oh\left( {1 - \dfrac{1}{{{\beta_{max}}}}} \right) + \dfrac{1}{{24}}We. \end{align}

On the left-hand side of this equation, the first and second terms stand for the initial kinetic energy and initial surface energy, respectively; on the right-hand side, the four terms represent the surface energy at the maximum spreading state, boundary-layer dissipation, bulk dissipation and rim dissipation, respectively.

Here, an analysis is presented to demonstrate how the proposed model can effectively predict the dynamics of impacting droplets across various scales, taking water, a representative low-viscosity liquid, as an example. Water droplets exhibit an extremely low Ohnesorge number at the macroscale, approximately O(10−3). Consequently, Edis ,bulk, which is proportional to Oh, becomes negligible compared with Edis ,boundary, which is proportional to Oh 1/2. However, as droplet diameter decreases, reaching the microscale or the nanoscale, the value of Oh for water droplets approaches O(1). This shift results in the values of Oh and Oh 1/2 becoming comparable, making Edis ,bulk and Edis ,boundary similarly significant. This observation elucidates why, as the diameter of low-viscosity droplets reduces from the macroscale to the nanoscale, viscous dissipation becomes increasingly essential, extending from the boundary layer to the entire droplet. Furthermore, this model accounts for the change in boundary-layer dissipation across scales. As droplet diameters decrease from the macroscale to the nanoscale, Cslip decreases due to increased slip length. This change leads to a spontaneous reduction in boundary-layer dissipation. This trend is observable in figure 2, where βmax increases with decreasing scale when We, Oh and θ are held constant. Thus, the model provides a comprehensive perspective on how the dynamics of impacting droplets evolves with scales.

The proposed model has two independent parameters, Cbulk and Cslip, which govern the strength of Edis ,bulk and Edis ,boundary, respectively. Given their independence, these parameters cannot be determined simultaneously by data fitting. Here, Cbulk, associated with the dissipation caused by droplet deformation, is expected to remain constant across all scales. Conversely, Cslip is influenced by the slip effect and thus varies depending on the scale of droplets. Specifically, Cslip approaches zero at the nanoscale and equals one at the macroscale. To determine these parameters, Cbulk should be first established by fitting data from either the nanoscale (Cslip = 0) or macroscale (Cslip = 1). Once Cbulk is determined, Cslip can be treated as an independent parameter.

This study has collected 16 series of data, including a diverse range of scales: five series at the macroscale from experiments (Series 1–5) (Stow & Hadfield Reference Stow and Hadfield1981; Clanet et al. Reference Clanet, Béguin, Richard and Quéré2004; Antonini, Amirfazli & Marengo Reference Antonini, Amirfazli and Marengo2012; Abolghasemibizaki et al. Reference Abolghasemibizaki, Dilmaghani, Mohammadi and Castano2019; Du, Zhang & Min Reference Du, Zhang and Min2021b); seven series at the microscale from our MDPD simulations (Series 6–12); and four series at the nanoscale from MD simulations (Series 13–16) (Wang et al. Reference Wang, Wang, Gao, Yang, Wang and Chen2020a; Reference Wang, Wang, He, Zhang, Yang, Wang and Lee2022b; Zhang et al. Reference Zhang, Farokhirad, Lee and Koplik2014). Detailed information about these data series (Series 1–16) is available in supplementary material (table S2). In parameter determination, only one series of data from each scale is utilised to obtain Cbulk and Cslip. In contrast, the remaining data series are employed to validate the robustness and applicability of the proposed model.

Based on the above analysis, one series of nanoscale data (Series 14) is first employed to determine Cbulk by setting Cslip to 0. Subsequently, one series of macroscale data (Series 4) is used to validate the universality of the obtained Cbulk, fixing Cslip at 1. As figure 4(a) illustrates, with Cbulk = 0.4 and Cslip = 0, the proposed model successfully predicts βmax at the nanoscale. To convince us that Cbulk = 0.4 reasonably describes the velocity fields of impacting droplets, the velocity fields captured by simulations for the cases at We = 30.6, 45.7 and 73.9 in data Series 14 are used to validate it directly. Satisfactory agreement between the fitted Cbulk and the values of Cbulk by measuring the velocity fields is found (see supplementary material for details), directly proving this fitted result, Cbulk = 0.4. It is important to note that the significance of Edis ,bulk is only pronounced for high Oh at the macroscale. Therefore, for the macroscale validation, βmax data of high-viscosity droplets (Series 4) from Du et al. (Reference Du, Zhang and Min2021b) are chosen. As depicted in figure 4(b), the proposed model, with Cbulk = 0.4 and Cslip = 1, also aligns satisfactorily with the βmax data at the macroscale. This occurrence effectively demonstrates that Cbulk remains constant across the scales. Furthermore, the model proposed by Wildeman et al. (Reference Wildeman, Visser, Sun and Lohse2016) is also included for comparison in figure 4(b). For droplets with high Oh at the macroscale, our model, which accounts for deformation-induced bulk dissipation, exhibits significantly improved accuracy. This comparison preliminarily validates the effectiveness and accuracy of our proposed model in capturing the dynamics of droplet impacts across various scales.

Figure 4. (a,b) Fitting Cbulk by the data of impacting nanodroplets with Oh = 0.35 on superhydrophobic surfaces with θ = 148° (Wang et al. Reference Wang, Wang, He, Zhang, Yang, Wang and Lee2022b) and of impacting macroscale droplets with Oh = 0.56 on superhydrophobic surfaces with θ = 120° (Du, Zhang & Min Reference Du, Zhang and Min2021b). (c) Fitting Cslip by the data of impacting microscale droplets with Oh = 0.21 on hydrophobic surfaces with θ = 125°. (d) The relationship between Cslip and D 0 for water at We = 300 and θ = 125°.

Since Cslip varies with droplet scale, it cannot be straightforwardly determined through simple data fitting. In addition to the traditional dimensionless group (We, Re and θ) dominating the impact dynamics, the slip length also becomes a key parameter when considering dynamics across scales, which can be non-dimensionalised by D 0. Therefore, Cslip should be Cslip = fslip(We, Re, λ/D 0, θ). Considering the estimation of δ ∼ D 0[(βmax − 1)/(Re)]1/2 previously used in the derivation of (3.11), the key ratio, λ/δ, can be expressed as

(3.18)\begin{equation}\frac{\lambda }{\delta }\sim \frac{{\lambda \,R{e^{1/2}}}}{{{D_0}{{({\beta _{max}} - 1)}^{1/2}}}}.\end{equation}

Incorporating this scaling relationship into Cslip = (1 + λ/δ)−2, with a dimensionless prefactor c, yields Cslip as

(3.19)\begin{equation}{C_{slip}} = {\left( {1 + \frac{{c\lambda \,R{e^{1/2}}}}{{{D_0}{{({\beta_{max}} - 1)}^{1/2}}}}} \right)^{ - 2}}.\end{equation}

The parameters, Re and λ/D 0, are explicitly considered; while the dependence of We and θ is implicitly included in βmax. Here, λ is a material property, depending on the liquid involved and the substrate. In MDPD simulations, the liquid is fixed and only the contact angle is altered for the substrate. According to McBride & Law (Reference McBride and Law2009), λ is not sensitive to the wettability of molecularly smooth hydrophobic surfaces. Therefore, λ = 4.6 nm measured from MDPD simulations, as shown in figure 3(d), is available for all MDPD cases in this study. When other liquids are considered or the property of substrates changes significantly, λ should be remeasured to obtain the correct one corresponding to the impact condition.

The dimensionless prefactor, c, is determined by fitting MDPD data. As shown in figure 4(c), for MDPD data of 230 nm water droplets (Series 8), fixing λ = 4.6 nm and using c = 4, the proposed model can align well with the data. Figure 4(d) shows the relationship between Cslip and D 0 at fixed We = 300, θ = 125° and λ = 4.6 nm for water. It is worth restating that the current literature has shown that Cslip = 0 for D 0 < 10 nm (Li et al. Reference Li, Zhang and Chen2015; Wang et al. Reference Wang, Wang, Xie, Liu, Wang, Yang, Gao and Wang2020b; Xie et al. Reference Xie, Lv, Yang and Wang2020) and Cslip = 1 for D 0 > 40 μm (Wildeman et al. Reference Wildeman, Visser, Sun and Lohse2016). The predicted relationship of Cslip intriguingly approaches zero at the nanoscale and one at the macroscale, preliminarily validating the expression of Cslip.

3.4. Validation of the βmax model

In this section, the established model of βmax will be validated by data from the macroscale (Series 1–3 and 5), microscale (Series 6, 7 and 9–12) and nanoscale (Series 13, 15 and 16). For microscale data, Cslip is calculated by λ = 4.6 nm as mentioned above. Nonetheless, the lack of λ for macroscale and nanoscale data is an obstacle to validating the model. Fortunately, the orders of magnitude for D 0 are O(1 mm) at the macroscale and O(10 nm) at the nanoscale; therefore, Cslip = 1 and Cslip = 0 are reasonably used for respective scale data according to the literature (Li et al. Reference Li, Zhang and Chen2015; Wildeman et al. Reference Wildeman, Visser, Sun and Lohse2016; Wang et al. Reference Wang, Wang, Xie, Liu, Wang, Yang, Gao and Wang2020b; Xie et al. Reference Xie, Lv, Yang and Wang2020). In addition, the widely recognised model of βmax (Wildeman et al. Reference Wildeman, Visser, Sun and Lohse2016) that considers two kinds of viscous dissipation (Edis ,boundary and Edis ,rim) has been examined at the macroscale and is also tested by these series of data to present how the added or modified energy terms in the proposed model affect the prediction results.

Here, the two models are tested first by four series of data at the macroscale, as shown in figure 5(a), with Series 1, millimetre-sized water droplets (Oh = 0.002) impacting superhydrophobic surfaces (Antonini et al. Reference Antonini, Amirfazli and Marengo2012); Series 2, millimetre-sized water droplets (Oh = 0.003) impacting weakly hydrophobic surfaces (Stow & Hadfield Reference Stow and Hadfield1981); Series 3, millimetre-sized glycerol−water droplets (Oh = 0.21) impacting superhydrophobic surfaces (Abolghasemibizaki et al. Reference Abolghasemibizaki, Dilmaghani, Mohammadi and Castano2019); Series 5, millimetre-sized silicone oil droplets (Oh = 1.05) (Clanet et al. Reference Clanet, Béguin, Richard and Quéré2004) impacting weakly hydrophobic surfaces. Based on these data series, extensive parametric ranges are covered, i.e. 8 ≤ We ≤ 6815, 0.002 ≤ Oh ≤ 1.05, 90° ≤ θ ≤ 163°.

Figure 5. (a) Validating the proposed model and the model of Wildeman et al. (Reference Wildeman, Visser, Sun and Lohse2016) by macroscale data of βmax in wide ranges of We from 8 to 6815, Oh from 0.002 to 1.05 and θ from 90° to 163°. The data are marked by blue (Antonini, Amirfazli & Marengo Reference Antonini, Amirfazli and Marengo2012), green (Stow & Hadfield Reference Stow and Hadfield1981), red (Abolghasemibizaki et al. Reference Abolghasemibizaki, Dilmaghani, Mohammadi and Castano2019) and orange (Clanet et al. Reference Clanet, Béguin, Richard and Quéré2004) points, respectively. (b) The proportion of the surface energy of the periphery surface (Es ,m2) to the one of the upper and lower surfaces (Es ,m1) and (c) the proportion of the bulk dissipation (Edis ,bulk) to the boundary-layer one (Edis ,boundary).

For low-viscosity droplets (Series 1–2), both the proposed model and the model by Wildeman et al. (Reference Wildeman, Visser, Sun and Lohse2016) demonstrate equally high prediction accuracy when We exceeds 100. This similarity in accuracy is attributed to the fact that the added energy terms in the current model (Edis ,bulk and Es ,m2) are relatively insignificant compared with the existing terms (Edis ,boundary and Es ,m1). This inference is supported by the energy proportions (Edis ,bulk/Edis ,boundary and Es ,m2/Es ,m1) extracted from the present model, as depicted in figure 5(b,c). However, as We drops below 100, the dynamics accordingly changes: the spreading film at the maximum spreading state becomes thicker, and the maximum spreading factor (βmax) is reduced. Consequently, Es ,m2 becomes a non-negligible factor compared with Es ,m1. In this lower We range, the present model, which includes Es ,m2, delivers a more accurate prediction of βmax than the model of Wildeman et al. (Reference Wildeman, Visser, Sun and Lohse2016). This enhanced accuracy in lower We scenarios underscores the importance of incorporating comprehensive energy terms to fully capture the dynamics of droplet spreading.

For high-viscosity droplets (Series 3), both the present model and the model by Wildeman et al. (Reference Wildeman, Visser, Sun and Lohse2016) struggle to align with the data when We < 30. The current model tends to underestimate βmax in this range, which can be attributed to the difficulty in forming spreading rims at these Weber numbers. This limitation is also evident in the model of Wildeman et al. (Reference Wildeman, Visser, Sun and Lohse2016); however, their model tends to overestimate βmax because it does not consider Edis ,bulk and Edis ,m2. As We exceeds 30, the present model, which considers all forms of viscous dissipation, aligns satisfactorily with the data in both Series 3 and 4. This comprehensive approach is particularly crucial for high-viscosity droplets at the macroscale, where the effect of Edis ,bulk becomes significant. This aspect of viscous dissipation is not included in the model by Wildeman et al., leading to their model showing a substantial overestimation of βmax in these scenarios. Therefore, including Edis ,bulk in the present model provides a more accurate representation of the spreading dynamics for high-viscosity droplets.

At the microscale, six data series (Series 6, 7 and 9–12) are employed to evaluate both the present model and the model by Wildeman et al. (Reference Wildeman, Visser, Sun and Lohse2016). The first five series encompass a wide range of We from 3 to 930 and θ from 86° to 174° for droplets with a diameter of D 0 = 230 nm. The last series covers We from 50 to 1000, with θ = 125° and D 0 = 1.15 μm. As depicted in figure 6(a,b), the model of Wildeman et al. (Reference Wildeman, Visser, Sun and Lohse2016) fails to predict the results in the first five series. For We < 90, it overestimates βmax due to the non-negligible contribution of Es ,m2 compared with Es ,m1 in this low We range. More importantly, their model does not account for the increasing importance of Edis ,bulk at the microscale, attributable to higher Oh due to reduced droplet scales. As We > 90, the model conversely underestimates βmax, indicating an overestimation of boundary-layer dissipation due to the slip effect as they fixed Cslip = 1. The present model, however, incorporates not only E dis, bulk and Es ,m2 but also across-scale boundary-layer dissipation. Figure 6(a,b) shows that the present model aligns satisfactorily with MDPD simulation results. Further analysis of Edis ,bulk/Edis ,boundary and Es ,m2/Es ,m1 extracted from the present model, as shown in figure 6(c,d), reveals that at low We, Es ,m2 and Edis ,bulk are more significant than Es ,m1 and Edis ,boundary. This observation supports the idea that the overestimation of the model of Wildeman et al. (Reference Wildeman, Visser, Sun and Lohse2016) is the lack of these terms at low Weber numbers. At high Weber numbers, Es ,m2 and Edis ,bulk become negligible, affirming the dominance of Es ,m1 and Edis ,boundary and verifying the underestimation of βmax by the model Wildeman et al. (Reference Wildeman, Visser, Sun and Lohse2016) due to overestimated no-slip boundary-layer dissipation. To further validate the proposed expression for Cslip and the present model, Series 12 with larger D 0 = 1.15 μm at θ = 125° is also included in the comparison, as shown in figure 6(e). As anticipated, the model shows satisfactory agreement with simulation data, underscoring the universality and reliability of the expression of Cslip.

Figure 6. (a) Validating the proposed model and the model of Wildeman et al. (Reference Wildeman, Visser, Sun and Lohse2016) by the MDPD data on (a) weak hydrophobic surfaces with θ from 100° to 109° and on (b) highly hydrophobic surfaces with θ from 138° to 174°. (c) The proportion of the surface energy of the periphery surface (Es ,m2) to the one of the upper and lower surfaces (Es ,m1) and (d) the proportion of the bulk dissipation (Edis ,bulk) to the boundary-layer one (Edis ,boundary). (e) Validating the models by a larger water droplet with D 0 = 1.15 μm at θ = 125°.

Eventually, the two models are tested by three series of nanoscale data, with Series 13, mW nanodroplets (Oh = 0.35) impacting hydrophobic surfaces (Wang et al. Reference Wang, Wang, Gao, Yang, Wang and Chen2020a,Reference Wang, Wang, He, Zhang, Yang, Wang and Leeb); Series 15, mW nanodroplets (Oh = 0.35) impacting superhydrophobic surfaces; Series 16, Ar nanodroplets (Oh = 0.48) impacting superhydrophobic surfaces (Zhang et al. Reference Zhang, Farokhirad, Lee and Koplik2014). These data series span a wide range of We, Oh and θ. The enhanced slip effect at the nanoscale significantly reduces the boundary-layer viscous dissipation, rendering it almost negligible. Additionally, the increased Oh at this scale makes Edis ,bulk more significant. Similar to observations at the microscale, the model Wildeman et al. (Reference Wildeman, Visser, Sun and Lohse2016) tends to overestimate βmax in the low We range but underestimates it in the high We range, as shown in figure 7(a). In contrast, the proposed model effectively accounts for these changes, accurately capturing the boundary-layer viscous dissipation at the nanoscale. As shown in figure 7(a), the proposed model successfully predicts the data across these nanoscale series. In addition, the energy proportion Es ,m2/Es ,m1 is extracted from the proposed model (figure 7b). This ratio reinforces the reasoning behind the inaccuracy of the model of Wildeman et al. (Reference Wildeman, Visser, Sun and Lohse2016) to predict βmax at the nanoscale, emphasising the importance of incorporating Edis ,bulk and including slip effect for Edis ,boundary to achieve accurate predictions in droplet impact dynamics.

Figure 7. (a) Validating the proposed model and the model of Wildeman et al. (Reference Wildeman, Visser, Sun and Lohse2016) by the data of βmax for impacting droplets at the nanoscale in wide ranges of We, Oh and θ from 1 to 290, from 0.35 to 0.48 and from 125° to 180°, respectively (Wang et al. Reference Wang, Wang, Gao, Yang, Wang and Chen2020a, Reference Wang, Wang, He, Zhang, Yang, Wang and Lee2022b; Zhang et al. Reference Zhang, Farokhirad, Lee and Koplik2014). (b) The proportion of the surface energy of the periphery surface (Es ,m2) to the one of the upper and lower surfaces (Es ,m1).

4. Caveats and future directions

This section comments on the three forms of viscous dissipation, including Edis ,bulk, Edis ,boundary and Edis ,rim, for an impacting droplet at different scales. The current analysis confirms that Edis ,bulk dominates across the scales, as supported by the extensive testing previously discussed. Similarly, Edis ,boundary is also essential throughout the whole scale. Regarding Edis ,rim, proposed as 0.5Ek ,0 by Wildeman et al. (Reference Wildeman, Visser, Sun and Lohse2016) and adopted in this study, it is only effective when We exceeds 30. Below this threshold, spreading rims are difficult to form, eliminating the corresponding geometric head loss. This criterion for Edis ,rim has been validated within the tested Oh range from 0.002 to 1.05. However, at a higher Oh of 1.54, no rim is observed even with We of 105, according to snapshots reported by Wang et al. (Reference Wang, Wang, Yang and Chen2019). Consequently, the proposed model significantly underestimates βmax over a wide We range from 15 to 105 when Edis ,rim is included (figure 8). Removing Edis ,rim from the model yields accurate predictions of βmax for droplets with extremely high Oh, proving the possible disappearance of Edis ,rim in these conditions. Therefore, future research should also explore the criterion for Edis ,rim about not only We but also Oh, especially for droplets with extremely large Oh.

Figure 8. Validating the proposed model by the MD data of βmax by viscous impacting nanodroplets at Oh = 1.54 (Wang et al. Reference Wang, Wang, Yang and Chen2019).

5. Conclusions

The impact dynamics of droplets at both the macroscale and the nanoscale have been extensively studied, revealing distinct behaviours at these extreme scales. Previous studies have attributed these differences to scale effects, suggesting that the droplet scale change dramatically alters the viscous dissipation mechanism. However, the underlying nature of how this mechanism evolves from the macroscale to the nanoscale has yet to be discovered. This study uses the MDPD simulation method to investigate impacting droplets on solid surfaces at the microscale. The aim is to bridge the gap between macroscale and nanoscale dynamics, shedding light on the continuous transition of the viscous dissipation mechanism across all scales.

From the velocity distribution extracted by MDPD simulations, three distinct forms of viscous dissipation are identified during spreading: bulk dissipation (Edis ,bulk) induced by droplet deformation; boundary-layer dissipation (Edis ,boundary) caused by shear flow near solid surfaces; rim dissipation (Edis ,rim) due to geometric head loss at the entrance of spreading rims. Subsequently, based on this insight, the viscous dissipation mechanisms at the macroscale and the nanoscale are revisited, and these three kinds of viscous dissipation are found to exist throughout the whole scale. Specifically, Edis ,bulk is strongly influenced by Oh, with its significant increasing as decreasing droplet scale. The term Edis ,boundary is sensitive to slip effects that become more pronounced with reducing scale, leading to a reduction in this form of dissipation. The term Edis ,rim depends solely on rim formation and maintains consistent strength across scales, provided that spreading rims are formed.

Based on this comprehensive understanding of viscous dissipation mechanisms throughout scales, a βmax model that incorporates all these forms of dissipation is established. This model, validated with data spanning a wide range of We, Oh and θ, from the macroscale (millimetre-sized droplets), microscale (D 0 = 230 nm and 1.15 μm) and nanoscale (nanometre-sized droplets), demonstrates robust predictive power for βmax. Consequently, this work validates the full-scale viscous dissipation mechanism and provides a vital link in understanding the continuum of droplet impact behaviours from the macroscale to the nanoscale.

Supplementary material

Supplementary material is available at https://doi.org/10.1017/jfm.2024.911.

Funding

This study was partially supported by the State Key Program of National Natural Science of China (no. 51936004) and the Science Fund for Creative Research Groups of the National Natural Science Foundation of China (no. 51821004).

Declaration of interests

The authors report no conflict of interest.

References

Abolghasemibizaki, M., Dilmaghani, N., Mohammadi, R. & Castano, C.E. 2019 Viscous droplet impact on nonwettable textured surfaces. Langmuir 35, 1075210761.CrossRefGoogle ScholarPubMed
Antonini, C., Amirfazli, A. & Marengo, M. 2012 Drop impact and wettability: from hydrophilic to superhydrophobic surfaces. Phys. Fluids 24, 102104.CrossRefGoogle Scholar
Attané, P., Girard, F. & Morin, V. 2007 An energy balance approach of the dynamics of drop impact on a solid surface. Phys. Fluids 19, 012101.CrossRefGoogle Scholar
Arienti, M., Pan, W., Li, X. & Karniadakis, G. 2011 Many-body dissipative particle dynamics simulation of liquid/vapor and liquid/solid interactions. J. Chem. Phys. 134, 204114.CrossRefGoogle ScholarPubMed
Bertola, V. 2009 An experimental study of bouncing Leidenfrost drops: comparison between Newtonian and viscoelastic liquids. Intl J. Heat Mass Transfer 52, 17861793.CrossRefGoogle Scholar
Bordbar, A., Taassob, A., Khojasteh, D., Marengo, M. & Kamali, R. 2018 Maximum spreading and rebound of a droplet impacting onto a spherical surface at low weber numbers. Langmuir 34, 51495158.CrossRefGoogle ScholarPubMed
Chandra, S. & Avedisian, C. 1991 On the collision of a droplet with a solid surface. Proc. R. Soc. A Math. Phys. Engng Sci. 432, 1341.Google Scholar
Chen, H., Nie, Q. & Fang, H. 2020 Dynamic behavior of droplets on confined porous substrates: a many-body dissipative particle dynamics study. Phys. Fluids 32, 102003.CrossRefGoogle Scholar
Clanet, C., Béguin, C., Richard, D. & Quéré, D. 2004 Maximal deformation of an impacting drop. J. Fluid Mech. 517, 199208.CrossRefGoogle Scholar
Du, B., Cheng, Y., Yang, S., Xu, W., Lan, Z., Wen, R. & Ma, X. 2020 Preferential vapor nucleation on hierarchical tapered nanowire bunches. Langmuir 37, 774784.CrossRefGoogle ScholarPubMed
Du, J., Wang, X., Li, Y., Min, Q. & Wu, X. 2021 a Analytical consideration for the maximum spreading factor of liquid droplet impact on a smooth solid surface. Langmuir 37, 75827590.CrossRefGoogle ScholarPubMed
Du, J., Zhang, Y. & Min, Q. 2021 b Numerical investigations of the spreading and retraction dynamics of viscous droplets impact on solid surfaces. Colloids Surf. A 609, 125649.CrossRefGoogle Scholar
Eggers, J., Fontelos, M.A., Josserand, C. & Zaleski, S. 2010 Drop dynamics after impact on a solid wall: theory and simulations. Phys. Fluids 22, 062101.CrossRefGoogle Scholar
Gad-El-Hak, M. 1999 The fluid mechanics of microdevice – the Freeman scholar lecture. J. Fluids Engng 121, 533.CrossRefGoogle Scholar
Galliker, P., Schneider, J., Eghlidi, H., Kress, S., Sandoghdar, V. & Poulikakos, D. 2012 Direct printing of nanostructures by electrostatic autofocussing of ink nanodroplets. Nat. Commun. 3, 890.CrossRefGoogle ScholarPubMed
Ghoufi, A., Malfreyt, P. & Tildesley, D.J. 2016 Computer modelling of the surface tension of the gas–liquid and liquid–liquid interface. Chem. Soc. Rev. 45, 13871409.CrossRefGoogle ScholarPubMed
Glasscott, M.W., Pendergast, A.D., Goines, S., Bishop, A.R., Hoang, A.T., Renault, C. & Dick, J.E. 2019 Electrosynthesis of high-entropy metallic glass nanoparticles for designer, multi-functional electrocatalysis. Nat. Commun. 10, 2650.CrossRefGoogle ScholarPubMed
Groot, R.D. & Warren, P.B. 1997 Dissipative particle dynamics: bridging the gap between atomistic and mesoscopic simulation. J. Chem. Phys. 107, 44234435.CrossRefGoogle Scholar
Jamali, S., Boromand, A., Khani, S., Wagner, J., Yamanoi, M. & Maia, J. 2015 Generalized mapping of multi-body dissipative particle dynamics onto fluid compressibility and the Flory-Huggins theory. J. Chem. Phys. 142, 164902.CrossRefGoogle ScholarPubMed
Josserand, C. & Thoroddsen, S.T. 2016 Drop impact on a solid surface. Annu. Rev. Fluid Mech. 48, 365391.CrossRefGoogle Scholar
Kobayashi, K., Konno, K., Yaguchi, H., Fujii, H., Sanada, T. & Watanabe, M. 2016 Early stage of nanodroplet impact on solid wall. Phys. Fluids 28, 032002.CrossRefGoogle Scholar
Koishi, T., Yasuoka, K. & Zeng, X.C. 2017 Molecular dynamics simulation of water nanodroplet bounce back from flat and nanopillared surface. Langmuir 33, 1018410192.CrossRefGoogle ScholarPubMed
Kremer, J., Kilzer, A. & Petermann, M. 2018 Simultaneous measurement of surface tension and viscosity using freely decaying oscillations of acoustically levitated droplets. Rev. Sci. Instrum. 89, 015109.CrossRefGoogle ScholarPubMed
Laan, N., de Bruin, K.G., Bartolo, D., Josserand, C. & Bonn, D. 2014 Maximum diameter of impacting liquid droplets. Phys. Rev. Appl. 2, 044018.CrossRefGoogle Scholar
Lee, J.B., Derome, D., Dolatabadi, A. & Carmeliet, J. 2016 a Energy budget of liquid drop impact at maximum spreading: numerical simulations and experiments. Langmuir 32, 12791288.CrossRefGoogle ScholarPubMed
Lee, J.B., Laan, N., de Bruin, K.G., Skantzaris, G., Shahidzadeh, N., Derome, D., Carmeliet, J. & Bonn, D. 2016 b Universal rescaling of drop impact on smooth and rough surfaces. J. Fluid Mech. 786, R4.CrossRefGoogle Scholar
Li, B.X., Li, X.H. & Chen, M. 2017 Spreading and breakup of nanodroplet impinging on surface. Phys. Fluids 29, 012003.CrossRefGoogle Scholar
Li, X.H., Zhang, X.X. & Chen, M. 2015 Estimation of viscous dissipation in nanodroplet impact and spreading. Phys. Fluids 27, 052007.CrossRefGoogle Scholar
Li, Z., Bian, X., Tang, Y.H. & Karniadakis, G.E. 2018 A dissipative particle dynamics method for arbitrarily complex geometries. J. Comput. Phys. 355, 534547.CrossRefGoogle Scholar
Li, Z., Hu, G.H., Wang, Z.L., Ma, Y.B. & Zhou, Z.W. 2013 Three dimensional flow structures in a moving droplet on substrate: a dissipative particle dynamics study. Phys. Fluids 25, 072103.CrossRefGoogle Scholar
Loth, E. 2008 Compressibility and rarefaction effects on drag of a spherical particle. AIAA J. 46, 22192228.CrossRefGoogle Scholar
Loth, E., Tyler Daspit, J., Jeong, M., Nagata, T. & Nonomura, T. 2021 Supersonic and hypersonic drag coefficients for a sphere. AIAA J. 59, 32613274.CrossRefGoogle Scholar
Madejski, J. 1976 Solidification of droplets on a cold surface. Intl J. Heat Mass Transfer 19, 10091013.CrossRefGoogle Scholar
Mao, T., Kuhn, D.C. & Tran, H. 1997 Spread and rebound of liquid droplets upon impact on flat surfaces. AIChE J. 43, 21692179.CrossRefGoogle Scholar
McBride, S.P. & Law, B.M. 2009 Viscosity-dependent liquid slip at molecularly smooth hydrophobic surfaces. Phys. Rev. E 80, 060601.CrossRefGoogle ScholarPubMed
Murtola, T., Bunker, A., Vattulainen, I., Deserno, M. & Karttunen, M. 2009 Multiscale modeling of emergent materials: biological and soft matter. Phys. Chem. Chem. Phys. 11, 18691892.CrossRefGoogle ScholarPubMed
Nie, Q.C., Zhong, Y.H. & Fang, H.S. 2019 Study of a nanodroplet breakup through many-body dissipative particle dynamics. Phys. Fluids 31, 042007.CrossRefGoogle Scholar
Pasandideh-Fard, M., Qiao, Y.M., Chandra, S. & Mostaghimi, J. 1996 Capillary effects during droplet impact on a solid surface. Phys. Fluids 8, 650659.CrossRefGoogle Scholar
Srivastava, T. & Kondaraju, S. 2020 Analytical model for predicting maximum spread of droplet impinging on solid surfaces. Phys. Fluids 32, 092103.CrossRefGoogle Scholar
Stow, C.D. & Hadfield, M.G. 1981 An experimental investigation of fluid flow resulting from the impact of a water drop with an unyielding dry surface. Proc. R. Soc. A Math. Phys. Engng Sci. 373, 419441.Google Scholar
Ukiwe, C. & Kwok, D.Y. 2005 On the maximum spreading diameter of impacting droplets on well-prepared solid surfaces. Langmuir 21, 666673.CrossRefGoogle ScholarPubMed
Visser, C.W., Frommhold, P.E., Wildeman, S., Mettin, R., Lohse, D. & Sun, C. 2015 Dynamics of high-speed micro-drop impact: numerical simulations and experiments at frame-to-frame times below 100 ns. Soft Matt. 11, 17081722.CrossRefGoogle ScholarPubMed
Visser, C.W., Tagawa, Y., Sun, C. & Lohse, D. 2012 Microdroplet impact at very high velocity. Soft Matt. 8, 1073210737.CrossRefGoogle Scholar
Wang, Y.-B., Wang, X.-D., Yang, Y.-R. & Chen, M. 2019 The maximum spreading factor for polymer nanodroplets impacting a hydrophobic solid surface. J. Phys. Chem. C 123, 1284112850.CrossRefGoogle Scholar
Wang, Y.-B., Wang, Y.-F., Gao, S.-R., Yang, Y.-R., Wang, X.-D. & Chen, M. 2020 a Universal model for the maximum spreading factor of impacting nanodroplets: from hydrophilic to hydrophobic surfaces. Langmuir 36, 93069316.CrossRefGoogle ScholarPubMed
Wang, Y.-B., Wang, Y.-F., Wang, X., Zhang, B.-X., Yang, Y.-R., Lee, D.-J., Wang, X.-D. & Chen, M. 2021 b Splash of impacting nanodroplets on solid surfaces. Phys. Rev. Fluids 6, 094201.CrossRefGoogle Scholar
Wang, Y.-B., Wang, Y.-F., Yang, Y.-R., Wang, X.-D. & Chen, M. 2021 a Spreading time of impacting nanodroplets. J. Phys. Chem. B 125, 56305635.CrossRefGoogle ScholarPubMed
Wang, Y.-F., Wang, Y.-B., Cai, Z.-H., Ma, Q., Yang, Y.-R., Zheng, S.-F., Lee, D.-J. & Wang, X.D. 2024 Binary collision dynamics of equal-sized nanodroplets. J. Fluid Mech. 979, A25.CrossRefGoogle Scholar
Wang, Y.-F., Wang, Y.-B., He, X., Zhang, B.-X., Yang, Y.-R., Wang, X.-D. & Lee, D.-J. 2022 a Retraction dynamics of low-viscosity nanodroplets: from hydrophobic to hydrophilic surfaces. J. Mol. Liq. 355, 118963.CrossRefGoogle Scholar
Wang, Y.-F., Wang, Y.-B., He, X., Zhang, B.-X., Yang, Y.-R., Wang, X.-D. & Lee, D.-J. 2022 b Scaling laws of the maximum spreading factor for impact of nanodroplets on solid surfaces. J. Fluid Mech. 937, A12.CrossRefGoogle Scholar
Wang, Y.-F., Wang, Y.-B., Xie, F.-F., Liu, J.-Y., Wang, S.-L., Yang, Y.-R., Gao, S.-R. & Wang, X.-D. 2020 b Spreading and retraction kinetics for impact of nanodroplets on hydrophobic surfaces. Phys. Fluids 32, 092005.CrossRefGoogle Scholar
Wang, Y.-F., Wang, Y.-B., Zhang, C.-L., He, X., Yang, Y.-R., Zheng, S.-F., Lee, D.-J. & Wang, X.-D. 2023 Retraction and bouncing dynamics of nanodroplets upon impact on superhydrophobic surfaces. Phys. Fluids 35, 032012.CrossRefGoogle Scholar
Warren, P.B. 2001 Hydrodynamic bubble coarsening in off-critical vapor-liquid phase separation. Phys. Rev. Lett. 87, 225702.CrossRefGoogle ScholarPubMed
Warren, P.B. 2003 Vapor-liquid coexistence in many-body dissipative particle dynamics. Phys. Rev. E 68, 066702.CrossRefGoogle ScholarPubMed
Wildeman, S., Visser, C.W., Sun, C. & Lohse, D. 2016 On the spreading of impacting drops. J. Fluid Mech. 805, 636655.CrossRefGoogle Scholar
Worthington, A.M. 1876 On the forms assumed by drops of liquids falling vertically on a horizontal plate. Pro. R. Soc. Lond. 25, 261271.Google Scholar
Xie, F.F., Lv, S.H., Yang, Y.R. & Wang, X.D. 2020 Contact time of a bouncing nanodroplet. J. Phys. Chem. Lett. 11, 28182823.CrossRefGoogle ScholarPubMed
Yamada, T., Yuan, J. & Sunden, B.A. 2015 Application of many-body dissipative particle dynamics to determine liquid characteristics. Intl J. Numer. Meth. Heat Fluid Flow 25, 16191637.CrossRefGoogle Scholar
Yang, J.C., Qi, T.Y., Han, T.Y., Zhang, J. & Ni, M.J. 2018 Elliptical spreading characteristics of a liquid metal droplet impact on a glass surface under a horizontal magnetic field. Phys. Fluids 30, 012101.CrossRefGoogle Scholar
Yarin, A.L. & Weiss, D.A. 1995 Impact of drops on solid surfaces: self-similar capillary waves, and splashing as a new type of kinematic discontinuity. J. Fluid Mech. 283, 141173.CrossRefGoogle Scholar
Zarin, N.A. 1970 Measurement of non-continuum and turbulence effects on subsonic sphere drag. NASA No. NASA-CR-1585.Google Scholar
Zhang, R., Farokhirad, S., Lee, T. & Koplik, J. 2014 Multiscale liquid drop impact on wettable and textured surfaces. Phys. Fluids 26, 082003.CrossRefGoogle Scholar
Zhao, J., Chen, S., Zhang, K. & Liu, Y. 2021 A review of many-body dissipative particle dynamics (MDPD): theoretical models and its applications. Phys. Fluids 33, 112002.CrossRefGoogle Scholar
Figure 0

Figure 1. The schematic of the simulation system containing a droplet above a solid substrate after achieving equilibrium. The system is filled with nitrogen particles to replicate a nitrogen environment of 100 kPa, similar to an atmospheric environment.

Figure 1

Table 1. The parameters of MDPD simulations.

Figure 2

Table 2. Relationships between contact angles and the values of $A_{w\text{-}s}$.

Figure 3

Figure 2. Comparison of βmax for impacting droplets at the macroscale (Abolghasemibizaki et al.2019), the microscale and the nanoscale on superhydrophobic surfaces with θ = 163°, 164° and 165°, respectively.

Figure 4

Figure 3. (ac) Velocity contours of microscale droplets impacting surfaces with θ = 147° at We = 235.6. (df) Velocity profiles near solid walls at the microscale, the macroscale and the nanoscale, respectively.

Figure 5

Figure 4. (a,b) Fitting Cbulk by the data of impacting nanodroplets with Oh = 0.35 on superhydrophobic surfaces with θ = 148° (Wang et al.2022b) and of impacting macroscale droplets with Oh = 0.56 on superhydrophobic surfaces with θ = 120° (Du, Zhang & Min 2021b). (c) Fitting Cslip by the data of impacting microscale droplets with Oh = 0.21 on hydrophobic surfaces with θ = 125°. (d) The relationship between Cslip and D0 for water at We = 300 and θ = 125°.

Figure 6

Figure 5. (a) Validating the proposed model and the model of Wildeman et al. (2016) by macroscale data of βmax in wide ranges of We from 8 to 6815, Oh from 0.002 to 1.05 and θ from 90° to 163°. The data are marked by blue (Antonini, Amirfazli & Marengo 2012), green (Stow & Hadfield 1981), red (Abolghasemibizaki et al.2019) and orange (Clanet et al. 2004) points, respectively. (b) The proportion of the surface energy of the periphery surface (Es,m2) to the one of the upper and lower surfaces (Es,m1) and (c) the proportion of the bulk dissipation (Edis,bulk) to the boundary-layer one (Edis,boundary).

Figure 7

Figure 6. (a) Validating the proposed model and the model of Wildeman et al. (2016) by the MDPD data on (a) weak hydrophobic surfaces with θ from 100° to 109° and on (b) highly hydrophobic surfaces with θ from 138° to 174°. (c) The proportion of the surface energy of the periphery surface (Es,m2) to the one of the upper and lower surfaces (Es,m1) and (d) the proportion of the bulk dissipation (Edis,bulk) to the boundary-layer one (Edis,boundary). (e) Validating the models by a larger water droplet with D0 = 1.15 μm at θ = 125°.

Figure 8

Figure 7. (a) Validating the proposed model and the model of Wildeman et al. (2016) by the data of βmax for impacting droplets at the nanoscale in wide ranges of We, Oh and θ from 1 to 290, from 0.35 to 0.48 and from 125° to 180°, respectively (Wang et al.2020a, 2022b; Zhang et al.2014). (b) The proportion of the surface energy of the periphery surface (Es,m2) to the one of the upper and lower surfaces (Es,m1).

Figure 9

Figure 8. Validating the proposed model by the MD data of βmax by viscous impacting nanodroplets at Oh = 1.54 (Wang et al.2019).

Supplementary material: File

Wang et al. supplementary material

Wang et al. supplementary material
Download Wang et al. supplementary material(File)
File 463.7 KB