


I. INTRODUCTION
Safe and economic utilization of nuclear energy relies on accurate temperature control of various components within the reactor. A number of physical processes including rates of nuclear reactions, diffusion of fission products, and heat transfer are functions of temperature. Reference Olander1 Within a solid material, the temperature distribution depends on the ability of a material to conduct heat. Thermal conductivity is the physical property that is used to describe heat transport at the engineering scale level. Reference Bergman and Incropera2 The objective of this paper is to summarize our studies aimed at understanding the mechanisms of thermal transport in ceramic materials used for nuclear energy applications. We present several examples that utilize a laser-based approach to measure thermal transport in nuclear fuels and related materials.
The primary function of nuclear fuel in fission reactors is to provide fissile atoms that upon absorption of a neutron generate energy. Reference Olander1 The thermal energy liberated after the fission process must be transferred to the coolant and eventually transformed into electricity using turbines. Reference Lamarsh and Baratta3 At the same time, fuel is expected to retain highly radioactive fission products. The latter constitute a primary environmental hazard if released to the surrounding area. The fuel must also maintain its structural integrity. Meeting all of these requirements is difficult considering the dramatic structural and chemical changes taking place within the fuel. Reference Was4,Reference Ronchi, Sheindlin, Staicu and Kinoshita5
Efficient utilization of nuclear energy in fission reactors relies on detailed understanding of the fuel behavior under reactor conditions. Fuel performance codes are developed to describe fuel behavior. In these codes, evaluating the temperature distribution within a fuel constitutes a critical step that impacts other predicted performance characteristics. The temperature profile, determined in large part by the thermal conductivity, strongly influences the mechanisms that control structure evolution and fission product behavior. Reference Lassmann6–Reference Williamson, Hales, Novascone, Tonks, Gaston, Permann, Andrs and Martineau8 This article focuses on how thermal properties of nuclear materials are influenced by their microstructure and its evolution under irradiation.
The discussion presented in this article is structured as follows: In Sec. II, we describe a thermoreflectance (TR) approach used for measurement of thermal conductivity in applications where micron level resolution is required. In Sec. III, we describe the application of TR to investigations of the irradiation effects on thermal conductivity, where ion beam irradiation is used to introduce a thin damage layer at the surface of the material. The damage layer is treated as a thin film having thermal properties that are different from the un-irradiated bulk. In Sec. IV, we discuss the application of the TR techniques to understand thermal transport in composite materials, where heterogeneity must be considered. Each example is accompanied by a discussion illustrating the importance of understanding thermal transport.
II. MEASUREMENT OF THERMAL TRANSPORT
A. Standard approaches for thermal conductivity measurements
Direct measurement of thermal conductivity is achieved by applying a heat flux across a material of a known geometrical shape and measuring the temperature difference across a fixed distance using thermocouples. Reference Tritt9 In general, this approach requires centimeter size samples. While this is in principle a straightforward measurement, a number of other factors need to be accounted for including radiative heat dissipation through the surface of the material as well as thermal interface resistance between thermocouple and material. For high-temperature measurements, large radiative losses through the surface and unavailability of high-temperature thermocouples make direct measurement impractical. Reference Jensen, Xing, Folsom, Ban and Phillips10
Xenon thermal flash and more recently laser flash method have become the primary methods used for measurement of thermal transport in materials utilized for nuclear applications. Reference Ronchi, Sheindlin, Staicu and Kinoshita5,Reference Cezairliyan, Baba and Taylor11,Reference Snead, Zinkle and White12 It is applied on a disk shaped specimen with flat parallel surfaces. One side is excited by a short laser pulse and the infrared emission is measured on the other side. The time it takes for the opposite side to be heated is used to quantify the ability of material to conduct heat. Being a transient measurement, laser flash provides measurement of thermal diffusivity. To obtain thermal conductivity one needs to perform an alternative measurement of specific heat and density. In principle, it is possible to calibrate this measurement to measure specific heat as well. Reference Ronchi, Sheindlin, Musella and Hyland13 This approach is well suited for high-temperature measurements as long as appropriately sized samples are available. The absence of electrical connections makes laser flash attractive for implementation on neutron irradiated samples.
Both techniques described so far are considered as bulk measurements that provide an averaged value across the thickness of the specimen. Many advanced fuel concepts rely on composite materials. Reference Powers and Wirth14–Reference Rondinella and Wiss16 While for many design and safety analyses the averaged value of thermal conductivity is sufficient, some analyses require spatially resolved measurement of conductivity. This applies to conditions where the exact temperature distribution is critical or where one is tasked with development and validation of model with predictive capability. Reference Williamson, Hales, Novascone, Tonks, Gaston, Permann, Andrs and Martineau8,Reference Rashid, Yagnik and Montgomery17,Reference Bertolus, Freyss, Dorado, Martin, Hoang, Maillard, Skorek, Garcia, Valot, Chartier, Van Brutzel, Fossati, Grimes, Parfitt, Bishop, Murphy, Rushton, Staicu, Yakub, Nichenko, Krack, Devynck, Ngayam-Happy, Govers, Deo and Behera18 The latter typically involves the ability to predict thermal conductivity as a function of radiation induced microstructure. Reference Tonks, Liu, Andersson, Perez, Chernatynskiy, Pastore, Stanek and Williamson19 Another limitation of both techniques is their lack of sensitivity to a thin damage layer resulting from ion beam irradiations, which is an alternative method used to simulate displacement damage caused by energetic neutrons and fission products. Reference Was and Allen20 The ability to perform thermal transport measurement on ion irradiated samples opens up cost attractive possibilities for fundamental studies on the impact of radiation on thermal properties. Reference Short, Dennett, Ferry, Yang, Mishra, Eliason, Vega-Flick, Maznev and Nelson21–Reference Cheaito, Gorham, Misra, Hattar and Hopkins24
B. Modulated TR approaches
In the modulated TR approach, two beams are incident on the flat surface of a sample. Reference Allan, Jon, Smith and Willenborg25 One beam is used as a heater whose intensity is modulated by a sine or square wave function. The second beam is used as a sensor, whose reflectivity change is used as an indication of temperature changes. TR methods require a polished surface and deposition of a thin metallic transducer layer. This metal transducer layer ensures strong optical absorption of the pump beam and acts as temperature sensor. Small changes in the temperature of the metal layer results in a small reflectivity change. This process is referred to as TR and thus the name for this approach. This TR coefficient is material dependent and also depends on optical wave length. Reference Wilson, Apgar, Martin and Cahill26 As a result, the metal layer is chosen according to the wave length of the laser.
Various implementations of TR techniques exist. Time domain TR (TDTR) recently has gained popularity in thermal transport studies of thin films. It utilizes an ultrashort pulse to excite a thermal pulse and a probe beam is used to trace the evolution of the temperature on a nanosecond time scale. Reference Carolyn and Gary27–Reference Capinski and Maris29 Typically, this technique is only sensitive to thermal transport in the depth direction. Reference Cahill, Ford, Goodson, Mahan, Majumdar, Maris, Merlin and Phillpot30 Frequency domain TR (FDTR) uses continuous wave lasers and examines the phase lag between excitation pulse and temperature as a function of a modulation frequency. Reference Hua, Ban, Khafizov, Schley, Kennedy and Hurley31,Reference Malen, Baheti, Tong, Zhao, Hudgings and Majumdar32
In this work, we primarily use a variation of TR that relies on spatially resolved measurement where the temperature profile around the excitation spot is measured. Reference Khafizov and Hurley33–Reference David, Gomes, Carlot, Roger, Fournier, Valot and Raynaud35 Our choice of this approach stems from its attractiveness for use in hot cell applications, where the exact knowledge of some of the experimental parameters is not required. Those include spot size of both beams, thickness of the metallic transducer layer, and thermal interface resistance between transducer and material. Reference Hua, Ban, Khafizov, Schley, Kennedy and Hurley31,Reference Hurley, Schley, Khafizov and Wendt36 Most of the results presented in the following sections were acquired using a spatial scan TR presented below. We also provide one example where TDTR and FDTR are used.
C. Experimental setup
A schematic representation of spatial domain TR (SDTR) approach is depicted in Fig. 1. Reference Hurley, Schley, Khafizov and Wendt36 The pump and probe beams are derived from two continuous wave diode lasers emitting at 660 nm and 532 nm wave length, respectively. Amplitude modulation of the pump is achieved by direct modulation of the laser output via electronic trigger. Both pump and probe are focused on the sample using a single 50× microscope objective resulting in a spot size of ∼1 µm for both beams. Lateral scanning is achieved through an optical two-lens lever. Reference Hurley, Wright, Matsuda and Shinde37 Small changes in reflectivity of the probe beam ΔR/R ranging from 10−5 to 10−3 are measured using lock-in amplification of the photodiode voltage signal. We also present a few examples that use a modified version of this setup. The differences will be addressed during the discussion of specific examples.

FIG. 1. (a) Experimental layout of SDTR approach. Pump's intensity is harmonically oscillating and is scanned on surface using a two-lens lever system. Probe is fixed and its reflectivity change is recorded. (b) Spatially resolved thermal wave profiles measured on the surface of U3Si2 fuel. Both amplitude (top) and phase (bottom) of the wave profile are plotted as a function of pump position along a straight line with probe at the origin. Profiles measured at different modulation frequencies are shown.
This arrangement allows a tightly focused, amplitude modulated pump beam to excite a thermal wave inside the material. The frequency of the pump is tuned to confine the thermal wave to either a damage region created by ion irradiation or to a micron sized area on the surface of a heterogeneous sample. Reference Khafizov, Yablinsky, Allen and Hurley38 Spatially resolved amplitude and phase profiles of the thermal wave are measured by recording reflectivity changes of the probe beam while the pump is laterally scanned on the surface of the sample. The reflectivity change is directly proportional to the change in the surface temperature.
Typical wave profiles obtained from uranium silicide (U3Si2) are depicted in Fig. 1(b). Reference Harp, Lessing and Hoggan39 The amplitude profile is sharply peaked around the pump and drops off with an exponential-like decay away from the pump. The phase lag is linear with distance when sufficiently away from the pump. Physically the slope in this region is related to a time required for the heat wave to diffuse a specific distance. This suggests that for a specific modulation frequency the phase lag is larger for materials with lower conductivity.
Measured thermal wave profiles were analyzed using an exact analytical solution of the heat diffusion equation in a two layer system representing thin metal transducer film on top of a substrate that is assumed to be infinitely thick. Reference Khafizov and Hurley33 This assumption is justified when one considers that the thickness of specimens is at least 500 μm and penetration depth of thermal waves considered in our studies is limited to 100 μm for the lowest modulation frequency. The limitations of this assumption when applied to the composites and ion irradiated samples will be addressed further when their examples are discussed. Determination of thermal conductivity for the unknown layer involves fitting of the experimental and model profiles using a least square minimization. Reference Khafizov and Hurley33,Reference Hurley, Schley, Khafizov and Wendt36 Using this approach our measured thermal conductivity for U3Si2 at room temperature is 7.1 W/m K.
III. MEASUREMENTS IN ION IRRADIATED MATERIALS
In this section, we discuss the utility of TR approaches to the study of thermal transport in ion beam irradiated samples. We discuss several examples where we investigate the impact of irradiation induced point defects, dislocation loops, and fission products on thermal conductivity in fuel surrogates. We first discuss a study aimed at studying the impact of irradiation induced point defects on thermal conductivity of UO2. Reference Pakarinen, Khafizov, He, Wetteland, Gan, Nelson, Hurley, El-Azab and Allen23 In the second example, we investigate the influence of dislocation loops on thermal conductivity in cerium dioxide (CeO2). Reference Khafizov, Pakarinen, He, Yablinsky, Allen and Hurley40 Lastly, the impact of fission product on thermal conductivity of fuel is represented by a study of krypton (Kr) ion irradiated silicon carbide. Reference Chauhan, Riyad, Du, Wei, Zhao, Tyburska-Püschel and Khafizov41
In addition to the spatially resolving capability of TR techniques one needs to develop carefully tailored ion irradiations. Our irradiation conditions were chosen so that specific defects are generated. For point defects low temperature hydrogen ion (H+) irradiations were performed. Reference Pakarinen, He, Gupta, Gan, Nelson, El-Azab and Allen42 Dislocation loops were fabricated by high-temperature irradiation with H+ ions. Reference Khafizov, Pakarinen, He, Yablinsky, Allen and Hurley40 Fission product was introduced by implantation of Kr. Reference Chauhan, Riyad, Du, Wei, Zhao, Tyburska-Püschel and Khafizov41 While these irradiation conditions do not necessarily reflect the reactor conditions, they were tailored to capture relevant physical mechanisms important for validation of thermal transport models. Reference Watanabe, Srivilliputhur, Schelling, Tulenko, Sinnott and Phillpot43,Reference Crocombette and Proville44 It should be noted that the original intention was to study all of these conditions in UO2, but has not yet been accomplished due to difficulties that was encountered in performing ion irradiations on UO2 over a broad range of temperatures and ion fluences that produced samples suitable for TR measurements.
The discussion on the impact of microstructure induced by a fission environment will not be complete without addressing the impact of fission gas bubbles on thermal conductivity. These latter phenomena have been actively investigated by computational methods Reference Tonks, Liu, Andersson, Perez, Chernatynskiy, Pastore, Stanek and Williamson19,Reference Millett, Tonks, Chockalingam, Zhang and Biner45,Reference Lee, Chernatynskiy, Shukla, Stoller, Sinnott and Phillpot46 and very little experimental data exist and are a subject of future work. Reference Valderrama, He, Henderson, Pakarinen, Jaques, Gan, Butt, Allen and Manuel47,Reference He, Valderrama, Hassan, Yu, Gupta, Pakarinen, Henderson, Gan, Kirk, Nelson, Manuel, El-Azab and Allen48
The stopping and range of ions in matter (SRIM) code was used to estimate the displacement damage. Reference Stoller, Toloczko, Was, Certain, Dwaraknath and Garner49 Calculations were done using the Kinchin–Pease method and the Norgett, Robinson, and Torrens (NRT) model. Estimated damage profiles were approximated by two layers in case of H+ ions and a single layer in case of Kr ions that have uniform damage to simplify our thermal conductivity analysis. During thermal transport measurement, the modulation frequency of the pump was chosen so that the excited thermal waves were primarily confined to the damaged layer.
A. Thermal conductivity reduction due to point defects
Polycrystalline UO2 samples fabricated at Los Alamos National Laboratory Reference White and Nelson50 were irradiated using 2.6 MeV H+ ions derived from NEC Pelletron Tandem accelerator at the University of Wisconsin. Reference Pakarinen, He, Gupta, Gan, Nelson, El-Azab and Allen42 Three samples were irradiated to an estimated fluence of 1.4 × 10¹⁷, 7.0 × 10¹⁷, and 1.4 × 10¹⁸ ions/cm2. The damage profile was calculated using SRIM code with threshold displacement of 40 eV and 20 eV for uranium and oxygen, respectively. Reference Pakarinen, He, Gupta, Gan, Nelson, El-Azab and Allen42 It is approximated by two regions, namely the plateau and peak damage regions. In the plateau region, displacement damage is approximately uniform and extends over 32 µm. It is followed by a peak damage region confined to a narrow zone that spans about 4 µm, where most of the damage takes places and majority of hydrogen atoms are implanted. The estimated damage within the plateau regions of all irradiated samples is 0.01, 0.05, and 0.10 displacements per atom (dpa), respectively. Concentration of implanted H atoms within plateau region is less than 0.01 at.%. Reference Pakarinen, He, Gupta, Gan, Nelson, El-Azab and Allen42 A thin gold layer of about 50 nm in thickness was thermally evaporated on each sample that acted as the transducer layer for TR measurement.
Typical thermal wave profiles recorded from as-prepared and irradiated UO2 samples using SDTR are shown in Fig. 2(a). It is noticeable that the slope for the irradiated samples is larger than that of the reference sample. This is a direct indication of reduced thermal conductivity in the irradiated sample. A thermal diffusion model accounting for thermal transport across the damage profile was implemented and a fitting procedure was applied to extract the thermal conductivity of the plateau damage region. Reference Pakarinen, Khafizov, He, Wetteland, Gan, Nelson, Hurley, El-Azab and Allen23 In this case, thin metal film, plateau damage layer, peak damage layer, and undamaged substrate are explicitly considered in the heat diffusion model. The results of SRIM were used to determine the thickness of plateau and peak damage layers and their conductivities were assumed to be uniform. This multilayer model was used to choose the appropriate modulation frequency that is most sensitive to the plateau damage and least sensitive to the peak damage region in our studies.

FIG. 2. Measurement of thermal conductivity in proton irradiated UO2. (a) Thermal wave profiles measured at 2 kHz, symbols are experimental data and solid lines are model fits, (b) XRD patterns from Ref. Reference Pakarinen, He, Gupta, Gan, Nelson, El-Azab and Allen42 showing defect accumulation, and (c) measured thermal conductivity is compared to nonstoichiometric values from Ref. Reference White and Nelson50, solid line are fit to a model.
Figure 2(b) summarizes x-ray diffraction (XRD) diffraction analysis of the irradiated sample. Reference Pakarinen, He, Gupta, Gan, Nelson, El-Azab and Allen42 Well-defined peaks [only (224) peak is shown] indicate that the samples remained crystalline after the irradiation. A gradual peak shift to a smaller angle with increasing dose indicates lattice expansion due to accumulation of point defects. Reference Weber51 This is in agreement with previous work in He ion irradiated UO2, but in contrast with shrinkage of the lattice when O interstitials are present in nonstoichiometric UO2+x . Reference Pakarinen, Khafizov, He, Wetteland, Gan, Nelson, Hurley, El-Azab and Allen23,Reference Lynds, Young, Mohl and Libowitz52,Reference Weber53
The thermal conductivity values obtained from the analysis of measured thermal wave profiles are summarized in Fig. 2(c). It shows a gradual decrease of thermal conductivity as the damage increases, as expected. We compare our results qualitatively against conductivity values for the nonstoichiometric UO2+x , where the primary defects are oxygen interstitials. Reference White and Nelson50,Reference Lucuta, Matzke and Verrall54 The comparison is done versus concentration of defects per unit cell. It is concentration of oxygen interstitials (i.e., value of x in UO2+x and dpa value for the irradiated sample). It is clear that this comparison suggests that defects resulting from H+ irradiation cause a stronger reduction in conductivity. This can be attributed to the fact that displacement damage in addition to oxygen defects generates uranium defects that are not available in nonstoichiometric samples. There is also an indication that U lattice defects have a stronger phonon scattering cross-section. Reference Pakarinen, Khafizov, He, Wetteland, Gan, Nelson, Hurley, El-Azab and Allen23,Reference Geng, Song, Jin, Xiang and Wu55 In the above discussion, we neglected the contribution of implanted H+ atoms due their much lower concentration compared to generated point defects.
The reduction of thermal conductivity was analyzed quantitatively using the classical thermal transport model based on Klemens–Callaway formalism that accounts for intrinsic factors limiting heat transport and irradiation induced point defects. Reference Klemens56 The phonon scattering cross-section is used to quantify the impact of point defects on conductivity of materials whose thermal transport is governed by lattice vibrations. The defect's scattering cross-section is defined by two parameters, a mass mismatch and ionic radius mismatch. Reference Abeles57 Based on ab initio calculation, uranium-based defects have larger relaxation volumes and thus are expected to have a larger impact on thermal conductivity, consistent with our qualitative analysis. Reference Geng, Song, Jin, Xiang and Wu55
B. Impact of dislocation loops on thermal conductivity
Impact of dislocation loops on thermal transport in ceramic materials was studied in CeO2, which was used as a surrogate for UO2. Two CeO2 samples sliced from commercially available sintered pellets (Alfa Aesar) were irradiated at T = 700 °C using 1.6 MeV protons derived from a NEC Pelletron Tandem accelerator to a fluence of 2.8 × 10¹⁸ and 1.4 × 10¹⁹ ions/cm2. Reference Khafizov, Pakarinen, He, Yablinsky, Allen and Hurley40 SRIM software calculations were performed using the displacement energies of 20 eV and 40 eV for O and Ce, respectively. It was found using the SRIM calculations that the plateau region was confined to the top 16 μm, the higher fluence produced a damage of ∼1.0 dpa and the lower fluence led to a damage of ∼0.2 dpa. The plateau region is followed by 2 µm thick layer having significantly higher damage than the plateau region. Similar to the previously described UO2 example, the irradiated zone was approximated by two layers with uniform damage.
Specific to this study, thermal wave profiles were excited by a 400 nm wave length pump beam and sensed by a 800 nm wave length probe beam and the samples were coated with a 50 nm thick aluminum layer. Typical thermal wave profiles measured using this configuration are plotted in Fig. 3. Again we see that thermal wave develops a phase lag with respect to the excitation and the phase profile has a linear dependence sufficiently away from the pump. As in the case of H+ irradiated UO2, we see that irradiated CeO2 exhibits a larger slope, as compared to the reference. However in this case, due to a significantly higher irradiation temperature, the reduction is expected to be due to extended defects. Reference He, Gupta, Kirk, Pakarinen, Gan and Allen58,Reference Ye, Kirk, Chen, Oaks, Rest, Yacout and Stubbins59

FIG. 3. (a) Thermal wave profile measured hydrogen ion irradiated CeO2 samples. Experimental data are represented by individual data points and solids lines are fits to the model used to extract thermal conductivity. Thermal profiles from top to bottom have increasing slope, corresponding to decreasing thermal conductivity, as we go from as-received sample down to irradiated samples. (b) Electron microscopy images depicting dislocation loops.
Irradiation damage was characterized using transmission electron microscopy (TEM). Figure 3(b) shows representative TEM micrographs which clearly reveal the presence of irradiation induced dislocation loops in both samples. As expected, the high irradiation dose sample contains larger loops and higher loop density. The dislocation loop average radius R d and volume density n d were determined by analyzing a series of TEM micrographs and are listed in Table I. Additionally x-ray diffraction analysis was performed to assess the damage. In this high-temperature irradiated CeO2, lattice expansion caused by point defect accumulation was minimal. This is in contrast to the observation of substantial lattice expansion due to point defects in low temperature irradiated UO2. Analysis based on classical thermal transport models suggests that dislocation loops have a significant impact on thermal conductivity reduction in this sample. Reference Snead, Zinkle and White12,Reference Khafizov, Park, Chernatynskiy, He, Lin, Moore, Swank, Lillo, Phillpot, El-Azab and Hurley60,Reference Klemens61
TABLE I. Characterization summary of proton irradiated CeO2.
C. Impact of fission products on thermal conductivity
Fission gas products were introduced by implanting Kr ion using an ion accelerator. Kr ions were accelerated to 1 MeV energy using a Van der Graaff accelerator at University of Illinois Urbana Champaign and implanted into cubic 3C-silicon carbide (SiC) under varying temperature and fluence. Reference Chauhan, Riyad, Du, Wei, Zhao, Tyburska-Püschel and Khafizov41 3C-SiC were obtained from a commercial vendor (Cree). We summarize this study by presenting the result on 3 samples. Reference Chauhan, Riyad, Du, Wei, Zhao, Tyburska-Püschel and Khafizov41 Sample (A) is an as-received sample and is used as a reference. Sample (B) was irradiated at 50 °C and an estimated dose of 0.004 dpa. Sample (C) was irradiated at room temperature to an estimated dose of 0.4 dpa. SRIM calculation suggests this implantation configuration resulted in a damage profile confined to 600 nm. This is too shallow for SDTR to be sensitive to the damaged layer; therefore, we used TDTR for its greater sensitivity to the near surface region of the sample. Reference Wei, Zheng, Cahill and Zhao62 Compared to SDTR, TDTR uses a much higher modulation frequency for the pump beam (on the order of few MHz compared to SDTR's few tens of kHz). For these high frequencies, the thermal wave amplitude decays rapidly away from the heater and the spatial domain measurement becomes impractical. This short thermal wave length associated with TDTR introduces one limitation which is related to the influence of surface roughness. The impact of surface roughness becomes especially pronounced in ion irradiated samples. Reference Weisensee, Feser and Cahill63 This manifests itself as a large error bar in our analysis presented below.
Figure 4(a) depicts typical transients measured in Kr irradiated SiC. In TDTR, it is more convenient to analyze the ratio between in-phase and out-phase components of the temperature (V in/V out). The cotangent of V in/V out is equivalent to the phase. Typically values of V in/V out are larger for a material whose conductivity is larger. Qualitative analysis suggests that the reference sample-A has the largest conductivity of 360 ± 20 W/m K, sample B has a lower conductivity of 260 ± 70 W/m K, and sample C has a very low conductivity 1.6 ± 0.3 W/m K. Based on previous reports, sample B underwent a minor defect accumulation, whereas sample C was amorphized. Reference Snead, Zinkle and White12

FIG. 4. Measurement of thermal conductivity in krypton irradiated SiC. (a) Time domain thermal wave profiles. (b) Raman spectra of the samples.
The same set of samples was characterized using confocal Raman spectroscopy. The spectral region corresponding to two major peak E1(TO) and A1(LO) at 795 cm−1 and 970 cm−1, Reference Nakashima and Harima64,Reference Sorieul, Costantini, Gosmain, Thome and Grob65 respectively, are shown in Fig. 4(b). While these peaks are present in both A and B, they are absent in C. This indicates that sample B retained its crystalline structure while sample C completely amorphized, consistent with thermal conductivity data. Close examination of the spectra in sample B reveals a different magnitude for the ratio of the intensities of two peaks, when compared to the reference. While the intensity of the peak I 972/I 796 in the reference sample is about 1, it is about 0.6 in sample B. This can be attributed to the fact that A1(LO) is more sensitive to specific types of defects than E1(TO). Reference Yugami, Nakashima, Mitsuishi, Uemoto, Shigeta, Furukawa, Suzuki and Nakajima66
D. Importance of irradiation damage on thermal conductivity
The current state of the advanced computational tools allows development of fuel performance codes that are based on the atomic level first principle calculations and capture physical phenomena across multiple scales. Reference Rashid, Yagnik and Montgomery17 Unlike current fuel performance codes which are essentially empirical models that are based on a limited set of experimental data, first principles based codes are expected to have predictive capability. This predictive capability of fuel performance codes is very important for understanding the fuel behavior under conditions beyond normal operation.
Importance of atomic level calculations can also be rationalized by realizing that many fundamental physical processes taking place in the fuel during service are very hard to quantify experimentally. In fact, most of the physical parameters used in the models are actually inferred from post irradiation experimental measurements that are prone to misrepresent the actual condition of the fuel in service. In light of this, a number of activities have recently been initiated focusing on the development of lower length scale modeling tools for describing the performance of UO2 fuel. Reference Tonks, Millett, Nerikar, Du, Andersson, Stanek, Gaston, Andrs and Williamson67,Reference Valot, Bertolus, Konings, Somers and de Groot68 They aim at incorporating physical mechanisms at both atomic and mesoscale levels to capture phenomena such as grain growth and fission gas bubbles evolution. For instance, thermal conductivity model includes reduction of thermal conductivity combining microstructure features across multiple scales due to formation of fission gas bubbles, beginning from the moment fission atoms can be treated as point defects and subsequently evolving into bubbles that may arrange themselves along grain boundaries. Reference Tonks, Liu, Andersson, Perez, Chernatynskiy, Pastore, Stanek and Williamson19 In addition to the fission gases, the effect of nonstoichiometry and Frenkel pairs on thermal conductivity is also important. Reference Watanabe, Srivilliputhur, Schelling, Tulenko, Sinnott and Phillpot43,Reference Nichenko and Staicu69 These types of defects may exist under the presence of radiation flux and are absent in standard post irradiation examination.
While these lower scale codes are being developed, it is realized that there is a need to experimentally validate these models. Reference Tonks70 The results of the work presented above demonstrate the attractiveness of experimental studies combining ion beam irradiations, TR methods, and microstructure characterization techniques including x-ray diffraction, Raman spectroscopy, and electron microscopy techniques to validate the specific aspects of these efforts. Reference Cheaito, Gorham, Misra, Hattar and Hopkins24,Reference Khafizov, Yablinsky, Allen and Hurley38
IV. MEASUREMENT IN COMPOSITES
In this section, we present the results of measurement of thermal transport in composite materials, including tristructural isotropic (TRISO) particle fuel, SiC/SiC fiber composites, and 2nd phase precipitates in intermetallic fuels. We also distinguish between two different types of measurements. First is to determine conductivity of each individual layer or component and in the second, we focus on the measurement of thermal interface resistance between two layers.
A. TRISO fuel particle
TRISO-coated particle is a form of fuel that has been developed for over five decades and demonstrated in high-temperature gas-cooled reactors in many countries. Reference Petti, Maki, Hunn, Pappano, Barnes, Saurwein, Nagley, Kendall and Hobbins71 Its primary design characteristic is to contain radioactive fission products within its layered structure. It consisted of fuel kernel, graphite buffer, inner pyrolytic carbon (IPyC) layer, SiC layer, and outer pyrolytic carbon (OPyC) layer. The porous graphite buffer absorbs fission products while SiC layer provides the main structural support and barrier for fission products. PyC layers provide additional mechanical support, retain fission products and protect the fuel kernel from erosive gas during deposition. Conventionally, the kernel is made by a sol–gel process and coating is achieved through a series of fluidized-bed coaters, whereas different countries have made various modifications resulting in different performances. Reference Petti, Buongiorno, Maki, Hobbins and Miller72 Tests showed that TRISO fuel can maintain structural integrity, withstand irradiation and very high temperature up to 1000 °C. Reference Petti, Demkowicz, Maki and Hobbins73 Extensive post irradiation examinations were done to characterize mechanical properties, chemical composition change, fission gas leakage, etc. to provide feedback to fuel fabrication and modeling. Reference Petti, Demkowicz, Maki and Hobbins73,Reference Verfondern74 Mechanical interaction between layers has an impact on integrity of TRISO fuel particle, ultimately impacting its fission product retention characteristics. The ability to assess fission product retention and mechanical integrity of the fuel relies on the knowledge of temperature distribution which requires determining the conductivity for individual layers. Reference Miller, Petti, Maki and Knudson75,Reference Collin, Petti, Demkowicz and Maki76
In this study we measured thermal conductivity of each layer using a surrogate fuel compact whose fuel kernel was replaced by zirconia. An optical micrograph of a particle sliced approximately along its equator is shown in Fig. 5(a). Individual layers are clearly seen and identified in the graph. The thickness of each layer varies between few tens of micrometers to a hundred microns. Each layer is sufficiently thick so that the probe scan was confined to a single layer while the pump was located at center. For very thin layers, thermal wave profiles were measured along the circumferential direction. Therefore, the measured profiles could have been impacted by the neighboring layers. However, our analysis suggests this effect is minimal as long as the pump beam is several µm away from the interface.

FIG. 5. Measurement in TRISO fuel. (a) Optical image of the TRISO fuel with a layered structure. (b) Thermal wave profiles measured from selected layers. Symbols are experimental data and solid lines are model fits used to measure thermal conductivity.
Thermal wave profiles measured from each individual layer are shown in Fig. 5(b). The variation of the slope clearly indicates different thermal properties for each layer. The extracted thermal conductivity values are summarized in Table II and compared to a previous work Reference Rochais, Le Meur, Basini and Domingues77 and values used in PARFUME fuel performance code. Reference Miller, Petti, Maki and Knudson78 We see a reasonable agreement between our and previously published results with the exception of buffer layer. The buffer layer is highly porous and our measurement corresponds to its skeleton conductivity, thus is the large discrepancy. In principle, the approach can be extended to measure the thermal interface resistance between different layers to assess the impact of debonding on thermal transport.
TABLE II. Thermal conductivity of TRISO particle layers.
B. 2nd phase precipitates
Here, we present spatially resolved measurement of thermal conductivity in a U3Si2 fuel surrogate. U3Si2 is considered as an alternative fuel to UO2 due to its higher uranium atom density and thermal conductivity. Reference White, Nelson, Dunwoody, Byler, Safarik and McClellan79 Unlike previously discussed cases, the conductivity of this material is determined by electron transport. Point defects and extended defects do not typically have a strong impact on electronic thermal conductivity, unless the material is cooled to cryogenic temperatures. Reference Butterworth and Forty80,Reference Schilling and Ullmaier81 Currently, U3Si2 is used as a fuel in research reactor, where operating temperatures are lower, but the fuel is exposed to higher burn-up. Recently, efforts have been initiated to understand the behavior of this material under irradiation conditions representative of commercial nuclear reactors. Under light water reactor conditions, the fuel temperature is expected to be higher than research reactor conditions. This raises several questions concerning microstructure evolution. From a thermal conductivity perspective, the primary concern is swelling and emergence of 2nd phase precipitates, as opposed to point defects or extended defect as is the case with oxide or silicon carbide. Reference Butterworth and Forty80
We show the ability of TR to resolve the conductivity of 2nd phase precipitates. For this demonstration, a sample was chosen that contains 2nd phase precipitates developed during the fabrication process and identified as the oxide phase of uranium. Reference Harp, Lessing and Hoggan39 For this purpose we used the time domain version of the TR setup, where the sample is excited by a square wave modulation. This is achieved by direct electrical triggering of a continuous wave diode laser. Unlike frequency or spatial domain measurements where one measures the phase of the thermal wave profile, here we directly monitor the temporal evolution of signal detected on the photodiode, corresponding to a temperature transient on the surface of the samples. The data analysis resembles that of TDTR, however this approach uses square wave excitation whereas TDTR uses delta function excitation. Figure 6 shows typical transients observed from two different points on the surface of the sample. The signal is characterized by a truncated square wave, similar to the behavior observed when a square wave is sent through a low pass filter. In this configuration, it is expected that materials with higher thermal conductivity exhibits a shorter time constant.
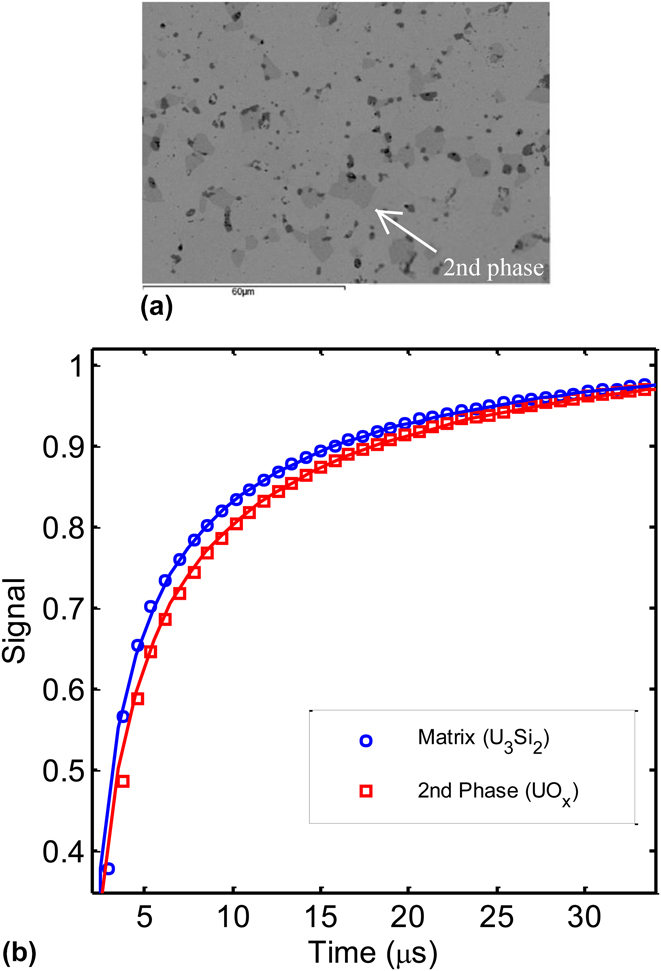
FIG. 6. Measurement in U3Si2 fuel. (a) SEM image from Ref. Reference Harp, Lessing and Hoggan39. (b) Time resolved thermal wave profiles measured from matrix (7.1 W/m K) and 2nd phase precipitate (5.9 W/m K).
We see that the response of the matrix is faster, indicating that the precipitate has a smaller conductivity than the matrix. This suggests that emergence of irradiation induced 2nd phase precipitate can have an impact on thermal conductivity of U3Si2 and this approach could be used to further analyze this behavior on irradiated materials.
C. SiC fiber composites
Silicon carbide is an attractive ceramic material for nuclear applications due to its high melting temperature, chemical inertness, and mechanical hardness. Reference Snead, Nozawa, Katoh, Byun, Kondo and Petti82 It exhibits resistance to radiation over a broad temperature range above room temperature, where radiation induced swelling is minimal. Reference Zinkle and Snead83 Like most ceramics SiC is brittle, making it impractical for general applications in its bulk form. However, issues associated with brittleness are mitigated when used in a composite form where SiC fibers (SiCf) are embedded in SiC matrix (SiCm). Reference Katoh, Snead, Henager, Nozawa, Hinoki, Ivekovic, Novak and de Vicente84 Mechanical strength of the composite is enhanced by introducing a thin pyrolytic carbon interphase layer that acts as a barrier for crack propagation under embrittlement conditions. Reference Katoh, Nozawa and Snead85
While the properties of bulk SiC and its radiation behavior were extensively studied, the behavior of this ceramic matrix composite (CMC) is an active area of research. Reference Katoh, Ozawa, Shih, Nozawa, Shinavski, Hasegawa and Snead86 Our specific focus here is to understand thermal transport in this composite material. TR techniques offer the capability to measure thermal properties of the matrix and fiber separately. More importantly it can be used to assess thermal interface resistance, which could be large due to the presence of the PyC interphase layer and debonding.
Figure 7 summarizes the result of our spatially resolved study on CMC based on Nicalon Type S fibers. Reference Bragg-Sitton, Barrett, van Rooyen, Hurley and Khafizov87 The bulk composite material was polished in such way that a fiber is aligned normal to the surface. The diameter of the fiber is about 20 μm. The pump is focused at the center of the fiber and the probe is scanned on the surface to map the thermal wave profile. This configuration is similar to a study on Si bicrystal interface Reference Hurley, Khafizov and Shinde88 reported previously and implements 400 nm pump and 800 nm probe beams based on Ti:sapphire femtosecond laser. One notable difference from Ref. Reference Hurley, Khafizov and Shinde88 is that for current measurement it was necessary to deposit a thin Al film.
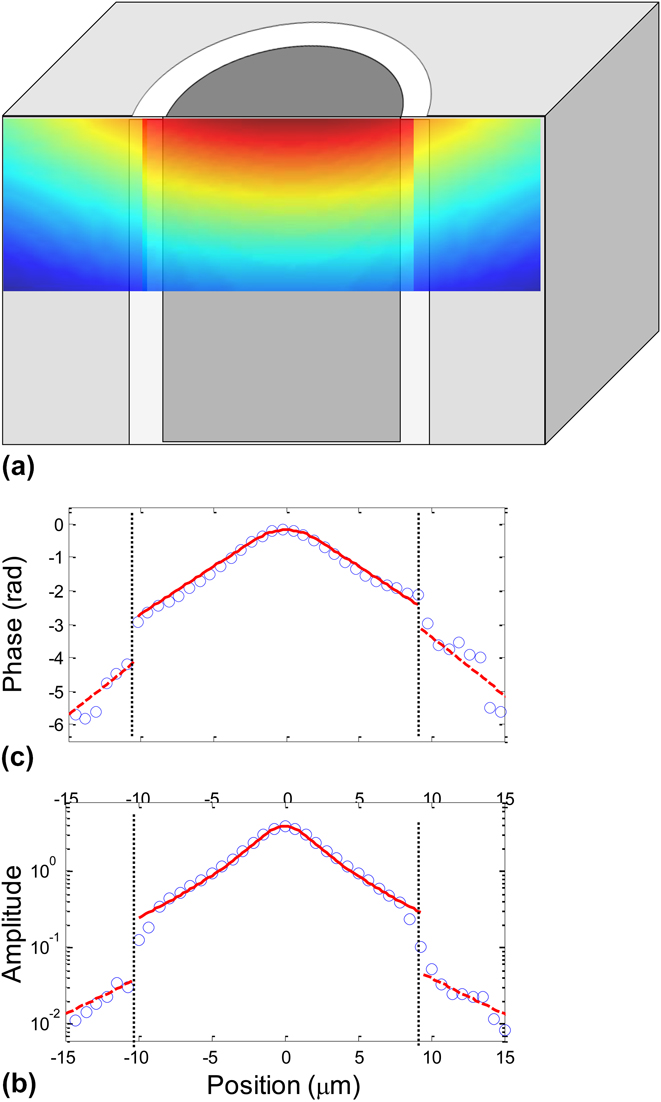
FIG. 7. Spatially resolved measurement of thermal transport in SiC fiber composites. (a) Schematics of the measured thermal wave when the pump is parked at the center of the fiber. (b) Phase and (c) amplitude profiles of the measured thermal waves. Symbols are experimental data and solid lines are modeled profiles. The step change in phase and amplitude is due to thermal interface resistance between two layers.
A representative profile for both phase and amplitude is shown in Fig. 7. The phase profiles within each individual layer are characterized by a linear dependence. These linear sections are analyzed to extract thermal conductivity for SiCf and SiCm. The fiber conductivity was found to be 19 ± 2 W/m K and matrix conductivity varied in the range 13–24 W/m K. We observe an additional phase lag acquired by the thermal wave as it crosses the interface due to interface thermal resistance. This interface resistance also manifests itself in the amplitude profile which exhibits a noticeable drop in its intensity across the interface. Such a noticeable impact of interface resistance is attributed to the presence of an additional PyC interphase layer that acts as a barrier for heat transport. The ability to measure thermal conductivity of each layer and interface resistance in composite materials opens up a possibility to improve our understanding of thermal transport in irradiated CMC composites. Reference Katoh, Ozawa, Shih, Nozawa, Shinavski, Hasegawa and Snead86
D. Practical considerations for implementation of TR techniques
In this section, we discuss the requirements for surface preparation and limitations of the TR approaches. Successful implementation of the TR methods relies on the ability to obtain optically flat surfaces in samples under investigation. This is required not only to ensure optimal reflection of the probe beam but also to satisfy the thermally flat surface assumption used in the heat diffusion model. Reference Khafizov and Hurley33 This becomes of particular concern in the TDTR measurements where high frequency modulation of the pump results in very shallow penetration of thermal waves that can be comparable to the surface roughness. Reference Weisensee, Feser and Cahill63 Optically flat surface can be achieved by implementing surface polishing techniques used in preparation of samples for characterization under scanning electron microscopes.
In case of ion beam damaged samples, an additional consideration is that if irradiation is not conducted properly it results in the surface roughness and the sample cannot be polished as this would remove the damage layer. Therefore, ion irradiation experiments need to be performed under optimal conditions otherwise resulting samples are not suitable for TR measurements. Thus far this has been the primary obstacle in our efforts related to UO2 work. In the experiments that focus on measuring interface thermal resistance, special care should be given to surface preparation as well. For these studies, it is critical to avoid development of surface topography around the interface during polishing. Reference Hurley, Khafizov and Shinde88
It should be realized that while TR approaches are effective in providing conductivity measurements with several micron resolution, they are not appropriate for investigations that require measurement of thermal properties averaged over tens of microns such as the effective conductivity of SiC fiber composites or highly porous materials. For these applications, one would rely on laser flash apparatus or infrared pyrometry. Reference Rochais, Le Meur, Basini and Domingues77
V. CONCLUSIONS
We have presented several examples demonstrating the application of TR techniques to provide spatially resolved measurement of thermal transport in nuclear materials. This technique is attractive for validation of atomic and mesoscale models and is expected to provide important input for the next generation of fuel performance codes. An important feature of TR techniques discussed in this paper is that they can be used to measure the influence of ion irradiation damage on thermal conductivity. Ion beam irradiation conditions can be tailored to study the impact of atomic level defects such as Frenkel pairs, small defect clusters, higher order defects, including dislocations, voids, bubbles, and 2nd phase precipitates. TR techniques can also be applied to measure the individual response of elements that form composite materials. Here, micron scale resolution allows measurement of thermal conductivity of each individual layer and thermal interface resistance between layers.
ACKNOWLEDGMENTS
Authors would like to acknowledge Andrew Nelson, Jason Harp, Paul Demkowicz, and Yutai Katoh for providing various samples, Xinpeng Du and Changdong Wei for assistance with TDTR measurements, and Janne Pakarinen, Beata Tyburska-Puschel, and Lingfeng He with assistance on ion beam irradiations and microstructure characterization.


 Open access