Suicide accounts for about 1 million deaths per yearReference Hawton and van Heeringen1, 2 and is also one of the major causes of death among younger age groups. Over recent decades, suicide has decreased by an average of 26% in most World Health Organization (WHO) regions,2 including in Western countries.3, Reference Chishti, Stone, Corcoran, Williamson, Petridou and Group4 We do not, however, know whether all socioeconomic groups have benefited from this decrease. Suicide is indeed more frequent in vulnerable groups such as the less educated, the poor and those of a lower social class.Reference Costello, Compton, Keeler and Angold5–Reference Li, Page, Martin and Taylor9 So far, studies have been conducted in one country onlyReference Mäki and Martikainen10, Reference Strand, Grøholt, Steingrímsdóttir, Blakely, Graff-Iversen and Næss11 or have had low statistical power.Reference Kim, Jung-Choi, Jun and Kawachi12 Given the wide variability of suicide mortality between countries, international comparative data are needed to create a better picture of the general evolution of socioeconomic inequalities in suicide. This paper describes how inequalities in suicide have evolved over recent decades in 15 European populations aged 35–79 and analyses the role of sociodemographic covariates in these trends.
Method
Data
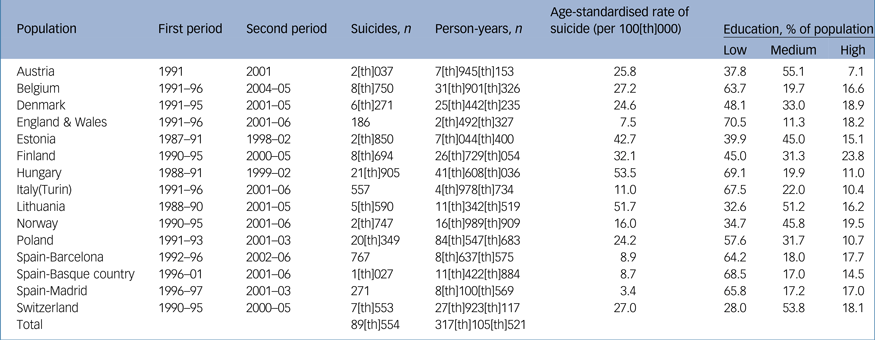
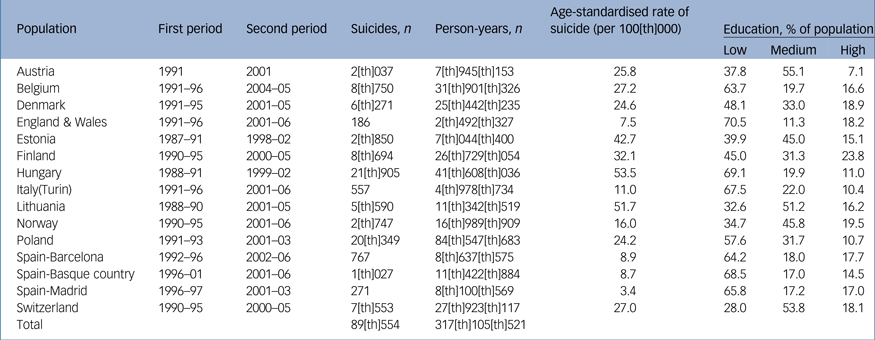
We used data from the DEMETRIQ (Developing Methodologies for Reducing Inequalities in the Determinants of Health) project, which was set up to describe trends in socioeconomic inequalities in mortality across European countries. Socioeconomic and sociodemographic data were obtained from the censuses in each country or regional area (hereafter, ‘population’), and matched with mortality registers. The populations included and the two periods compared are detailed in Table 1. The majority of the data-sets originated from longitudinal mortality follow-up of a census in which socioeconomic information on the population was recorded. Unlinked cross-sectional data, in which socioeconomic information on the population came from the census and information on deaths from death certificates, were available for Spain-Barcelona, Hungary, Poland and Estonia. Overall, more than 95% of deaths could be successfully linked to the census, except for Spain-Madrid, where only 80% of deaths could be linked and mortality rates were thus multiplied by the inverse of that proportion. All data came from national registries, except for Spain and Italy, where information was only available for certain regions. For these two populations, previous studies suggest that the inequalities in mortality observed in these regional populations are quite similar to the national ones.Reference Federico, Mackenbach, Eikemo, Sebastiani, Marinacci and Costa13–Reference Regidor, Reques, Belza, Kunst, Mackenbach and de la Fuente15 For England and Wales, a 1% random sample of the population was included; in Switzerland, non-nationals were not included. In Lithuania, cross-sectional data were available for the first period and longitudinal data for the second. Because cross-sectional data tend to overestimate inequalities in mortality, the estimates for the first period were adjusted downward, as explained elsewhere.Reference Mackenbach, Kulhanova, Artnik, Bopp, Borrell and Clemens16
Table 1 Population, follow-up duration, number of person-years, number of suicides, age-standardised rate of suicide, % of each educational status, study of 15 European populations
To allow comparison, all data were harmonised. The individuals were classified by gender and in 5-year age groups from 35 to 79. Socioeconomic status was measured by level of education and classified in three groups: low level of education (International Standard Classification for Education (ISCED), 0 to 2, up to lower secondary), medium level of education (ISCED 3–4, upper secondary), and high level of education (ISCED 5+, tertiary education). Deaths were coded using ICD-8, −9 or −10.17–19 Suicides were identified with the codes for ICD-8 (E950-E959), ICD-9 (E950-E959) and ICD-10 (X60-X84, Y87.0). Education has the advantage over alternative indicators of socioeconomic position (such as income or occupation). Education is available for each individual (not the case for occupation or income), it is specific to each individual (which is not the case for income), it is acquired early in the life cycle and thus less vulnerable to reverse causality; it is an important determinant of other socioeconomic resources as it increases long-term expected income; finally, as it is ordinal it is able to translate a gradient perspective.Reference Shaw, Galobardes, Lawlor, Lynch, Wheeler and Davey Smith20
Analysis
The analysis was carried out in four stages: (a) computation of inequalities, (b) quantification and statistical testing of trends in inequalities, (c) quantification and statistical testing of change in the structure of inequalities, and finally (d) sensitivity analysis. Guidelines call for several measures of inequality, particularly for trend analysis.Reference Keppel21 Here, four popular measures were used: the (absolute) rate difference, the (relative) rate ratio (RR), the relative index of inequality, and the slope index of inequality. The rate difference is the age-standardised suicide mortality rate of the lowest educational group minus the age-standardised suicide mortality rate of the top educational group. It captures the importance of the inequality from a public health perspective. The rate ratio is the ratio of the same two mortality rates and captures the strength of the association between education and suicide. Rates were directly age- and gender-standardised, using the WHO-European Standard Population as reference. To these simple measures we added two measures of inequality that take into account changes in educational distribution over time (i.e. the reduction of the size of the less educated groups) and differences in educational distribution across countries: the relative index of inequality and the slope index of inequality. Both are based on the relative rank of each educational group, which was computed as the cumulative relative frequency of each group up to the mid-interval of the group, sorted by decreasing educational level. As a consequence, both measures capture the gradient of socioeconomic inequalities in suicide over the whole population by fitting a slope between the outcome (suicide) and the exposure (the relative rank of each educational group). The relative index of inequality is the ratio between the suicide rate among those with the lowest educational level (rank, 1) and the suicide rate among those with the highest educational level (rank, 0). The slope index of inequality is the absolute version of the relative index of inequality and is the difference in suicide mortality between the lowest and the highest educational level.Reference Moreno-Betancur, Latouche, Menvielle, Kunst and Rey22 Inequalities were computed for two periods: 1991–1995 and 2001–2005. Average ‘all-populations’ inequalities were also computed, with suicide and number of person-years weighted so that each population–period combination had the same weight.
The second stage aimed to quantify and test change in each educational group. Suicide was regressed on education, period (dummy), and an interaction between period and education, using Poisson regression. The coefficients of the regression were then used to compute the rate ratio of suicide of the last period compared with the first period for each educational group. An overall model for all countries was also computed with a random coefficient at the country level and with each population having the same weight.
The third stage investigated whether the change in the association between education and suicide was moderated by sociodemographic factors associated with both suicide and education: gender, age and geographical region.Reference Chishti, Stone, Corcoran, Williamson, Petridou and Group4, Reference Lorant, Kunst, Huisman, Costa and Mackenbach8 We assessed how much these three sociodemographic components affected the change in the association between education and suicide between the first period and the second period, with four Poisson random-effect models. Model 1 was the baseline model, with education controlled for age and gender; interaction models were then tested with education and gender (model 2), education and age group (model 3), and education and geographical region (Western Europe, Eastern Europe, Northern Europe and Southern Europe, model 4). These models included first-order, second-order and third-order terms as well as a random component at the country level; again, each population had the same weight.
In the final stage, we carried out two sensitivity analyses. Stage 3 was replicated only with countries known to have more reliable suicide data according to two recent benchmarking studies: the first identified countries in which ‘injuries unknown whether intentional’ represented a maximum of 20% of the number of suicides;Reference Vaernik, Sisask, Vaernik, Arensman, Van Audenhove and van der Feltz-Cornelis23 the second compared the number of railway suicides as recorded in the official registers with the number of suicides declared by the European Railway Agency.Reference Reynders, Scheerder and Van Audenhove24 The countries that performed better on these two criteria were Austria, Belgium, Finland, Hungary, Norway and Spain. Step 3 was also replicated including deaths classified as ‘injuries – unknown whether intentional’ (ICD-10: Y10–Y34),19 which generally correlates highly with the suicide rate at the country level and is likely to be covert suicide.Reference Vaernik, Sisask, Vaernik, Arensman, Van Audenhove and van der Feltz-Cornelis23
Results
The age- and gender-standardised suicide rate differed strongly between countries, and was high in Eastern European populations, particularly in Hungary and Lithuania (>50 suicides per 100[th]000 person-years, Table 1). It was low in all Southern European populations, as well as in England and Wales (≤11 suicides per 100[th]000 person-years). In men (supplementary Fig. DS1a, available at https://doi.org/10.1192/bjp.2017.32), there was a clear gradient of decreasing suicide with higher education in both periods and in all countries. In women (supplementary Fig. 1b), the pattern was less clear, but noticeable gradients were found in Finland, Estonia, Lithuania and Hungary.
Trends in inequalities
For men (Table 2), inequalities remained quite stable between the first and the second period, both in absolute (rate difference) and relative (rate ratio) terms. In the first period, those in the low education group were more likely to die by suicide than those in the high education group (RR = 2.17, 95% CI 1.6–3.0). This ratio increased slightly one decade later (RR = 2.30, 95% CI 1.7–3.1). Absolute inequalities fell in Finland, Hungary and Switzerland, but rose in Lithuania and Poland. Relative inequalities increased in Belgium, Denmark, Hungary, Norway and Poland, whereas they fell in England and Wales, Estonia, Finland, Spain-Madrid and Switzerland. This pattern of change in inequalities was broadly confirmed by the relative index of inequality and by the slope index of inequality (supplementary Table DS1).
Table 2 Educational inequalities in suicide per population and period among men: rate difference and rate ratio, 15 European populations
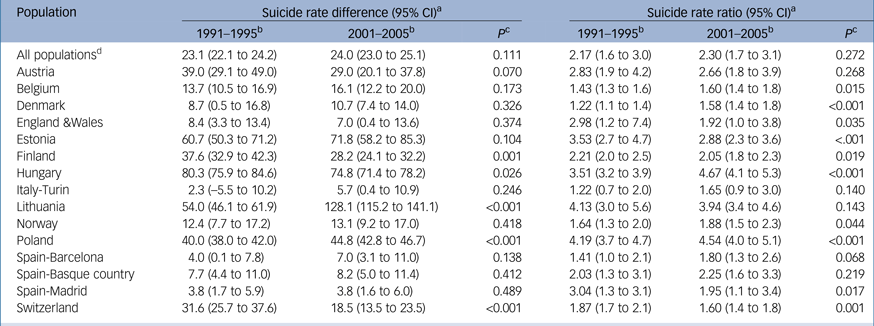
a. Rate difference is the standardised suicide mortality rate of the low education group minus the standardised suicide mortality rate of the high- education group. The rate ratio is the ratio of these two rates.
b. The period coverage varies per country. See supplementary tables for details.
c. P-value of the difference between the first and the second period.
d. All-populations estimates are the pooled and weighted results of all deaths and person-years.
For women (Table 3), absolute inequalities were low and generally non-significant in both periods. Most Eastern European populations had small but statistically significant inequalities, with more suicides among women in the low education group than among those in the high education group. In all populations, combined absolute and relative inequalities increased slightly: the rate ratio increased between the first period (RR = 0.96, 95% CI 0.8–1.2) and the second period (RR = 1.21, 95% CI 0.9–1.6, P of change = 0.081). Absolute and relative inequalities among women rose particularly in Belgium, Finland, Lithuania, Norway and Switzerland. Similar results were noted with the relative index of inequality and the slope index of inequality (supplementary Table DS2).
Table 3 Educational inequalities in suicide per population and period among women: rate difference and rate ratio, 15 European populations
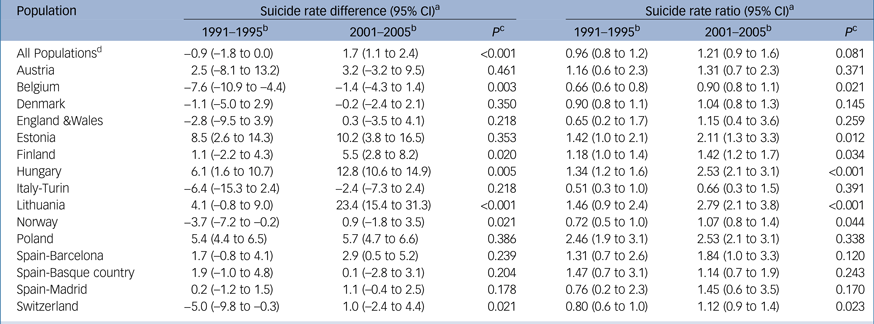
a. Rate difference is the standardised suicide mortality rate of the low education group minus the standardised suicide mortality rate of the high- education group. The rate ratio is the ratio of these two rates.
b. The period coverage varies per country. See supplementary tables for details.
c. P-value of the difference between the first and the second period.
d. All-populations estimates are the pooled and weighted results of all deaths and person-years.
Trends in suicide per educational group
The results of the Poisson regressions are presented in supplementary Table DS3 (men) and DS4 (women). Trends by educational group were very different between populations and by gender. In all populations combined, the rate of suicide among men was stable in all three education groups. In Lithuania, Denmark and Hungary, however, the trend was less favourable among the least educated compared with among the most highly educated group of men. Among women, suicide decreased more among the most highly educated (RR = 0.76, 95% CI 0.63–0.92) than among the least educated group (RR = 0.81, 95% CI 0.67–0.98, χ2 = 4.7, P<0.01). Of the 15 populations, 10 had a smaller decrease (or a greater increase) of suicide among the least educated than among the most highly educated group of women.
Trends in the structure of inequalities
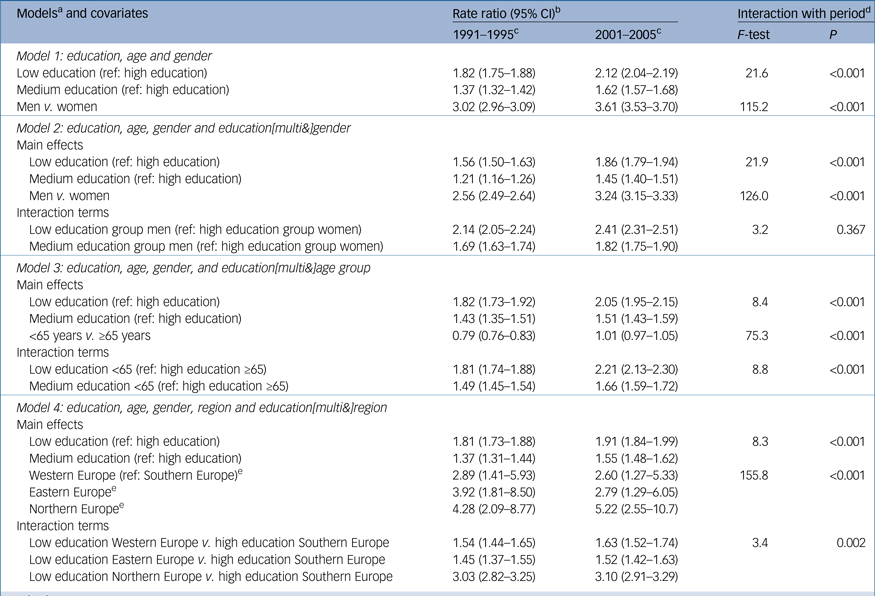
Table 4 describes how gender, age group and region moderated educational inequalities in suicide in the first and second periods. Rate ratios are presented for each period, combined with a formal test of the interaction between period and education and of the three-terms interaction between period, education and sociodemographic variable (gender, age and region). In the baseline model 1, the low education group had 1.82 times more suicides than the high education group in the first period, and this ratio rose to 2.12 in the second period (F = 21.6, P < 0.001). Men in the low education group were more likely to die by suicide than men in the high education group in both periods (RR = 2.14 and RR = 2.41, model 2), but the change between the two periods was not statistically significant. Younger age groups (<65 years) were less likely to take their own life in the first period but this was no longer true of the second period (model 3, RR = 0.79 v. RR = 1.01, F = 75.3, P < 0.001).
Table 4 Suicide risk according to education in 15 European populations in the first and second period, controlling for sociodemographic confounders: rate ratios and F-tests from the multilevel Poisson regression
Ref, reference.
a. Model 1 includes education, period, education[multi&]period, age group, gender, gender[multi&]period, and a country random component; model 2 includes age group, gender, education, education[multi&]gender, period, period[multi&]gender, period[multi&]education, and education[multi&]gender[multi&]period; model 3 includes age group, gender, education, period, education[multi&]age group, period[multi&]age group, period[multi&]education, and period[multi&]education[multi&]age group; model 4 includes education, age group, gender, region, education[multi&]region, education[multi&]period, region[multi&]period, and education[multi&]region[multi&]period. All models include a random intercept at the country level and are weighted.
b. The rate ratios and their 95% CI were computed on the basis of the betas of the previous equations.
c. The period coverage varies per country. See supplementary tables for details.
d. F-test of the interaction with period.
e. Western Europe covers Belgium, England & Wales, Switzerland and Austria; Eastern Europe includes Hungary, Poland, Lithuania and Estonia. Northern Europe includes Finland, Norway and Denmark; Southern Europe includes Turin and the three Spanish populations.]
Compared with the higher education younger age group, the younger age group with low education was at greater risk of suicide in the second period than in the first period (model 3, RR = 1.81 v. RR = 2.21, F = 8.8, P < 0.001). Model 3 also displayed a sharp decline in the F-test for change in educational inequalities (model 3, F = 8.4 v. model 1 F = 21.6), indicating that increasing educational inequalities were partly a result of the younger age group within the low education group becoming more vulnerable: (2.12/1.82 = 1.16 in model 1 v. 2.21/1.81 = 1.22 in model 3). A change in the regional differences in suicide mortality was noticeable and statistically significant (model 4, F = 155.8, P < 0.001). Compared with Southern European countries, Eastern European countries had a lower rate ratio in the second period than in the first (RR = 2.79 v. RR = 3.92, model 4). Compared with those in the low education group in other regions, those in the low education group in Northern European countries were more at risk of suicide both in the first and second periods (RR = 3.03 and RR = 3.10).
Table 4 was replicated in a subgroup of populations (Austria, Belgium, Finland, Hungary, Norway and Spain, supplementary Table DS5) where suicide coding is more reliable. Overall, inequalities were smaller, but levels of significance and F-test patterns remained the same. The same interactions were found, with one difference: men in the low education group from Northern European countries were more at risk of suicide in the second period (RR=4.05) than in the first (RR = 2.81). The second sensitivity analysis added 10[th]693 deaths classified as ‘injury unknown whether intentional’ to the number of suicides (supplementary Table DS6). The ratio of ‘injury unknown whether intentional’ to suicide was thus 12%, well below the benchmark of 20%. In this analysis, all rate ratios and F-tests were higher in the first period and in the second period. However, the F-test patterns were also quite similar to those found in the baseline analysis.
Discussion
This study is the first to assess trends in educational inequalities in suicide in Europe in populations aged 35–79. Among men, absolute and relative inequalities were substantial in both periods and generally did not decrease over time, whereas among women inequalities were absent in the first period and emerged in the second. However, the trend of inequality differed strongly between countries.
Interpretation
The results are in line with previous studies that found a protective effect of higher education on suicide in the USAReference Denney, Rogers, Krueger and Wadsworth25 EuropeReference Lorant, Kunst, Huisman, Costa and Mackenbach8 and AsiaReference Kim, Jung-Choi, Jun and Kawachi12 and that educational inequalities in suicide were not decreasing.Reference Kim, Jung-Choi, Jun and Kawachi12 We identified three elements that explain this unfavourable trend, in relation to gender, age and geographical region. One reason suicide inequalities have increased is that men have become more at risk of suicide over time and, at the same time, have come to be slightly less educated than women. This is consistent with previous studies that have shown that men are more vulnerable to suicide and also that the social consequences of a psychiatric disorder are greater for men than for women.Reference Kessler, Heeringa, Lakoma, Petukhova, Rupp and Schoenbaum26 Thus, as the proportion of men in the low education group is increasing, educational inequality is likely to increase as a consequence. Other studies have also found socioeconomic status to have a smaller effect on suicide in women than in men.Reference Li, Page, Martin and Taylor9, Reference Maki and Martikainen27 One possibility is that women are less vulnerable to adverse conditions, as compared with men, as evidenced by, for example the smaller effect of economic recessions on suicide in women compared with men.Reference Garcy and Vagerö28 Another may be that education does not fully capture socioeconomic status in women, as compared with men, particularly in relation to the labour market or that lower educated men are more likely to be single or divorced compared with women.Reference Lorant, Kunst, Huisman, Bopp, Mackenbach and Group29
Second, we found that younger age groups became as likely to die by suicide as those aged 65+ in the second period, leaving young people in the low education group at greater risk of suicide in the second period than in the first. Western European countries underwent a dramatic educational expansion after the Second World War, a trend that has benefitted the younger age groups. Yet, paradoxically, this educational trend may have left the group of young people unable to keep up with this educational trend more vulnerable. As acknowledged by the Organisation for Economic Co-operation Development, the wage ratio of the most skilled to least skilled has widened between the 1980s and 2000s, and these trends were particularly noticeable in Eastern European countries.30, Reference Heyns31 A final explanatory factor is provided by regional differences: inequalities rose in some Northern and Eastern European countries but remained low in Southern European countries, as well as in England and Wales. From our analysis, it is not entirely clear why this is the case. As far as Eastern European countries are concerned, market reforms associated with the transition to a market economy may have affected the less educated to a larger extent than the more highly educated.Reference Leinsalu, Stirbu, Vagero, Kalediene, Kovacs and Wojtyniak32
Finally, our study found that absolute inequalities did not decrease, which is different from the pattern for other causes of mortality.Reference Mackenbach, Kulhanova, Artnik, Bopp, Borrell and Clemens16 The persistence of absolute inequalities suggests that the benefits of mental health reforms or new mental healthcare interventions have not been shared by all socioeconomic strata. Because mental disorder is one important contributor to suicide, early detection of and appropriate drug treatment of mental disorderReference Gusmão, Quintão, McDaid, Arensman, Van Audenhove and Coffey33 and coordination of mental healthcare, particularly after discharge, are strategies that may not only reduce the overall risk of suicide but – in the case of inequalities in access to care – may also widen suicide inequalities.Reference Qin, Agerbo and Mortensen34 For example, the introduction of selective serotonin reuptake inhibitors in the 1980s in the USA was associated with a reduction in the risk of suicide but also with an increase in inequality in suicide.Reference Clouston, Rubin, Colen and Link35 This may also apply to broader organisational aspects of mental healthcare.Reference Lorant, Grard, Van Audenhove, Helmer, Vanderhaegen and Nicaise36
Limitations
This study has several limitations. Our data allowed us to describe educational inequalities and their trends over time but was lacking in information on the underlying factors of suicide. In particular, the role of psychiatric history, or alcohol use was lacking, which would have been useful to ascertain the role of the psychiatric system or of the drinking culture in suicide inequalities, particularly in eastern countries.Reference Mäki and Martikainen37, Reference Ramstedt38 Other social resources such as social support, marital status, employment and the welfare system have also been associated with lower suicide risk and may thus also contribute to educational inequalities in suicide.Reference Garcy and Vagerö28, Reference Lorant, Kunst, Huisman, Bopp, Mackenbach and Group29, Reference Kleiman and Liu39, Reference Milner, McClure and De Leo40 Moreover, although education is acquired early in life, we cannot exclude the possibility that some risk factors for suicide are antecedent to primary educationReference Kessler, Foster, Saunders and Stang41 and may explain why less educated people are more likely to die by suicide. The finding that educational inequalities are smaller among women than among menReference Denney, Rogers, Krueger and Wadsworth25 also suggests that more research is needed in order to better understand the association between education and suicide. Another limitation is that the period covered does not include the 2008 economic crisis. Further research will be needed to study the effect of this crisis on educational inequalities in suicide. Finally, the comparison across countries is somewhat vulnerable to the reliability of suicide coding across countries. A previous benchmarking study compared railway suicide as recorded in official statistics with suicides reported by the European Railway Agency.Reference Reynders, Scheerder and Van Audenhove24 It found that the ranking of countries by suicide rate changed when based on the latter source rather than the former, particularly when undetermined intent was added. However, our sensitivity analysis suggests this limitation has no major effect on our findings.
Our study suggests that the prospects of meeting the goals of the WHO Mental Health Action Plan are not good in several European populations, as less educated groups have remained more vulnerable to suicide. More attention to vulnerable men with lower educational levels needs to be a more explicit priority of mental healthcare systems and mental health policy.
Funding
V.L. was in receipt of a FNRS grant number 2015/V 3/2/165 - IB/MAA – 10. Supported by a grant (FP7-CP-FP no 278511) from the European Commission Research and Innovation Directorate General, as part of the ‘Developing methodologies to reduce inequalities in the determinants of health’ (DEMETRIQ) project. The sponsor had no role in the study design, in the collection, analysis, and interpretation of data, in the writing of the report, or in the decision to submit the article for publication.
Supplementary material
To view supplementary material for this article, please visit https://doi.org/10.1192/bjp.2017.32.




eLetters
No eLetters have been published for this article.