Geographical studies show that populations of areas with greater material deprivation have higher rates of psychoses (Reference Dauncey, Giggs and BakerDauncey et al, 1993; Reference Harrison, Barrow and CreedHarrison et al, 1995; Reference Harvey, Pantelis and TaylorHarvey et al, 1996; Reference Boardman, Hodgson and LewisBoardman et al, 1997) and that urban areas have a greater risk of psychoses compared with rural areas (Reference Lewis, David and AndreassonLewis et al, 1992; Reference Marcelis, Navarro-Mateu and MurrayMarcelis et al, 1998; Reference Mortensen, Pedersen and WestergaardMortensen et al, 1999; Reference Allardyce, Morrison and McCreadieAllardyce et al, 2000). Also, the association with deprivation may apply to urban but not rural areas (Reference Thornicroft, Bisoffi and De SalviaThornicroft et al, 1993). Although strong associations are shown for area-based indices of deprivation and psychosis they may not fully describe the ecological relationship. Faris & Dunham (Reference Faris and Dunham1939) and Hare (Reference Hare1956) recognised the importance of social disorganisation, fragmentation and isolation in the onset of mental disorders and more recent reports support this proposition (Reference van Os, Driessen and Gunthervan Os et al, 2000). Congdon (Reference Congdon1996) has proposed a census-based index measuring anomie (social fragmentation) and we used this to examine the relative impact of social fragmentation, material deprivation and urbanicity/rurality on first-admission rates to hospital for psychosis, using a Scottish national data-set for the period 1989–1993.
METHOD
To allow chronological matching, we identified cases in which hospital admission occurred during the period 1989–1993, and used information on social factors from the 1991 national census to calculate categories of deprivation, social fragmentation and urban/rural classification.
Case identification
The Scottish Office Information and Statistics Division collates in-patient activities in Scottish hospitals. All psychiatric facilities return a form (SMR04) for each patient after an in-patient stay; this form provides both demographic and diagnostic information. During the period 1989–1993 the main diagnoses were coded according to ICD–9 (World Health Organization, 1978). The record linkage section of the Information and Statistics Division identified for this period all cases with a discharge diagnosis of schizophrenia (code 295), schizoaffective disorder (295.6), delusional disorder (297), mania (296.0, 296.2, 296.4), acute, transient or unspecified psychotic disorder (298) or drug-induced disorder (292.1), in which the patient had had no previous admission (in Scotland) for any of the above psychotic diagnoses. We excluded patients over the age of 64 years (as there is likely to be significant diagnostic difficulty with elderly people) and those without a permanent address in Scotland.
Population at risk
The population of Scotland was determined at around 5 million (all age groups) throughout the study period. At the 1991 census only 2.8% of the population had been born outside of the UK. The General Register Office of Scotland provided detailed population data for the 5-year period stratified by age, gender and postcode sector (an area with an average population of 5000 considered of sufficient size to provide fairly reliable rates for health events; Reference Carstairs and MorrisCarstairs & Morris, 1991).
Area-based measures
Area-based measures were calculated for every postcode.
Social fragmentation
We calculated social fragmentation using information from the 1991 census on mobility in the previous year, number of privately rented households, single-person households and number of unmarried persons (Reference CongdonCongdon, 1996). The social fragmentation index for each postcode sector was calculated by adding the z scores (the number of standard deviations above or below the population mean when the underlying distribution is normal) for each of the four characteristics. The scores ranged from -4.8 to 33.79. For the purpose of the analysis presented here we collapsed the index into categories, created by quartiles. However, because there was a strong positive skew in the distribution of the social fragmentation scores, the upper quartile was divided at the 90th percentile, creating five categories – category 1 being the most socially cohesive area and 5 the most socially fragmented.
Material deprivation
Material deprivation was measured using Carstairs scores, the indicators routinely used in Scotland (Reference Carstairs and MorrisCarstairs & Morris, 1991). Carstairs scores correlate highly with other commonly used indices of deprivation (Townsend 0.96, Jarman 0.83). The scores were calculated using the 1991 census data for overcrowding, male unemployment, low social class and no car. The postcode sector scores range from -8.5 (most affluent) to 12.8 (most deprived). The deprivation scores for each postcode sector are transformed routinely into categories, using pre-defined cut-off scores, which range from category 1 (most affluent) to 7 (most deprived) (Reference McLooneMcLoone, 1995).
Urban/rural index
We measured the urban/rural index using data from the 1991 census and the official Scottish classification (Reference Carstairs and MorrisCarstairs & Morris, 1991). The degree of urbanicity is calculated for each postcode sector by adding to the population total the population of each directly adjacent neighbourhood: category 1 is most urban, and category 5 and 6 are the most rural.
Analysis
Using the indirect standardisation method we calculated standardised (first) admission ratios by category of social fragmentation, deprivation and urban/rural classification. For each (10-year) age and gender band we used both the national first-admission rates and the rates for stratum 1 of each social characteristic as the reference. Next, we calculated the age/gender-adjusted admission rates for first-ever psychosis for each postcode sector in order to model their dependence on social fragmentation, adjusting for deprivation category and urban/rural index. As there was evidence of overdispersion in the admission rates they could not be adequately modelled. To overcome this the admission rate distribution was dichotomised into the high-rate quintile (rate lies within the top 20% of admission rates) and the remainder. Logistic regression analysis was used to determine whether social fragmentation, deprivation and urban/rural index were independently associated with first admission rates classified as ‘high’. A sensitivity analysis was carried out using the 75th percentile and the 85th percentile to check whether the actual cut-off point used to define high rates was critical in the interpretation of the results.
RESULTS
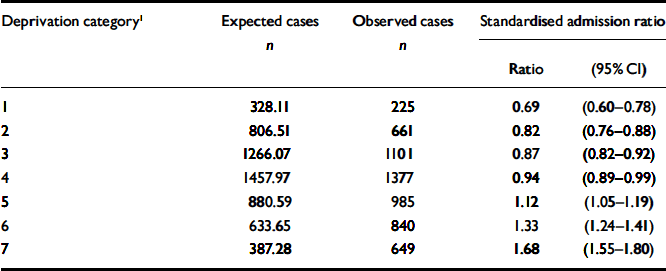
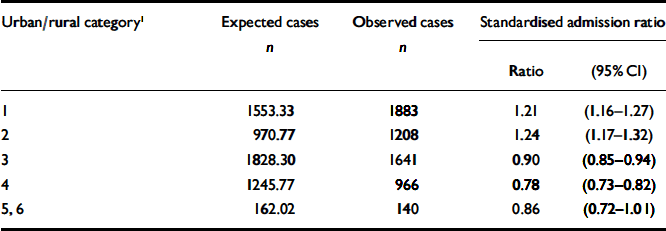
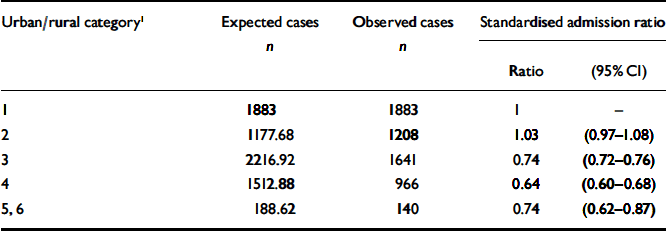
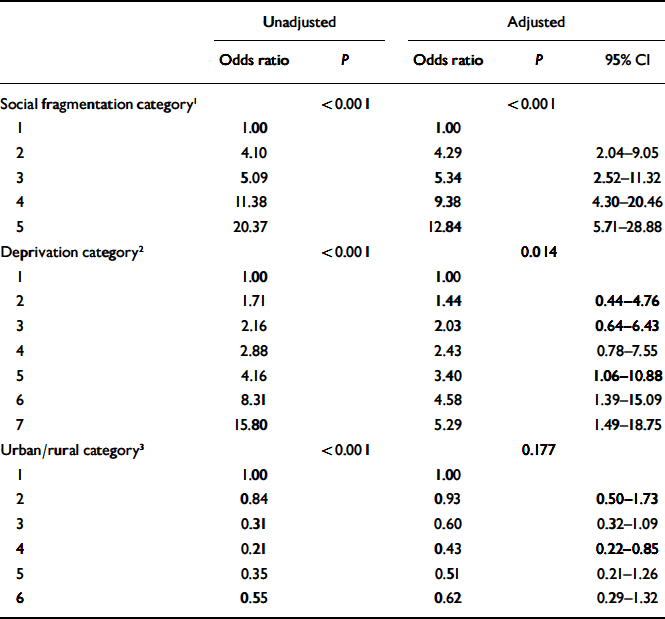
The SMR04-linked data-set contained 5858 cases eligible for inclusion; 20 (0.34%) had missing or unknown postcodes and 5838 cases were therefore entered into the analysis. Tables 1, 2, 3, 4, 5, 6 show the standardised admission ratios categorised according to fragmentation (Tables 1, 2), deprivation category (Tables 3 and 4) and urban/rural level (Tables 5 and 6). The odds ratios that social fragmentation, deprivation and urbanicity measures predict standardised first-ever psychosis admission rates are shown in Table 7.
Table 1 Standardised admission ratios for social fragmentation (using national rates as reference)

| Social fragmentation category1 | Expected cases n | Observed cases n | Standardised admission ratio | |
|---|---|---|---|---|
| Ratio | (95% CI) | |||
| 1 | 1858.15 | 1434 | 0.77 | (0.73-0.81) |
| 2 | 1605.92 | 1466 | 0.91 | (0.87-0.96) |
| 3 | 1149.25 | 1219 | 1.06 | (1.00-1.06) |
| 4 | 655.31 | 932 | 1.42 | (1.33-1.51) |
| 5 | 491.56 | 787 | 1.60 | (1.49-1.71) |
Table 2 Standardised admission ratios for social fragmentation (using category 1 as reference rate)

| Social fragmentation category1 | Expected cases n | Observed cases n | Standardised admission ratio | |
|---|---|---|---|---|
| Ratio | (95% CI) | |||
| 1 | 1434 | 1434 | 1 | — |
| 2 | 1243.16 | 1466 | 1.18 | (1.12-1.24) |
| 3 | 890.97 | 1219 | 1.37 | (1.29-1.44) |
| 4 | 576.9 | 932 | 1.84 | (1.78-1.90) |
| 5 | 376.25 | 787 | 2.09 | (1.95-2.24) |
Table 3 Standardised admission ratios for deprivation (using national rates as reference)

| Deprivation category1 | Expected cases n | Observed cases n | Standardised admission ratio | |
|---|---|---|---|---|
| Ratio | (95% CI) | |||
| 1 | 328.11 | 225 | 0.69 | (0.60-0.78) |
| 2 | 806.51 | 661 | 0.82 | (0.76-0.88) |
| 3 | 1266.07 | 1101 | 0.87 | (0.82-0.92) |
| 4 | 1457.97 | 1377 | 0.94 | (0.89-0.99) |
| 5 | 880.59 | 985 | 1.12 | (1.05-1.19) |
| 6 | 633.65 | 840 | 1.33 | (1.24-1.41) |
| 7 | 387.28 | 649 | 1.68 | (1.55-1.80) |
Table 4 Standardised admission ratios for deprivation (using category 1 as reference rate)

| Deprivation category1 | Expected cases n | Observed cases n | Standardised admission ratio | |
|---|---|---|---|---|
| Ratio | (95% CI) | |||
| 1 | 225 | 225 | 1 | — |
| 2 | 558.09 | 661 | 1.18 | (1.09-1.27) |
| 3 | 880.35 | 1101 | 1.25 | (1.18-1.32) |
| 4 | 1019.05 | 1377 | 1.35 | (1.28-1.45) |
| 5 | 618.00 | 985 | 1.59 | (1.49-1.69) |
| 6 | 478.33 | 840 | 1.76 | (1.64-1.87) |
| 7 | 272.70 | 649 | 2.38 | (2.20-2.56) |
Table 5 Standardised admission ratios categorised by urban/rural index (using national rates as reference)

| Urban/rural category1 | Expected cases n | Observed cases n | Standardised admission ratio | |
|---|---|---|---|---|
| Ratio | (95% CI) | |||
| 1 | 1553.33 | 1883 | 1.21 | (1.16-1.27) |
| 2 | 970.77 | 1208 | 1.24 | (1.17-1.32) |
| 3 | 1828.30 | 1641 | 0.90 | (0.85-0.94) |
| 4 | 1245.77 | 966 | 0.78 | (0.73-0.82) |
| 5, 6 | 162.02 | 140 | 0.86 | (0.72-1.01) |
Table 6 Standardised admission ratios categorised by urban/rural index (using category 1 as reference rate)

| Urban/rural category1 | Expected cases n | Observed cases n | Standardised admission ratio | |
|---|---|---|---|---|
| Ratio | (95% CI) | |||
| 1 | 1883 | 1883 | 1 | - |
| 2 | 1177.68 | 1208 | 1.03 | (0.97-1.08) |
| 3 | 2216.92 | 1641 | 0.74 | (0.72-0.76) |
| 4 | 1512.88 | 966 | 0.64 | (0.60-0.68) |
| 5, 6 | 188.62 | 140 | 0.74 | (0.62-0.87) |
Table 7 Odds ratios for area measures of social fragmentation, deprivation and urbanicity predicting ‘high’ first-admission rates for psychosis

| Unadjusted | Adjusted | ||||
|---|---|---|---|---|---|
| Odds ratio | P | Odds ratio | P | 95% CI | |
| Social fragmentation category1 | <0.001 | <0.001 | |||
| 1 | 1.00 | 1.00 | |||
| 2 | 4.10 | 4.29 | 2.04-9.05 | ||
| 3 | 5.09 | 5.34 | 2.52-11.32 | ||
| 4 | 11.38 | 9.38 | 4.30-20.46 | ||
| 5 | 20.37 | 12.84 | 5.71-28.88 | ||
| Deprivation category2 | <0.001 | 0.014 | |||
| 1 | 1.00 | 1.00 | |||
| 2 | 1.71 | 1.44 | 0.44-4.76 | ||
| 3 | 2.16 | 2.03 | 0.64-6.43 | ||
| 4 | 2.88 | 2.43 | 0.78-7.55 | ||
| 5 | 4.16 | 3.40 | 1.06-10.88 | ||
| 6 | 8.31 | 4.58 | 1.39-15.09 | ||
| 7 | 15.80 | 5.29 | 1.49-18.75 | ||
| Urban/rural category3 | <0.001 | 0.177 | |||
| 1 | 1.00 | 1.00 | |||
| 2 | 0.84 | 0.93 | 0.50-1.73 | ||
| 3 | 0.31 | 0.60 | 0.32-1.09 | ||
| 4 | 0.21 | 0.43 | 0.22-0.85 | ||
| 5 | 0.35 | 0.51 | 0.21-1.26 | ||
| 6 | 0.55 | 0.62 | 0.29-1.32 | ||
Univariate analysis showed a very significant association for social fragmentation category, deprivation category and urban/rural index with ‘high rate’ postcode sectors. In the adjusted model this very significant association remained for social fragmentation only. There was no significant interaction between social fragmentation, deprivation and the urban/rural index in the model.
The model is a good fit to the data (Hosmer–Lemeshow test, P = 0.78) and the results are essentially the same using the 75th and 85th percentiles as the cut-off for defining high admission rate.
DISCUSSION
Main findings
Social fragmentation
This study suggests that areas characterised by high social fragmentation have higher first-ever admission rates for psychosis independent of deprivation and urban/rural status. There is a clear monotonic gradient in the relationship between social fragmentation and first-ever admission rates for psychosis. The odds that a postcode from the most fragmented category has a high admission rate is 12.8 (95% CI 5.7–28.9) times the odds for a postcode from the least fragmented areas.
We are unaware of any recently published work exploring rates of psychosis with composite measures of social fragmentation. Faris & Dunham (Reference Faris and Dunham1939) recognised urban areas with high rates of psychiatric morbidity to be characterised by social disintegration, excessive residential mobility, ethnic conflict, communication breakdown and lack of consensus. Social isolation leading to mental health inequality was suggested by Hare (Reference Hare1956), who found an ecological correlation with single-person households in Bristol and rates of first admission for schizophrenia. A more recent study has shown area-based measures of single and divorced residents to be associated with higher first-contact rates for psychosis, independent of a number of neighbourhood social and demographic characteristics and individual measures of age, gender and marital status (Reference van Os, Driessen and Gunthervan Os et al, 2000). Thornicroft et al (Reference Thornicroft, Bisoffi and De Salvia1993) demonstrated that in urban areas the proportion of unmarried people and the proportion of people living alone were strongly correlated with admissions for psychosis.
Material deprivation
Our results are consistent with previous work demonstrating an association between admissions for psychosis and population-based measures of material deprivation (Reference Harrison, Barrow and CreedHarrison et al, 1995; Reference Boardman, Hodgson and LewisBoardman et al, 1997; Reference Koppel and McGuffinKoppel & McGuffin, 1999). We show this association to hold for first-admission data also. Adjustment for social fragmentation and urbanicity in our logistic model weakened the association. Although Thornicroft et al (Reference Thornicroft, Bisoffi and De Salvia1993) found an association between deprivation and service utilisation rates for psychosis in south Verona (an urban area), there was no relationship in the same study with deprivation in the rural area of Portogruaro. However, we found no interaction of deprivation and urban/rural terms in our model, i.e. the effect of deprivation does not vary across urban/rural categories. We studied all postcodes in Scotland, allowing examination of rural areas heterogeneous for material and social deprivation. The 11 rural districts in the Italian study might have been too similar to detect any association in this relatively small area.
Urban/rural variation
The urban/rural differences in admission rates for psychoses demonstrated in this study have been well documented in previous studies (Reference Marcelis, Navarro-Mateu and MurrayMarcelis et al, 1998; Reference Mortensen, Pedersen and WestergaardMortensen et al, 1999; Reference Allardyce, Boydell and van OsAllardyce et al, 2001). However, we have not shown a statistically significant variation in admission rates with urbanicity after adjustment for social fragmentation and deprivation. It is therefore possible that deprivation and social fragmentation are important explanatory factors in the urban effect seen in previous studies.
Methodological considerations
Data-set and admission rate calculations
The SMR04 data-set provides national, comprehensive (100% coverage) information for in-patient care over three decades in Scotland. The usefulness of such a data-set depends on the accuracy of its information, and despite earlier criticism (Reference Kendrick and ClarkeKendrick & Clarke, 1993) the quality of the SMR04 data is now considered good (Reference Harley and JonesHarley & Jones, 1996). The quantity of the data should reduce the effect of variation in local coding practices, but some variation due to regional differences may remain; we have used the broad diagnostic category ‘psychosis’ to calculate first-ever admission rates as it is likely to have the greatest diagnostic consistency (Reference Allardyce, Boydell and van OsAllardyce et al, 2001).
We examined admission rates from the fine-grain level of postcode sectors and have offset the possible disadvantage of low numbers by taking admissions over a 5-year period and using a dichotomised outcome measure. Admission rates reflect only the met demand for in-patient care, and it is possible that areas with better community facilities and day hospital provision will use fewer beds; however, this assumption is not supported for psychosis (Reference Jarman, Hirsch and WhiteJarman et al, 1992; Reference Flannigan, Glover and WingFlannigan et al, 1994). In Scotland during the period of study, there was no specific day care alternative to admission for people with severe mental illness.
Measures of area-based exposures
The area-based measures of deprivation and social fragmentation were generated from aggregation of census-based variables. The census is the only source of objective and uniform data for the entire population and therefore any proxy measure is constrained by the data available from it. As a sound conceptual base for either social fragmentation (social cohesion) or deprivation is lacking, there is no absolute underlying theory in the selection of variables used in the aggregate scores (Reference Carr-HillCarr-Hill, 1988). The demographic factors we used to measure fragmentation – namely non-married adults, one-person households, population turnover and private renting – may not in themselves be valid indicators of social fragmentation, or may adequately measure social fragmentation in some areas but not in others. For example, in urban areas the combination of young, single people living in non-family households may not measure disorganised communities but rather communities with young professionals or students (Reference CongdonCongdon, 1996). Similarly, the individual census variables chosen may reflect deprivation in some areas better than others. For example, overcrowding is an almost exclusively urban phenomenon and is likely to be irrelevant in identifying deprivation in rural areas. Lack of a car may be an indicator of deprivation in an urban context, but possession of a car in rural areas may be almost a necessity. In rural areas car ownership is highly correlated with remoteness rather than socio-economic group (Reference Midwinter, Mair and MoxenMidwinter et al, 1988).
As a population census is only performed every 10 years in the UK, it is more than possible that an area's characteristics may change during this time with obviously no concomitant change in the census aggregated score. However, as we have analysed data from the period 1989–1993, area-based measures and admission data are chronologically matched.
There is no universally accepted definition of ‘rural’. Characteristics may include open spaces, green scenery, agricultural activities, remoteness and lack of people. Most published work has used quantitative definitions of ‘urban/rural’, but as there is no point on the continuum from large agglomerations to small clusters or scattered dwellings where ‘urban’ disappears and ‘rural’ begins, the division between urban and rural population will always be arbitrary. Despite these methodological limitations, area-based measures are increasingly used in public health research and practice (Reference Smith and HartSmith & Hart, 1999).
It is unlikely that any area, however small, will be totally homogeneous for exposure levels of deprivation, social fragmentation and urban/rural characteristics. This is especially so if the geographical categorisation is logistical, as in postcode sectors. However, in Scotland postcode sectors are more socioculturally homogeneous than elsewhere in the UK (Reference Reijneveld, Verheij and de BakkerReijneveld et al, 2000). Although area-based measures may not apply equally to all individuals within an area, all these individuals are exposed to living in a neighbourhood with (for example) low social fragmentation or high deprivation levels. Social characteristics such as social fragmentation in our society are likely to have profound effects on health and yet are incompletely captured and described by individual approaches to measurement.
Ecological study design
This is an area-based study comparing groups rather than individuals, allowing the ecological effects of constructs conceptualised at the group/area level, such as social fragmentation, deprivation and urban/rural categories, to be demonstrated. A study with both individual and ecological information would allow us to look at the person–environment interaction, which would be very informative; however, data at the individual level were not available.
Finally, standardised (first) admission ratios may not be the best way of comparing morbidity in different geographical areas, because each subgroup is adjusted to a different standard. These ratios are, however, fairly robust with respect to the violation of the assumption of proportionality (Reference Court and ChengCourt & Cheng, 1995). This method has the advantage over direct standardisation in that it has a smaller variance. The wide confidence intervals that would be generated by other methods of standardisation would cause difficulty in interpreting the results and might be misleading. We have complemented the standardised admission ratios analysis with a logistic regression model.
Clinical implications
Association does not imply causality. Living in a socially fragmented deprived area may precipitate a first episode of psychosis (social causation hypothesis); alternatively, individuals predisposed to psychosis may drift into or out of or be left in areas (social selection). It is also possible that some other variable might be confounding the effect and the deprivation and social fragmentation indices are simply proxy measures. Our study suggests, whatever the underlying mechanism, that both material deprivation and social fragmentation are likely to influence first-admission rates for psychosis at area level. However, we found social fragmentation to have the greatest effect. The observed health inequalities appear to be mediated by both material deprivation and social fragmentation. Deprivation scores such as Carstairs indices are often used to measure health inequalities between areas, but our results suggest that this would not fully describe the ecological relationship and that other measures of societal influences should be explored if we wish to clarify and tackle this inequality.
We are unable to determine whether the area-based measures operate at the individual (compositional) or at the macro-environmental (contextual level). Further studies with individual and area-based measures of social fragmentation and deprivation and the onset of psychosis would clarify the relative importance of the personal and area characteristics.
Clinical Implications and Limitations
CLINICAL IMPLICATIONS
-
▪ Area-level measures of social fragmentation have a strong influence on first-admission rates for psychoses.
-
▪ The association between deprivation and admission rates to hospital holds for first-ever admission rates for psychosis.
-
▪ Deprivation alone may not best describe the ecological relationship for admission rates for psychosis, so that causation is necessary when using such measures to inform changes in healthcare provision and service development.
LIMITATIONS
-
▪ The study was hampered by the lack of a generally accepted measure of rurality.
-
▪ Social fragmentation and deprivation indices may not measure material deprivation in rural areas as accurately as in urban areas.
-
▪ Causal inferences could not be generated owing to the cross-sectional study design.


eLetters
No eLetters have been published for this article.