People with severe mental illness (SMI) experience an excess of coronary heart disease (CHD) morbidity and mortality (Reference BrownBrown, 1997; Reference Phelan, Stradins and MorrisonPhelan et al, 2001). Mortality rates for cardiovascular disease in this group are increasing, and it is CHD, not suicide, that is the biggest killer (Reference Hansen, Jacobsen and ArnesenHansen et al, 2001; Reference Lawrence, Holman and JablenskyLawrence et al, 2003). This may be exacerbated by the metabolic and endocrine effects of antipsychotics, including weight gain (Reference BlackburnBlackburn, 2000) and impaired glucose homoeostasis (Reference HaddadHaddad, 2004). There has been little systematic comparative research regarding CHD risk factors and involving representative samples. The National Institute for Clinical Excellence (2002) guidelines on schizophrenia emphasise cardiovascular ill health, but identify little good-quality research, deeming this field a major priority. Specifically, the current absence of evidence regarding lipid profiles is notable in guidelines from both Europe and the USA (Drug and Therapeutics Bulletin, 2004; Reference Marder, Essock and MillerMarder et al, 2004).
We aimed to compare the prevalence of the four most important risk factors for CHD (Reference Khot, Khot and BajzerKhot et al, 2003) in people with and without SMI in primary care, and to compare the overall Framingham CHD risk scores (Reference Hingorani and VallanceHingorani & Vallance, 1999). One of our secondary aims was to investigate the role of socio-economic variables in any relationship between CHD risk and schizophrenia. Such factors have often been ignored, despite the fact that schizophrenia is strongly associated with adverse socioeconomic circumstances (Reference Agerbo, Byrne and EatonAgerbo et al, 2004), as are CHD mortality and CHD risk factors (Reference Brunner, Shipley and BlaneBrunner et al, 1999). Our other secondary aim was to investigate any association between antipsychotic medication and CHD risk.
METHOD
We invited patients from seven general practices in North London to attend for CHD risk factor screening at their practice (Reference Osborn, King and NazarethOsborn et al, 2003). Invitations were sent by letter, followed by up to three telephone calls. We invited all patients with a practice-computer diagnosis of schizophrenia, schizoaffective disorder or other non-affective chronic psychotic illness of more than 1 year's duration. We also invited a comparison group (approximately twice the size of the SMI group), without a psychotic illness, and chosen at random by the general-practice computer. To calculate the Framingham risk score we only invited people aged between 30 and 75 years who, according to their general practice record, had no pre-existing CHD. We estimated that we would need to recruit 75 patients with and 150 patients without SMI to enable us to demonstrate previously reported differences in individual CHD risk factors at 90% power and a 5% level of significance. This was based on published conservative differences in smoking prevalence (Reference KendrickKendrick, 1996) and unpublished data on total cholesterol levels from a small study of dietary factors and schizophrenia (Reference McCreadie, Macdonald and BlacklockMcCreadie et al, 1998; R. McCreadie, personal communication, 2000). In this study, the mean total cholesterol level in males with schizophrenia was 5.4 mmol/l (s.d.=0.9), compared with 5.0 mmol (s.d.=0.8) in controls matched for age and employment status.
We collected data on age, gender, self-reported smoking status, prescribed medication and a number of socio-economic and demographic variables at interview. Recall of general practice diagnosis of ischaemic heart disease or diabetes mellitus was noted, as was the most recent body mass index measurement. The first two questions of the Rose Angina Questionnaire were used to screen further for undiagnosed ischaemic heart disease (Reference Cook, Shaper and MacfarlaneCook et al, 1989). Blood pressure was measured at the beginning and end of the interview using an automated sphygmomanometer (Reference Whincup, Bruce and CookWhincup et al, 1992), and the mean value was determined. A non-fasting blood sample was taken for measurement of total cholesterol, high-density-lipoprotein (HDL)-cholesterol and random glucose levels. The Framingham risk score was calculated using commercial software (Reference Hingorani and VallanceHingorani & Vallance, 1999). This risk score is an algorithm of age, gender, HDL-cholesterol level, total cholesterol level, blood pressure, smoking and diabetic status. The scores are well established and are more powerful predictors of future CHD than individual risk factors. The absolute CHD risk score may underestimate ‘excess CHD risk’ at younger ages, but the CHD risk score software also calculates the expected risk score for a person's age and gender. The difference between these two results provides a measure of a person's excess CHD risk.
The most recent diagnosis for patients with SMI was always confirmed by a letter from a consultant psychiatrist that was held in the general practice notes. The dose of medication in chlorpromazine equivalents was calculated (Reference BazireBazire, 2003). If a patient was taking more than one antipsychotic, the chlorpromazine equivalents were summed. Dose as a percentage of the maximum British National Formulary dose was also calculated. As there is considerable interest in associations between CHD and olanzapine (Reference Koro, Fedder and L'ItalienKoro et al, 2002) and clozapine (Reference Lund, Perry and BrooksLund et al, 2001), we compared the CHD risk in patients who were taking either of these medications with the risk in those who were not. All of the participants gave their written informed consent, and ethical approval was obtained from the Royal Free Hospital and the Camden and Islington Community NHS Trust local research ethics committees.
Statistical analysis
Initial univariate associations between SMI and a variety of outcomes guided which co-variates should be included in subsequent multivariate analysis. If continuous variables were normally distributed, any association with SMI was explored by linear multiple regression. Outcome variables, such as CHD risk score and cholesterol level, were also dichotomised around clinically or statistically significant values, allowing analysis of associations by multiple logistic regression. Age and gender were included a priori. Unemployment was included because on univariate analyses it was the variable most consistently and robustly associated with both CHD risk scores and individual risk factors for CHD. We tested the contribution of variables and interaction terms by comparing models that included and excluded the component of interest, using likelihood ratio tests. Any influence of the sampling strategy by practice was first assessed by adding practice as a covariate to final models. We then reassessed the statistical models using survey techniques in Stata version 6 for Windows and examining for any design effect using the ‘design effect’ (DEFT) scores for each model. The DEFT score quantifies the influence of the cluster design, as a ratio of the cluster result to a simple random-sampling-design result.
RESULTS
Response rates and numbers
Uptake rates for the CHD screening have been reported previously (Reference Osborn, King and NazarethOsborn et al, 2003). There were no major clinical or demographic predictors of participation that might have suggested that the sample was unrepresentative. A total of 666 patients were originally identified for invitation for screening, of whom 495 people were found to be eligible and were included in the denominator. In total, 75 patients with SMI and 150 without SMI attended the interview, of whom 3 individuals were excluded because possible pre-existing CHD was detected. Valid data were therefore available for 74 out of 182 eligible patients with SMI and for 148 out of 313 patients without SMI. Exclusion rates for CHD, either before or during interview, were similar in the two groups. Of the 666 potential participants, 3 out of 228 patients (1.3%) in the SMI group had CHD recorded in their general practice notes or at interview, compared with 10 out of 438 patients (2.3%) in the comparison group.
Characteristics of participants
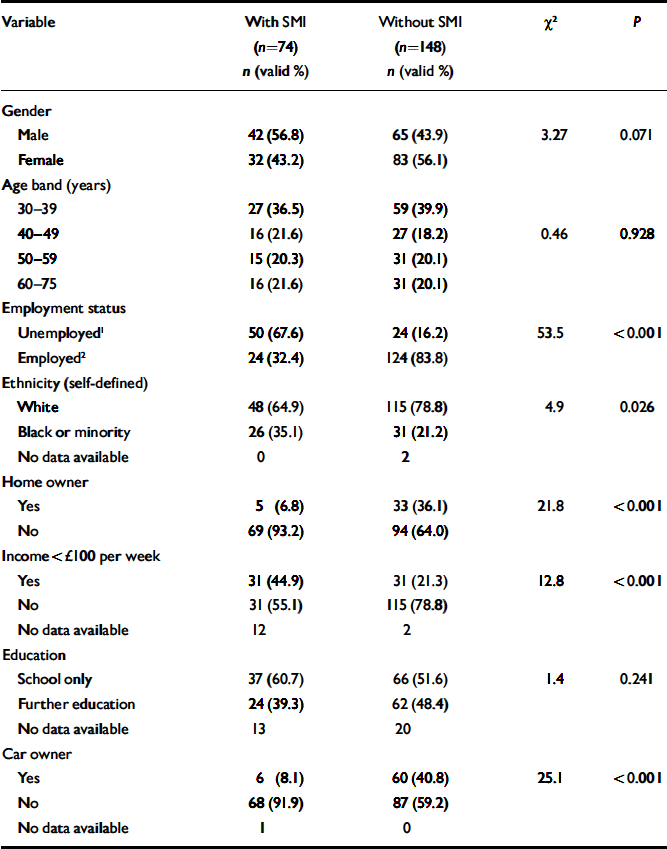
The demographic and socio-economic profiles of the two groups are shown in Table 1. The SMI group was characterised by low levels of income, home ownership, car ownership and employment. In total, 66 out of 74 participants (89%) in the SMI group had a diagnosis of schizophrenia, 6 had a diagnosis of schizoaffective disorder, and the remaining 2 had a diagnosis of a chronic or persistent delusional disorder. Diagnoses had been made between 2 and 43 years previously (mean 14.6 years, s.d.=10.5). The number of inpatient psychiatric admissions in the past 5 years ranged from 0 to 8 (mean 0.93, s.d.=1.34). Only 9 patients (12%) lived in sheltered or hostel-type accommodation. In total, 67 out of 74 patients (91%) had been seen in psychiatric secondary care within the past 2 years, 56 (76%) within the past 9 months, but only 37 (50%) within the past 3 months. Therefore many of these patients did not require the most intensive community care.
Table 1 Demographic and socio-economic variables associated with severe mental illness (SMI)
| Variable | With SMI (n=74) n (valid %) | Without SMI (n=148) n (valid %) | χ2 | P |
|---|---|---|---|---|
| Gender | ||||
| Male | 42 (56.8) | 65 (43.9) | 3.27 | 0.071 |
| Female | 32 (43.2) | 83 (56.1) | ||
| Age band (years) | ||||
| 30-39 | 27 (36.5) | 59 (39.9) | ||
| 40-49 | 16 (21.6) | 27 (18.2) | 0.46 | 0.928 |
| 50-59 | 15 (20.3) | 31 (20.1) | ||
| 60-75 | 16 (21.6) | 31 (20.1) | ||
| Employment status | ||||
| Unemployed1 | 50 (67.6) | 24 (16.2) | 53.5 | <0.001 |
| Employed2 | 24 (32.4) | 124 (83.8) | ||
| Ethnicity (self-defined) | ||||
| White | 48 (64.9) | 115 (78.8) | 4.9 | 0.026 |
| Black or minority | 26 (35.1) | 31 (21.2) | ||
| No data available | 0 | 2 | ||
| Home owner | ||||
| Yes | 5 (6.8) | 33 (36.1) | 21.8 | <0.001 |
| No | 69 (93.2) | 94 (64.0) | ||
| Income <£100 per week | ||||
| Yes | 31 (44.9) | 31 (21.3) | 12.8 | <0.001 |
| No | 31 (55.1) | 115 (78.8) | ||
| No data available | 12 | 2 | ||
| Education | ||||
| School only | 37 (60.7) | 66 (51.6) | 1.4 | 0.241 |
| Further education | 24 (39.3) | 62 (48.4) | ||
| No data available | 13 | 20 | ||
| Car owner | ||||
| Yes | 6 (8.1) | 60 (40.8) | 25.1 | <0.001 |
| No | 68 (91.9) | 87 (59.2) | ||
| No data available | 1 | 0 |
Psychiatric medication
In total, 20 out of 74 patients (27%) in the SMI sample were taking long-acting intramuscular depot antipsychotics, and 35 patients (47%) were taking atypical antipsychotics. Risperidone was not available as a depot preparation as data collection took place between 1999 and 2002. The dose of medication in chlorpromazine equivalents could be calculated for 49 patients. The missing data are explained by the fact that some patients were prescribed atypical antipsychotics such as olanzapine, without chlorpromazine equivalents (Reference BazireBazire, 2003). The median chlorpromazine dose was 217 mg (interquartile range (IQR) 75–433). The dose as a percentage of the maximum British National Formulary dose of antipsychotics could be calculated for 67 patients. The median was 25% (IQR 8.3–50). Significantly more people with SMI were currently prescribed antidepressants, compared with the comparison group (18/74 (24%) v. 15/148 (10%); χ2=7.8; P=0.005).
CHD risk score results
Univariate results
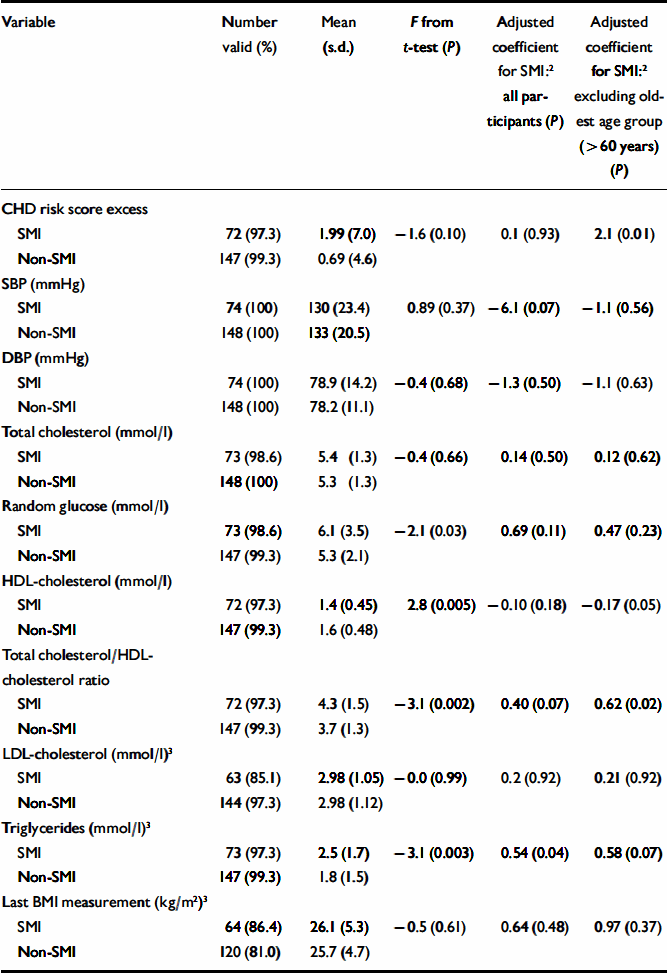
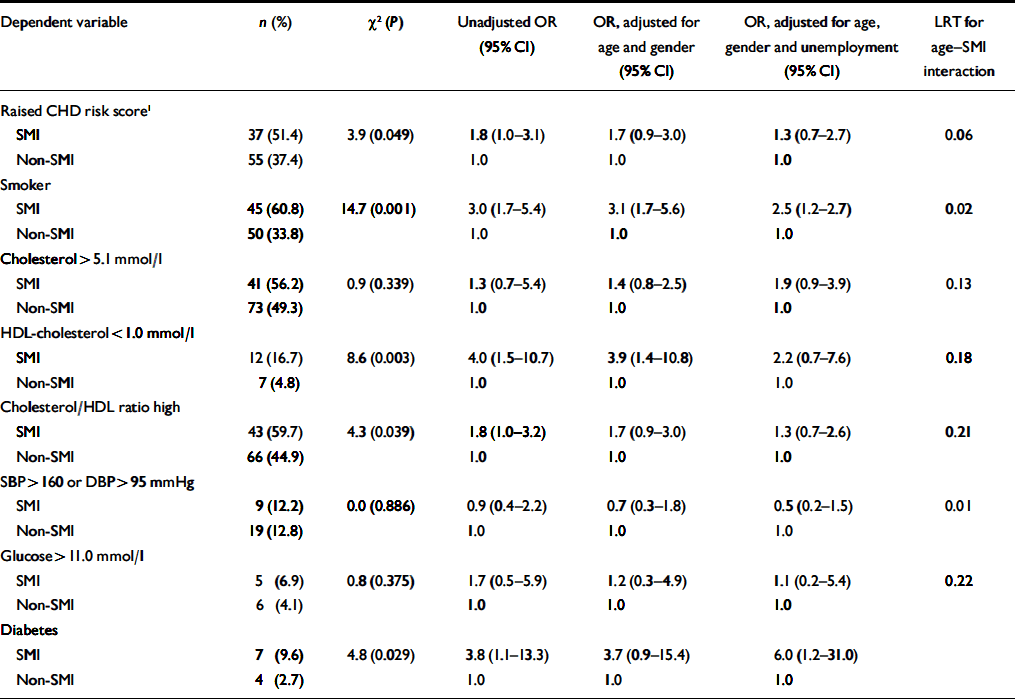
Patients with SMI had significantly lower HDL-cholesterol levels, and a higher total cholesterol/HDL-cholesterol ratio, but showed little overall difference in blood pressure (Table 2). They were also significantly more likely to smoke, to have a diagnosis of diabetes and to have a raised overall CHD risk score for their age and gender (Table 3). Patients with SMI were twice as likely to have a raised Framingham risk score for their age and gender compared with patients without SMI (Table 3). Participants with SMI had higher absolute 10-year CHD risk scores (median 10-year risk=5%; IQR 2–12) than participants without SMI (median 10-year risk=4%; IQR 2–9%) (Mann–Whitney U-test, z=2.0; P=0.049).
Table 2 Cardiovascular risk factors and severe mental illness (SMI): continuous variables 1
| Variable | Number valid (%) | Mean (s.d.) | F from t-test (P) | Adjusted coefficient for SMI:2 all participants (P) | Adjusted coefficient for SMI:2 excluding oldest age group (>60 years) (P) |
|---|---|---|---|---|---|
| CHD risk score excess | |||||
| SMI | 72 (97.3) | 1.99 (7.0) | -1.6 (0.10) | 0.1 (0.93) | 2.1 (0.01) |
| Non-SMI | 147 (99.3) | 0.69 (4.6) | |||
| SBP (mmHg) | |||||
| SMI | 74 (100) | 130 (23.4) | 0.89 (0.37) | -6.1 (0.07) | -1.1 (0.56) |
| Non-SMI | 148 (100) | 133 (20.5) | |||
| DBP (mmHg) | |||||
| SMI | 74 (100) | 78.9 (14.2) | -0.4 (0.68) | -1.3 (0.50) | -1.1 (0.63) |
| Non-SMI | 148 (100) | 78.2 (11.1) | |||
| Total cholesterol (mmol/l) | |||||
| SMI | 73 (98.6) | 5.4 (1.3) | -0.4 (0.66) | 0.14 (0.50) | 0.12 (0.62) |
| Non-SMI | 148 (100) | 5.3 (1.3) | |||
| Random glucose (mmol/l) | |||||
| SMI | 73 (98.6) | 6.1 (3.5) | -2.1 (0.03) | 0.69 (0.11) | 0.47 (0.23) |
| Non-SMI | 147 (99.3) | 5.3 (2.1) | |||
| HDL-cholesterol (mmol/l) | |||||
| SMI | 72 (97.3) | 1.4 (0.45) | 2.8 (0.005) | -0.10 (0.18) | -0.17 (0.05) |
| Non-SMI | 147 (99.3) | 1.6 (0.48) | |||
| Total cholesterol/HDL-cholesterol ratio | |||||
| SMI | 72 (97.3) | 4.3 (1.5) | -3.1 (0.002) | 0.40 (0.07) | 0.62 (0.02) |
| Non-SMI | 147 (99.3) | 3.7 (1.3) | |||
| LDL-cholesterol (mmol/l)3 | |||||
| SMI | 63 (85.1) | 2.98 (1.05) | -0.0 (0.99) | 0.2 (0.92) | 0.21 (0.92) |
| Non-SMI | 144 (97.3) | 2.98 (1.12) | |||
| Triglycerides (mmol/l)3 | |||||
| SMI | 73 (97.3) | 2.5 (1.7) | -3.1 (0.003) | 0.54 (0.04) | 0.58 (0.07) |
| Non-SMI | 147 (99.3) | 1.8 (1.5) | |||
| Last BMI measurement (kg/m2)3 | |||||
| SMI | 64 (86.4) | 26.1 (5.3) | -0.5 (0.61) | 0.64 (0.48) | 0.97 (0.37) |
| Non-SMI | 120 (81.0) | 25.7 (4.7) |
Table 3 Associations between categorical coronary heart disease (CHD) risk score variables and severe mental illness (SMI); results of logistic regression
| Dependent variable | n (%) | χ2 (P) | Unadjusted OR (95% Cl) | OR, adjusted for age and gender (95% Cl) | OR, adjusted for age, gender and unemployment (95% Cl) | LRT for age—SMI interaction |
|---|---|---|---|---|---|---|
| Raised CHD risk score1 | ||||||
| SMI | 37 (51.4) | 3.9 (0.049) | 1.8 (1.0-3.1) | 1.7 (0.9-3.0) | 1.3 (0.7-2.7) | 0.06 |
| Non-SMI | 55 (37.4) | 1.0 | 1.0 | 1.0 | ||
| Smoker | ||||||
| SMI | 45 (60.8) | 14.7 (0.001) | 3.0 (1.7-5.4) | 3.1 (1.7-5.6) | 2.5 (1.2-2.7) | 0.02 |
| Non-SMI | 50 (33.8) | 1.0 | 1.0 | 1.0 | ||
| Cholesterol>5.1 mmol/l | ||||||
| SMI | 41 (56.2) | 0.9 (0.339) | 1.3 (0.7-5.4) | 1.4 (0.8-2.5) | 1.9 (0.9-3.9) | 0.13 |
| Non-SMI | 73 (49.3) | 1.0 | 1.0 | 1.0 | ||
| HDL-cholesterol<1.0 mmol/l | ||||||
| SMI | 12 (16.7) | 8.6 (0.003) | 4.0 (1.5-10.7) | 3.9 (1.4-10.8) | 2.2 (0.7-7.6) | 0.18 |
| Non-SMI | 7 (4.8) | 1.0 | 1.0 | 1.0 | ||
| Cholesterol/HDL ratio high | ||||||
| SMI | 43 (59.7) | 4.3 (0.039) | 1.8 (1.0-3.2) | 1.7 (0.9-3.0) | 1.3 (0.7-2.6) | 0.21 |
| Non-SMI | 66 (44.9) | 1.0 | 1.0 | 1.0 | ||
| SBP>160 or DBP>95 mmHg | ||||||
| SMI | 9 (12.2) | 0.0 (0.886) | 0.9 (0.4-2.2) | 0.7 (0.3-1.8) | 0.5 (0.2-1.5) | 0.01 |
| Non-SMI | 19 (12.8) | 1.0 | 1.0 | 1.0 | ||
| Glucose>11.0 mmol/l | ||||||
| SMI | 5 (6.9) | 0.8 (0.375) | 1.7 (0.5-5.9) | 1.2 (0.3-4.9) | 1.1 (0.2-5.4) | 0.22 |
| Non-SMI | 6 (4.1) | 1.0 | 1.0 | 1.0 | ||
| Diabetes | ||||||
| SMI | 7 (9.6) | 4.8 (0.029) | 3.8 (1.1-13.3) | 3.7 (0.9-15.4) | 6.0 (1.2-31.0) | |
| Non-SMI | 4 (2.7) | 1.0 | 1.0 | 1.0 |
Multivariate analysis
Effect of increasing age. The magnitude of the difference in the results between participants with and without SMI varied significantly with age. More patients with SMI than controls exhibited raised 10-year CHD risk scores, except above the age of 60 years (Fig. 1). A logistic regression model including an age–SMI interaction term, adjusted for age, unemployment and gender, predicted having a raised CHD risk score better than a model that did not include the interaction term (Table 3). This is because the odds ratios between SMI and excess CHD risk differ significantly according to age group. The source of this interaction with age was explored further by examining logistic models between SMI and each individual component of the CHD risk score. The most likely sources of the interaction were smoking, total cholesterol concentration and hypertension (Table 3, column 7). These individual factors are also shown according to age group in Fig. 2. Both Fig. 1 and Fig. 2 suggest that the results for patients over 60 years of age contradict the results for the younger participants. For this reason, the main results were also explored in a restricted sample from which the oldest age group (over 60 years) had been excluded. Multiple regression analysis confirmed that patients with SMI in this age group showed greater differences in CHD risk score (the difference between personal CHD risk and expected CHD risk for the patient's age and gender) after adjustment for age, gender and unemployment (Table 2, column 6).
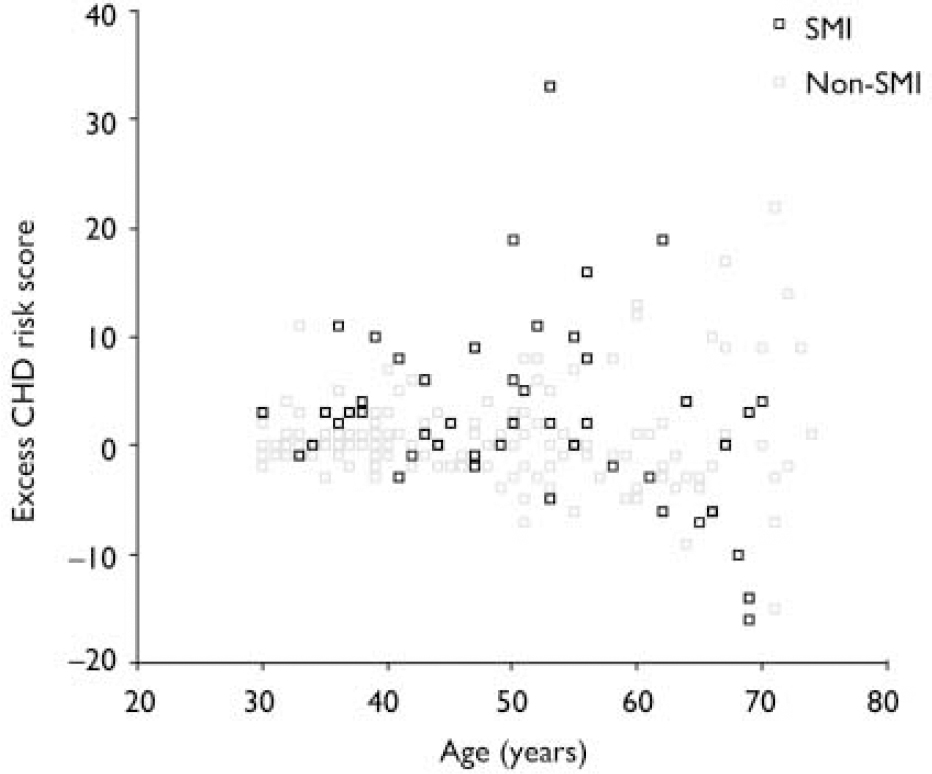
Fig. 1 Scatter plot of differences in 10-year coronary heart disease (CHD) risk score according to age. SMI, severe mental illness. Example of excess CHD risk calculation: if an individual's 10-year CHD risk score is 5%, and the expected value for someone of the same age and gender is 2%, their excess risk is calculated as (5%–2%)=3%.
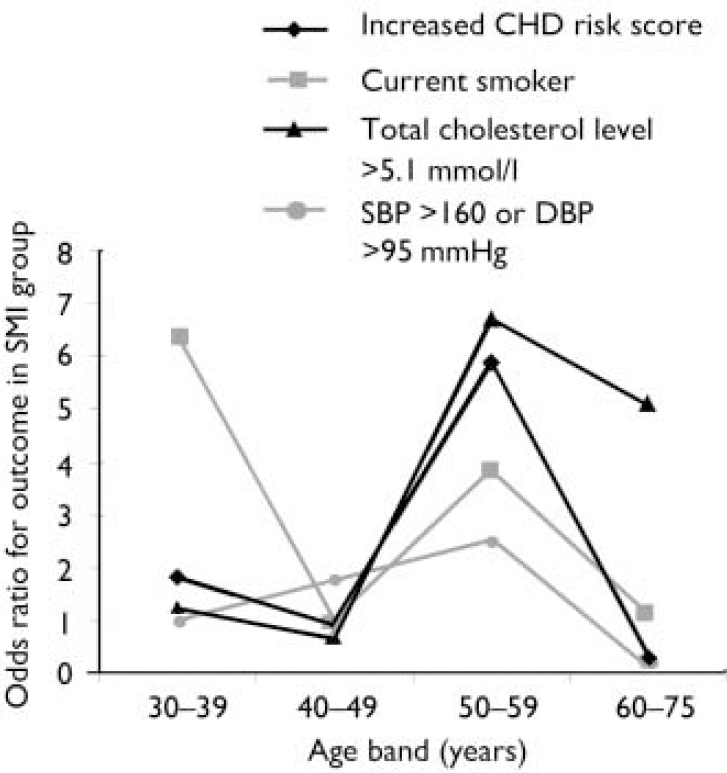
Fig. 2 Associations between severe mental illness (SMI) and excess coronary heart disease (CHD) risk, smoking, high cholesterol level and high blood pressure in different age groups. SBP, systolic blood pressure, DBP, diastolic blood pressure.
Effect of unemployment. With regard to continuous outcomes, the results were most pronounced in the under-60s (Table 2, compare columns 5 and 6). Presence of SMI still predicted a greater magnitude of excess CHD risk after adjustment for age, gender and unemployment. It also predicted higher total cholesterol/HDL-cholesterol ratios and lower HDL-cholesterol levels in this age group. For binary outcomes, unemployment partially explained the associations of SMI with a raised CHD risk score, smoking status and low HDL-cholesterol levels (Table 3). The inclusion of other socio-economic variables (listed in Table 1) in the multivariate models had little further effect on the main associations, and those data are not presented here.
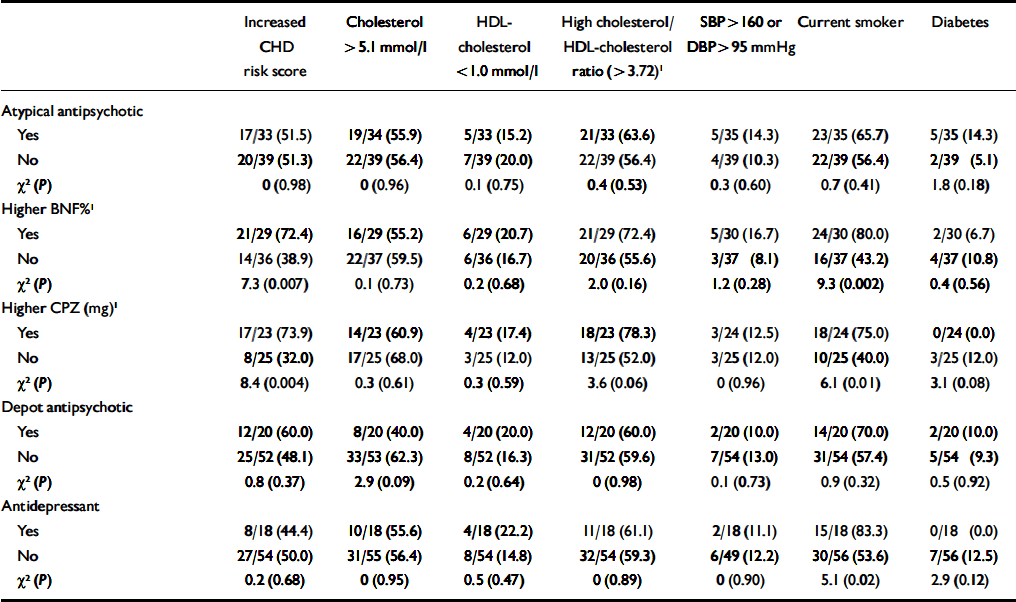
Effect of medication. Among patients with SMI, few medication variables were associated with excess CHD risk or with individual CHD risk factors (Table 4). The exception was higher doses of medication, which were associated with increased CHD risk scores (most likely to be caused by increased smoking). In total, 10 out of 17 patients (59%) on olanzapine or clozapine showed a raised CHD risk score, compared with 27 out of 55 patients who were not on such medications (49%; χ2=0.5, P=0.48). The proportion of individuals who were diagnosed with diabetes was also higher among patients on these medications, but again the trend was non-significant (3/18 (17%) v. 4/56 (7%); χ2=1.4, P=0.23).
Table 4 Antipsychotic medication and coronary heart disease (CHD) risk in people with severe mental illness
| Increased CHD risk score | Cholesterol > 5.1 mmol/l | HDL-cholesterol < 1.0 mmol/l | High cholesterol/HDL-cholesterol ratio (> 3.72)1 | SBP > 160 or DBP > 95 mmHg | Current smoker | Diabetes | |
|---|---|---|---|---|---|---|---|
| Atypical antipsychotic | |||||||
| Yes | 17/33 (51.5) | 19/34 (55.9) | 5/33 (15.2) | 21/33 (63.6) | 5/35 (14.3) | 23/35 (65.7) | 5/35 (14.3) |
| No | 20/39 (51.3) | 22/39 (56.4) | 7/39 (20.0) | 22/39 (56.4) | 4/39 (10.3) | 22/39 (56.4) | 2/39 (5.1) |
| χ2 (P) | 0 (0.98) | 0 (0.96) | 0.1 (0.75) | 0.4 (0.53) | 0.3 (0.60) | 0.7 (0.41) | 1.8 (0.18) |
| Higher BNF%1 | |||||||
| Yes | 21/29 (72.4) | 16/29 (55.2) | 6/29 (20.7) | 21/29 (72.4) | 5/30 (16.7) | 24/30 (80.0) | 2/30 (6.7) |
| No | 14/36 (38.9) | 22/37 (59.5) | 6/36 (16.7) | 20/36 (55.6) | 3/37 (8.1) | 16/37 (43.2) | 4/37 (10.8) |
| χ2 (P) | 7.3 (0.007) | 0.1 (0.73) | 0.2 (0.68) | 2.0 (0.16) | 1.2 (0.28) | 9.3 (0.002) | 0.4 (0.56) |
| Higher CPZ (mg)1 | |||||||
| Yes | 17/23 (73.9) | 14/23 (60.9) | 4/23 (17.4) | 18/23 (78.3) | 3/24 (12.5) | 18/24 (75.0) | 0/24 (0.0) |
| No | 8/25 (32.0) | 17/25 (68.0) | 3/25 (12.0) | 13/25 (52.0) | 3/25 (12.0) | 10/25 (40.0) | 3/25 (12.0) |
| χ2 (P) | 8.4 (0.004) | 0.3 (0.61) | 0.3 (0.59) | 3.6 (0.06) | 0 (0.96) | 6.1 (0.01) | 3.1 (0.08) |
| Depot antipsychotic | |||||||
| Yes | 12/20 (60.0) | 8/20 (40.0) | 4/20 (20.0) | 12/20 (60.0) | 2/20 (10.0) | 14/20 (70.0) | 2/20 (10.0) |
| No | 25/52 (48.1) | 33/53 (62.3) | 8/52 (16.3) | 31/52 (59.6) | 7/54 (13.0) | 31/54 (57.4) | 5/54 (9.3) |
| χ2 (P) | 0.8 (0.37) | 2.9 (0.09) | 0.2 (0.64) | 0 (0.98) | 0.1 (0.73) | 0.9 (0.32) | 0.5 (0.92) |
| Antidepressant | |||||||
| Yes | 8/18 (44.4) | 10/18 (55.6) | 4/18 (22.2) | 11/18 (61.1) | 2/18 (11.1) | 15/18 (83.3) | 0/18 (0.0) |
| No | 27/54 (50.0) | 31/55 (56.4) | 8/54 (14.8) | 32/54 (59.3) | 6/49 (12.2) | 30/56 (53.6) | 7/56 (12.5) |
| χ2 (P) | 0.2 (0.68) | 0 (0.95) | 0.5 (0.47) | 0 (0.89) | 0 (0.90) | 5.1 (0.02) | 2.9 (0.12) |
Design effect. Adding practice as a co-variate to the final models had little effect on any of the main results. The DEFT scores were close to 1 and were all less than 2, which also suggests that there was very little variation in effect between practices.
DISCUSSION
Participants with SMI were almost twice as likely to have a raised 10-year CHD risk score as patients in the general practice comparison group. This result was robust whether scores were analysed continuously or categorically, and after taking into account age and gender, and was far more pronounced as age approached 60 years. This magnitude of risk is comparable with the twofold excess of CHD deaths reported in the literature (Reference Hansen, Jacobsen and ArnesenHansen et al, 2001; Reference Lawrence, Holman and JablenskyLawrence et al, 2003). The main excess risk factors were increased smoking, lower HDL-cholesterol levels, higher total cholesterol/HDL-cholesterol ratios, increased likelihood of a diagnosis of diabetes, and a weak propensity for raised blood pressure with advancing age. These factors are those of the metabolic syndrome. The pro-atherogenic lipid results are novel, and are particularly important given the paucity of previous epidemiological evidence. Dyslipidaemia and diabetes were more common regardless of antipsychotic medication, and despite the fact that body mass indices were similar in the two groups. Similarities in body mass index may seem surprising, but previous community comparisons have not consistently shown that more people with SMI have a body mass index above 25 kg/m2 (e.g. Reference KendrickKendrick, 1996; Reference Brown, Birtwistle and RoeBrown et al, 1999). The results of body mass index comparisons will vary according to which subgroups with SMI participate in studies, and will also be influenced by the high rates of obesity in the general population.
The CHD risk of the oldest participants with SMI (>60 years) was less marked, with less smoking, dyslipidaemia and hypertension, possibly reflecting a healthy-survivor effect whereby the people with SMI who had the highest CHD risk factors had already died. It is not surprising that excess CHD risk factors are increasingly detected with advancing age, as they become more prevalent with age. Although people with SMI remain at increased risk of developing CHD even after their socio-economic circumstances have been taken into account, such adversity does explain some of the association.
Strengths and weaknesses of the study
The strengths of this study include the source of the participants and the recruitment of a relevant comparison group from the same source as the patients with SMI. The primary-care setting allowed recruitment of all patients with SMI, not just those in secondary care. Previous cardiovascular outcome research has often focused on institutionalised samples, or at least on patients with the most chronic and disabling forms of the illness (e.g. Reference McCreadieMcCreadie, 2003). Our study shows that excess CHD risk is not restricted to the sub-groups with SMI. The reporting of the ‘big four’ CHD risk factors (Reference Khot, Khot and BajzerKhot et al, 2003) of the Framingham risk score, rather than one or two risk factors, is novel. The contribution of socio-economic circumstances to inequalities in cardiovascular health for people with SMI has previously been neglected.
The limitations of our study include its cross-sectional nature and the omission of any electrocardiogram measure for possible left ventricular hypertrophy. The latter was not included because of the weaker contribution of left ventricular hypertrophy to population CHD risk (Reference Shaper, Pocock and PhillipsShaper et al, 1987; Reference Khot, Khot and BajzerKhot et al, 2003), and because extensive electrocardiological studies in patients with SMI have not revealed an excess of left ventricular hypertrophy. Although diabetes was coded on the basis of general practitioner diagnosis, random blood glucose screening contributed to our main outcome. The increasing risk of diabetes in people with SMI justifies more intensive screening for the condition.
The response rate of approximately 45% might initially seem modest, but this is similar to rates for other community research involving blood tests, such as the Health Survey for England (47%; Reference Erens and PrimatestaErens & Primatesta, 1999). The possibility of bias was minimised but not eliminated by the incorporation of a comparison group. Criticisms of the Framingham scores or of dichotomising factors such as excess CHD risk, hypertension and hypercholesterolaemia apply to both groups, and measurement error could explain the results only if inaccuracy preferentially favoured the group with or the group without SMI. Selection bias has been carefully considered previously (Reference Osborn, King and NazarethOsborn et al, 2003). Although patients who frequently consulted their general practitioner were more likely to participate, again this was true for both groups. No psychiatric, medication or socio-demographic variables predicted participation in the study.
There was a non-significant difference in gender distribution, with more women in the non-SMI group (Table 1). Although this could potentially exaggerate the excess CHD risk factors in patients with SMI, continuous variables (Table 2) and odds ratios (Table 3) changed little after adjusting for age and gender, especially in patients under 60 years of age.
The study was neither powered nor designed to examine sub-groups or effects of atypical antipsychotics, so those results should be interpreted with caution.
Importance
Socio-economic determinants of health are now one of the main priority of the World Health Organization (2004), and there is no better example of how such determinants affect health than patients with SMI. However, we have demonstrated that SMI itself can incur CHD risk, over and above that associated with the socio-economic deprivation experienced by these patients. Our results emphasise the clinical necessity for CHD risk factor screening for people with SMI. The burden of individual CHD risk factors may be further compounded by the problems of weight gain (Reference BlackburnBlackburn, 2000) and impaired glucose control linked to the use of antipsychotics (Reference HaddadHaddad, 2004), and the arrhythmogenic properties of conventional and newer antipsychotic drugs (Reference Glassman and BiggerGlassman & Bigger, 2001). This highlights people with SMI as candidates for more intensive CHD-focused interventions. This study has identified the need to develop focused interventions for smoking cessation, screening for diabetes and advice on diet, exercise and other methods of enhancing HDL-cholesterol levels and reducing the risk of CHD in people with SMI. Questions about the best form, clinical setting and intensity of such interventions therefore require urgent attention. Since around half of the patients who were invited to participate took up our CHD screening offer, more opportunistic screening may be indicated when patients are seen for other clinical reasons.
Clinical Implications and Limitations
CLINICAL IMPLICATIONS
-
▪ SMI is independently associated with excess CHD risk factors including smoking, raised cholesterol levels, low HDL-cholesterol levels and diabetes, even after controlling for the effects of antipsychotic medication and socio-economic deprivation.
-
▪ Screening for CHD risk factors is essential in this patient group.
-
▪ Interventions to improve cardiovascular health should focus on smoking cessation and more aggressive management of cholesterol levels and diabetes if appropriate.
LIMITATIONS
-
▪ Response rates were similar to those in other community studies involving blood tests. Although no selection bias was detected on examination for predictors of participation, this possibility cannot be excluded altogether.
-
▪ The sample was drawn from primary-care settings, representing the full clinical spectrum of SMI. Therefore the results obtained for secondary-care samples might differ, potentially being exaggerated.
-
▪ The results for sub-groups such as different types of medication should be interpreted with caution, as the study was not powered to examine such associations.
Acknowledgements
We thank the participants, their general practitioners and the practice staff. We also acknowledge the support of the Camden and Islington Mental Health and Social Care Trust.
D.O. was funded by a UK Medical Research Council Research Fellowship in health services research. The study received additional funding from the North Central Thames Primary Care Research Network.


eLetters
No eLetters have been published for this article.