Prejudice and discrimination by the public against people with mental illness are common, deeply socially damaging Reference Sartorius and Schulze1,Reference Thornicroft2 and are a part of more widespread stigmatisation. Stigma against people with mental illness can contribute to negative outcomes as well as perpetuating self-stigmatisation and contributing to low self-esteem. Reference Link, Struening, Rahav, Phelan and Nuttbrock3,Reference Ritsher and Phelan4 With a growing awareness about such stigma, 5 a number of recent initiatives have been launched in the UK aiming to improve public attitudes. The Royal College of Psychiatrists ‘Changing Minds’ campaign in England ran between 1998 and 2003. It advertised websites, showed campaign videos in cinemas, distributed leaflets to the general public and healthcare professionals, and created reading material for young people for use in the curriculum. Reference Crisp6 The Scottish Government ‘see me’ campaign (2002 to present) has a higher profile, is better funded and more extensive. It aims to deliver specific messages to the Scottish population by using all forms of media as well as cinema advertising, outdoor posters, supporting leaflets in general practitioner surgeries, libraries, prisons, schools and youth groups. It also has a detailed website (www.seemescotland.co.uk) containing interactive resources and its impact is regularly monitored and progress reported in the public domain. 7
However, at the same time as the anti-stigma campaigns, there has been an intensification of media attention linking mental illness and violence, in part related to reporting about reform of mental health legislation in England since 1998. 8,9 In 2002, the Department of Health in England published a controversial Mental Health Bill which proposed extended powers of compulsory detention of patients, and in particular to introduce a form of community treatment order. Although many broadsheet newspapers contained balanced coverage of these proposals, the tabloid press was largely positive about the Bill, which it believed was justified in the context of the associations between some mental illnesses and violence, associations that are often unfairly exaggerated and given undue prominence in such newspapers. Reference Foster10 In this context, the aim of this study is to understand trends in public attitudes towards people with mental illness in England and Scotland between 1994 and 2003 by carrying out a detailed analysis of data-sets from the Department of Health Attitudes to Mental Illness Surveys, 1994–2003. We investigated: whether stigma against people with mental illness has changed over time; and whether the changes would be more favourable since 2000 in Scotland than in England because of the ‘see me’ anti-stigma campaign in Scotland and because of high-profile and negative coverage of mental health legislation issues in England.
Method
Data sources
Data for each survey were obtained from the Department of Health. These surveys were carried out in 1994–1997 (annually), in 2000 and in 2003. Surveys have continued annually in England from 2007, but no longer include Scotland and for this reason the data used for this comparison stopped in 2003. Prior to each survey year, the Department of Health placed a questionnaire on the Research Surveys of Great Britain (RSGB) Omnibus, a division of Taylor Nelson Sofres plc. The same set of 26 items was used in each year of the survey. The 26 items were derived from the 40 items of the Community Attitudes Toward the Mentally Ill (CAMI) survey Reference Taylor and Dear11 and were slightly modified (Appendix). A further item was added to the questionnaire in 2000 and 2003, but was excluded for the purposes of this study to allow direct comparability. Respondents were asked to what extent they agreed or disagreed with a series of statements which expressed equal numbers of positive and negative views about mental illness. Statements related to areas such as perceptions of mental illness, social distance from people with mental illness, the responsibility of society towards people with mental illness, the role of such people in society and treatments for mental illness.
Sampling procedure
To identify 2000 adults representative of the whole population (6000 in 1996 and 1997), a random location sampling method was used by Taylor Nelson Sofres plc who carried out the survey on behalf of Department of Health. Great Britain was split into 600 areas of equal population using information from the 1991 census and the Post Office Address File. Three hundred sampling points were then selected that allowed adequate coverage of the geographic and socio-economic profile of Great Britain and these areas were then further grouped into population density and population socio-economic grade bands. Fieldwork was carried out in systematic and sequential waves across areas and sampling points were further divided to facilitate this. These measures were taken to avoid clustering effects of questionnaires deployed within one area and within a short time frame. Quotas were set to ensure even demographic distribution of respondents (gender, presence of children, employment status). 12 The sample size for most surveys was given as 2000 adults. In 1996 and 1997, however, the sample size was given as 6000 adults. Demographic data were collected for gender, children, age at last birthday, marital status, employment status of chief income earner, social grade and UK region. 12
Interviewing techniques
All interviews were carried out in the respondent's home by fully trained personnel using computer assisted interviewing (CAI) methods. Interviews concluded by gathering demographic data from respondents. The scale points used for the Department of Health survey were: −2=disagree strongly, −1=disagree slightly, 0=neither, 1=agree slightly and 2=agree strongly. Respondents were asked to select the degree to which they agreed with the 26 items (Appendix).
Data analysis
All data were obtained from Department of Health in tables presented in Microsoft Word, except 2003 data which were published in PDF format by Taylor Nelson Sofres on behalf of the Department of Health. Tabulated data from 1994, 1995, 1996, 1997 and 2000 were copied and pasted, and data from 2003 were entered manually into a Microsoft Access database. The mean responses to each item and the standard errors of these means were analysed using Stata version 9.0 for Windows. 13 The regions of England were combined to compute an overall group mean for England which included London, South East, South West, West Midlands, East Midlands, Northwest, Yorkshire/Humberside, East Anglia and the North.
Given that the raw data were not available, the means and standard errors were used to calculate weighted estimates that were then used in linear regression models including the weighted mean and standard error while accounting for the year and country for each item in the model. Since data were collected at an aggregate level, the analyses were easily conducted using techniques borrowed from meta-analysis and relevant options in the statistical package Stata version 9. The ‘Metan’ option in Stata 13 was used to compute the overall weighted mean and its standard error for each of the years for each item for each country. The standard error was computed for each item for each country. The ‘Metan’ option was also used to compute the overall weighted mean across all the years for a country for a particular item. The ‘Metareg’ option was used to compute a regression model to compare England and Scotland across time to investigate overall trend and compare the 2000 and 2003 time points for each item. This option performed random-effects meta-regression using aggregate level data.
We began by looking for longitudinal trends. First, overall response means per item were analysed for an overall trend across all years. The standard error for each item pooled across the six time points was calculated to investigate whether the results were relatively more or less variable for any of the items. Our second investigation into whether levels of stigma have shown more positive changes in Scotland than in England prompted us to initially seek changes in attitudes after 2000, to assess an early effect of the ‘see me’ campaign. To investigate this further we carried out a longitudinal comparison of attitudes between countries before and after 2000. To achieve this, England and Scotland total scores for the years 1994 to 2000 were aggregated and compared with 2003 (for each item). The same analysis was then applied to Scotland alone. We went on to compare mean scores for each item between 2000 and 2003 for England and Scotland since we believed that this would provide a sensitive indication of change in the two countries immediately preceding and following the campaign.
Results
Overall mean response per item
The overall mean response was analysed for each of the 26 items for England and Scotland. Online Table DS1 shows the statement given in each item and shows the mean response for all six time points in each region, allowing the overall mean for England to be compared with Scotland. Data for item 22 were not collected in 2003; therefore, when looking at overall trends per item, only data from 1994, 1995, 1996, 1997 and 2000 were analysed for this item. In 23 out of 26 items, the overall mean response per item was not stigmatising (Items 1–4, 7–15, 16–20 and 22–26). In 2 out of 26 items, the overall mean response was stigmatising (Item 6, ‘Mental hospitals are an outdated means of treating people with mental illness’; and item 21, ‘The best therapy for many people with mental illness is to be part of a normal community’). The mean response for Item 5 was neutral. In England, the standard errors for the items (pooled across the six time points) ranged from 0.014 (Item 10) to 0.030 (Item 18). In Scotland, standard errors for the items (pooled across the six time points) ranged from 0.042 (Item 10) to 0.096 (Item 6).
General longitudinal trends and country differences
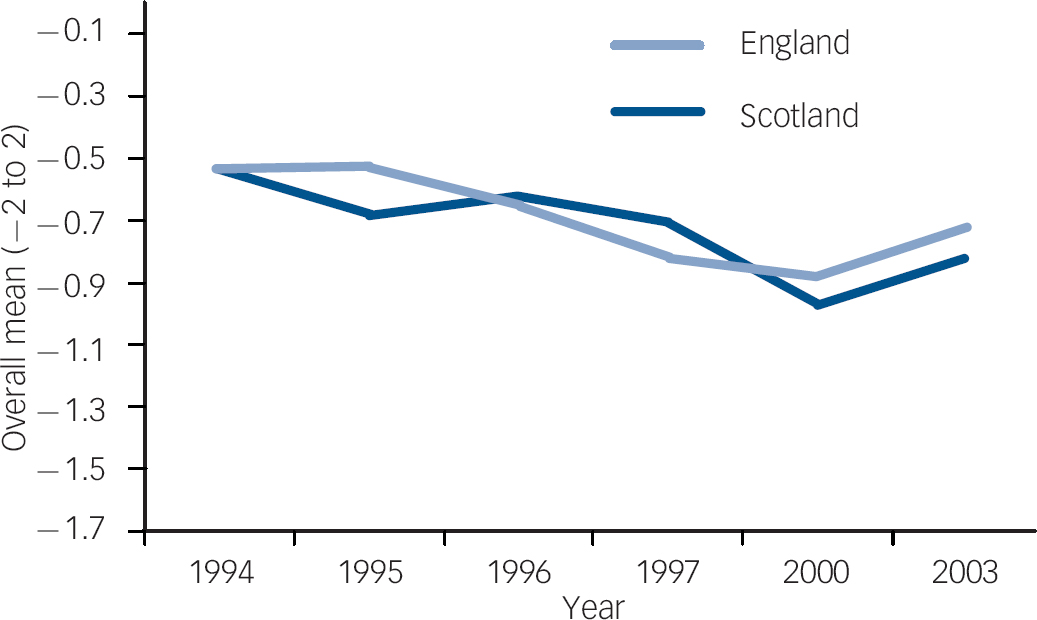
There were some statistically significant longitudinal changes in the overall mean responses per item in England or Scotland over the 9 years (six time-points) of data collection. Positive changes reflect less stigmatising attitudes, whereas negative changes reflect more stigmatising attitudes. It is important to note that although trends may be reported here as ‘negative’ or ‘positive’, the overall mean scores for the period (discussed above) should be taken into account. The following data highlight trends per item within the overall mean as reported for the period. Overall, taking into account the six time-points and the country in which respondents resided, responses to Item 2 (‘There is something about people with mental illness that makes it easy to tell them from normal people’) significantly improved (P<0.01) for both England and Scotland (Fig. 1). A positive change was also detected for Item 4 (‘Mental illness is an illness like any other’, P=0.001) (Fig. 2). For Items 9 and 11 there were significantly negative changes (Item 9: ‘We need to adopt a far more tolerant attitude toward people with mental illness’ (P=0.02); Item 11: ‘People with mental illness don't deserve our sympathy’ (P=0.02)) (Figs 3 and 4). When comparing England with Scotland to look for significant longitudinal changes in the overall mean responses per item, respondents in Scotland were more positive for Item 4 (‘Mental illness is an illness like any other’, P=0.02) (Fig. 2) and were also more positive for Item 5 (‘Less emphasis should be placed on protecting the public from people with mental illness’, P=0.02) (Fig. 5). For Item 26, however, respondents in Scotland were more negative in their attitudes (‘Locating mental health facilities in a residential area downgrades the neighbourhood’, P=0.03) (Fig. 6). However, no interactions between country and year were significant in the regression models for each of the items, so the evidence for overall trend differences between England and Scotland over the whole period was weak.
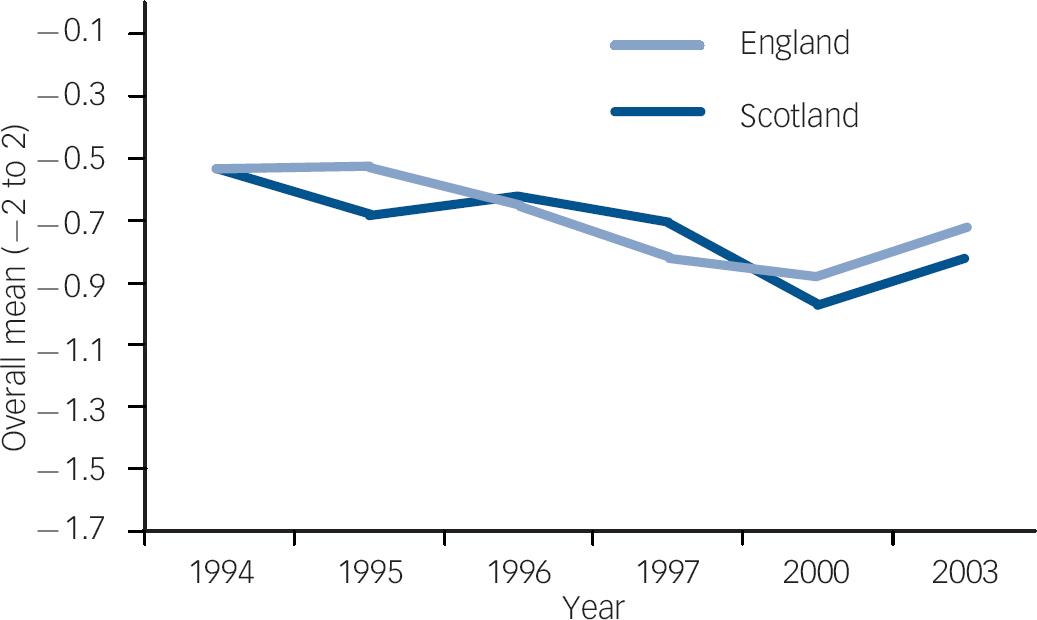
Fig. 1 Item 2 longitudinal trend, England and Scotland. Item 2: ‘There is something about people with mental illness that makes it easy to tell them from normal people’. Over the six time points and across both countries, attitudes significantly improved for this item.
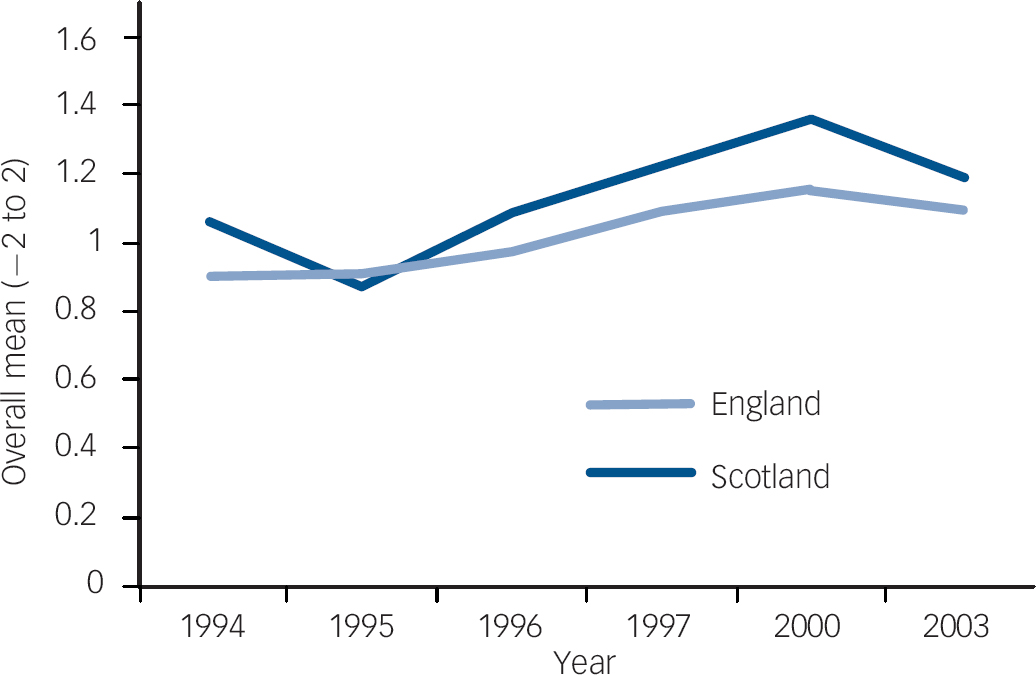
Fig. 2 Item 4 longitudinal trend, England and Scotland. Item 4 ‘Mental illness is an illness like any other’. Over the six time points and across both countries, attitudes significantly improved for this item. Scotland improved more significantly over time than England for this item.
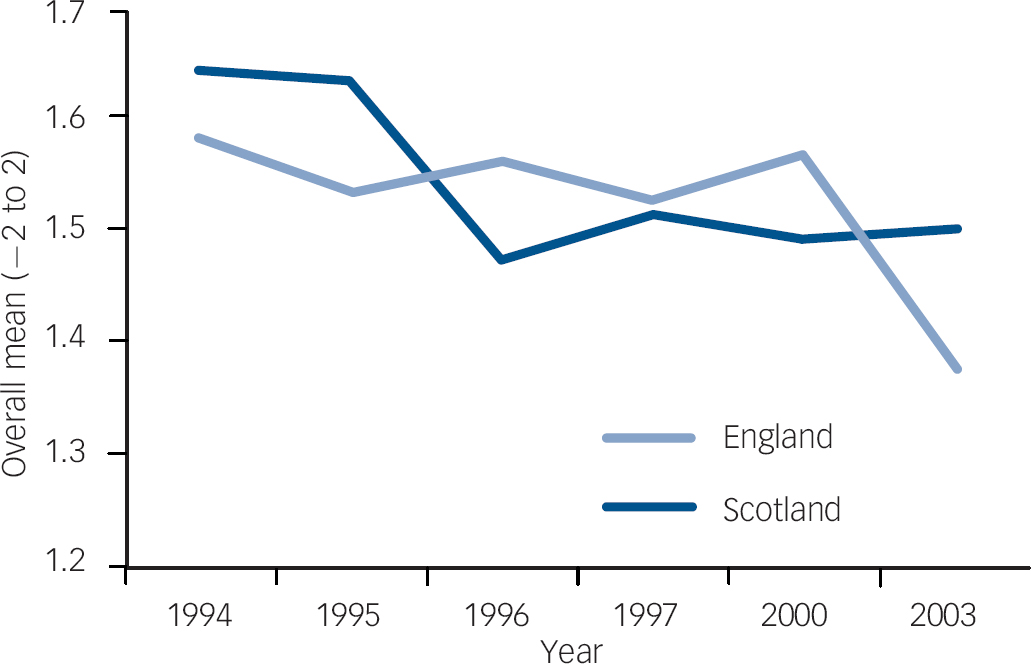
Fig. 3 Item 9 longitudinal trend, England and Scotland. Item 9: ‘We need to adopt a far more tolerant attitude toward people with mental illness in our society’. Over the six time points and across both countries, attitudes significantly deteriorated for this item.
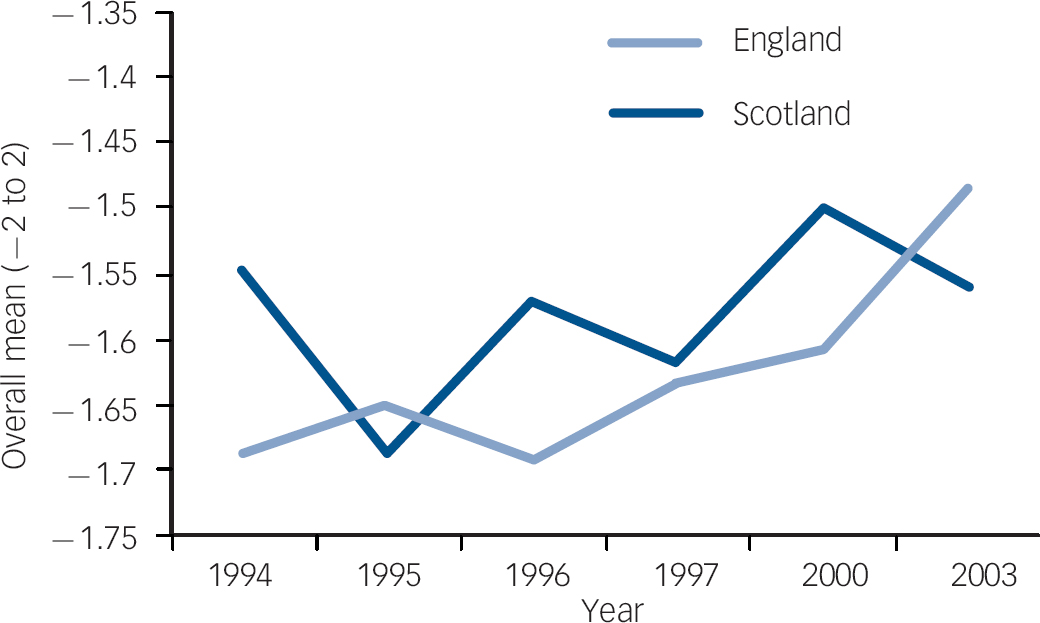
Fig. 4 Item 11 longitudinal trend, England and Scotland. Item 11: ‘People with mental illness don't deserve our sympathy’. Over the six time points and across both countries, attitudes significantly deteriorated for this item.
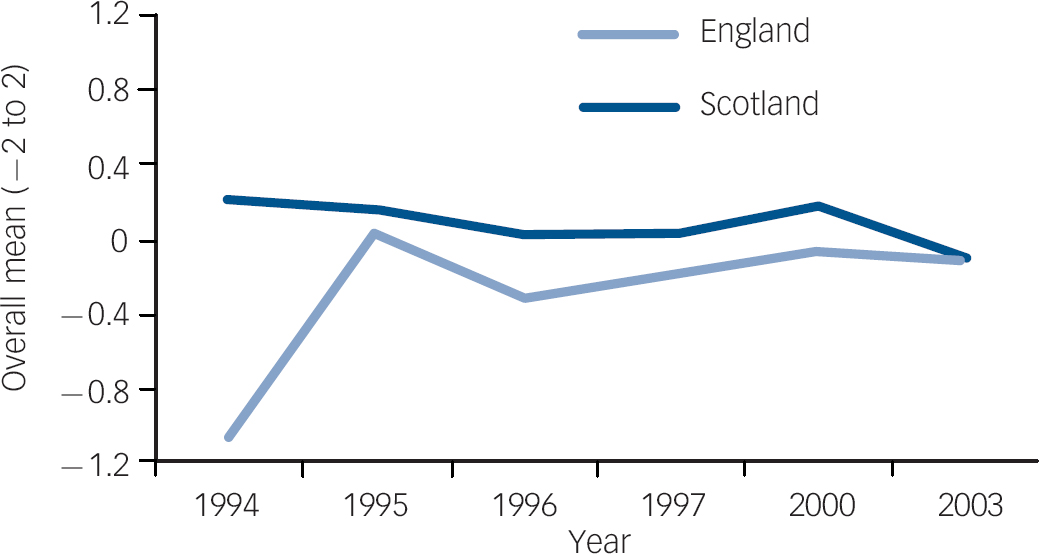
Fig. 5 Item 5 longitudinal trend, England and Scotland. Item 5: ‘Less emphasis should be placed on protecting the public from people with mental illness’. Over the six time points, attitudes in England did not change significantly for this item (although the absolute response deteriorated from ‘agree’ to ‘disagree’ over time). Moreover, relative to England, attitudes in Scotland significantly improved over time for this item.
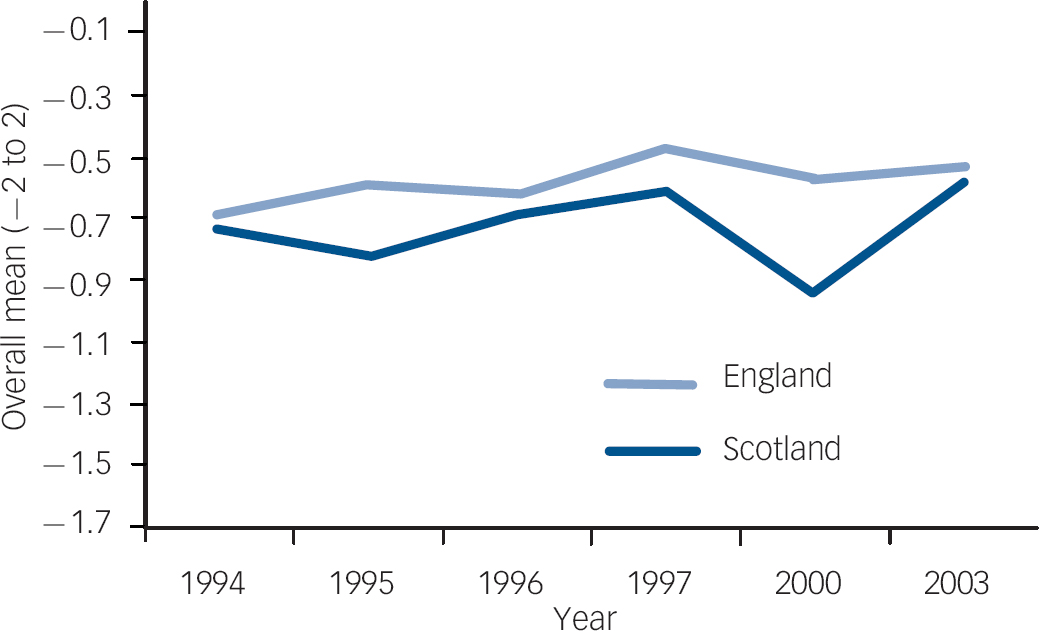
Fig. 6 Item 26 longitudinal trend, England and Scotland. Item 26: ‘Locating mental health facilities in a residential area downgrades the neighbourhood’. Over the six time points, attitudes in England did not change significantly for this item. However, relative to England, attitudes in Scotland significantly deteriorated over time for this item.
Longitudinal trends comparing the periods before and after the ‘see me’ Scotland campaign
When item scores for England and Scotland in 1994–2000 were aggregated and compared with 2003, there were several notable changes. There was a significant increase for Item 1 in both countries resulting in a move in a negative direction for the statement ‘One of the main causes of mental illness is a lack of self-discipline and will-power’, (P=0.009). Item 8 also showed a significant change in an unfavourable direction with respondents in both countries disagreeing with the statement ‘People with mental illness have for too long been the subject of ridicule’ (P=0.04). Item 11 also showed an overall significant difference in an unfavourable direction with respondents in both countries agreeing with the statement ‘People with mental illness don't deserve our sympathy’ (P=0.008). Similar changes in more stigmatising directions were detected for Items 12–14 with an increase in agreement towards ‘People with mental illness are a burden on society’; ‘Increased spending on mental health services is a waste of money’; and ‘There are sufficient existing services for people with mental illness’ (P=0.01, P=0.01 and P=0.001 respectively). Item 17 also showed a significant negative change with increased agreement with ‘I would not want to live next door to someone who has been mentally ill’ (P=0.045).
When analysing data from Scotland alone, and comparing 1994–2000 v. 2003, there was an increase in 2003 in respondents' agreement with Item 14 ‘There are sufficient existing services for people with mental illness’ (P=0.03) as well as Item 19 ‘No one has the right to exclude people with mental illness from their neighbourhood’ (P=0.02).
Changes at specific time points immediately before and immediately after ‘see me’ Scotland campaign
Changes in the mean attitudes per item between 2000 and 2003 were analysed for England and Scotland. The total number of items showing significant change is summarised in Table 1. In overall terms, between 2000 and 2003, in England, 17/25 items showed significant deterioration with attitudes moving in a negative direction. The remaining eight items did not change and no items moved in a positive direction (Fig. 7). By comparison in Scotland, however, only 4/25 items showed deterioration which included Items 3 (P=0.02), 12 (P=0.02), 14 (P<0.001) and 26 (P<0.05). These items refer to mental healthcare services for people with mental illness and the burden of people with mental illness to society. None of the items showed improvement in either country (Fig. 8).
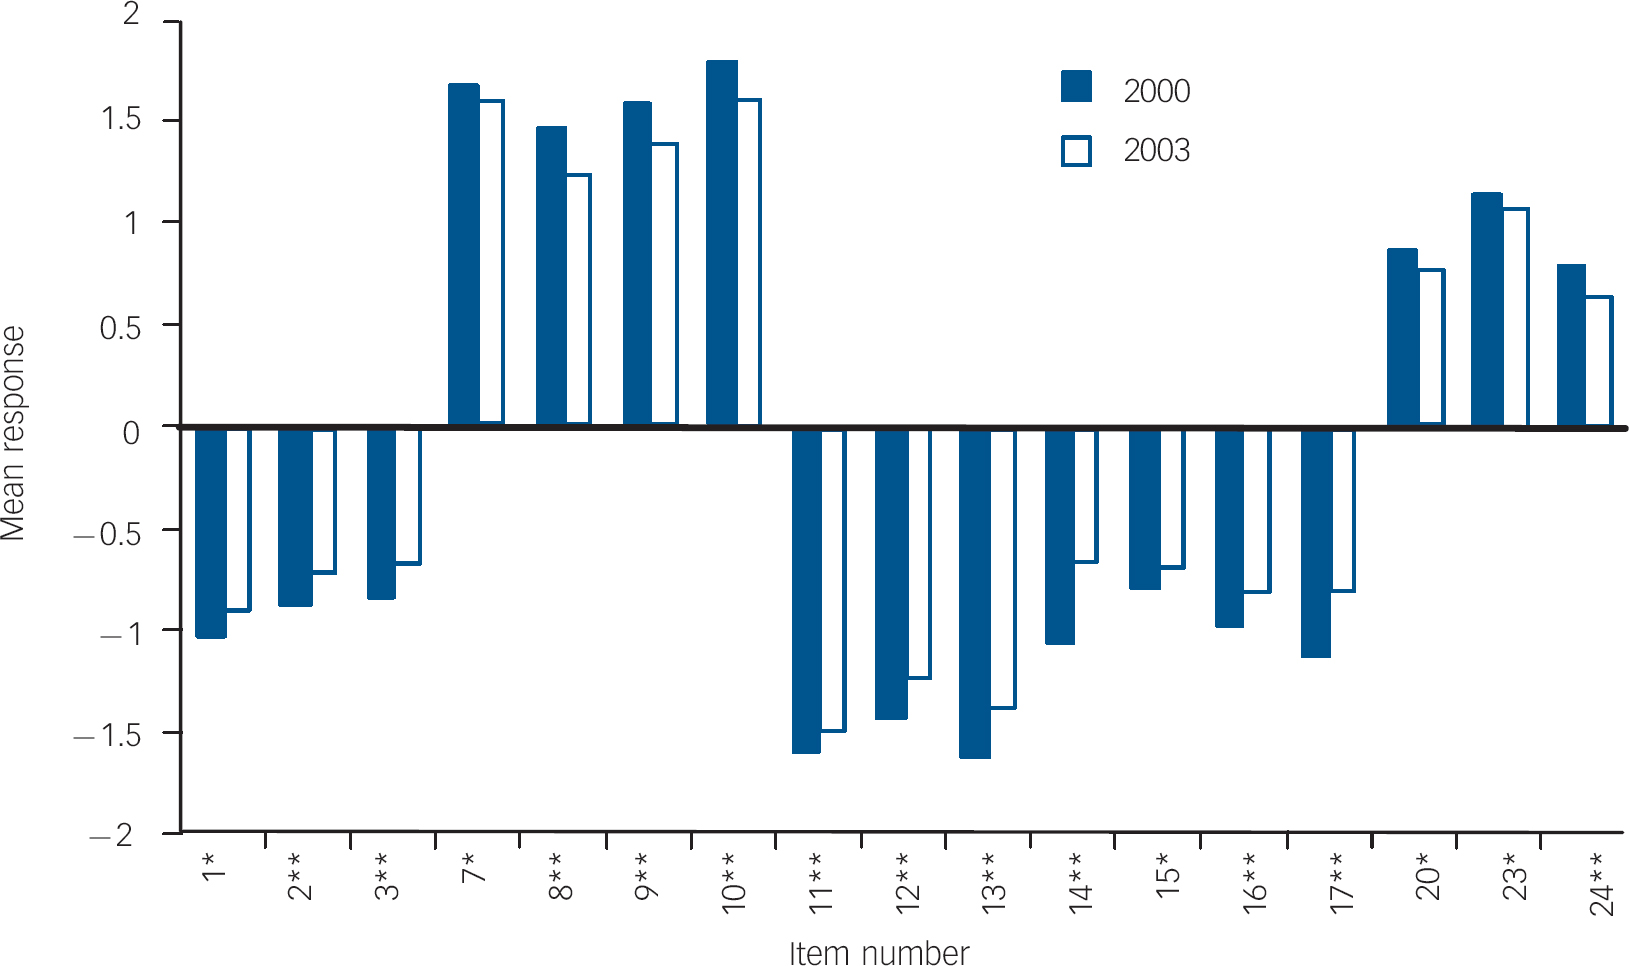
Fig. 7 Mean response to items showing significant difference in England between 2000 and 2003.a a. All items moved in a negative direction. Likert scale was structured from −2 (disagree strongly) to 2 (agree strongly); therefore, depending on the item wording, some results are positively scored. Although mean responses rarely change category within the Likert scale, all items show statistically significant deterioration. *Showed negative change in attitudes, P<0.05; **showed negative change in attitudes, P<0.001.
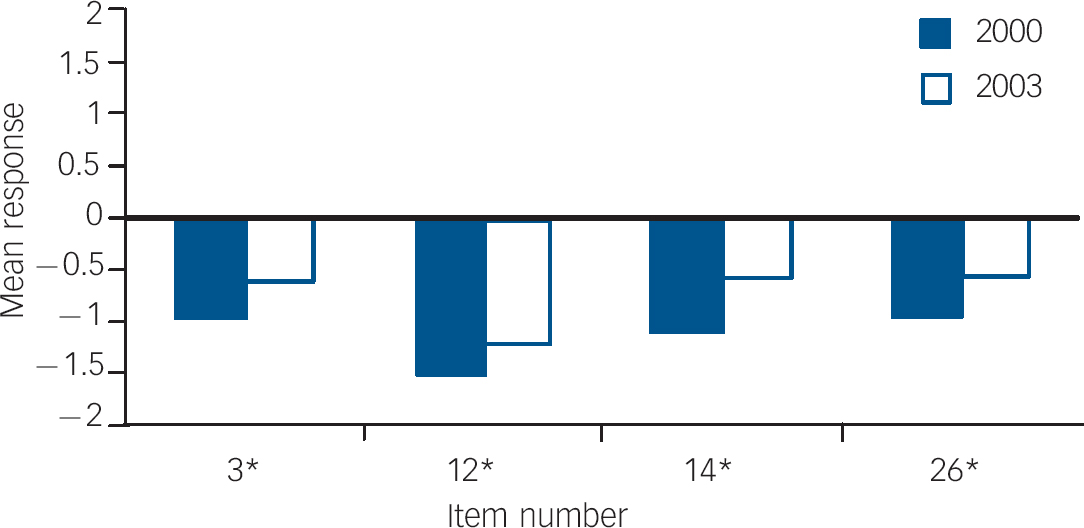
Fig. 8 Mean response to items showing significant difference in Scotland between 2000 and 2003.a a. All items moved in a negative direction. Likert Scale was structured from −2 (disagree strongly) to 2 (agree strongly); therefore, depending on the item wording, some results are positively scored. Although mean responses rarely change category within the Likert Scale, all items show statistically significant deterioration. *Item number showed negative change in attitudes, P<0.05; **item number showed negative change in attitudes, P<0.01.
Table 1 Number of items showing significant difference in England and Scotland between 2000 and 2003 a

| Items showing improvement, n/N | Items showing deterioration, n/N | |
|---|---|---|
| England | 0/25 | 17/25 |
| Scotland | 0/25 | 4/25 |
a All items in England and Scotland showing any significant difference in mean value between 2000 and 2003 moved in a negative direction (i.e. attitudes became more stigmatising). England deteriorated in more items than Scotland in this period
Discussion
Public attitudes and national anti-stigma campaigns
We analysed the data using several different approaches. Analysis of overall mean scores per item between 1994 and 2003 were reassuring in that respondents in England and Scotland had largely positive views overall. In spite of this, however, further analysis sought to identify more specific trends within this framework, given that the existence of consistent trends in a negative direction in either or both countries may be a cause for concern and may point towards the need for intervention. Our longitudinal analysis of mean scores for each item over the entire period 1994–2003 in England and Scotland did show some significant trends, although the trends did not paint a wholly consistent picture. A longitudinal analysis of the data using aggregation either side of the 2000 time point was more informative. Although the absolute results on the Likert scale changed relatively little, (i.e. mean responses rarely changed by whole points on the five-point scale), the overall results were clear in that many items showed deterioration in both England and Scotland, but to a far greater extent in England. These results suggested that attitudes in England deteriorated markedly compared with those in Scotland after 2000, consistent with our hypothesis that change had occurred in both countries between 2000 and 2003, with more unfavourable change in England.
Subsequent analysis of the changes in mean responses per item at time points 2000 and 2003 proved to be a sensitive method of interrogating this change, and we show that the attitudes of both respondents in Scotland and England largely deteriorated over this time. The deterioration was most apparent in England between 2000 and 2003, with 17/25 items showing deterioration in negative attitudes towards people with mental illness compared with 4/25 in Scotland. The more marked deterioration in England may be related to the effect of adverse media reporting, which also took place over the time when changes to the Mental Health Act were being widely debated, and often reported in relation to the risk of violence posed by people with mental illness. The relative lack of deterioration in Scotland may be related to the early effect of the ‘see me’ campaign in Scotland that was launched in 2000, and which may have slowed the rate of worsening public attitudes in its first 3 years. Indeed, surveys directly commissioned by ‘see me’ report that positive attitudes changes have occurred in subsequent years. Reference Dunion and Gordon14
Value of longitudinal questionnaire data
An understanding of longitudinal trends in public attitudes towards mental illness is necessary to assess the ongoing severity of stigma and to contribute to the evaluation of such public education campaigns. Existing peer-reviewed research in the field of public attitudes towards mental illness has focused on changes over time in public responses to written vignettes portraying characters with mental illness. Reference Jorm, Christensen and Griffiths15 Other research has sampled a specific population using vignettes or a questionnaire at a given point in time. Reference Hugo, Boshoff, Traut, Zungu-Dirwayi and Stein16,Reference Tanaka, Inadomi, Kikuchi and Ohta17 Although there are advantages to using vignettes in studies they can be problematic because those developed by Star were primarily developed to elicit the publics' recognition of a person with a mental illness. Reference Star18 Although vignettes can be manipulated to depict people with different types of mental illnesses, the psychometric properties of using vignettes with an evaluative tool assessing knowledge, attitudes or behaviour in response to such a stimulus have not been well established. Additionally, the respondent who reads the vignette answers questions specifically in relation to that vignette which may hinder their recollection of contact with a real person who has a mental illness. Reference Link, Yang, Phelan and Collins19 Use of a Likert scale questionnaire method helps avoid these problems.
Longitudinal research on public attitudes
There are a number of non-UK longitudinal studies that examine public attitudes towards mental illness using a questionnaire method, and whose results are useful for informing meaningful debate about possible explanations for changes noted over time. Reference Angermeyer and Dietrich20 Madianos et al were able to surmise that an improvement in attitudes in Athens between 1979–80 and 1994 ‘could be explained in the context of a positive and tolerant social climate in the Athens area’ that was thought to be a result of a sustained health protection/illness prevention effort in community mental health, as well as ongoing public education campaigns over the period. Reference Madianos, Economou, Hatjiandreou, Papageorgiou and Rogakou21 Other similar work has shed light on longitudinal changes in public attitudes in the USA. Phelan et al suggested that the public were better able to define mental illness in 1996 than in 1950, seemingly in line with the expansion of changes to the DSM during the same period. However, the public became significantly more negative in their attitudes between these time points, with an increase in perception of ‘dangerousness’, ‘unpredictability’ and ‘instability’ as typical traits. Furthermore, the authors noted that those whose definitions of mental illness included ‘psychosis’ were more likely to associate it with violence to a greater degree in 1996 than in 1950. Reference Phelan, Link, Stueve and Pescosolido22 Chou & Mak compared attitudes towards people with mental illness among Hong Kong Chinese people in 1994 and 1996. They cross-referenced their results with data relating to respondents' level of contact with people who were mentally ill, as well as their demographic and socio-economic profiles. Their results were mixed, and indicated an improvement in public knowledge of psychiatric conditions and improvement in attitudes towards community care, but a deterioration in attitudes concerning social distance from people who were mentally ill. They also found that negative attitudes were strongly correlated to lower levels of contact with people who were mentally ill, and argued for increased contact to reduce stereotyping and for increased effort from the Hong Kong Government into mental health promotion and education programmes. Reference Chou and Mak23 Angermeyer & Matschinger measured public levels of perceived stigma and discrimination against mental illness rather than direct public attitudes towards mental illness in Germany between 1990 and 2001. They concluded that the German public perceived less stigma towards mental illness over time, although they noted that a substantial amount of perceived stigma still existed. Moreover, items in their scale relating to perceived active discrimination demonstrated little change over time, although if anything, an increase in perceived discrimination. Reference Angermeyer and Matschinger24
There is only one peer-reviewed study to date which analyses longitudinal changes in public attitudes in parts of the UK using a questionnaire method. Crisp et al conducted a national survey of public attitudes in 1998 that was repeated in 2003 following the Changing Minds campaign and it reported an overall slight improvement in attitudes towards certain conditions over time, including severe depression, panic attacks or phobias, schizophrenia, dementia, eating disorders, alcoholism and drug addiction. Reference Crisp, Gelder, Goddard and Meltzer25 In addition to this, several recent, large-scale, government-funded, questionnaire-based surveys have been undertaken to measure public attitudes towards mental illness across all parts of the UK. The results of these are being used by the Scottish Executive to aid evaluation of the success of the ‘see me’ campaign. Reference Braunholtz, Davidson and King26–Reference Glendinning, Buchanan, Rose and Hallam28 Furthermore, results summaries of the Department of Health Attitudes to Mental Illness surveys which included data for England and Scotland were published in 1999, 2000, 2003. 29–31 However, each of the UK longitudinal analyses we have described has used percentage changes in total agreement or disagreement within each item to report longitudinal trends. The 2003 Department of Health summary report concluded that, in spite of a slight overall (percentage) deterioration in attitudes between 2000 and 2003 ‘the vast majority of respondents having a caring and sympathetic view of people with mental illness’. 31 The rationale for their explanation was that ‘89% of respondents agreed that we have a responsibility to provide the best possible care for people with mental illness, 83% agreed that we need to adopt a far more tolerant attitude toward people with mental illness in our society, and 78% agreed that people with mental illness have for too long been the subject of ridicule’. 31 However, the nature of many of the items in the survey may have led to a ceiling effect due to social desirability, which refers to the tendency of respondents to portray themselves in keeping with perceived cultural norms. Reference Crowne and Marlowe32
Our analysis of the Department of Health data has been more intensive. It is true that the overall mean results per item across time were encouraging, in that the majority of items in both countries were non-stigmatising overall. However, it is also possible that the directional nature of many items, the use of face-to-face, in-home interviewing and the tendency for a ‘response set’ (i.e. participants wishing to be seen to give socially acceptable answers) may have obscured even more negative attitudes. By using different forms of longitudinal analysis of mean responses, over different time periods, we have attempted to minimise any bias from the way that the questions were framed and the method used to collect data. In doing so, our analysis reveals a less optimistic picture than that of recent Department of Health reports, especially in England.
Limitations of the study
There are several limitations to this study. First, we undertook secondary analyses of existing data-sets that, when collected, were not designed with the primary aim of comparing public attitudes over time between England and Scotland. Second, the items used in the survey were derived from CAMI. Reference Taylor and Dear11 Although this questionnaire has shown good responsiveness to change after an introductory psychology course Reference Wahl and Lefkowits33 or after occupational therapy placements in students, Reference Gilbert and Strong34 there is no evidence of responsiveness to change at the population level. Third, although the Department of Health modified the wording slightly from the CAMI using ‘people with mental illness’ rather than ‘the mentally ill’, the statements used in the questionnaire are often worded in a manner that may be seen as stigmatising in itself. For example, Item 11 (‘People with mental illness don't deserve our sympathy’) could be interpreted as stigmatising whichever way it is answered, rendering meaningful analysis of that item difficult. Finally, data were not collected in 1998, 1999, 2001 or 2002, and so it is not possible to assess public attitudes for those intermediate years.
Implications of the study
In spite of the limitations of the study noted above, it remains the case that no previous reports have so far been published at the national level and over such a prolonged time period with standardised measures, robust sampling procedures, and face-to-face interviewing techniques. For these reasons our results are a valuable contribution to understanding changing public attitudes towards people with mental illness. In order to continue to evaluate longitudinal trends, there would be clear benefit in continuing to include both Scotland and England in one survey that allows direct comparability.
The deterioration in attitudes, much more noticeable in England than in Scotland, has several important implications for policy-makers. We have noted the emerging evidence that press coverage of mental health issues in England focuses predominantly upon associations with violence. This style of journalism coupled with the recent reform of mental health legislation may be contributing to worsening stigma in England, a position which was recently described by England's Department of Health. Reference Batty35 In light of the relative lack of deterioration, and indeed improvements in places, that we noted in Scotland, further research is needed to clarify the relationship between attitudinal change and the effect of the potentially active ingredients of national anti-stigma campaigns, to allow future interventions to be more targeted, evidence-based and cost-effective.
Appendix
The 26 items used in the survey
-
(1) One of the main causes of mental illness is a lack of self-discipline and will-power
-
(2) There is somthing about people with mental illness that makes it easy to tell them from normal people
-
(3) As soon as a person shows signs of mental disturbance, he should be hospitalised
-
(4) Mental illness is an illness like any other
-
(5) Less emphasis should be placed on protecting the public from people with mental illness
-
(6) Mental hospitals are an outdated means of treating people with mental illness
-
(7) Virtually anyone can become mentall ill
-
(8) People with mental illness have for too long been the subject of ridicule
-
(9) We need to adopt a far more tolerant attitude toward people with mental illness in our society
-
(10) We have a responsibility to provide the best possible care for people with mental illness
-
(11) People with mental illness don't deserve our sympathy
-
(12) People with mental illness are a burden on society
-
(13) Increased spending on mental health services is a waste of money
-
(14) There are sufficient existing services for people with mental illness
-
(15) People with mental illness should not be given any responsibility
-
(16) A woman would be foolish to marry a man who has suffered from mental illness, even though he seems fully recovered
-
(17) I would not want to live next door to someone who has been mentally ill
-
(18) Anyone with a history of mental problems should be excluded from taking public office
-
(19) No-one has the right to exclude people with mental illness from their neighbourhood
-
(20) People with mental illness are far less of a danger than most people suppose
-
(21) Most women who were once patients in a mental hospital can be trusted as babysitters
-
(22) The best therapy for many people with mental illness is to be part of a normal community
-
(23) As far as possible, mental health services should be provided through community based facilities
-
(24) Residents have nothing to fear from people coming into their neighbourhood to obtain mental health services
-
(25) It is frightening to think of people with mental problems living in residential neighbourhoods
-
(26) Locating mental health facilities in a residential area downgrades the neighbourhood.
Acknowledgements
We wish to thank Mauricio Moreno for his valuable IT assistance. A.K. is supported by a wholly educational grant from Lundbeck UK, and an NIHR Applied Programme award. G.T. is supported in part by the NIHR Biomedical Research Centre at the South London and Maudsley NHS Foundation Trust/Institute of Psychiatry (King's College London). We also thank SHIFT for allowing us access to these data.




eLetters
No eLetters have been published for this article.