Subclinical depression is highly prevalent, Reference Cuijpers, De Graaf and Van Dorsselaer1,Reference Horwarth, Johnson, Klerman and Weissman2 is associated with decreased levels of health-related quality of life, Reference Rucci, Gherardi, Tansella, Piccinelli, Berardi and Bisoffi3,Reference Chachamovich, Fleck, Laidlaw and Power4 increased use of health services, Reference Goldney, Fisher, Dal Grande and Taylor5 economic costs, Reference Cuijpers, Smit, Oostenbrink, de Graaf, ten Have and Beekman6 and mortality rates. Reference Cuijpers, Vogelzangs, Twisk, Kleiboer, Li and Penninx7 Individuals are considered to have subclinical depression when they display clinically relevant depressive symptoms but standard diagnostic criteria for a depressive disorder are not met. It can be defined according to the DSM (at least one of the core symptoms for depression is met as well as one other symptom, but no more than four symptoms in total), or as a score above a cut-off level on a self-report depression scale while the criteria for a depressive disorder according to a diagnostic interview are not met. Subclinical depression is important from a clinical perspective not only because it can be a disabling condition that needs treatment, but also because of the associated risk of developing major depression, which may be averted by treatment.
A recent meta-analysis showed that it is unlikely that antidepressants and benzodiazepines have a clinically important advantage over placebo in individuals with subclinical depression. Reference Barbui, Cipriani, Patel, Ayuso-Mateos and van Ommeren8 It is not clear, however, whether psychological treatments are effective in subclinical depression. In an earlier review we identified only seven randomised trials examining the effects of psychological treatments of subclinical depression. Reference Cuijpers, van Straten and Smit9 These studies did confirm that psychological treatments have moderate effects on subclinical depression, but the confidence intervals around these effects were broad, and it could not be established that these treatments were able to reduce the incidence of major depressive disorder at follow-up. Since then, the number of randomised trials has increased considerably (as of January 2013, we identified 18 trials). We decided therefore to conduct a new meta-analysis to examine whether we could confirm the earlier finding that psychotherapy is effective in subclinical depression, and whether psychotherapeutic interventions reduce the incidence of major depressive episodes.
Method
We constructed a database of papers on the psychological treatment of depression that has been described in detail elsewhere, Reference Cuijpers, van Straten, Warmerdam and Andersson10 and has been used in a series of earlier published meta-analyses (www.evidencebasedpsychotherapies.org). This database has been continuously updated through comprehensive literature searches (from 1966 to January 2013). In these searches we examined 14 164 abstracts from PubMed (3638 abstracts), PsycINFO (2824), EMBASE (4682) and the Cochrane Central Register of Controlled Trials (3020). These abstracts were identified by combining terms indicative of psychological treatment and depression (both MeSH terms and text words). For this database we also checked the primary studies from 42 meta-analyses of psychological treatment for depression to ensure that no published study was missed. From the 14 164 abstracts (10 474 after removal of duplicates) we retrieved 1476 full-text papers for possible inclusion in the database. We included randomised, controlled trials in which a psychological intervention was compared with a control condition in participants with clinically relevant depressive symptoms but no major depressive disorder or dysthymia, as established with help of a standardised diagnostic interview such as the Structured Clinical Interview for DSM Disorders (SCID), Composite International Diagnostic Interview (CIDI) or the Schedules for Clinical Assessment in Neuropsychiatry (SCAN) to exclude the presence of a full-blown mood disorder at baseline. Clinically relevant depressive symptoms were defined as scoring above a cut-off level on a self-rating depression questionnaire; scoring above a cut-off level on a clinician-rated instrument; or meeting criteria for minor depression according to the DSM, ICD or Research Diagnostic Criteria. We also included studies in which participants with a diagnosed depressive disorder were examined, but only when results were specifically reported for participants with subclinical depression. Studies examining stepped-care models for the treatment of depression were also included, as these usually have a strong focus on psychological treatments. We excluded studies in adolescents or children (⩽18 years). Comorbid general medical or psychiatric disorders were not used as an exclusion criterion. No language restriction was applied.
To compare the effects of psychotherapy for subclinical depression with those of psychotherapy for major depressive disorder, we also selected studies in which participants met criteria for major depression at baseline. We used the same inclusion criteria as for the studies on subclinical depression, except that patients had to meet criteria for major depression according to a diagnostic interview. Studies among patients with other depressive disorders (dysthymia, adjustment disorders) were excluded, as were studies of people receiving in-patient treatment.
Quality assessment and data extraction
We assessed the validity of included studies using five of the six criteria of the ‘risk of bias’ assessment tool developed by the Cochrane Collaboration. Reference Higgins and Green11 This tool assesses possible sources of bias in randomised trials, including the adequate generation of allocation sequence, concealment of allocation to conditions, prevention of knowledge of the allocated intervention (masking of assessors), dealing with incomplete outcome data (this was assessed as positive when intention-to-treat analyses were conducted, meaning that all randomised patients were included in the analyses) and selective outcome reporting. The sixth item of the risk of bias assessment tool (other problems that could put it at a high risk of bias) was not used in this study because we found no clear indication in any of the studies that this had influenced the validity of the study. We also coded additional aspects of the included studies such as participant characteristics (recruitment method: community, from clinical samples or other; target group: adults in general or more specific target groups such as older adults); intervention characteristics (format: individual, group or guided self-help; number of sessions; type of psychotherapy: cognitive-behavioural therapy or other); and study characteristics (type of control group: care as usual, in which no specific intervention was offered to participants although they could use any care or treatment they wanted, or other control group). Quality assessment and data extraction were done by two independent researchers.
Statistical analysis
For each comparison between a psychotherapy condition and a control group, the effect size indicating the difference between the two groups at the post-test assessment was calculated (Hedges’ g). Effect sizes were calculated by subtracting (post-test) the average score of the psychotherapy group from the average score of the control group, and dividing the result by the pooled standard deviation. Because several studies had small samples we corrected the effect size for small sample bias according to the procedures suggested by Hedges & Olkin. Reference Hedges and Olkin12 In the calculation of effect sizes we used only instruments that explicitly measured symptoms of depression, such as the Beck Depression Inventory (BDI) or the Hamilton Rating Scale for Depression (HRSD). Reference Beck, Ward, Mendelson, Mock and Erbaugh13,Reference Hamilton14 If more than one depression measure was used the mean of the effect sizes was calculated, so that each comparison yielded only one effect (using the methods described by Borenstein et al). Reference Borenstein, Hedges, Higgins and Rothstein15 If dichotomous outcomes were reported without means and standard deviations we used the procedures described by Borenstein et al to calculate the standardised mean difference. Reference Borenstein, Hedges, Higgins and Rothstein15 To calculate pooled mean effect sizes, we used the computer program Comprehensive Meta-Analysis version 2.2.021 for Windows. Because we expected considerable heterogeneity among the studies, we employed a random effects pooling model. Because the standardised mean difference (Hedges’ g) is not easy to interpret from a clinical perspective we transformed these values into the number needed to treat (NNT), using the formulas provided by Kraemer & Kupfer. Reference Kraemer and Kupfer16 The NNT indicates the number of patients that have to be treated in order to generate one additional positive outcome. Reference Laupacis, Sackett and Roberts17
As a test of homogeneity of effect sizes we calculated the I 2 statistic as an indicator of heterogeneity (0% no observed heterogeneity, 25% low, 50% moderate and 75% high heterogeneity). We calculated 95% confidence intervals around I 2, using the non-central chi-squared approach within the ‘heterogi’ module for Stata. Reference Ioannidis, Patsopoulos and Evangelou18,Reference Orsini, Higgins, Bottai and Buchan19 We also calculated the Q statistic, but only report whether this was significant. Subgroup analyses were conducted according to the mixed effects model, Reference Borenstein, Hedges, Higgins and Rothstein15 in which studies within subgroups were pooled with the random effects model, whereas tests for significant differences between subgroups were conducted with the fixed effects model. For continuous variables we used meta-regression analyses to test whether there was a significant relationship between the continuous variable and effect size, as indicated by a Z value and an associated P value. Multivariate meta-regression analyses in which more than one predictor was entered simultaneously were conducted in Stata/MP version 11.0 for Mac, because these analyses cannot be conducted in Comprehensive Meta-analysis. In order to avoid collinearity, we first calculated the correlation between predictors but found no correlation higher than r = 0.60. Publication bias was tested by inspecting the funnel plot on primary outcome measures and by Duval & Tweedie’s trim and fill procedure, Reference Duval and Tweedie20 which yields an estimate of the effect size after the publication bias has been taken into account (as implemented in Comprehensive Meta-analysis version 2.2.021). We also conducted Egger’s test of the intercept to quantify the bias captured by the funnel plot and test whether it was significant.
Results
Eighteen studies met the inclusion criteria for the meta-analysis of psychotherapy for subclinical depression (Fig. 1). Reference Allart-van Dam, Hosman, Hoogduin and Schaap21-Reference Williams, Barrett, Oxman, Frank, Katon and Sullivan38 Another 56 studies compared the effects of psychotherapy with a control group in patients with a diagnosed major depressive disorder. These 56 studies were included for the comparisons between psychotherapy for subclinical depression and major depression. Selected characteristics and references for the 56 studies examining psychotherapy for major depressive disorder are presented in online Appendix DS1.
Characteristics of included studies
The 18 studies on subclinical depression included 1913 participants: 947 in the treatment groups and 966 in the control groups. Selected characteristics of the included studies appear in online Table DS1. There were considerable differences between the studies in terms of recruitment setting, target group and definition of subclinical depression (scoring above a cut-off point on a self-report instrument v. DSM criteria for minor depression). Different types of therapy were used, although most interventions were based on cognitive-behavioural therapy (CBT), and the interventions also differed in terms of treatment format (individual, group, telephone-based, guided self-help) and number of treatment sessions (range 6-16). The quality of the included studies varied (Table DS1). Seven of the 18 studies reported an adequate sequence generation. Eight studies reported allocation to conditions by an independent (third) party. Three of the four studies in which a clinician-rated outcome was used reported masking of outcome assessors (the other 14 studies used only self-report measures) and in 13 studies intention-to-treat analyses were conducted. In five studies, the risk of selective outcome reporting was assessed as low. Five studies met all five quality criteria, 6 met two to four criteria and the remaining 7 studies had a lower quality (none or one of the four criteria).
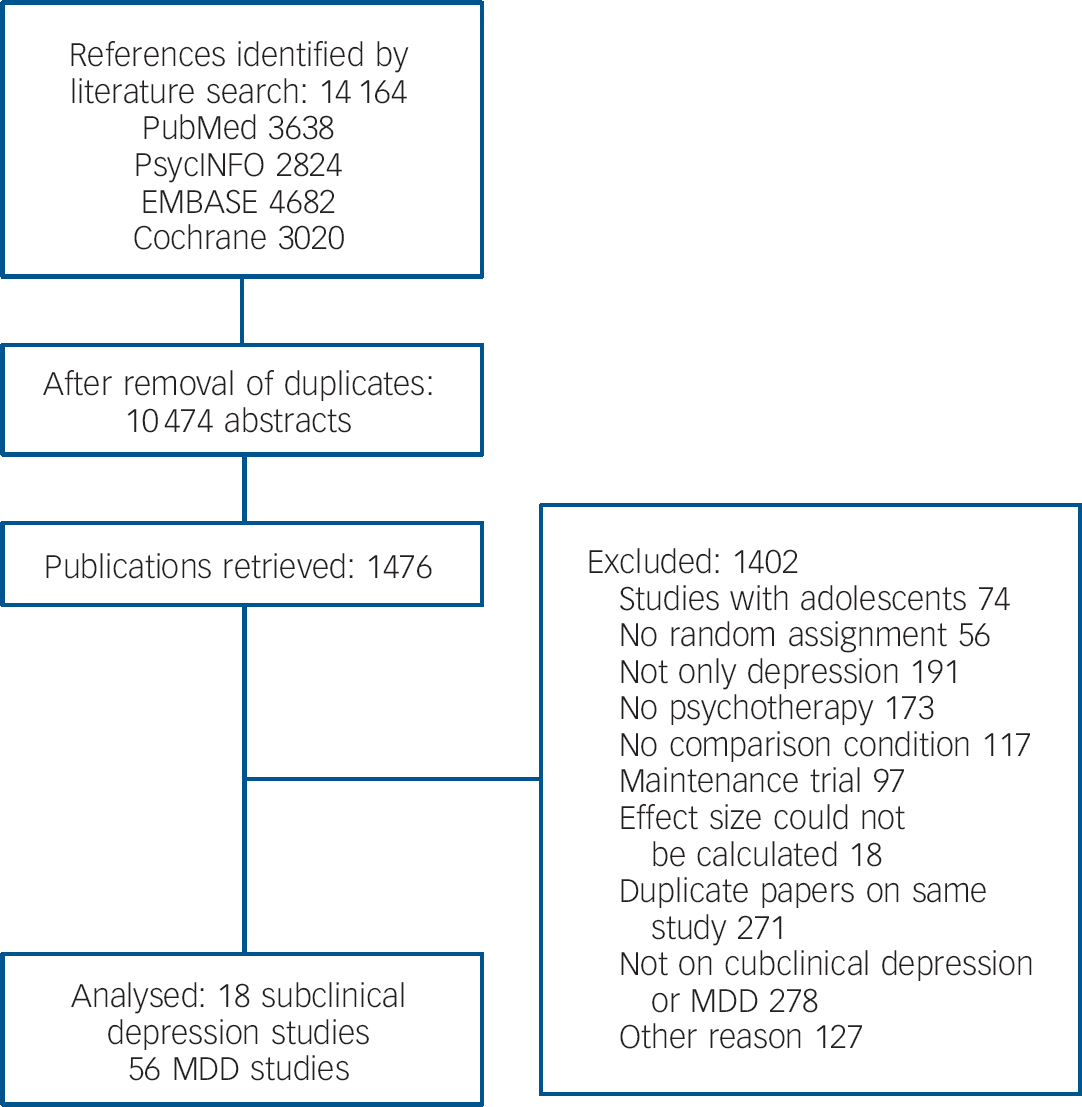
Fig. 1 Flowchart of inclusion of studies (MDD, major depressive disorder)
Short-term effects on depressive symptoms
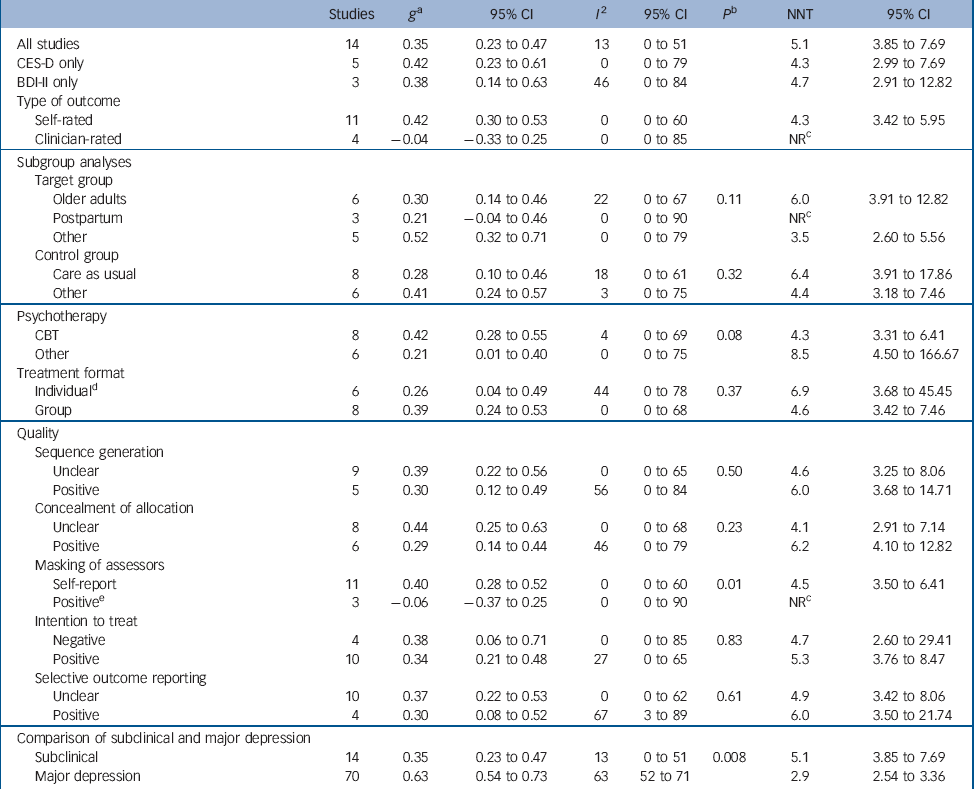
The effects of psychotherapy compared with the control conditions at post-test assessment were available for 14 studies. The pooled effect size was g = 0.35 (95% CI 0.23-0.47), which corresponds with an NNT of 5.10 (95% CI 3.85-7.69). Heterogeneity was low (I 2 = 13, 95% CI 0-51). The results of these analyses are presented in Table 1. Figure 2 gives a forest plot of the effect sizes and their confidence intervals. The results limited to the Center for Epidemiological Studies - Depression scale (CES-D) and the BDI-II were comparable to the overall analyses, as were the results for the self-report instruments. The four studies in which a clinician-rated instrument was used, however, resulted in a non-significant effect size of –0.04 (95% CI –0.33 to 0.25). We found few indications of publication bias. Visual inspection of the funnel plot suggested symmetry, and Duval & Tweedie’s trim and fill procedure indicated that no study was missing (the imputed effect size was exactly the same as the actual effect size). Egger’s test was also not significant (P>0.1). The subgroup analyses did not results in any significant difference between subgroups, except for the difference between outcomes based on self-report measures and outcomes based on an interview by a (masked) assessor.
Long-term effects on incidence of major depression
We calculated the relative risk (RR) of developing a major depressive disorder in the treatment and control groups at follow-up, as well as the NNT (defined as the inverse of the risk difference). Results are presented in Table 2 and Fig. 3. Treatment significantly reduced the incidence of major depressive episodes at 6-month follow-up (RR = 0.61, 95% CI 0.37-0.99; P<0.05; I 2 = 19, 95% CI 0-83; that is, a reduction in incidence of 39%), and possibly at 12-month follow-up (RR = 0.74, 95% CI 0.50-1.10; a reduction in incidence of 26%). Change in the numbers needed to treat was also significant at 6-month follow-up (NNT = 10.3, 95% CI 6.3-28.6) and at 12-month follow-up (NNT = 16.4, 95% CI 8.5-250).
Comparison with psychotherapy for major depression
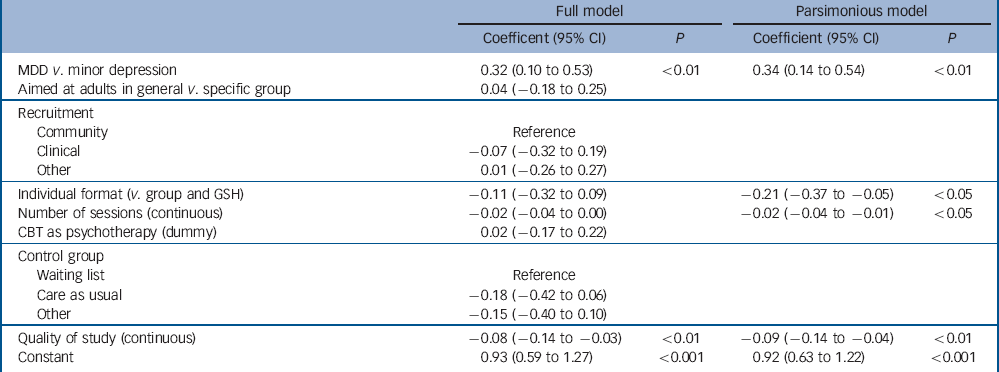
The unadjusted effect size for psychotherapy for major depression (g = 0.63, 95% CI 0.54-0.73) was significantly larger than that for psychotherapy for subclinical depression (g = 0.35, P<0.01). In the multivariate analyses, in which we adjusted for study quality and other characteristics of the studies, this difference between subclinical depression and major depression remained significant (Table 3). In a (manual) back-step meta-regression analysis, in which we dropped the least significant variable in each step until only significant predictors were retained in the model (parsimonious model in Table 3), the difference between subclinical and major depression was still significantly associated with the effect size (P<0.01).
Discussion
We found that psychological treatments had a small to moderate but statistically significant effect on subclinical depression, with an NNT of about 5. We also found that these treatments had a significant preventive effect on the onset of major depressive disorder at 6 months (RR = 0.61, NNT = 10) and possibly at 12 months (RR = 0.74, NNT = 16). However, the included studies differed considerably from each other in terms of target groups, treatment, and design and type of control group, and the quality of most studies in this field was found to be suboptimal. Furthermore the clinician-rated outcomes did not indicate a significant result of these treatments; positive results were based only on self-report measures. These results should therefore be considered with caution and verified in further research. Because most studies used a waiting list or care as usual control group, it is not surprising that small effects were found. These might be due to placebo or non-specific effects of the treatments. Most studies of pharmacotherapy for subclinical depression have used a pill-placebo control group, Reference Barbui, Cipriani, Patel, Ayuso-Mateos and van Ommeren8 and it is likely that if these were compared with waiting lists or care as usual they would result in effects similar to the psychotherapies. This suggests that the effects of the psychological interventions may in part be explained by non-specific or placebo effects. The comparability of psychotherapy and pharmacotherapy studies of subclinical depression is limited by these methodological differences. The effects of psychological treatments on subclinical depression are not as large as those on major depression, even after adjusting for the characteristics of the populations, therapies, study quality and other characteristics of the studies. This is not surprising, as possibilities for improvement are more limited in subclinical depression than in major depression.
Limitations
This meta-analysis has several important limitations. First, we have already noted the considerable differences between the target groups, interventions and characteristics of the included studies, and the low quality of several of the included studies. We did find that the subset of high-quality studies resulted in a statistically reliable effect, but that does not fully address the clinical heterogeneity of the included studies. Second, the relatively small number of studies should also be reported as a limitation, as this restricts the statistical power to detect differences between subgroups. We did not find any difference between CBT and other psychotherapies, but this may have been caused by inadequate statistical power to detect such differences. On the other hand, there is not much evidence that CBT or any other type of psychotherapy is more effective than other psychotherapies. Reference Cuijpers, van Straten, Andersson and van Oppen39 A third limitation is that the study selection was not done by two independent researchers, although quality assessment and data abstraction were performed independently by two raters. Another concern already mentioned is that most included studies used only self-report measures, and that clinician-rated outcomes did not indicate a significant benefit of psychotherapies over control. However, an earlier meta-analysis showed that self-rated instruments are more conservative than clinician-rated instruments when assessing the outcomes of psychotherapy for depression. Reference Cuijpers, Li, Hofmann and Andersson40 The divergence of estimated effects, as a function of self-report v. rater-administered scales, could also reflect the differential sensitivity of the BDI and CES-D to psychological effects, whereas scales like the HRSD focus more on neurovegetative symptoms of depression. We also want to stress that the NNTs for the preventive effects of the treatments should be interpreted with caution, because these depend on event rates. Because the event rates in the studies differed considerably from each other (ranging from 0.09 to 0.26), the NNTs might be considerably lower when the event rate in the target groups is lower.
Table 1 Effects of psychological treatment of minor depression compared with control groups at post-test: Hedges’ g
| Studies | g Footnote a | 95% CI | I 2 | 95% CI | P Footnote b | NNT | 95% CI | |
|---|---|---|---|---|---|---|---|---|
| All studies | 14 | 0.35 | 0.23 to 0.47 | 13 | 0 to 51 | 5.1 | 3.85 to 7.69 | |
| CES-D only | 5 | 0.42 | 0.23 to 0.61 | 0 | 0 to 79 | 4.3 | 2.99 to 7.69 | |
| BDI-II only | 3 | 0.38 | 0.14 to 0.63 | 46 | 0 to 84 | 4.7 | 2.91 to 12.82 | |
| Type of outcome | ||||||||
| Self-rated | 11 | 0.42 | 0.30 to 0.53 | 0 | 0 to 60 | 4.3 | 3.42 to 5.95 | |
| Clinician-rated | 4 | –0.04 | –0.33 to 0.25 | 0 | 0 to 85 | NRFootnote c | ||
| Subgroup analyses | ||||||||
| Target group | ||||||||
| Older adults | 6 | 0.30 | 0.14 to 0.46 | 22 | 0 to 67 | 0.11 | 6.0 | 3.91 to 12.82 |
| Postpartum | 3 | 0.21 | –0.04 to 0.46 | 0 | 0 to 90 | NRFootnote c | ||
| Other | 5 | 0.52 | 0.32 to 0.71 | 0 | 0 to 79 | 3.5 | 2.60 to 5.56 | |
| Control group | ||||||||
| Care as usual | 8 | 0.28 | 0.10 to 0.46 | 18 | 0 to 61 | 0.32 | 6.4 | 3.91 to 17.86 |
| Other | 6 | 0.41 | 0.24 to 0.57 | 3 | 0 to 75 | 4.4 | 3.18 to 7.46 | |
| Psychotherapy | ||||||||
| CBT | 8 | 0.42 | 0.28 to 0.55 | 4 | 0 to 69 | 0.08 | 4.3 | 3.31 to 6.41 |
| Other | 6 | 0.21 | 0.01 to 0.40 | 0 | 0 to 75 | 8.5 | 4.50 to 166.67 | |
| Treatment format | ||||||||
| IndividualFootnote d | 6 | 0.26 | 0.04 to 0.49 | 44 | 0 to 78 | 0.37 | 6.9 | 3.68 to 45.45 |
| Group | 8 | 0.39 | 0.24 to 0.53 | 0 | 0 to 68 | 4.6 | 3.42 to 7.46 | |
| Quality | ||||||||
| Sequence generation | ||||||||
| Unclear | 9 | 0.39 | 0.22 to 0.56 | 0 | 0 to 65 | 0.50 | 4.6 | 3.25 to 8.06 |
| Positive | 5 | 0.30 | 0.12 to 0.49 | 56 | 0 to 84 | 6.0 | 3.68 to 14.71 | |
| Concealment of allocation | ||||||||
| Unclear | 8 | 0.44 | 0.25 to 0.63 | 0 | 0 to 68 | 0.23 | 4.1 | 2.91 to 7.14 |
| Positive | 6 | 0.29 | 0.14 to 0.44 | 46 | 0 to 79 | 6.2 | 4.10 to 12.82 | |
| Masking of assessors | ||||||||
| Self-report | 11 | 0.40 | 0.28 to 0.52 | 0 | 0 to 60 | 0.01 | 4.5 | 3.50 to 6.41 |
| PositiveFootnote e | 3 | –0.06 | –0.37 to 0.25 | 0 | 0 to 90 | NRFootnote c | ||
| Intention to treat | ||||||||
| Negative | 4 | 0.38 | 0.06 to 0.71 | 0 | 0 to 85 | 0.83 | 4.7 | 2.60 to 29.41 |
| Positive | 10 | 0.34 | 0.21 to 0.48 | 27 | 0 to 65 | 5.3 | 3.76 to 8.47 | |
| Selective outcome reporting | ||||||||
| Unclear | 10 | 0.37 | 0.22 to 0.53 | 0 | 0 to 62 | 0.61 | 4.9 | 3.42 to 8.06 |
| Positive | 4 | 0.30 | 0.08 to 0.52 | 67 | 3 to 89 | 6.0 | 3.50 to 21.74 | |
| Comparison of subclinical and major depression | ||||||||
| Subclinical | 14 | 0.35 | 0.23 to 0.47 | 13 | 0 to 51 | 0.008 | 5.1 | 3.85 to 7.69 |
| Major depression | 70 | 0.63 | 0.54 to 0.73 | 63 | 52 to 71 | 2.9 | 2.54 to 3.36 |
BDI, Beck Depression Inventory; CBT, cognitive-behavioural therapy; CES-D, Center for Epidemiological Studies Depression scale; NNT, number needed to treat; NR, not reported.
a. According to the random effects model.
b The P value indicates whether the subgroups differ from each other.
c. Numbers needed to treat for non-significant results are not reported.
d. Includes telephone-based therapy.
e. In one study a clinician-rated instrument was used, without indication that the raters were masked. This study was not included in these analyses.
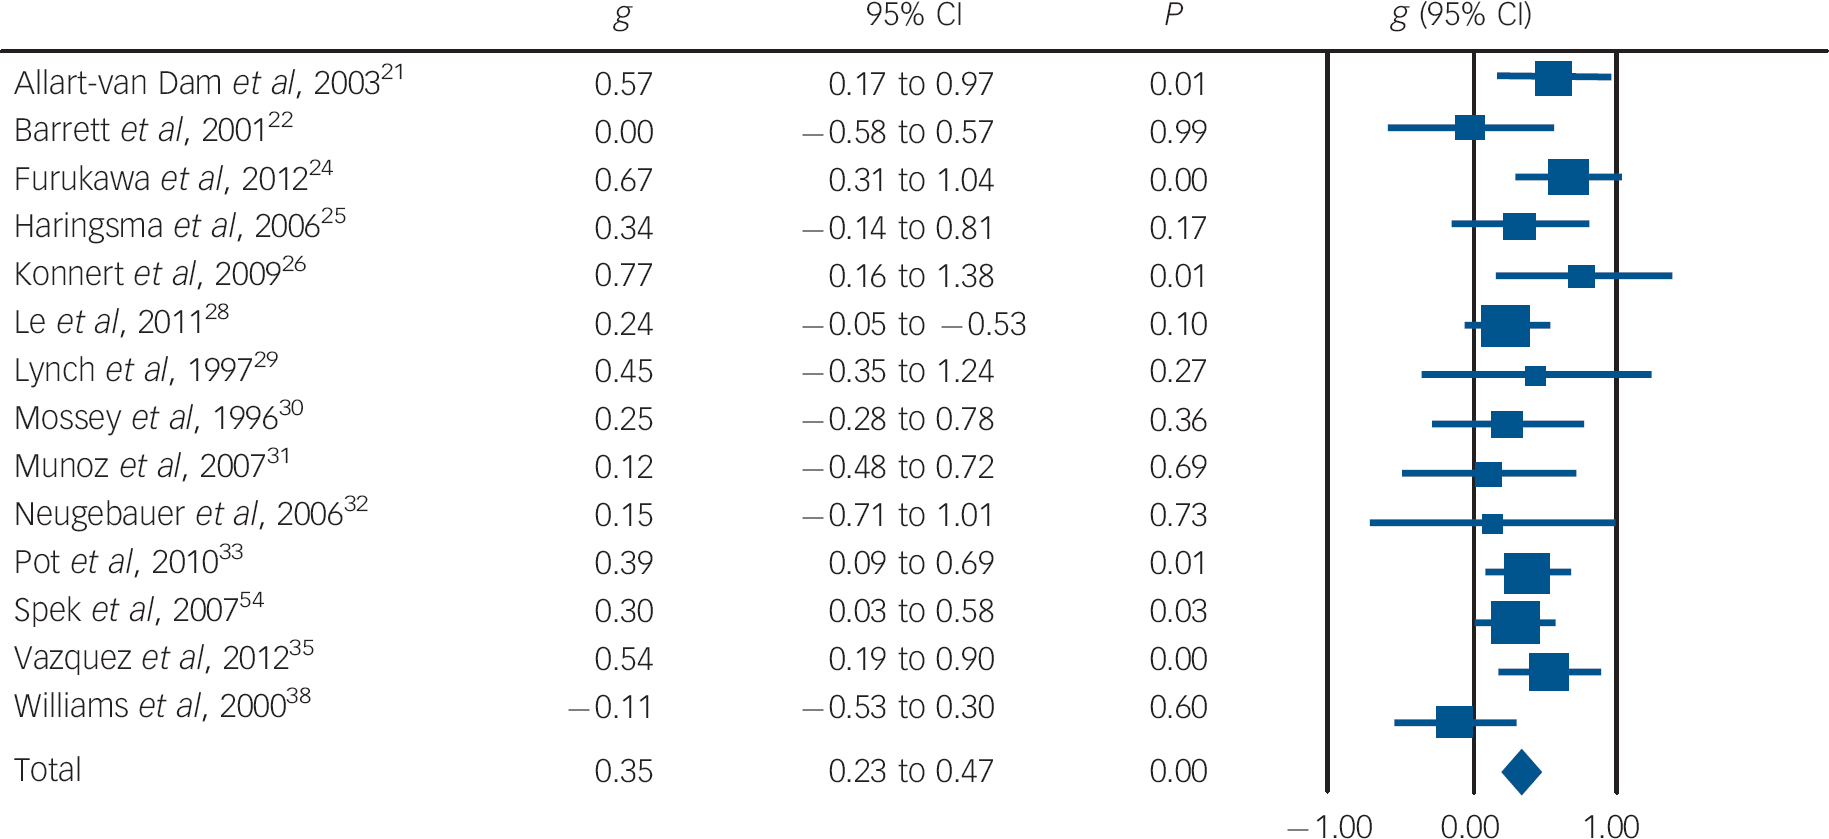
Fig. 2 Standardised effect sizes of psychotherapy for subclinical depression compared with control conditions: Hedges’ g.
Table 2 Effects of psychological treatment on the incidence of major depressive disorder: relative risks

| Studies | RRFootnote a (95% CI) | I 2 (95% CI) | NNT (95% CI) | |
|---|---|---|---|---|
| Follow-up period | ||||
| 6 months | 5 | 0.61Footnote * (0.37-0.99) | 19 (0-83) | 10.3Footnote ** (6.3-28.6) |
| 12 months | 4 | 0.74 (0.50-1.10) | 0 (0-85) | 16.4Footnote * (8.5-250) |
| 24 months | 2 | 0.61 (0.16-2.36) | 84Footnote b | NRFootnote c |
NNT, number needed to treat; NR, not reported; RR, relative risk.
a. According to the random effects model.
b. Confidence intervals cannot be calculated with two studies.
c. Numbers needed to treat are not reported for non-significant results.
* P<0.05
** P<0.01.
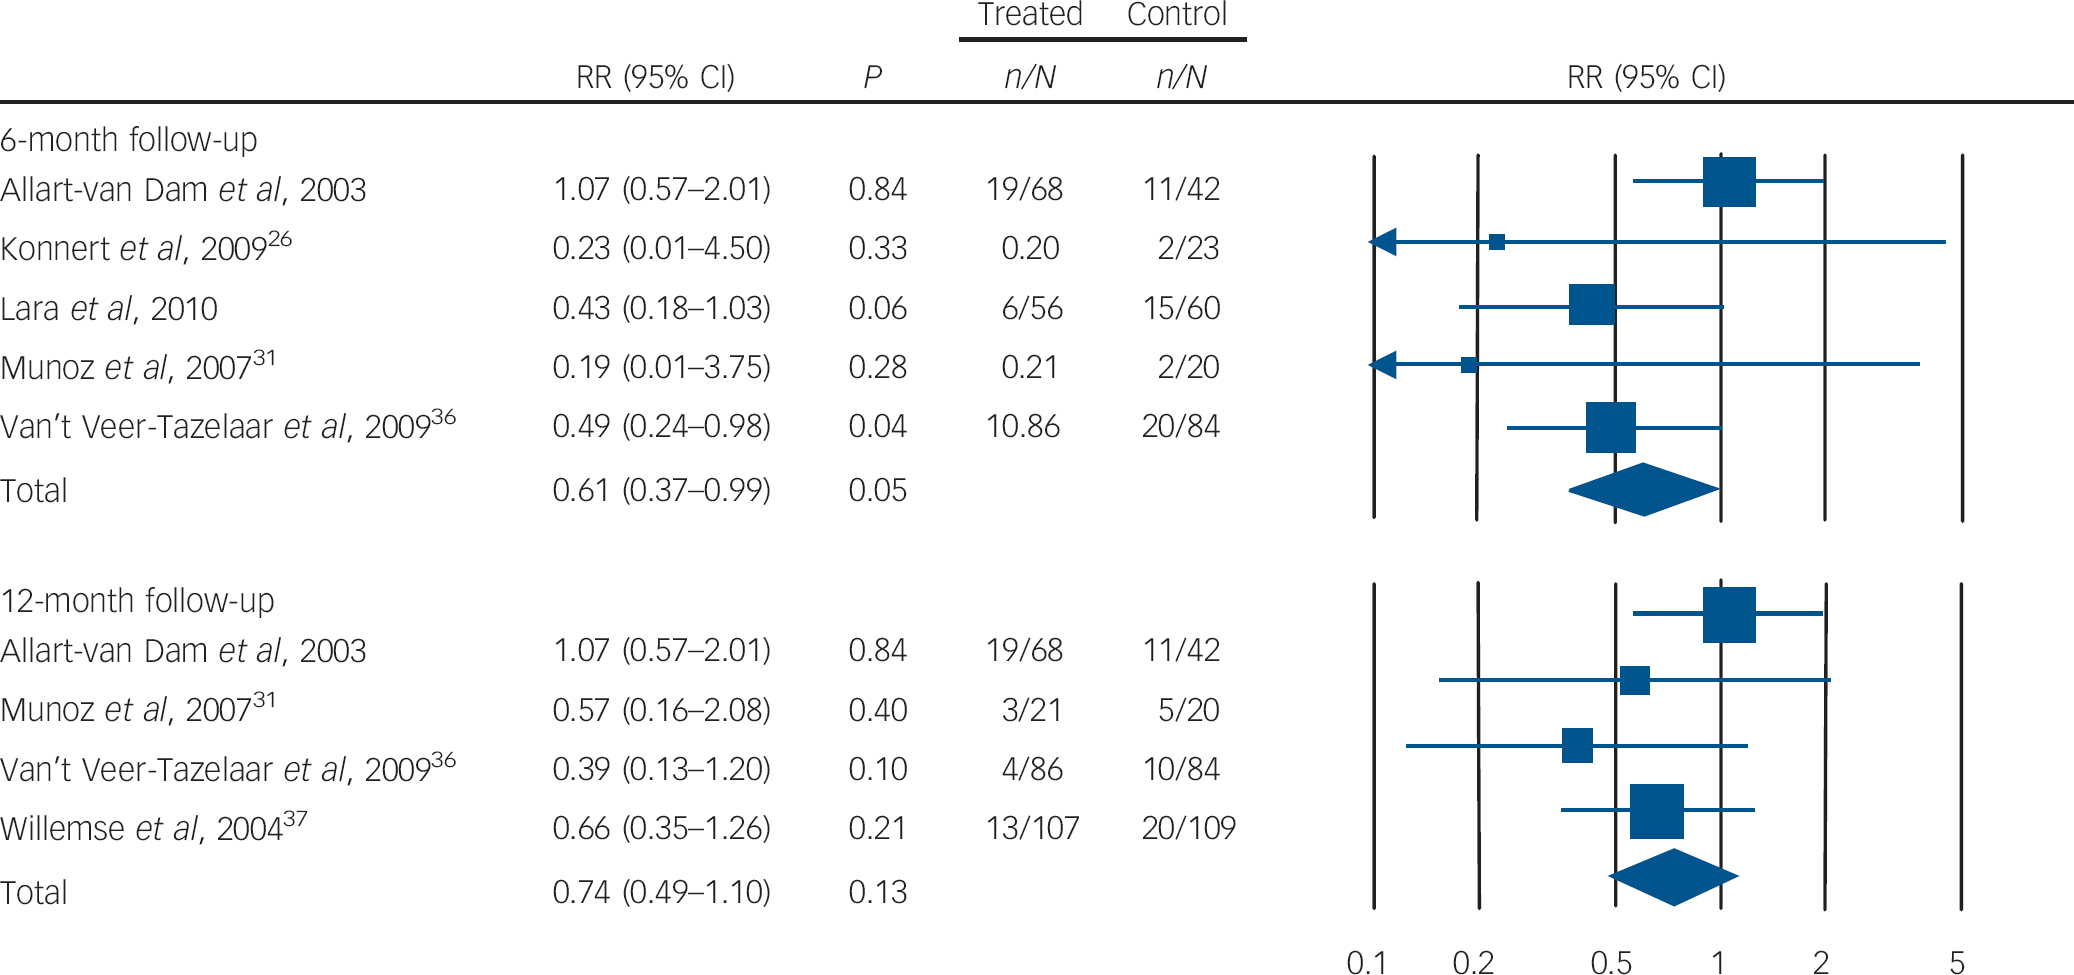
Fig. 3 Effects of psychological treatments on incidence of major depression: risk ratios (RR) at 6-month and 12-month follow-up.
Table 3 Standardised regression coefficients of characteristics of studies on psychotherapy for adult depression: multivariate metaregression analysis
| Full model | Parsimonious model | |||
|---|---|---|---|---|
| Coefficent (95% CI) | P | Coefficient (95% CI) | P | |
| MDD v. minor depression | 0.32 (0.10 to 0.53) | <0.01 | 0.34 (0.14 to 0.54) | <0.01 |
| Aimed at adults in general v. specific group | 0.04 (–0.18 to 0.25) | |||
| Recruitment | ||||
| Community | Reference | |||
| Clinical | –0.07 (–0.32 to 0.19) | |||
| Other | 0.01 (–0.26 to 0.27) | |||
| Individual format (v. group and GSH) | –0.11 (–0.32 to 0.09) | –0.21 (–0.37 to –0.05) | <0.05 | |
| Number of sessions (continuous) | –0.02 (–0.04 to 0.00) | –0.02 (–0.04 to –0.01) | <0.05 | |
| CBT as psychotherapy (dummy) | 0.02 (–0.17 to 0.22) | |||
| Control group | ||||
| Waiting list | Reference | |||
| Care as usual | –0.18 (–0.42 to 0.06) | |||
| Other | –0.15 (–0.40 to 0.10) | |||
| Quality of study (continuous) | –0.08 (–0.14 to –0.03) | <0.01 | –0.09 (–0.14 to –0.04) | <0.01 |
| Constant | 0.93 (0.59 to 1.27) | <0.001 | 0.92 (0.63 to 1.22) | <0.001 |
CBT, cognitive-behavioural therapy; GSH, guided self-help; MDD, major depressive disorder.
Implications
Psychological therapies may be effective in the treatment of subclinical depression and also may reduce the incidence of major depressive disorder. These results should, however, be confirmed in further randomised trials, because of the clinical heterogeneity, the low quality of the included studies and because the clinician-rated outcomes did not achieve significance.


eLetters
No eLetters have been published for this article.