Before the 1960s, personality disorders were viewed as unreliable diagnoses of limited clinical utility. Personality disorders are now recognised as important conditions, which are associated with morbidity, premature mortality, and great personal and social costs.Reference Moran, Romaniuk, Coffey, Chanen, Degenhardt and Borschmann1–Reference Samuels3
A recent narrative review reported relatively high rates of personality disorders (4.4–21.5%) in community populations across the Western world.Reference Quirk, Berk, Chanen, Koivumaa-Honkanen, Brennan-Olsen and Pasco4 To the best of our knowledge, however, there are no reviews examining global prevalence of personality disorders, and whether rates vary between high-income countries and low- and middle-income countries (LMICs). This is important because personality disorders are often under-recognised in clinical practice, especially in LMICs where there are limited resources and other disorders such as psychosis tend to be prioritised.Reference Sharan, Levav, Olifson, De Francisco and Saxena5 Approximately 80% of the global population live in LMICs, and mental health is now recognised as a public health priority in these areas.Reference Patel6 Nevertheless, personality disorders are not included within the scope of policy-informing initiatives, such as the World Health Organization (WHO) Mental Health Gap Action ProgrammeReference Bruckner, Scheffler, Shen, Yoon, Chisholm and Morris7 and the Global Burden of Diseases Project.Reference Quirk, Williams, Chanen and Berk8 Consequently, there are no data to guide health policy and planning for personality disorders in LMICs.Reference Ronningstam, Keng, Ridolfi, Arbabi and Grenyer9,Reference Ryder, Sunohara and Kirmayer10 Personality disorders are associated with high levels of mental, physical and functional impairment and premature mortality.Reference Moran, Romaniuk, Coffey, Chanen, Degenhardt and Borschmann1,Reference Winsper, Marwaha, Lereya, Thompson, Eyden and Singh11 Neglecting their effects at the population level is likely to impede progress in reducing the burden of disability.Reference Quirk, Williams, Chanen and Berk8 Therefore, the main aim of this study was to conduct a systematic review of the literature on the prevalence of personality disorders to answer the following research questions.
(1) What is the global pooled prevalence of any personality disorder in the community?
(2) What is the prevalence of cluster A, B and C personality disorders in the community?
(3) Do pooled personality disorder prevalence rates differ between high-income countries and LMICs?
(4) Do methodological factors (population characteristics, sample characteristics, study and assessment methods) explain variability in prevalence estimates across studies?
Method
We conducted the review in accordance with Preferred Reporting Items for Systematic Reviews and Meta-Analyses (PRISMA)Reference Moher, Shamseer, Clarke, Ghersi, Liberati and Petticrew12 and Meta-analyses Of Observational Studies in Epidemiology (MOOSE) guidelines.Reference Stroup, Berlin, Morton, Olkin, Williamson and Rennie13 The protocol was registered with PROSPERO before conducting searches (registration number: CRD42017065094). The completed review remains aligned with the original PROSPERO protocol in terms of search strategy, research questions and methodology; however, we could not examine the effects of some of the preselected potential moderators of prevalence figures (e.g. gender and ethnicity of sample) as there were insufficient data.
Eligibility criteria
We included studies:
(1) that were cross-sectional or longitudinal (i.e. personality disorders were assessed during one wave of the study)Reference Polanczyk, Salum, Sugaya, Caye and Rohde14 and reported a prevalence figure for any personality disorder or a cluster A, B or C personality disorder. We did not limit to a specific diagnostic criteria (e.g. DSM-IV [1994] or ICD-10 [1992]);Reference Polanczyk, Salum, Sugaya, Caye and Rohde14
(2) sampling adolescents (age 12–18 years) or adults from community or school populations. In line with recent Cochrane reviews,Reference Stoffers-Winterling, Storebø, Völlm, Mattivi, Nielsen and Kielsholm15 we elected to include adolescent populations, supported by strong evidence for the validity of personality disorders in individuals under 18 years;Reference Winsper, Marwaha, Lereya, Thompson, Eyden and Singh11,Reference Winsper, Lereya, Marwaha, Thompson, Eyden and Singh16,Reference Winsper, Marwaha, Lereya, Thompson, Eyden and Singh17
(3) using validated interviews or self-report questionnaires. We included self-report questionnaires in the first instance to examine the impact (e.g. potential inflation) of this type of assessment on prevalence estimates;Reference Oltmanns, Rodrigues, Weinstein and Gleason18
(4) published in any language with an English abstract (we found that all foreign language studies identified provided an English abstract); and
(5) published in a peer-reviewed journal.
We excluded studies:
(1) with participants from clinical, medical, psychiatric or prison settings;
(2) with selective samples (e.g. chronic pain groups, students in higher education, case–control samples);
(3) with less than 100 participants;Reference Van Os, Linscott, Myin-Germeys, Delespaul and Krabbendam19 and
(4) that adopted a retrospective diagnostic approach based on previously recorded data from primary or secondary care records or national registries.Reference Polanczyk, De Lima, Horta, Biederman and Rohde20 Results from clinical records or administrative databases might diverge from epidemiological surveys, as personality disorders are often underdiagnosed in these sources,Reference Cailhol, Pelletier, Rochette, Laporte, David and Villeneuve21 whereas register-based diagnoses might lack the reliability achieved by well-trained interviewers.Reference Vassos, Agerbo, Mors and Pedersen22
Search strategy, study selection and critical appraisal
We searched PsycINFO, MEDLINE, EMBASE and PubMed from January 1980 to May 2017 for articles without language restrictions. We updated the search on 24 May 2018. We combined the following three search strings: personality disorder* OR Axis-II AND prevalen* OR rate* OR frequency OR percentage AND epidemiolog* OR communit* OR general population OR population OR student* OR healthy sample OR normal population OR representative sample* (see Supplementary Table DS1 available at https://doi.org/10.1192/bjp.2019.166 for more details on search strategy). Search results from each database were downloaded into EndNote X7 for Windows and merged into one file. We removed duplicates during the merging process and imported the EndNote file into the Covidence web-based review management tool for Windows (https://www.covidence.org/about-us). We inspected the reference lists of retrieved articles and cross-referenced our findings against published reviews.Reference Tyrer, Mulder, Crawford, Newton-Howes, Simonsen and Ndetei2–Reference Quirk, Berk, Chanen, Koivumaa-Honkanen, Brennan-Olsen and Pasco4,Reference Paris23,Reference Sansone and Sansone24 Following removal of duplicates, C.W. and A.B. independently screened titles and abstracts of all potentially eligible articles for full-text retrieval. C.W. and A.B. then independently screened full-text articles for inclusion in the review. Screening at both stages was conducted within the Covidence review management tool, which allowed each researcher to vote ‘yes’ or ‘no’ for each article and record the reason for their decision.
Data extraction and critical appraisal
C.W. extracted data using a predetermined form. Details included first author and year, country, income status of country (LMIC versus high-income country), sample (number, age and gender), sample frame (including origin, recruitment and estimation), diagnostic assessment method, evaluation instrument, diagnostic criteria and personality disorder prevalence figure (and standard error).
C.W. critically appraised full-text articles, using an adapted version of the Joanna Briggs Institute Critical Appraisal Tool for prevalence reviews.Reference Munn, Moola, Riitano and Lisy25 Each study was rated (0, study did not satisfy category or it could not be determined; 1, study satisfied the category). We examined eight categories: (a) representativeness of target population, (b) recruitment of participants, (c) sample size, (d) description of study participants and setting, (e) coverage of identified sample, (f) objectivity of assessment, (g) reliability of the assessment and (h) appropriate statistical analysis. We calculated a critical appraisal score for each study ranging from 0 to 8, which was included as a moderator in the meta-regression analysis.
Summary measure
Prevalence figure was the principal summary measure. ‘Any personality disorder’ referred to the presence of one or more categorical personality disorder as defined and assessed in each of the included studies. Cluster A, B and C personality disorders correspond to the three-cluster model of personality disorders delineated in the DSM-5 (2013). Cluster A (also known as odd-eccentric) personality disorder included any categorical paranoid, schizotypal or schizoid personality disorder. Cluster B (also known as dramatic-erratic) personality disorder included any categorical histrionic, borderline, narcissistic or antisocial personality disorder. Cluster C (also known as anxious-fearful) personality disorder included any categorical avoidant, dependent or obsessive–compulsive personality disorder.26 We also pooled the prevalence rates of individual personality disorders (e.g. borderline personality disorder) where the data were available (see Supplementary Material).
Synthesis of results
We combined prevalence figures from individual studies quantitatively, using meta-analysis. In meta-analysis, the pooled prevalence estimate is calculated by assigning a ‘weight’ to each study, which reflects the accuracy of each individual study estimate and is typically a function of sample size.Reference Field and Gillett27 We used the metaprop command in STATA version 14 for Windows for Windows. The metaprop command is an extension of the metan procedure designed for meta-analysis of proportions. As we anticipated heterogeneity across studies, we chose the random effects model with inverse variance weights.Reference Winsper, Ganapathy, Marwaha, Large, Birchwood and Singh28 We used the cimethod (exact) command and the Freeman–Tukey double arcsine transformation (ftt) for meta-analyses when studies had zero prevalence rates (i.e. studies of individual personality disorders).Reference Nyaga, Arbyn and Aerts29 We report heterogeneity with the I 2 statistic (descriptive statistic representing proportion of total variability in prevalence estimates that can be attributed to heterogeneity), the Q statistic with P-value (measure of weighted squared deviations around the summary estimate) and tau2 (inter-study variance reported in the scale of the prevalence estimate).Reference Higgins30 We conducted the meta-analysis in the following stages: (a) we pooled prevalence figures for any personality disorder; (b) we pooled prevalence figures for clusters A, B and C personality disorders, respectively; and (c) we pooled prevalence figures for individual personality disorders.
Additional analyses
Sensitivity analysis and publication bias
We conducted sensitivity analysis to evaluate the influence of each study on pooled personality disorder prevalence using the metaninf command.Reference Taylor and Kim-Cohen31 We also examined the impact of self-report questionnaires on prevalence figures, as they have been associated with the over-diagnosis of personality disorders.Reference Dereboy, Güzel, Dereboy, Okyay and Eskin32,Reference Yang, Coid and Tyrer33 We compared pooled rates of self-report questionnaire versus interview studies. In line with recent prevalence studies, we assessed publication bias by visually inspecting the funnel plot for asymmetry.Reference Ang, Chen and Lee34,Reference Spick, Bickel, Polanec and Baltzer35
Subgroup analysis and meta-regression analysis
We used subanalysis and meta-regressions to examine the effects of study characteristics on personality disorder prevalence estimates. We selected study factors a priori based on previous reviews of mental health prevalenceReference Polanczyk, Salum, Sugaya, Caye and Rohde14,Reference Steel, Marnane, Iranpour, Chey, Jackson and Patel36 and the assessment of personality disorder prevalence specifically.Reference Tyrer, Reed and Crawford37–Reference Beckwith, Moran and Reilly39 We conducted univariate meta-regressions for each factor. Covariates associated with heterogeneity at the P < 0.05 level were included in the multivariate analysis.
We considered the following factors for any personality disorder prevalence.
(a) Population characteristics:
(i) Income level of study country (1, high income; 2, LMICs – including upper-middle, lower-middle and low-income countries). We used the World Bank definitions of country income status, which are based on gross national income per capita calculated using the Atlas method (www.worldbank.org).
(ii) Study date (1, before median of 2009; 2, median date or later).Reference Thompson and Higgins40
(b) Sample characteristics:
(i) Sample size (1, below median, n < 1, 610; 2, median or greater, n ≥ 1, 610).Reference Baxter, Scott, Vos and Whiteford41
(c) Study characteristics:
(i) Representativeness and sampling strategy (1, country or large city/area weighted to represent population; 2, medium or small city/area with complex sampling to improve representativeness; 3, probably non-representative sample including a small area/sample with no complex sampling approach).Reference Polanczyk, Salum, Sugaya, Caye and Rohde14
(ii) Study design (1, one-stage assessment; 2, two-stage assessment). One-stage assessment included studies that administered one personality disorder assessment to the whole sample. Two-stage assessment included studies that administered a screening instrument to the entire sample, and then a diagnostic interview to a proportion of individuals screening positive and/or negative.Reference Polanczyk, Salum, Sugaya, Caye and Rohde14
(iii) Critical appraisal score (on a scale from 0 to 8) based on the Joanna Briggs Institute Critical Appraisal Tool for prevalence reviews.
(d) Assessment methods:
(i) Diagnostic criteria according to the two most-used systems in psychiatry, the ICD and the DSM (1, ICD-8 [1967]/-9 [1978]/-10; 2, DSM-III-R [1980]; 3, DSM-IV).Reference Polanczyk, Salum, Sugaya, Caye and Rohde14
(ii) Interview administration (1, interview by experienced clinician or psychiatrist; 2, interview by trained graduates or research assistants; 3, interview by trained lay person).Reference Baxter, Scott, Vos and Whiteford41
(iii) Diagnostic interview (1, clinical interview; 2, Structured Clinical Interview for DSM-IV [SCID-II]; 3, International Personality Disorder Examination [IPDE]; 4, Structured Interview for DSM-IV Personality/Revised [SIDP-IV]; 5, other, e.g. assessment tool used in just one study, e.g. Standard Assessment of Personality).Reference Polanczyk, Salum, Sugaya, Caye and Rohde14
(iv) To avoid duplication, we did not repeat all the above subgroup analysis for clusters A, B and C personality disorders. We did, however, examine whether each of the clusters varied in prevalence according to country income level.Reference Huang, Kotov, De Girolamo, Preti, Angermeyer and Benjet42
Results
Study selection
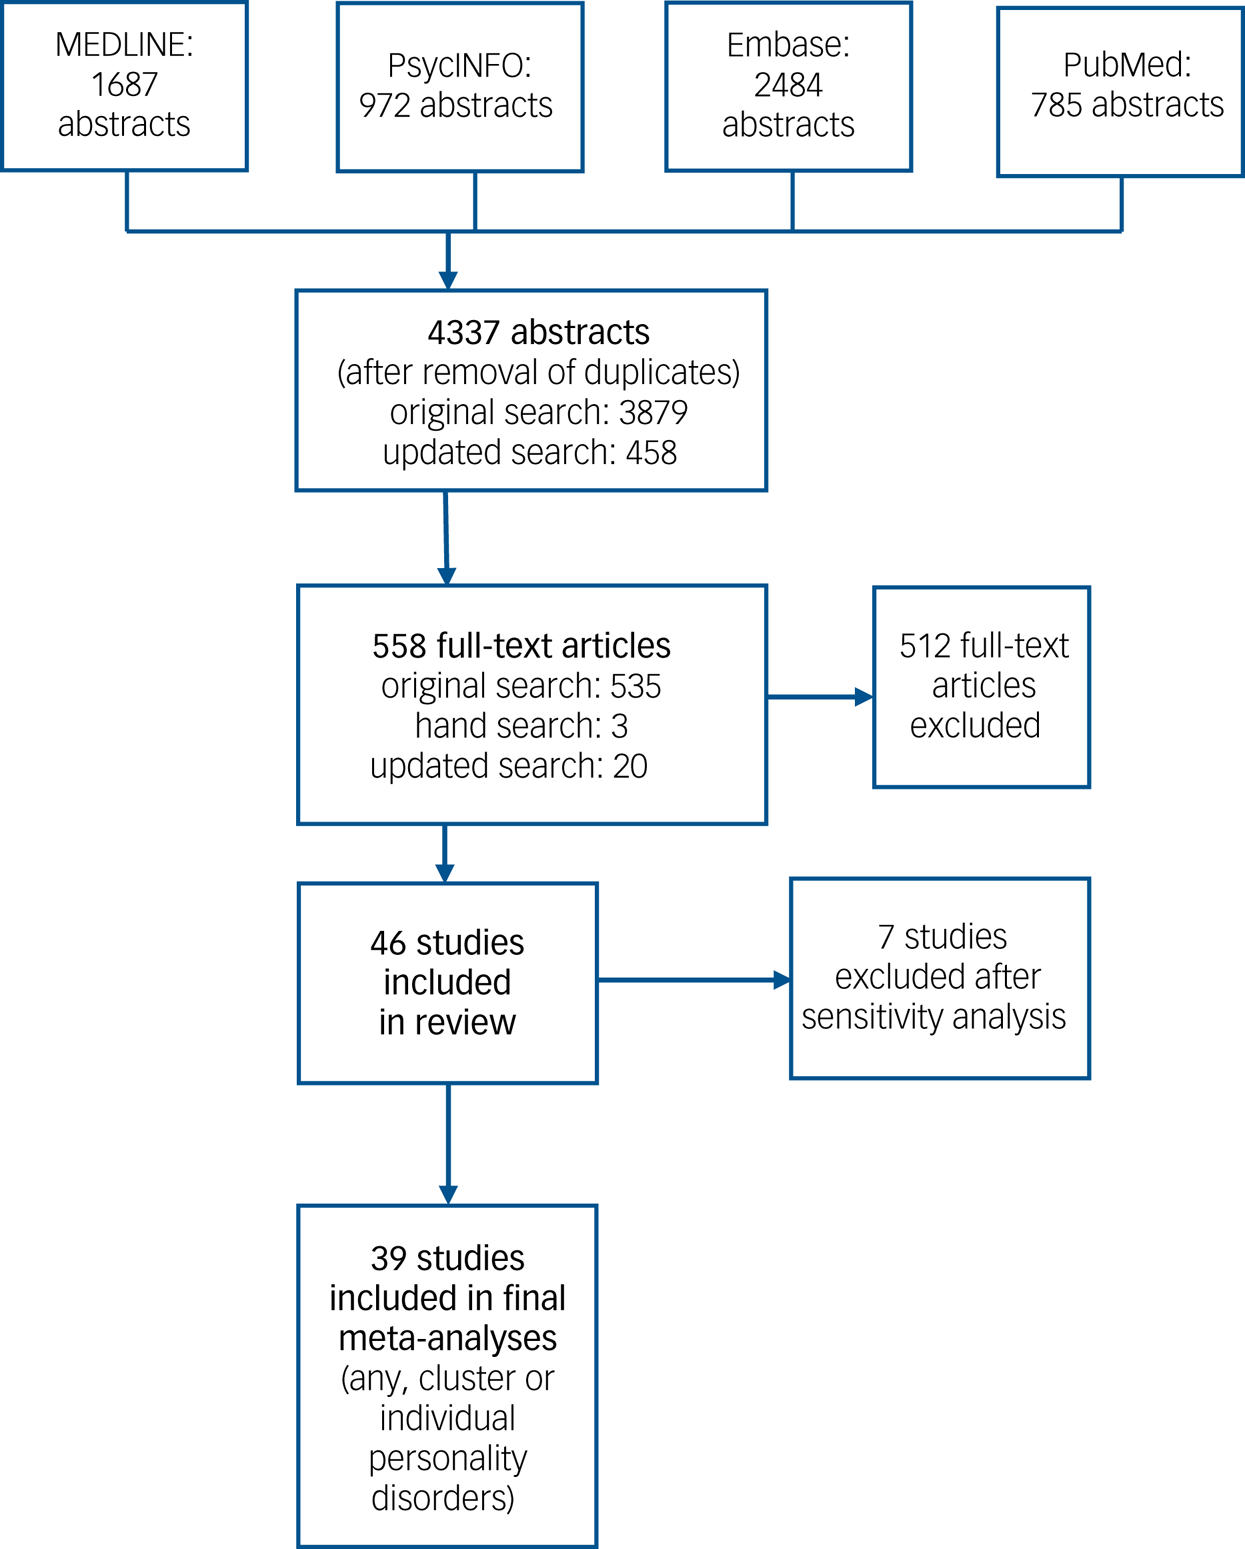
Of the original 3876 abstracts, 535 articles were selected for full-text review. There was an acceptable level of agreement between raters (kappa 0.80). The updated search yielded a further 458 abstracts, from which 20 full-text articles were retrieved for inspection. Three articles were identified by hand search. In total there were 558 full-text articles. Of these, 46 fulfilled our inclusion criteria (reporting on any; a cluster A, B or C; or an individual personality disorder). Interrater reliability was acceptable (kappa 0.82). The authors discussed discrepancies at the abstract and full-text stage. Most discrepancies related to uncertainty relating to duplicate data or whether the study sample was selective (Fig. 1).
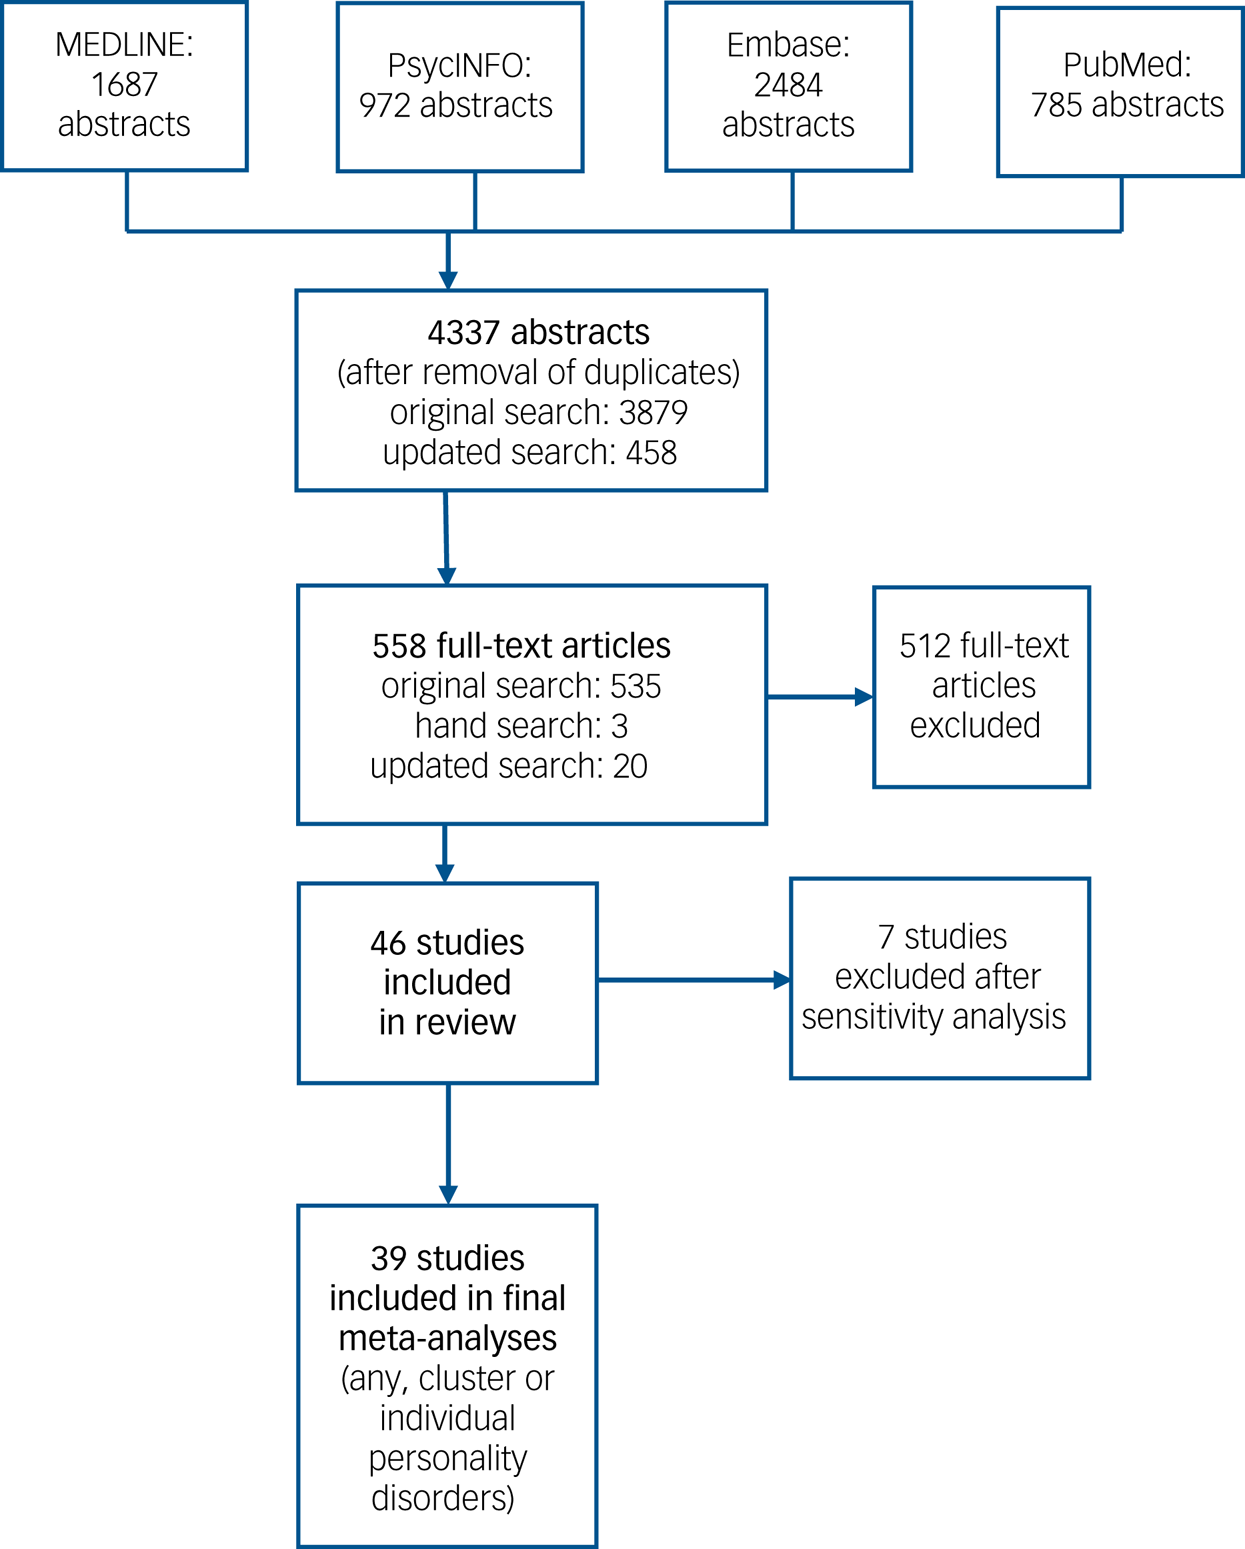
Fig. 1 Flow diagram for the search results.
See Supplementary Table DS2 for a full list of excluded studies and reasons for exclusion. The main reasons for exclusion included: duplicate samples (e.g. National Epidemiologic Survey of Alcohol and Related Conditions), the use of selected samples (e.g. small undergraduate populations, case–control studies) and very small sample size (<100 participants). Reasons for exclusion sometimes overlapped, e.g. studies with a small number of participants tended to use biased samples.
Study characteristics
A total of 46 studies from 21 different countries satisfied our inclusion criteria. A total of 34 studies reported a prevalence figure for ‘any personality disorder’ and/or cluster A, B or C personality disorder (some of these studies also reported a prevalence figure for an individual personality disorder). Twelve studies only reported a prevalence figure for an individual personality disorder, e.g. obsessive–compulsive personality disorder.Reference Albert, Maina, Forner and Bogetto43 See Supplementary Table DS3 for an overview of included studies, including sample description, sampling frame, diagnostic approach and raw prevalence figures. One study from the WHO World Mental Health SurveysReference Huang, Kotov, De Girolamo, Preti, Angermeyer and Benjet42 provided independent prevalence estimates for eight different countries. Most studies were published in English language, excepting two German,Reference Barnow, Stopsack, Ulrich, Falz, Dudeck and Spitzer44,Reference van Niekerk, Höfler, Pfister, Schütz and Wittchen45 one IcelandicReference Lindal and Stefansson46 and four ChineseReference Huang, Liu, Liu, Zhang and Zhang47–Reference Liu and Ning50 articles. A.W. translated and extracted data from the Chinese publications. We could not identify native speakers for the German and Icelandic articles. Thus, in line with previous studies,Reference de Noordhout, Devleesschauwer, Angulo, Verbeke, Haagsma and Kirk51,Reference Frühauf, Gerger, Schmidt, Munder and Barth52 we used Google Translate for these articles.
Critical appraisal of included studies
Please refer to Supplementary Table DS4 for an overview of the risk-of-bias analysis. Lower scores indicate a higher chance of bias in prevalence estimates (e.g. due to lack of sample representativeness or measurement reliability).Reference Munn, Moola, Riitano and Lisy25 Studies ranged in scores between 2 and 7.5, with a mean score of 5.1. Generally, self-report questionnaire studiesReference Lindal and Stefansson46,Reference Reich, Yates and Nduaguba53 and those with less-robust recruitment strategies (e.g. non-randomisation)Reference Maier, Lichtermann, Klingler, Heun and Hallmayer54 yielded the lowest scores.
Sensitivity analysis
We included 30 studies (37 individual prevalence estimates) in the initial meta-analysis of the pooled prevalence of any personality disorder. Inspection of the forest plot highlighted one Jamaican studyReference Hickling and Walcott55 as an outlier, with a personality disorder prevalence of 41.4%. Assessment in this study was conducted with the Jamaica Personality Disorder Inventory (JPDI), which identifies a cut point of ten or more as indicative of the presence of a personality disorder.Reference Hickling, Martin, Walcott, Paisley, Hutchinson and Clarke56 In a previous study of 200 Jamaican patients, the JPDI demonstrated a reasonable level of internal consistency, sensitivity, specificity and concurrent validity.Reference Hickling, Martin, Walcott, Paisley, Hutchinson and Clarke56 However, the authors described the JPDI diagnosis as existing on a continuum from mild to severe, which might explain the very high rates reported. Sensitivity analysis (Supplementary Table DS5) confirmed that removal of this study had a relatively substantive effect on overall pooled prevalence, thus we excluded it from further analysis.
Six of the included studies used validated self-report questionnaires.Reference Dereboy, Güzel, Dereboy, Okyay and Eskin32,Reference Lindal and Stefansson46–Reference Qi, Xu, Liu, Yuan and Feng48,Reference Reich, Yates and Nduaguba53,Reference Ekselius, Tillfors, Furmark and Fredrikson57 Self-report questionnaire studies (11.2%, 95% CI 3.7–18.7%) yielded noticeably higher pooled personality disorder prevalence rates than the interview studies (7.7%, 95% CI 6.0–9.4%). We thus excluded these studies from the final analysis. A total of 23 studies (providing 30 independent prevalence estimates) were included in the final meta-analysis of any personality disorder. A total of 12 studies (19 estimates) reported on cluster A, B and C personality disorders.
Pooled prevalence of any personality disorder
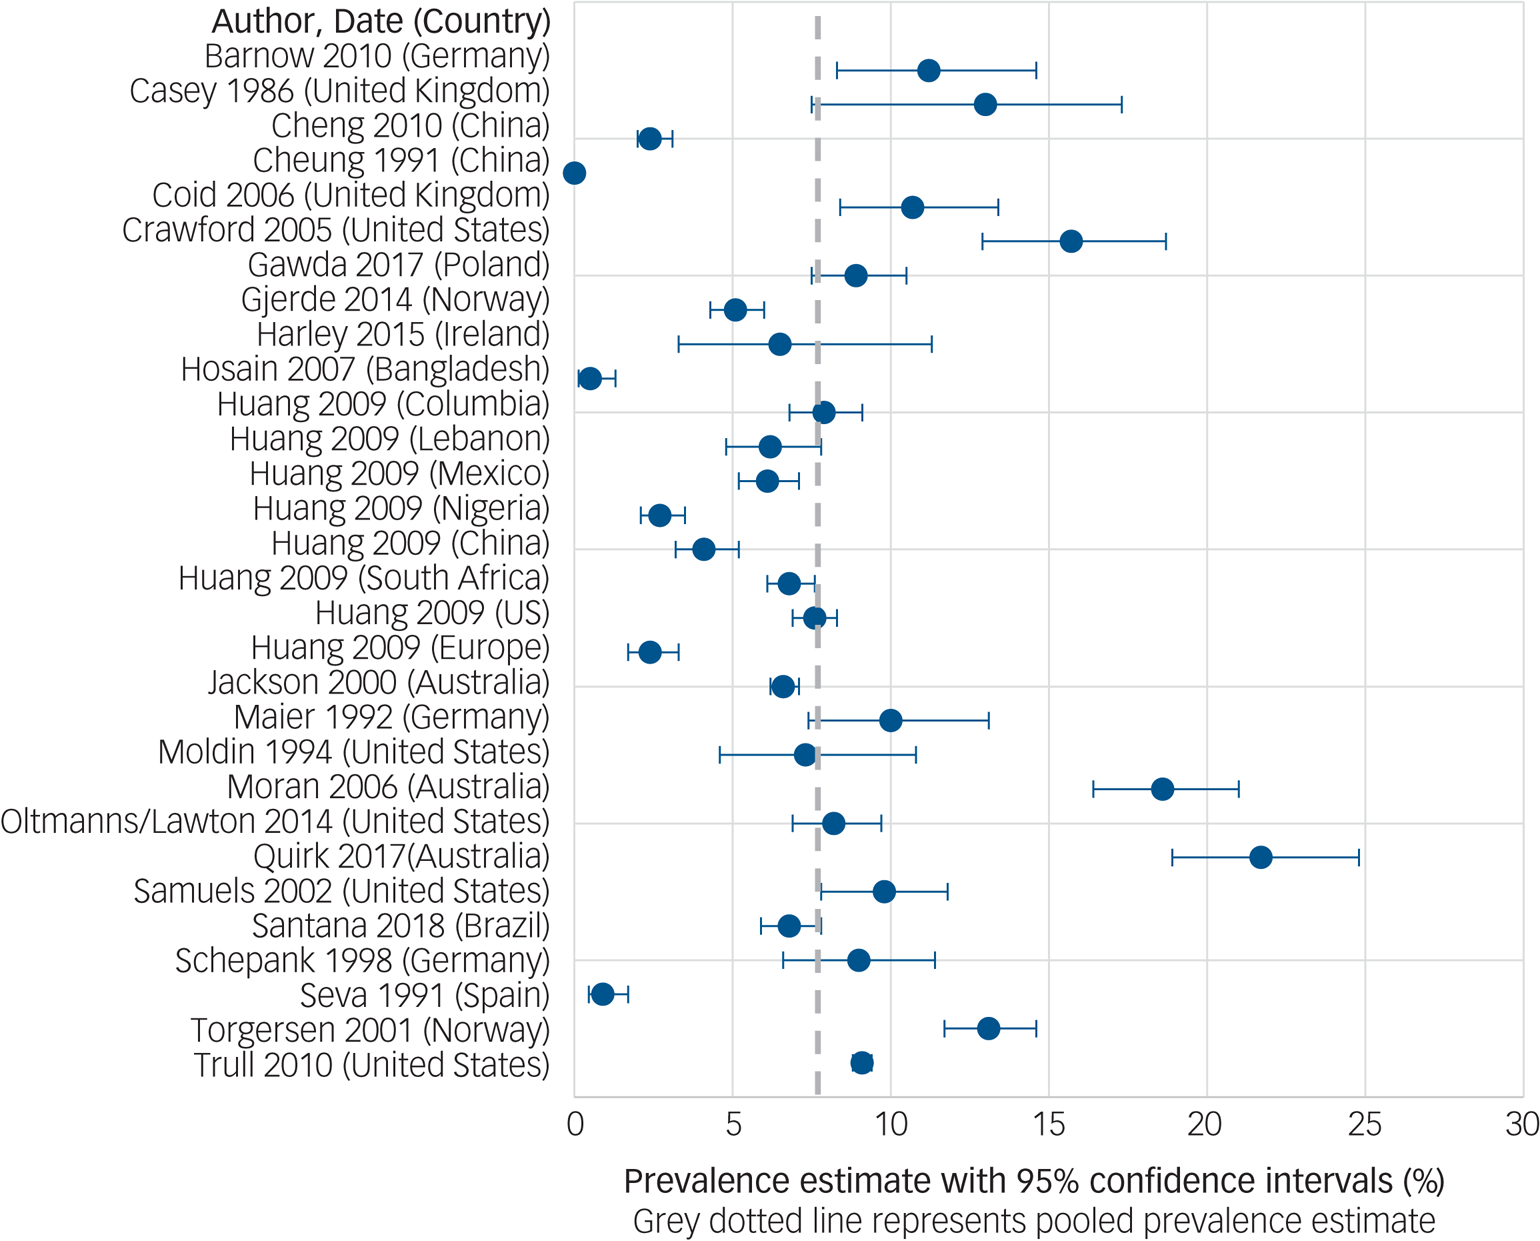
The global pooled prevalence of any personality disorder was 7.8% (95% CI 6.1–9.5). There was substantial inter-survey heterogeneity among estimates (I 2 = 99.7%, Q = 8511.9, d.f. = 29, P < 0.001, tau2 = 0.002). See Fig. 2 for the forest plot of prevalence estimates from individual studies.
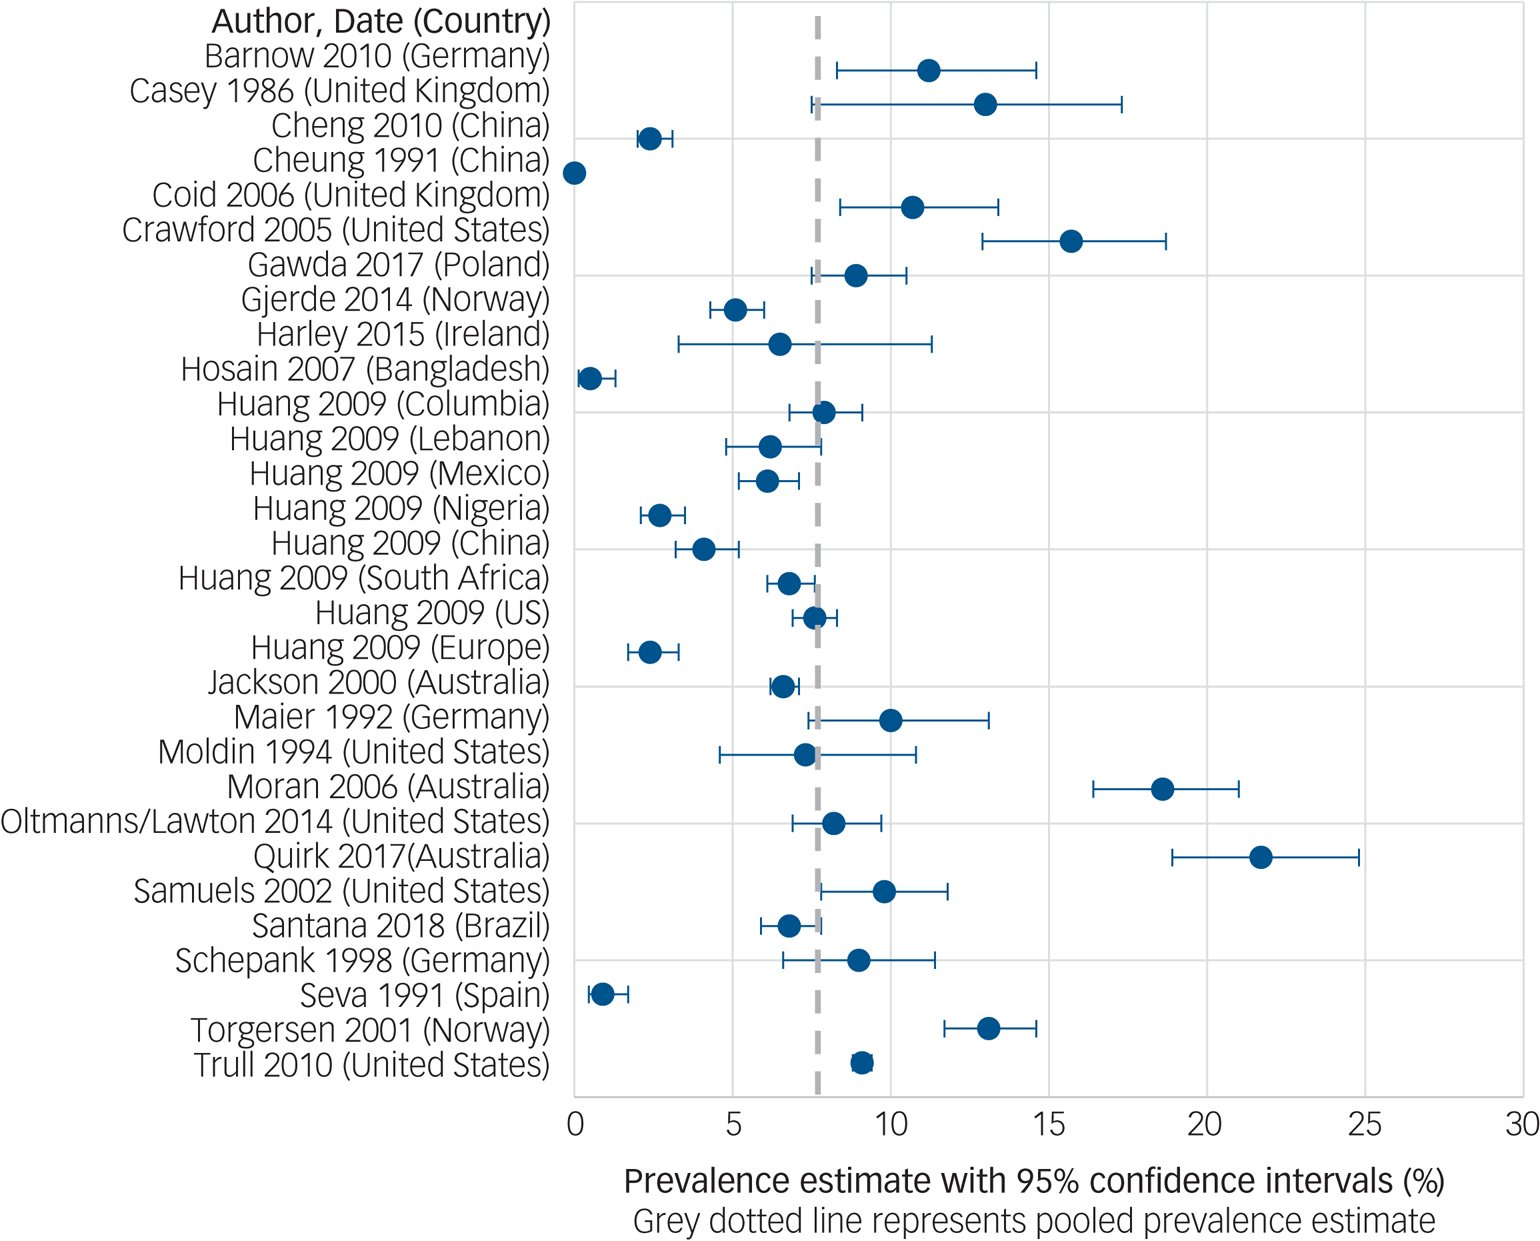
Fig. 2 The pooled prevalence of ‘any’ personality disorder in community populations.
Publication bias
The funnel plot (Supplementary Fig. DS1) indicated a possibility of a publication bias towards higher personality disorder rates as reflected by the higher number of study points on the right-hand side of the plot.
Subgroup analysis and univariate meta-regressions according to study characteristics
See Table 1 for results of the subanalyses and univariate (unadjusted) meta-regressions. Pooled prevalence rates of any personality disorder were significantly greater in high-income countries compared with LMICs (Fig. 3), with income status of country accounting for 18.7% of between-study variance. Studies using two-stage assessments (e.g. screening tool then interview) yielded significantly lower pooled prevalence rates than one-stage assessments, accounting for 34.8% of between-study variance. Studies with interviews conducted by trained graduates or psychologists yielded significantly higher prevalence rates than those conducted by experienced clinicians (accounting for 19.5% of between-study variance).
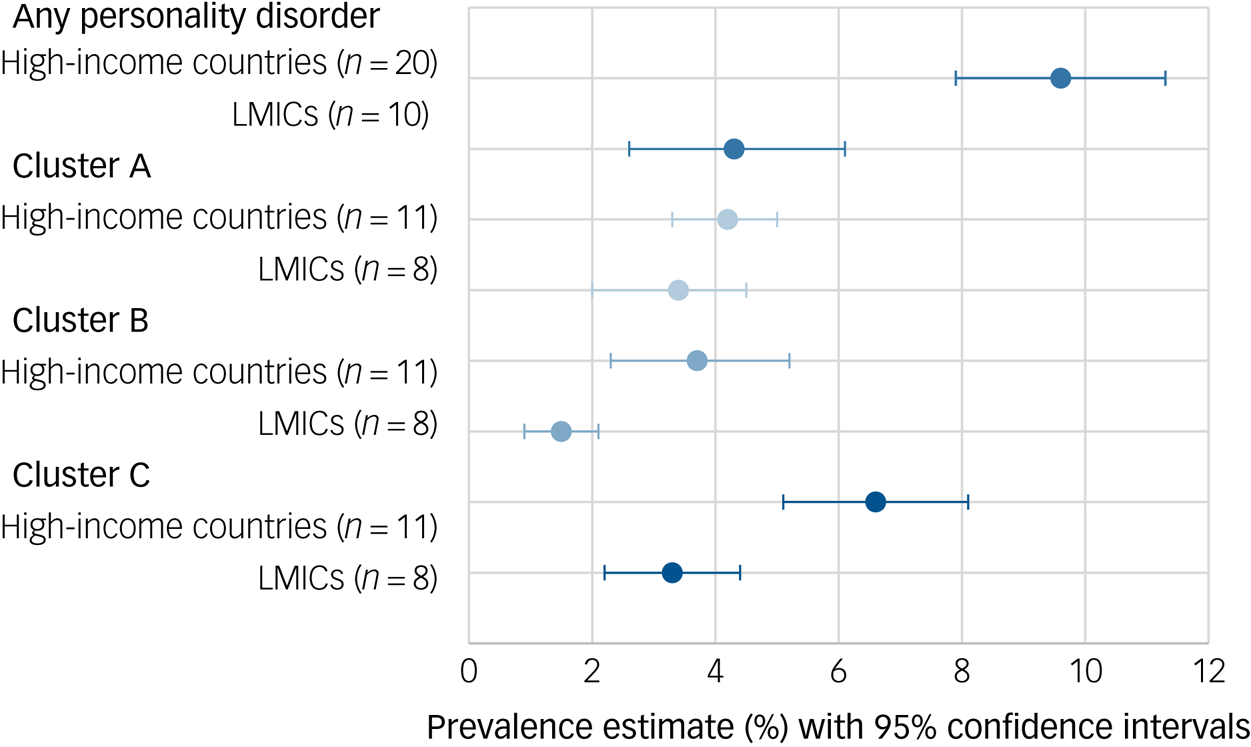
Fig. 3 Personality disorder pooled prevalence according to country income status.
Table 1 Subgroup analysis and univariate meta-regression results for the diagnosis of any personality disorder
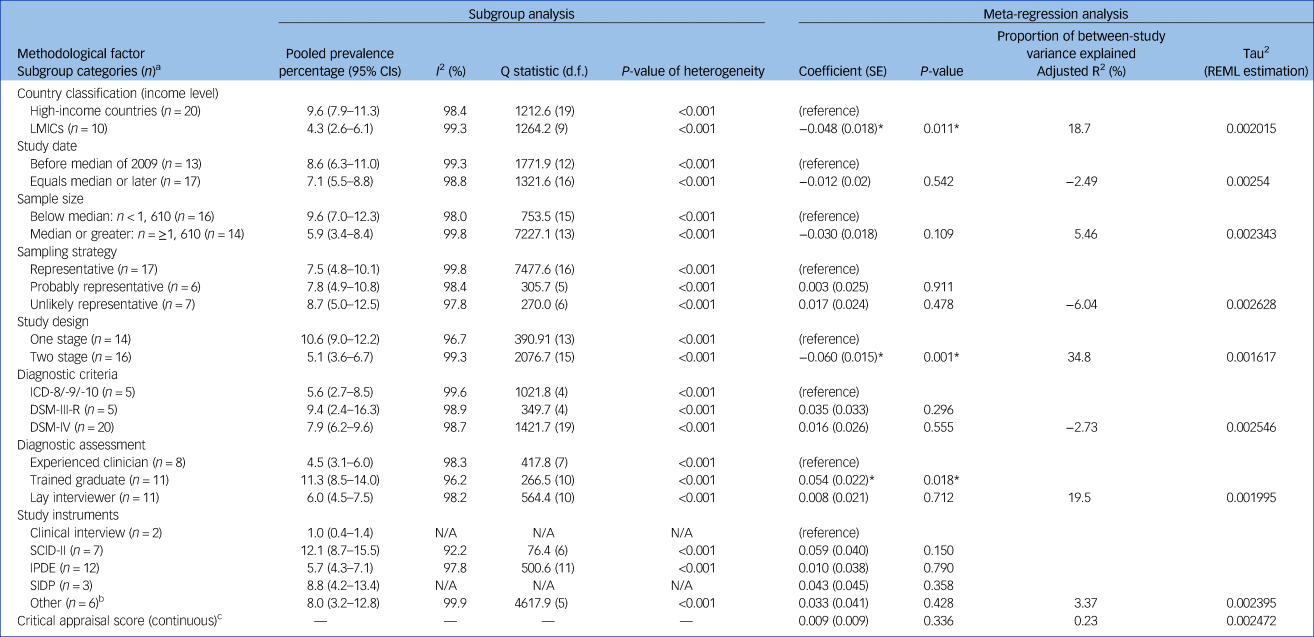
REML, restricted maximum likelihood method; LMICs, low- and middle-income countries; N/A, not applicable; SCID-II, Structured Clinical Interview for DSM-IV; IPDE, International Personality Disorder Examination; SIDP, Structured Interview for DSM-IV Personality.
a. Number of studies in each respective group in the subanalysis.
b. Includes assessments used in just one study, e.g. Standardised Assessment of Personality.
c. Continuous score thus subanalysis was not possible.
* indicates significant association at the P < 0.05 level.
Multiple meta-regression
In the multiple meta-regression analysis (adjusting for all significant moderators from the univariate meta-regression), study design (β = −0.053, P = 0.013) remained a significant predictor of heterogeneity. The distinction between high-income countries and LMICs (β = 0.0002, P = 0.994) and type of interviewer, experienced clinicians versus trained graduates (β = 0.041, P = 0.053), did not remain significant predictors of heterogeneity. The final model accounted for just under 40% of the heterogeneity in prevalence rates across studies (adjusted R2 = 39.6%).
Prevalence of cluster A, B and C personality disorders
See Fig. 3 for an overview of cluster A, B and C personality disorder prevalence rates by country income classification. A total of 12 studies (19 estimates) examined cluster A prevalence (pooled prevalence 3.8%, 95% CI 3.2–4.4%, I 2 = 94.3%, Q = 317.6, d.f. = 18, P < 0.001, tau2 = 0.0002). A total of 2 studies (8 estimates) reported prevalence rates in LMICs (pooled prevalence 3.4%, 95% CI 2.3–4.5%, I 2 = 94.8%, Q = 134.8, d.f. = 7, P < 0.001) and 11 (12 estimates) in high-income countries (pooled prevalence 4.2%, 95% CI 3.3–5.0%, I 2 = 94.2%, Q = 173.4, d.f. = 10, P < 0.001). Country income status was not significantly associated with cluster A prevalence estimates in the meta-regression analysis (β = 0.002, P = 0.84).
A total of 12 studies (19 estimates) reported cluster B prevalence (pooled prevalence 2.8%, 95% CI 1.8–3.7%; I 2 = 98.8%, Q = 1498.6, d.f. = 18, P < 0.001, tau2 = 0.0004). Three studies (eight estimates) reported prevalence rates in LMICs (pooled prevalence 1.5%, 95% CI 0.9–2.1%, I 2 = 93.2%, Q = 103.3, d.f. = 7, P < 0.001) and ten (11 estimates) in high-income countries (pooled prevalence 3.7%, 95% CI 2.3–5.2%, I 2 = 98.9%, Q = 912.1, d.f. = 10, P < 0.001). Country income status was significantly associated with cluster B prevalence estimates in the meta-regression analysis (β = −0.019, P = 0.048).
A total of 12 studies (19 estimates) reported cluster C prevalence (pooled prevalence 5.0%, 95% CI 4.2–5.9%, I 2 = 98.1%, Q = 737.6, d.f. = 18, tau2 = 0.0003). A total of 3 studies (8 estimates) reported prevalence rates in LMICs (pooled prevalence 3.3%, 95% CI 2.2–4.4%, I 2 = 95.7%, Q = 163.2, d.f. = 7, P < 0.001) and 11 (12 estimates) in high-income countries (pooled prevalence 6.6%, 95% CI 5.1–8.1%, I 2 = 98.2%, Q = 558.1, d.f. = 10, P < 0.001). Country income status was not significantly associated with cluster C prevalence estimates in the meta-regression analysis (β = −0.028, P = 0.165).
Pooled rates of individual personality disorders are reported in Supplementary Table DS6. The most common personality disorders were obsessive–compulsive (3.2%), avoidant (2.7%) and paranoid (2.3%) personality disorders. Schizotypal (0.8%), histrionic (0.6%) and dependent (0.8%) personality disorders were rare. We did not examine pooled prevalence rates according to country income as most studies were from high-income countries.
Discussion
We identified 46 studies from 21 different countries spanning 6 continents (Africa, North America, South America, Asia, Australia/Oceania and Europe). A total of 23 studies (30 estimates) were included in the final meta-analysis for any personality disorder, and 12 for the meta-analyses of cluster A and B personality disorders, and 13 for cluster C personality disorders. The global pooled prevalence of any personality disorder was 7.8% (95% CI 6.1–9.5%). This figure exceeds the WHO World Mental Health personality disorder prevalence estimate of 6.1%,Reference Huang, Kotov, De Girolamo, Preti, Angermeyer and Benjet42 and global period prevalence rates of mood (5.4%) and anxiety (6.7%) disorders.Reference Steel, Marnane, Iranpour, Chey, Jackson and Patel36 We found significant heterogeneity across studies, which was partly explained by study design (i.e. two-stage assessment led to significantly lower pooled prevalence). The pooled prevalence of any personality disorder was significantly lower in LMICs (4.3%) than in high-income countries (9.4%) in univariate meta-regression, although this difference became non-significant in the final meta-regression. Cluster B (1.5 v. 3.7%, P = 0.048) and C personality disorders (3.3 v. 6.6%, not significant) were also less common in LMICs.
There are several plausible explanations for these findings. First, there might exist a lower population risk in LMICs due to key cultural or social factors.Reference Tyrer, Mulder, Crawford, Newton-Howes, Simonsen and Ndetei2,Reference Steel, Marnane, Iranpour, Chey, Jackson and Patel36,Reference Gawda and Czubak58,Reference Cheng, Huang, Liu and Liu59 Previous global reviews indicate lower rates of depression and anxiety in LMICs,Reference Steel, Marnane, Iranpour, Chey, Jackson and Patel36,Reference Ferrari, Somerville, Baxter, Norman, Patten and Vos60 and it is plausible that variations in behavioural norms across countries (e.g. individualistic versus collectivist societies) could have some bearing on personality disorder prevalence. For example, studies in urban and rural areas of Taiwan indicate very low prevalence rates of antisocial personality disorder.Reference Paris61 It is hypothesised that these lower rates might be attributable to stronger social control mechanisms preventing the progression of antisocial behaviours.Reference Cohen, Slomkowski and Robins62 Similarly, some diagnostic traits and categories might not be equally valid or meaningful in all countries. Avoidant, dependent and borderline personality disorder, for example, are not specified in the Chinese Classification of Mental Disorders.Reference Gawda and Czubak58 We still know relatively little about the impact of culture, race and ethnicity on mental disorders in general, and personality disorders specifically.Reference Gawda and Czubak58,Reference McGilloway, Hall, Lee and Bhui63 It might be that certain illnesses, such as eating disorders (and possibly some forms of personality disorder), become more widespread with the increasing ‘Westernisation’ of the world.Reference Pike and Dunne64 Paris and Lis have hypothesised that borderline personality disorder is ‘socially sensitive’ and that secular trends, such as the breakdown of social cohesion and social capital which are increasingly evident with rising income and inequality, have given rise to increased prevalence of borderline personality disorder.Reference Paris and Lis65
Second, it is recognised that mental disorders can present with different symptoms in different cultures,Reference Gone, Kirmayer, Millon, Krueger and Simonsen66 and current diagnostic tools and criteria might underestimate the prevalence of personality disorders in LMICs.Reference Steel, Silove, Giao, Phan, Chey and Whelan67 Two Asian studies, conducted by Western psychiatrists, reported strikingly low personality disorder prevalence rates in ChinaReference Cheung68 and Bangladesh.Reference Hosain, Chatterjee, Ara and Islam69 In contrast, the WHO Mental Health Survey reported a prevalence of 4.1% in China when using the cross-cultural IPDE tool.Reference Huang, Kotov, De Girolamo, Preti, Angermeyer and Benjet42,70 Although the use of uniform (cross-cultural) assessment tools might improve inter-country comparisons, researchers should also consider cultural nuances in symptom clusters, which could moderate aetiology and illness presentation.Reference Keng and Soh71
Third, differences in pooled prevalence might be partly attributable to methodological confounders. Study design was a strong predictor of heterogeneity in both univariate and multiple meta-regression analysis, whereas country income and interview administration became non-significant predictors of heterogeneity in the final multivariate model. Thus, study design might have confounded the effect of study country on prevalence estimate (i.e. all one-step studies were from high-income countries, potentially inflating the gap between high-income countries and LMICs). To further explore the effects of this potential methodological confounder on prevalence rates in high-income countries versus LMICs, we conducted post hoc subgroup analysis including two-stage studies only. We found that prevalence rates in high-income studies (6.6%, 95% CI 3.4–9.8.%) still exceeded prevalence rates in LMIC studies (4.3%, 95% CI 2.6–6.1%). The magnitude of the difference was reduced and no longer significant in the meta-regression analysis, although this could be attributable to reduced power as a result of restricting the number of studies (n = 16). Further large-scale, multi-country studies with standardised methodologies are needed to shed further light on whether true differences exist,Reference Huang, Kotov, De Girolamo, Preti, Angermeyer and Benjet42 although current diagnostic tools may not adequately capture subtle cultural nuances.Reference Balaratnasingam and Janca72
Cluster A personality disorders were relatively common in high-income countries (4.2%) and LMICs (3.4%). The relatively high global prevalence of cluster A personality disorders contrasts with low presentation of these disorders in clinical settings.Reference Soeteman, Roijen, Verheul and Busschbach73 These three personality disorders (paranoid, schizoid and schizotypal) often receive the least research attentionReference Bateman, Gunderson and Mulder74 despite being associated with chronic physical comorbidities, including cardiovascular disease, arthritis and high levels of functional impairment.Reference Quirk, Berk, Chanen, Koivumaa-Honkanen, Brennan-Olsen and Pasco4
We noted that studies from Australia tended to report high personality disorder prevalence rates, although estimates varied across studies. Using the SCID, Quirk et al Reference Quirk, Berk, Pasco, Brennan-Olsen, Chanen and Koivumaa-Honkanen75 found a prevalence of 21.7% in an age-stratified female cohort. Moran et al Reference Moran, Coffey, Mann, Carlin and Patton76 found an informant-reported (using the Standardised Assessment of Personality) prevalence of 18.6% in a nationally representative cohort of young people. In a nationwide household study, Jackson and BurgessReference Jackson and Burgess77 reported a more conservative prevalence of 6.6% when using the IPDE. As personality disorders are increasingly recognised as a mental health priority in Australia, more population level data are expected.Reference Grenyer, Ng, Townsend and Rao78,Reference Chanen, Sharp, Hoffman, Prevention and Disorder79
Methodological considerations and limitations
There are several limitations that should be noted when considering our review findings. First, we identified substantial inter-study heterogeneity across all models with high and significant I 2 values. We found that heterogeneity, although slightly reduced, remained high across all subgroup analyses. Pooled prevalence estimates were similarly heterogeneous in previous global prevalence reviews on attention-deficit hyperactivity disorderReference Polanczyk, De Lima, Horta, Biederman and Rohde20 and common mental disorders.Reference Polanczyk, Salum, Sugaya, Caye and Rohde14,Reference Steel, Marnane, Iranpour, Chey, Jackson and Patel36 It has previously been noted that heterogeneity statistics are sensitive to factors present in psychiatric epidemiology reviews.Reference Steel, Marnane, Iranpour, Chey, Jackson and Patel36 Our meta-analyses included epidemiological studies of considerable magnitude (i.e. thousands of participants), likely leading to low within-study variance, which can inflate heterogeneity statistics.Reference Higgins80,Reference Coory81 Nevertheless, it should be acknowledged that heterogeneity can affect the stability and interpretability of pooled prevalence estimates.Reference Steel, Marnane, Iranpour, Chey, Jackson and Patel36 Second, only one of our a priori selected covariates had a significant impact on the variability of estimates in the multiple meta-regression. Other factors, such as diagnostic assessment, had a noticeable effect on pooled prevalence rates in the subgroup analysis, but were not significant predictors in the meta-regression. Despite our comprehensive search, we only identified a modest number of epidemiological studies. We limited our systematic search to published studies, which could have led to the omission of potential studies (thus reducing number of studies). This could have limited our power to detect significant moderators, and fully disentangle the confounding effects of inter-related moderators.Reference Lipsey82 Relatedly, the exclusion of unpublished studies could have potentially led to less precise pooled estimates.Reference Conn, Valentine, Cooper and Rantz83 We found a possible publication bias towards higher personality disorder prevalence rates, which could have led to a slight overestimation of pooled rate. It should be noted, however, that the interpretation of publication bias in prevalence reviews is not straightforward (i.e. in studies measuring prevalence there are no negative findings) and that specific methods for prevalence reviews are not well established.Reference Bui, Rahman, Heywood and MacIntyre84,Reference Shaikh, Morone, Bost and Farrell85 Third, there were some potential moderating factors we could not include in our analysis due to insufficient data, or a difficulty in constructing meaningful categories. Factors such as age, gender, urbanicity and socioeconomic status could have an impact on personality disorder prevalence rates.Reference Huang, Kotov, De Girolamo, Preti, Angermeyer and Benjet42,Reference Torgersen, Kringlen and Cramer86 Fourth, because of the limited number of studies, we had to construct relatively crude categories for some moderators. For example, ‘LMICs’ covered a wide variety of countries (both low-middle and high-middle countries) and included megacitiesReference Santana, Coelho, Wang, Chiavegatto Filho, Viana and Andrade87 and rural areas,Reference Hosain, Chatterjee, Ara and Islam69 all of which might vary in prevalence rates. Fifth, the inclusion of longitudinal cohorts could have led to an underestimation of personality disorder prevalence because disadvantaged or mentally ill participants are more likely to drop out of studies. However, the few included longitudinal studies reported high follow-up rates of approximately 80%.Reference Harley, Connor, Clarke, Kelleher, Coughlan and Lynch88,Reference Crawford, Cohen, Johnson, Kasen, First and Gordon89 Sixth, three of the included studies were translated using Google Translate. Google Translate is increasingly used in systematic review studies and had been highlighted as a useful tool for reviewers to translate European articles. However, it is possible that this approach could have introduced inaccuracies.Reference Balk, Chung, Chen, Trikalinos and Kong90
Finally, we only pooled categorical personality disorder prevalence figures. The assumption that personality disorders are categorical is highly contested.Reference Tyrer, Reed and Crawford37 Although the DSM-5 has retained the ten discrete personality disorders,26 personality and personality pathology is dimensional.Reference Quirk, Berk, Chanen, Koivumaa-Honkanen, Brennan-Olsen and Pasco4 Under direction from the WHO, the ICD-11 Working Group is developing a dimensional system for the diagnosis of personality disorders, which should be usable and useful for healthcare workers in lower-resource settings, and will consider the cross-cultural applicability of categories, definitions and diagnostic descriptions.Reference Reed, Correia, Esparza, Saxena and Maj91,Reference Reed92 These developments could help in tackling the challenge of clinical utility to guide clinical decision-making and to inform health policy and planning across LMICs and high-income countries.Reference Herpertz, Huprich, Bohus, Chanen, Goodman and Mehlum93
Implications
Despite substantial inter-survey heterogeneity, we found that personality disorders are prevalent globally, affecting a substantial proportion of the population. Epidemiological research on personality disorders is relatively sparse, with a paucity of data from lower-income countries from which to draw comparative conclusions. Although personality disorder prevalence rates are lower in LMICs, they are still considerable.Reference Santana, Coelho, Wang, Chiavegatto Filho, Viana and Andrade87 As personality disorders are common across many areas of the world, they should be recognised as an important contributor to population mental health and disease burden.Reference Tyrer, Mulder, Crawford, Newton-Howes, Simonsen and Ndetei2,Reference Quirk, Berk, Chanen, Koivumaa-Honkanen, Brennan-Olsen and Pasco4 Personality pathology continues to be overlooked in clinical practice,Reference Newton-Howes, Clark and Chanen94 particularly in LMICs where resources are limited,Reference Agyapong, Osei, Farren and McAuliffe95 and personality disorders tend to be a lower priority.Reference Huang, Kotov, De Girolamo, Preti, Angermeyer and Benjet42,Reference Santana, Coelho, Wang, Chiavegatto Filho, Viana and Andrade87 Services in lower-income countries need to be structured to accommodate these patients, and educational programmes should be offered to both specialist and general practitioners.Reference Santana, Coelho, Wang, Chiavegatto Filho, Viana and Andrade87
Treatments for patients with personality disorder have advanced considerably over recent years with the advent of a number of specialised psychotherapiesReference Cristea, Gentili, Cotet, Palomba, Barbui and Cuijpers96 and early intervention programs.Reference Chanen, Sharp, Hoffman, Prevention and Disorder79,Reference Chanen, Jackson, McCutcheon, Jovev, Dudgeon and Yuen97 Nevertheless, the evidence base is underdeveloped with the majority of studies pertaining to borderline personality disorder and (to a lesser extent) antisocial personality disorder.Reference Bateman, Gunderson and Mulder74 Global prevalence rates for cluster A and C personality disorders exceed those of cluster B personality disorders, supporting the need for more treatment trials in these lesser studied disorders.Reference Bateman, Gunderson and Mulder74
Supplementary material
Supplementary material is available online at https://doi.org/10.1192/bjp.2019.166.
Funding
S.P.S. receives funding from Collaborations for leadership in Applied Health Research and Care (CLAHRC).
Acknowledgements
The views expressed are those of the authors and not necessarily those of the CLAHRC West Midlands. C.W. has full access to the data in the study and takes responsibility for the integrity of the data and accuracy of the analysis.




eLetters
No eLetters have been published for this article.