Good premorbid functioning among patients with schizophrenia and schizophrenia-like disorders is associated with better functioning at time of illness onset (Reference Haas and SweeneyHaas & Sweeney, 1992; Reference Rabinowitz, DeSmedt and HarveyRabinowitz et al, 2002; Reference Strous, Alvir and RobinsonStrous et al, 2004) and better outcomes in both patients with a first episode (Reference Shtasel, Gur and GallacherShtasel et al, 1992; Reference Bromet, Jandorf and FennigBromet et al, 1996; Silverstein et al, Reference Silverstein, Mavrolefteros and Close2002, Reference Silverstein, Mavrolefteros and Turnbull2003; Reference Strous, Alvir and RobinsonStrous et al, 2004) and patients with chronic disorder (Reference Gittelman-Klein and KleinGittelman-Klein & Klein, 1969; Reference Cannon-Spoor, Potkin and WyattCannon-Spoor et al, 1982; Reference Keefe, Mohs and LosonczyKeefe et al, 1989; Reference Childers and HardingChilders & Harding, 1990; Reference Findling, Jayathilake and MeltzerFindling et al, 1996; Reference Rabinowitz, Haim and ReichenbergRabinowitz et al, 2005). Studies examined outcomes cross-sectionally but not longitudinally; hence, it was not possible to be certain that the observed association between good premorbid functioning and favourable outcome was owing to a better response to treatment in those with good premorbid functioning. An alternative explanation might be that better outcomes among patients with good premorbid functioning may reflect the fact that they had a less severe form of illness and therefore continued better functioning upon initiation of treatment.
The goal of our study was to compare treatment response in recent-onset psychosis patients with good v. poor premorbid functioning in a large and lengthy clinical trial, in which the participants were assessed prior to beginning antipsychotic treatment and at regular intervals thereafter. The design of the trial allowed us to examine the association between premorbid functioning and treatment response while controlling for baseline differences in illness severity.
METHOD
The data presented here consist of an analysis of a retrospectively collected premorbid assessment, collected at time of entry into a double-blind, randomised controlled multicentre trial comparing a typical and a novel antipsychotic drug in recent-onset psychosis (Reference Schooler, Rabinowitz and DavidsonSchooler et al, 2005), and the baseline and end-point clinical, cognitive and safety assessments of patients enrolled in the trial.
Participants
The trial was conducted in 11 countries and enrolled psychotic patients aged 16–45 years who had been given within the previous 12 months a diagnosis (based on the Structured Clinical Interview for DSM-IV Disorders; Reference First, Spitzer and GibbonFirst et al, 1994) of schizophrenia, schizophreniform disorder or schizoaffective disorder, and who had a maximum of two lifetime psychiatric hospitalisations for psychosis. The cumulative exposure to antipsychotic drugs could not have exceeded 12 weeks at the time of entry to the study. Participants in both treatment groups started with a once-daily dose of 1 mg which could be increased to 2 mg on day 4 and thereafter by 1 mg each week, up to a maximum daily dose of 4 mg. In exceptional cases (i.e. for people showing insufficient response in whom no more than mild extrapyramidal symptoms were observed at a dosage of 4 mg per day), the dosage could be increased further by 1 mg a week up to a maximum daily dose of 8 mg. The mean modal total daily dosage of risperidone was 3.3 mg and for haloperidol it was 2.9 mg. The most commonly taken daily dose for each of the drugs (mode dose) was 3 mg. The study was conducted according to good clinical practice (Food and Drug Administration, 2005) and was approved by local institutional review boards. All participants gave informed written consent to take part in the study.
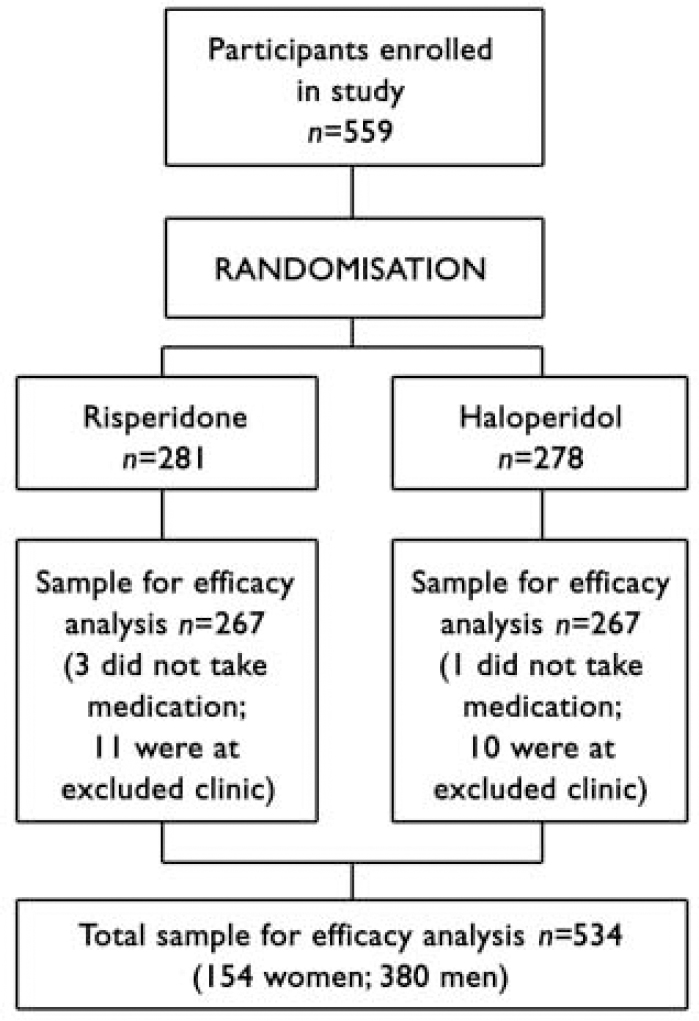
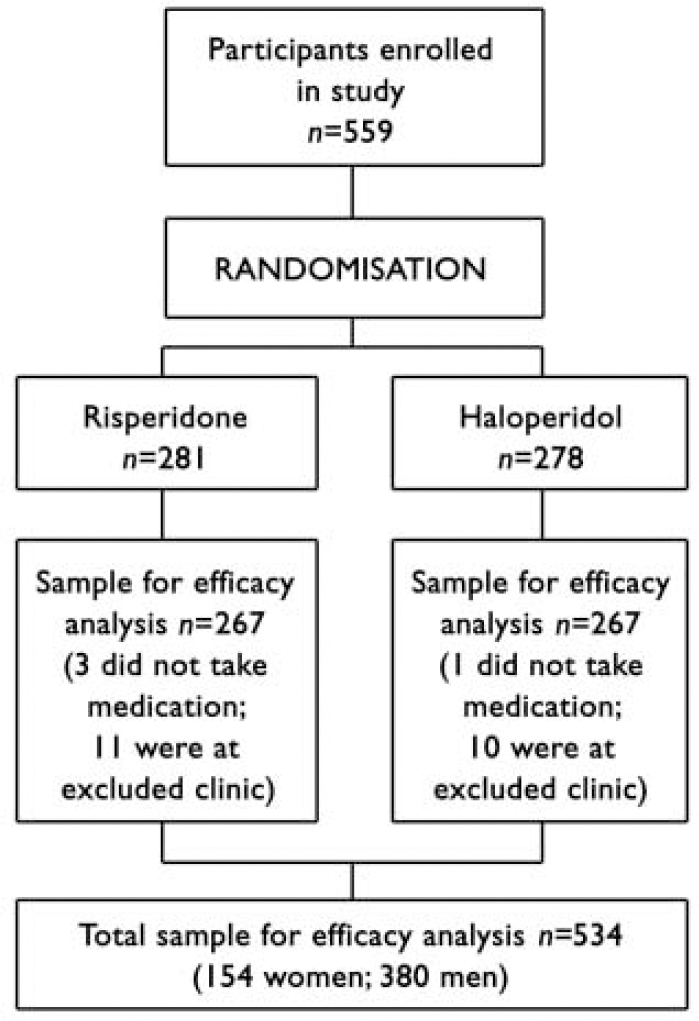
The flow of participants through the trial is shown in Fig. 1. The final sample for the efficacy analysis included 534 persons (154 women, median age 25.0 years; 380 men, median age 23.8 years), of whom 349 had a DSM-IV diagnosis of schizophrenia, 149 schizophreniform disorder and 36 schizoaffective disorder. Three persons left the trial before treatment was started but after randomisation, and one was removed from the trial for use of disallowed medication before the trial. One centre, which enrolled 21 patients, was removed from the trial in the early stages owing to violation of good clinical practice, and data from those patients are not included in the analysis. Fourteen per cent (n=76) of the sample had no high-school education, 26.6% (n=141) had some high-school education, 21.5% (n=114) completed high school, 29.9% (n=159) completed some post-high-school education and 7.5% (n=40) completed college. Women were significantly older at the time of first psychotic symptoms than men (median 23.9 years v. 22.6 years; Mann-Whitney U=24154, z=2.89, P=0.004). Patients were treated and followed up until the last patient to be enrolled had had the opportunity to be treated for 1 year (median duration of actual treatment 205 days).

Fig. 1 Flow of participants through study.
Assessments
The analysis included scores on the Premorbid Adjustment Scale (PAS; Reference Cannon-Spoor, Potkin and WyattCannon-Spoor et al, 1982), the Positive and Negative Syndrome Scale (PANSS; Reference Kay and SinghKay & Singh, 1989), Clinical Global Impression (CGI; Reference GuyGuy, 1976) scales for Severity of Illness and Improvement, the Extrapyramidal Symptoms Rating Scale (ESRS; Reference Chouinard, Ross-Chouinard and AnnableChouinard et al, 1980) and a cognitive assessment battery. All measures were applied at baseline before drug administration and (with the exception of the PAS) at regular intervals throughout the trial.
The PAS is a 28-item rating scale of social isolation, peer relationships, functioning outside of the family and school performance for four age periods (ages up to 11 years, 12–15 years, 16–18 years, and 19 years and above) as well as social-sexual aspects of life starting at age 15 years. The PAS also includes a section of nine general items relating to educational and job achievement, work and school performance immediately preceding the onset of psychosis, as well as the highest level of independence from family achieved, highest level of social personal adjustment, degree of interest in life and energy level. The PAS was completed using all available data, including interviewing the patient and when available interviews with collateral informants. A description of the PAS data for this cohort has been presented elsewhere by Rabinowitz et al (Reference Rabinowitz, DeSmedt and Harvey2002).
The cognitive assessment battery, which is described in greater detail elsewhere (Reference Harvey, Artiola i Fortuny and Vester-BlocklandHarvey et al, 2003), included the following:
-
(a) the Wechsler Memory Scale–Revised Visual Reproduction sub-test, I and II (Reference WechslerWechsler, 1987), a test of learning memory for non-verbal stimuli;
-
(b) the Rey Auditory Verbal Learning Test (Reference Spreen and StraussSpreen & Strauss, 1998), a test of verbal learning and memory;
-
(c) the Continuous Performance Test–Identical Pairs version (Reference Cornblatt, Lenzenweger and Erlenmeyer-KimlingCornblatt et al, 1989), a test of vigilance;
-
(d) Verbal Fluency Examinations (Reference LezakLezak, 1997), including category and phonological fluency;
-
(e) the Wechsler Adult Intelligence Scale–Revised, Digit Symbol sub-test (Reference WechslerWechsler, 1978), a test of psycho-motor speed and attention;
-
(f) the Wisconsin Card Sorting Test (Reference Heaton, Chelune and TalleyHeaton et al, 1993), a measure of executive functioning (e.g. cognitive flexibility, maintenance of a cognitive set and working memory).
Cognitive testing was administered at baseline, at months 3 and 6, and then every 6 months through to month 48. The tests, which were demonstrated to be comparable across cultures (Reference Harvey, Artiola i Fortuny and Vester-BlocklandHarvey et al, 2003), were translated from standard English versions into French, Finnish, German, Hebrew and Afrikaans and administered to participants in their native language. A central monitoring facility evaluated case record forms, and all forms with errors were returned for correction. If the problems were the results of errors in administration, the cognitive testing data on those patients were not included in the study database (Reference Harvey, Rabinowitz and EerdekensHarvey et al, 2005). All testers and assessors were college-educated, had previous experience and were fluent in English, although testing was done in the local language. Training in administering all the study assessment instruments was given in small group training sessions at the local sites, as well as in regional meetings.
The PAS was completed for 530 of the 534 participants, the PANSS for 533 and the cognitive assessment for 508, with completed data on all measures available for 503 participants. On the PAS, our main study measure, data per item were missing as follows: on the childhood items only 1 case had missing data on one item; on the early adolescence items data were missing in 2–6 cases for any given item; on late adolescence 2–12 cases had missing data for any given item, with the most missing data on social aspects of sexual life during adolescence and immediately beyond; for adulthood items, which were to be completed only for persons aged 19 years and over, data were missing in 9 cases for two items. On four of the six general items the maximum number of missing cases per item was 2; on one item (change in school or work performance before onset) data were missing in 20 cases and on a similar item (measuring job change and school attendance) data were missing in 18 cases.
Statistical analysis
Using the scoring method developed by Cannon-Spoor et al (Reference Cannon-Spoor, Potkin and Wyatt1982) for the PAS, average scores for each life stage were computed by summing the item scores received for each item in a section and dividing them by the possible score. The possible score is the highest score obtainable by adding the maximum score for all items completed. Thus, for example, if a person receives ratings of 2, 3, 3 and 2 for the four items in the childhood section, the total score for that section would be 10. As the total possible score for this is 24 (6+6+6+6), the total score divided by the possible score in this example is 0.42. When no information was available for a particular item, the item was not scored. The score for the section is expressed as total score/possible score for the items rated.
For typology of premorbid functioning, as in other studies (Reference Larsen, McGlashan and JohannessenLarsen et al, 1996; Reference Rabinowitz, DeSmedt and HarveyRabinowitz et al, 2002; Reference Strous, Alvir and RobinsonStrous et al, 2004), the Haas & Sweeney (Reference Haas and Sweeney1992) classification method was used in which patients are divided into ‘stable–good’, ‘stable–poor’ and ‘declining’ premorbid functioning categories. The notion of examining patterns of premorbid development and course has been empirically validated (Reference Larsen, Friis and HaahrLarsen et al, 2004). A ‘declining’ PAS was defined as:
'a pattern of worsening scores from childhood over the remaining premorbid periods and the equivalent of a two-point change over four premorbid stages (childhood, early adolescence, late adolescence and adulthood) or a proportional decline for cases in which illness onset was before late adolescence or adulthood' (Reference Haas and SweeneyHaas & Sweeney,1992).
In accordance with the scoring criteria, the remaining cases were regarded as stable and the median value (0.36) of the PAS total score was used as a cut-off point to divide the cases into ‘stable–good’ and ‘stable–poor’ groups. Based on this, 47% (n=251) of the patients were in the ‘stable-good’ group, 37% (n=198) in the ‘stable-poor’ group and 15% (n=81) in the ‘declining’ group. This distribution resembles other studies using this classification method, in which the ‘stable-good’ group ranged from 30% to 39%, the ‘stable-poor’ group from 28% to 39% and the ‘declining’ group from 21% to 42% (Reference Haas and SweeneyHaas & Sweeney, 1992; Reference Larsen, McGlashan and JohannessenLarsen et al, 1996; Reference Strous, Alvir and RobinsonStrous et al, 2004).
Univariate analyses of covariance comparing the premorbid groups on change from baseline on PANSS total, ESRS maximum, CGI Severity, CGI Change score, mean modal dose and composite cognitive score, were conducted while controlling for baseline score for each measure, diagnosis, gender, age, study centre and randomised drug treatment condition. For CGI Change scores the CGI severity was used as a baseline control. The composite cognitive score was created by computing the mean of the z-scores for each cognitive measure in the current study, as described by Harvey et al (Reference Harvey, Rabinowitz and Eerdekens2005). Follow-up tests using the least-squares procedure were used after detection of significant between-group differences. Effect size for the primary comparison of the ‘stable-good’ and ‘stable-poor’ groups was calculated using eta squared and for ease of reporting was converted to Cohen's d (Reference CohenCohen, 1976), which is the difference between groups divided by the pooled standard deviation. Cohen (Reference Cohen1976) has defined effect sizes of 0.20-0.50 as small, 0.50-0.80 as medium and over 0.80 as large.
RESULTS
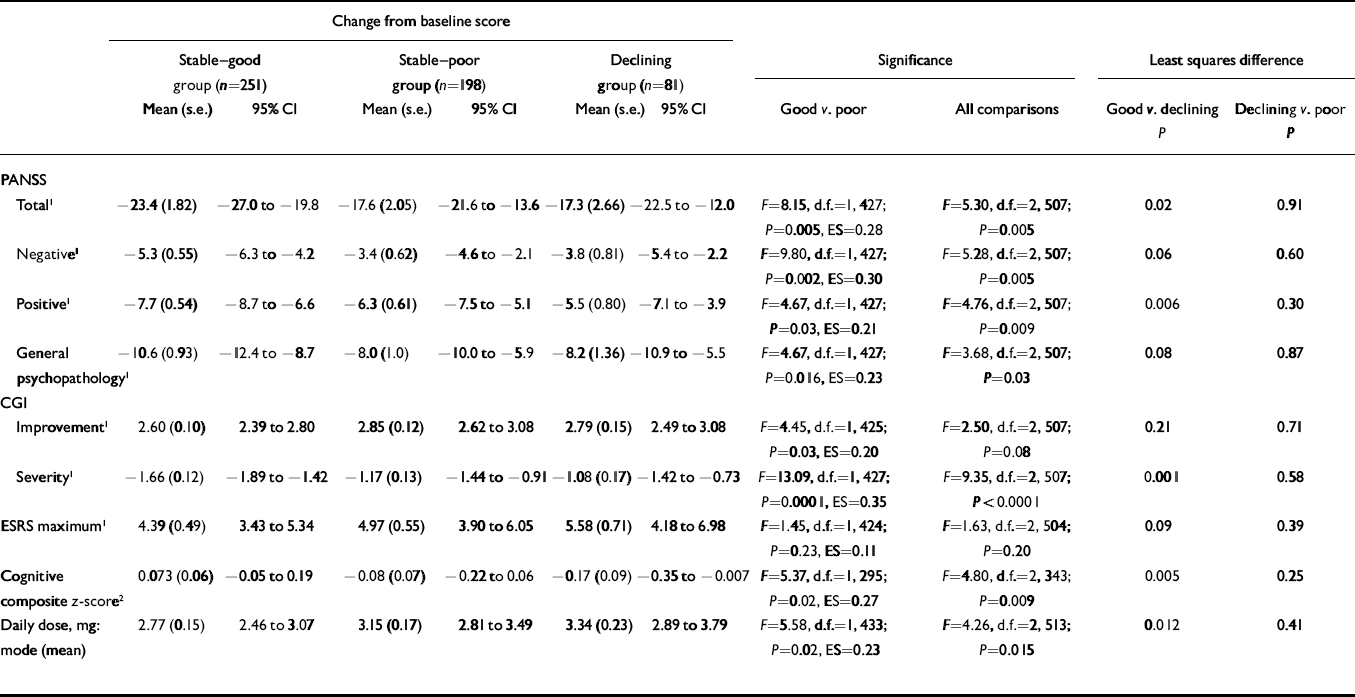
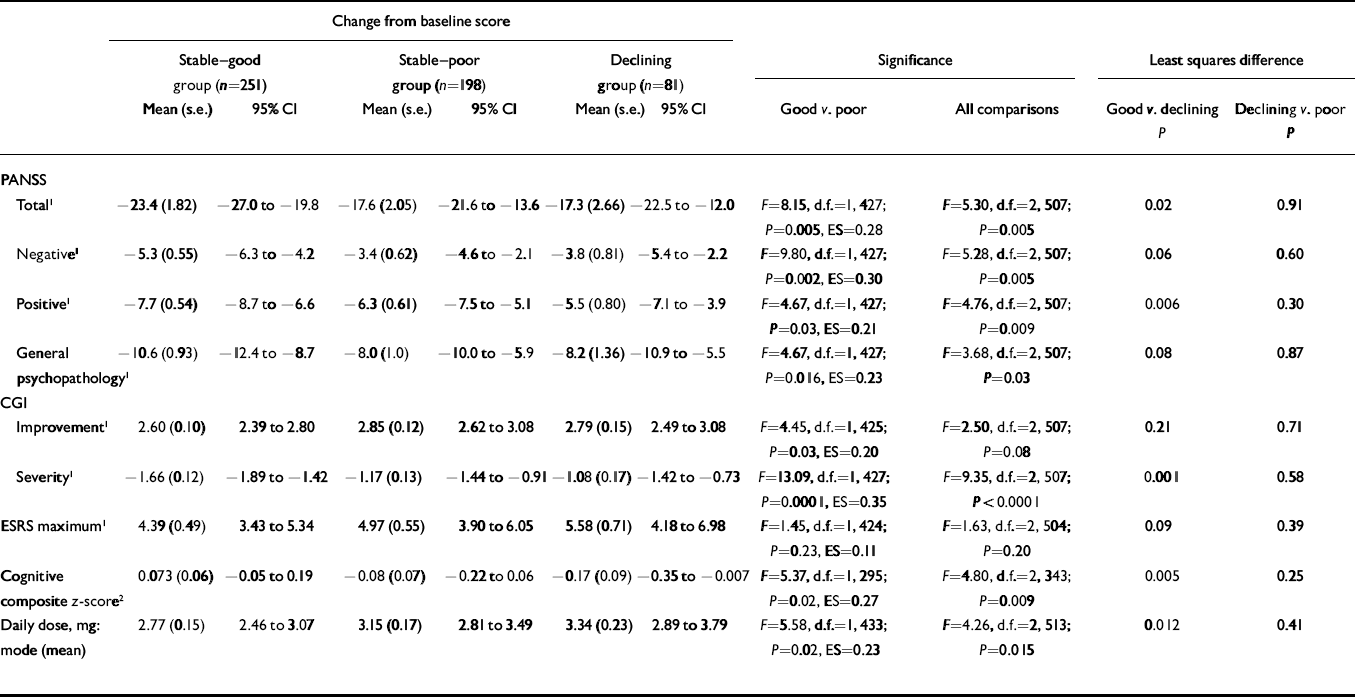
Table 1 shows significantly more improvement in the ‘stable–good’ group compared with the ‘stable–poor’ group on the mean change in PANSS total, positive, negative and general psychopathology scales, CGI Severity, cognitive functioning and CGI Improvement. The ‘stable–good’ group also had lower dosages. Although numerically the ‘stable–good’ group had lower maximum ESRS scores than the ‘stable–poor’ group, these differences were not statistically significant. All effect size scores were small, ranging from 0.11 to 0.35.
Table 1 Change from baseline on clinical rating scales, extrapyramidal ratings and cognitive functioning according to level of premorbid functioning

| Change from baseline score | |||||||||||||||
|---|---|---|---|---|---|---|---|---|---|---|---|---|---|---|---|
| Stable–good group (n=251) | Stable–poor group (n=198) | Declining group (n=81) | Significance | Least squares difference | |||||||||||
| Mean (s.e.) | 95% CI | Mean (s.e.) | 95% CI | Mean (s.e.) | 95% CI | Good v. poor | All comparisons | Good v. declining | Declining v. poor | ||||||
| P | P | ||||||||||||||
| PANSS | |||||||||||||||
| Total 1 | –23.4 (1.82) | –27.0 to –19.8 | –17.6 (2.05) | –21.6 to –13.6 | –17.3 (2.66) | –22.5 to –12.0 | F=8.15, d.f.=1, 427; P=0.005, ES=0.28 | F=5.30, d.f.=2, 507; P=0.005 | 0.02 | 0.91 | |||||
| Negative 1 | –5.3 (0.55) | –6.3 to –4.2 | –3.4 (0.62) | –4.6 to –2.1 | –3.8 (0.81) | –5.4 to –2.2 | F=9.80, d.f.=1, 427; P=0.002, ES=0.30 | F=5.28, d.f.=2, 507; P=0.005 | 0.06 | 0.60 | |||||
| Positive 1 | –7.7 (0.54) | –8.7 to –6.6 | –6.3 (0.61) | –7.5 to –5.1 | –5.5 (0.80) | –7.1 to –3.9 | F=4.67, d.f.=1, 427; P=0.03, ES=0.21 | F=4.76, d.f.=2, 507; P=0.009 | 0.006 | 0.30 | |||||
| General psychopathology 1 | –10.6 (0.93) | –12.4 to –8.7 | –8.0 (1.0) | –10.0 to –5.9 | –8.2 (1.36) | –10.9 to –5.5 | F=4.67, d.f.=1, 427; P=0.016, ES=0.23 | F=3.68, d.f.=2, 507; P=0.03 | 0.08 | 0.87 | |||||
| CGI | |||||||||||||||
| Improvement 1 | 2.60 (0.10) | 2.39 to 2.80 | 2.85 (0.12) | 2.62 to 3.08 | 2.79 (0.15) | 2.49 to 3.08 | F=4.45, d.f.=1, 425; P=0.03, ES=0.20 | F=2.50, d.f.=2, 507; P=0.08 | 0.21 | 0.71 | |||||
| Severity 1 | –1.66 (0.12) | –1.89 to –1.42 | –1.17 (0.13) | –1.44 to –0.91 | –1.08 (0.17) | –1.42 to –0.73 | F=13.09, d.f.=1, 427; P=0.0001, ES=0.35 | F=9.35, d.f.=2, 507; P<0.0001 | 0.001 | 0.58 | |||||
| ESRS maximum 1 | 4.39 (0.49) | 3.43 to 5.34 | 4.97 (0.55) | 3.90 to 6.05 | 5.58 (0.71) | 4.18 to 6.98 | F=1.45, d.f.=1, 424; P=0.23, ES=0.11 | F=1.63, d.f.=2, 504; P=0.20 | 0.09 | 0.39 | |||||
| Cognitive composite z-score 2 | 0.073 (0.06) | –0.05 to 0.19 | –0.08 (0.07) | –0.22 to 0.06 | –0.17 (0.09) | –0.35 to –0.007 | F=5.37, d.f.=1, 295; P=0.02, ES=0.27 | F=4.80, d.f.=2, 343; P=0.009 | 0.005 | 0.25 | |||||
| Daily dose, mg: mode (mean) | 2.77 (0.15) | 2.46 to 3.07 | 3.15 (0.17) | 2.81 to 3.49 | 3.34 (0.23) | 2.89 to 3.79 | F=5.58, d.f.=1, 433; P=0.02, ES=0.23 | F=4.26, d.f.=2, 513; P=0.015 | 0.012 | 0.41 | |||||
CGI, Clinical Global Impression; ESRS, Extrapyramidal Symptoms Rating Scale; PANSS, Positive and Negative Syndrome Scale; ES, effect size
1. Lower scores are better
2. Higher scores are better
The ‘declining’ group comparisons with the ‘stable-good’ group were similar to those of the ‘stable-poor’ group. Numerically those in the ‘declining’ group improved the least, had the most extrapyramidal signs and were treated with the highest drug dosages. After including mode antipsychotic dosage as a covariate in the model, testing differences on the ESRS, the ESRS differences were reduced (F=1.45, P=0.23, effect size=0.11 v. F=0.50, effect size=0.06, P=0.44), suggesting that most of the association between better premorbid adjustment and fewer extrapyramidal symptoms was owing to drug doses.
DISCUSSION
The results of this study demonstrate that good v. poor and declining premorbid functioning of people who later develop schizophrenia was associated with better treatment response. The good premorbid functioning group also needed lower doses of antipsychotic medication to achieve clinically satisfactory treatment response and experienced the least extrapyramidal symptoms. The results thus support the prognostic value of premorbid functioning in predicting magnitude of response when treatment is first started and suggest that premorbid functioning might be a potentially useful subtyping distinction of patients. Clinically, it might be possible to use premorbid subtyping in treatment planning: prognosis regarding treatment response could be modified based on premorbid course and patients with other than ‘stable-good’ premorbid functioning could be targeted for more intensive therapeutic intervention. Specifically, such cases should probably receive more rapid consideration for transition to clozapine treatment or treatment with more aggressive dosing regimens. Theoretically the results may suggest different aetiologies for schizophrenia among cases of good v. poor premorbid functioning. People with poor premorbid functioning might have positive symptoms whose origin is more complex than those with better premorbid functioning, involving either different brain regions or different neurotransmitter systems. The results also suggest that from the perspective of treatment response there is no difference between the ‘stable-poor’ and ‘declining’ groups, both of whom showed poor treatment response. Thus, lack of decline in functioning from previously poor levels of functioning appears not to be an indicator of better prognosis.
One of the limitations of this study, and other studies, is that the quality and timing of premorbid manifestations that are based on cross-sectional assessments conducted generally at the first contact with a mental health professional (Reference McGlashanMcGlashan, 1988) could be biased by selective or incomplete recall on the part of the patients or family members. In addition the assessments were not always based on the same sources of information, which were in some cases interviews with patients and in others interviews with collateral informants as well. It is conceivable that a truly prospective follow-up study, specifically designed to detect signs of premorbid psychosis and schizophrenia and conducted from birth through age of risk, would reveal a specific trajectory of social maladjustment for the majority of the individuals destined to be affected by psychosis. Alternatively, it is possible that the premorbid and prodromal manifestations are obligatory precursors of the illness only for some of the individuals affected or only for a subgroup of the schizophrenias. Another potential limitation of the study is that since data were obtained from a sample of patients who agreed to be enrolled in a medication trial, this might have introduced a selection bias; however, it is not obvious how this might limit the conclusions that can be drawn from the study. Another limitation is that only clinical outcomes, rather than functional outcomes such as social and occupational functioning, were examined.
In summary, our results, taken together with previous studies including the baseline data from this large cohort (Reference Rabinowitz, DeSmedt and HarveyRabinowitz et al, 2002), suggest that premorbid level of functioning is predictive of poorer functioning at the time of onset of schizophrenia (Reference Haas and SweeneyHaas & Sweeney, 1992; Reference Kelley, Gilbertson and MoutonKelley et al, 1992; Reference Larsen, McGlashan and JohannessenLarsen et al, 1996; Reference Rabinowitz, DeSmedt and HarveyRabinowitz et al, 2002), poorer outcomes and functioning among patients with first-episode (Reference Shtasel, Gur and GallacherShtasel et al, 1992; Reference Bromet, Jandorf and FennigBromet et al, 1996; Silverstein et al, Reference Silverstein, Mavrolefteros and Close2002, Reference Silverstein, Mavrolefteros and Turnbull2003) or chronic disorder (Reference Gittelman-Klein and KleinGittelman-Klein & Klein, 1969; Reference Cannon-Spoor, Potkin and WyattCannon-Spoor et al, 1982; Reference Keefe, Mohs and LosonczyKeefe et al, 1989; Reference Childers and HardingChilders & Harding, 1990; Reference Findling, Jayathilake and MeltzerFindling et al, 1996; Reference Rabinowitz, Haim and ReichenbergRabinowitz et al, 2005) and, based on the current study, also poorer treatment response. Premorbid functioning is thus of both clinical and theoretical importance and may suggest the need to consider aggressive intervention, either pharmacological or psychosocial, at the time of the first episode of illness.
Acknowledgements
The randomised controlled drug trial reported here was conducted by Janssen Research Foundation, which funded all aspects of this study. The study included the following investigators and locations. Australia: P. McGorry (Melbourne), T. Lambert (Bentley), J. Kulkarni (Dandenong). Austria: W. Fleischhacker (Innsbruck). Canada: D. Addington (Calgary), L. Kopala (Halifax), R. Williams (Calgary), G. Chouinard (Montreal), A. Labelle (Ottawa), A. Malla (London), S. Purdon (Edmonton), M. Saxena (Hamilton), V. Nair (Montreal), R. Matte (Sherbrooke), S. Johnson (St John's), L. Beauclair (Montreal). Finland: K. Lehtinen (Tampere). France: E. R. Lombertie (Limoges), J.-A. Meynard (La Rochelle). Germany: H. Freyberger (Stralsund), H.-J. Möller (Munich). Israel: A. Caspi, M. Davidson (Ramat-Gan), A. Elitzur (Bat-Yam), M. Kotler (Beer Sheva), I. Treves (Hod-Hasharon), A. Weizman (Petach-Tikva). The Netherlands: P. Dries (Poortugaal). New Zealand: D. Codyre (Auckland). South Africa: R. Emsley (Cape Town), C. Gagiano (Bloemfontein).UK: M. Reveley (Leicester),T. Sharma (London). USA: J. Csernansky (St Louis), L. DeLisi (Stony Brook), J. Lauriello (Albuquerque), T. Manschreck (Fall River), J. Pahl (Oklahoma City), N. Schooler, M. Keshavan (Pittsburgh), S. Schulz (Cleveland), S. Targum (Philadelphia), S. Risch (Charleston).
Data analysis and manuscript preparation were supported by a grant from the German Federal Ministry of Education and Research (BMBF), within the framework of German-Israeli Project Cooperation (DIP).


eLetters
No eLetters have been published for this article.