In June 2002, the National Institute for Clinical Excellence (NICE) issued guidance on the use of new (atypical) antipsychotic drugs in the treatment of schizophrenia in England and Wales (National Institute for Clinical Excellence, 2002). The guidance had a notional implementation time of 3 months, and carries the expectation that health professionals take it fully into account when exercising their clinical judgement. The guidance itself is set out in ten brief points. In summary: the choice of drug needs to be made after informed discussion with patient, carer and clinician, with the default that new atypical antipsychotic agents are the drugs of choice and need to be considered as first-line treatments; clinicians and teams need to start assessing systematically clinical progress and side-effects, as well as risk of non-concordance; depot drug treatment should be used where needed, but there should be no concurrent prescribing of atypical and typical drugs; clozapine has the clearest efficacy advantages over conventional drugs, is resource-saving and should be used at the earliest opportunity, after failure of adequate response to two prior antipsychotics each given for 6-8 weeks. Overall, this guidance has been welcomed by user groups, carers, clinicians and the pharmaceutical industry.
The guidance has emerged against a background of debate about the benefits of the new drugs in comparison with conventional antipsychotic agents, with divergent views between policy-makers, commissioners, patients, carers and clinicians. Systematic reviews varied in their conclusions about the real advantages of new atypicals over their predecessors, with claims that even the better tolerability was really an artefact of trials that chose to use conventional comparators at doses that would guarantee side-effects (Reference Geddes, Freemantle and HarrisonGeddes et al, 2000). As a result, different local practices evolved, with variations in the availability of new drugs. What is the evidence for the extent of this variation and the reasons for it? Knowing this will give an idea of the scale of the problems facing implementation of the NICE guidance.
CHANGING PATTERNS OF PRESCRIBING
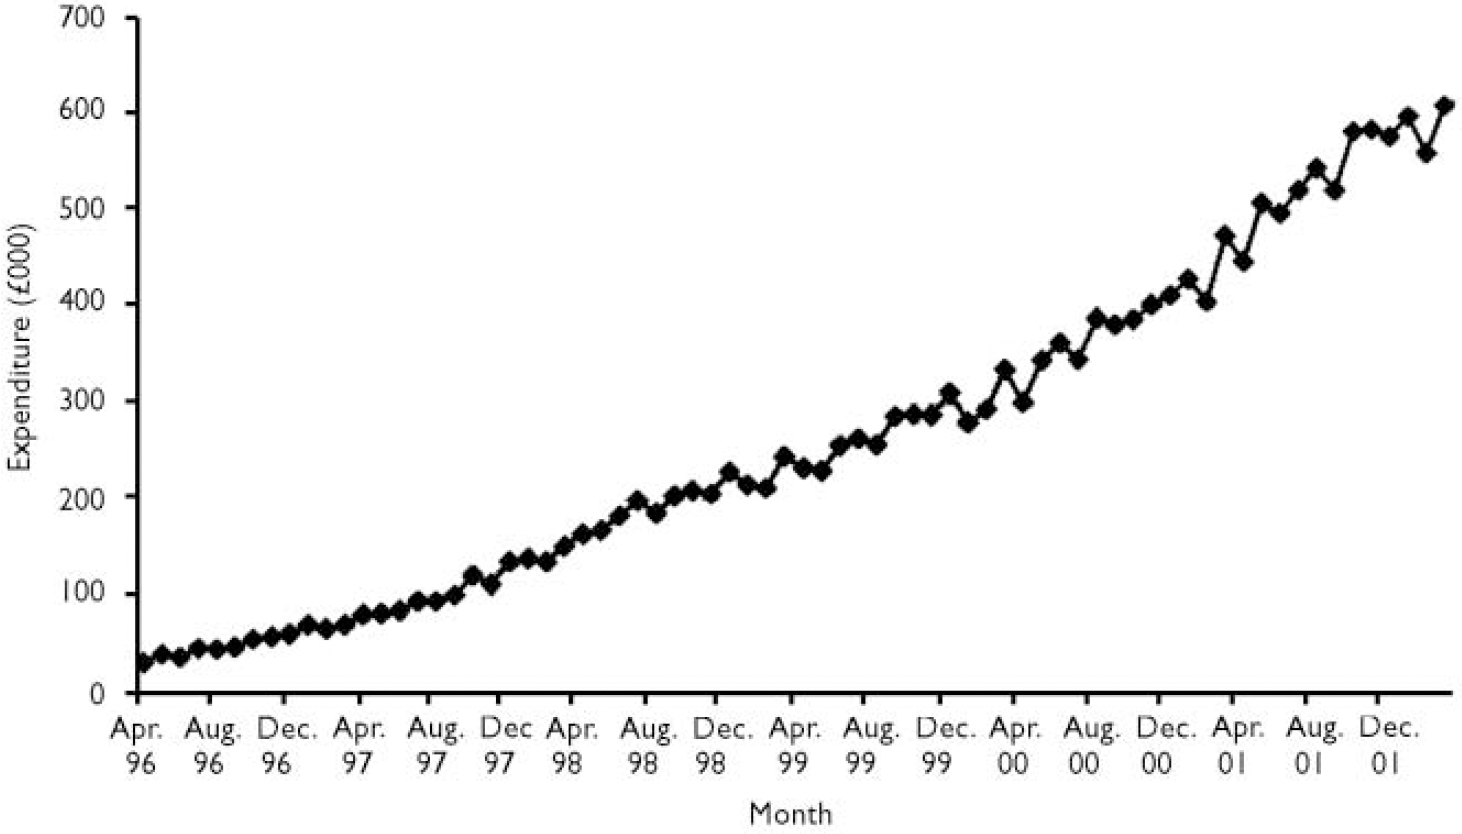
The rise in prescription of new antipsychotic drugs in recent years is illustrated in Fig. 1, showing primary care costs in Greater Manchester over a 6-year period. Although treatment with new atypicals is still rarely initiated in primary care, repeat prescriptions mean that most of the costs have fallen on primary care budgets: for example, these costs represent 83% of the total budget in Manchester (data derived from local audit figures for Manchester Mental Health and Social Care Trust).

Fig. 1 Greater Manchester: primary care quarterly expenditure on atypical antipsychotic drugs, 1996-2001 inclusive.
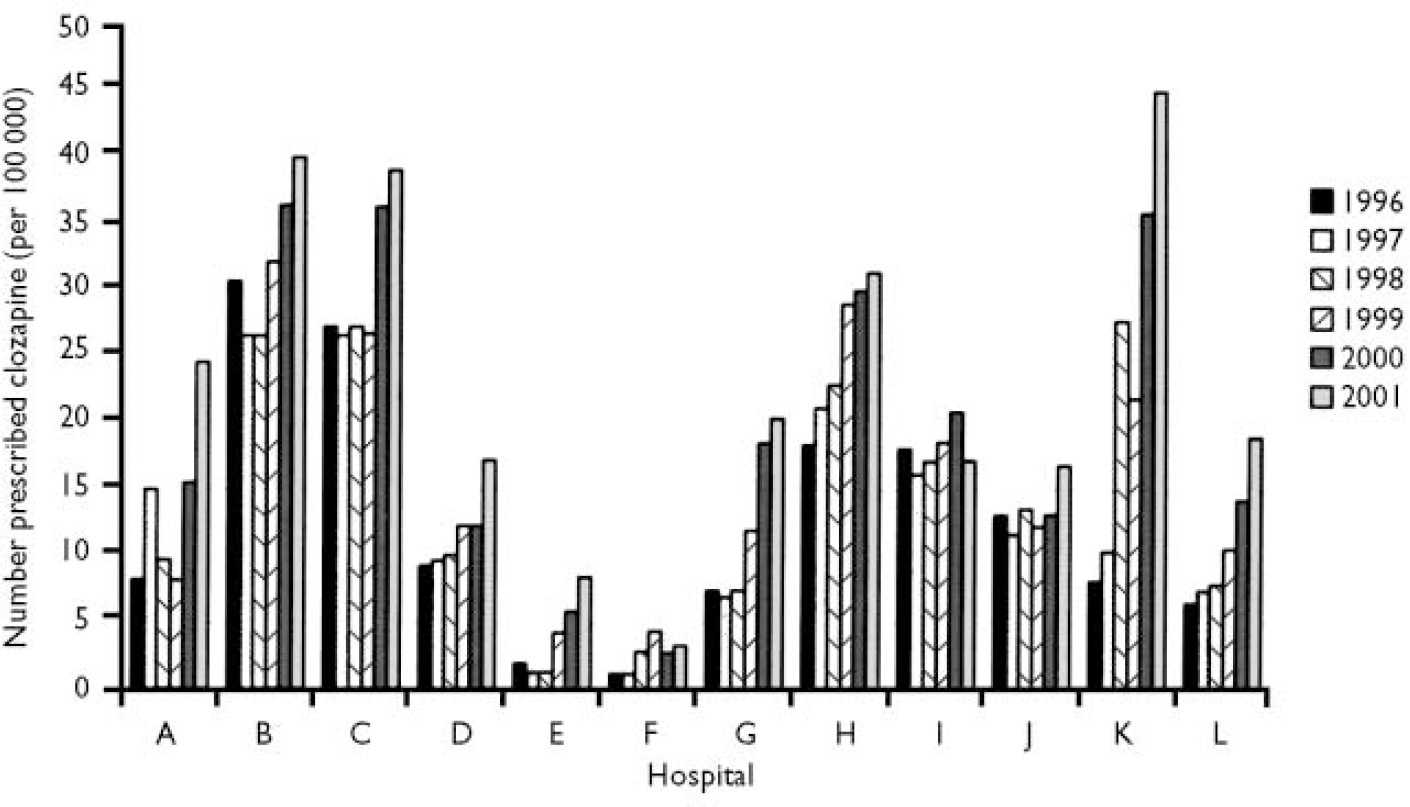
This rise disguises underlying geographical variation in the prescribing of new drugs. This appears to be most pronounced for clozapine, a situation that is curious for three reasons. Clozapine has been licensed for over 12 years; its place as the most effective drug in schizophrenia is clear and it has the best evidence to suggest that it is cost-saving. Retrospective UK studies (Reference Aitchison and KerwinAitchison & Kerwin, 1997) have led to the figure quoted in the NICE guidance of £7000 overall resource savings per year for individuals started on clozapine, replicated in a recent controlled mirror-image study (Reference Hayhurst, Brown and LewisHayhurst et al, 2002). Despite this, an audit in 1998 in Greater Manchester showed a 30-fold variation in per capita availability of clozapine between the 12 existing mental health providers (Reference Purcell and LewisPurcell & Lewis, 2000). This has improved (Fig. 2), but only to the extent that there is now a 16-fold variation. Reasons for this were explored, and the main culprit was found to be variation in clinical practice between secondary care prescribers, rather than financial constraints. Low rates of clozapine prescribing correlated with high rates of antipsychotic polypharmacy (Reference Purcell and LewisPurcell & Lewis, 2000).

Fig. 2 Population-adjusted prescribing rates for clozapine across Greater Manchester, 1996-2001.
POSTCODE PRESCRIBING
To what extent are these variations in prescribing mirrored for the new atypicals as a class, across the country? Antipsychotic drug expenditure data for primary care for all 99 English health authorities (total population 52 072 048) during the second quarter of 1999 were made available by the Prescription Pricing Authority after permission was obtained individually from each health authority to access these data. The data on expenditure were normally distributed. Data on typical antipsychotics exclude depot preparations, although an examination of total primary care antipsychotic spending data for England in 1999 shows that depot preparations accounted for only 5% of all antipsychotic spending.
Adjusted spending figures showed a 9-fold variation in per capita spending on atypical drugs across English health authorities (Fig. 3). Discussion with a sub-sample of health authorities showed that their different methods of attributing costs to primary and secondary care contributed a small amount to this variation. A different picture emerged when the ratio of expenditure on atypical drugs to that on typical drugs was examined. As an example, Manchester had the highest spend on atypicals, but was only twenty-fourth highest in terms of atypical to typical spending ratio (4.8:1). The highest ratio was 7.6:1 and the lowest ratio 1.0:1. The variation between health authorities in per capita expenditure on atypical drugs was almost three times greater than the variation in per capita expenditure on typical antipsychotics.

Fig. 3 Primary care expenditure on all atypical antipsychotic drugs by health authority, April—June 1999.
EFFECT OF POPULATION NEED
Why should such wide variations in the delivery of antipsychotic drugs exist? For total drug use, there could be explanations based on supply, demand or need. Supply-side explanations would involve the varying preferences of clinicians in terms of using antipsychotic drugs, as we have shown for clozapine. Need would be a more parsimonious explanation, with drug use simply reflecting the varying rates and severity of psychotic illness between different communities. Indices of population need are known to predict other aspects of resource use, such as in-patient stays (Reference Carr-Hill, Hardman and MartinCarr-Hill et al, 1994), but this has not been examined in relation to antipsychotic drug prescribing.
To test this, per capita antipsychotic drug expenditure in primary care for each of the 99 English health authorities during the second quarter of 1999 (April—June) was set against that health authority's York Psychiatric Need Index score (Carr-Hill, 1994), a morbidity weighting for mental illness devised on the basis of observed relationships between socio-demographic characteristics and patterns of service use. As hypothesised, local psychiatric need showed significant correlations with per capita spending on new atypicals (r=0.49, P<0.001), typicals (r=0.33, P<0.001) and all antipsychotic drugs (r=0.51, P<0.001). The York Index explained 24% of the variance of per capita atypical antipsychotic expenditure (Fig. 4). When expenditure was expressed in these terms, Manchester dropped to 27th place in terms of population- and need-adjusted spending on atypical antipsychotics.

Fig. 4 Health authority expenditure per capita on new atypical antipsychotic drugs, by York Psychiatric Need Index score.
RATIONAL PRESCRIBING AND RESOURCING
Postcode prescribing in the UK has been demonstrated in a range of therapeutic areas, such as the treatment of multiple sclerosis, cancer and the provision of in vitro fertilisation (Reference ThompsonThompson, 1999). It has not been studied in detail in mental health, where drug treatments have in the past been relatively inexpensive. However, the acquisition cost of atypical antipsychotic drugs is about 20 times that of their predecessors. Our data show a 16-fold variation between districts in the per capita use of clozapine in secondary care and a 9-fold variation in the per capita use of new atypicals in primary care. This gives support to claims that postcode prescribing for schizophrenia is a reality (National Schizophrenia Fellowship, 2000). Our data show that individual practitioner preferences and prescribing skills still count for a great deal, particularly for clozapine, where inequalities are changing only gradually.
Local population need appears to account for about a quarter of the variance in per capita antipsychotic spend. The level of local need may not be taken into account sufficiently when allocating resources for antipsychotic spending and also when monitoring such spending. A study comparing mental health expenditure with allocation data showed that, paradoxically, a relative underspend occurred more frequently in areas of greater need (Reference Bindman, Glover and GoldbergBindman et al, 2000). This means that relatively expensive new treatments will be least available where they are most needed.
Acknowledgements
The authors thank Dr Peter Elton, Kerry Frenz of the Prescription Pricing Authority, Neil Bendel of Manchester Health Authority, and other health authority staff across England.


eLetters
No eLetters have been published for this article.