There is growing research literature on the mental health needs of adolescents in the youth justice system (Reference Teplin, Abram and McCellandTeplin et al, 2002). However, many of the studies conducted have been small, focusing on those in secure care, with few studies of female offenders or those from Black and minority ethnic groups (Reference Lader, Singleton and MeltzerLader et al, 2000; Reference Kroll, Rothwell and BradleyKroll et al, 2002). Over the past 5 years there have also been significant changes in youth justice service structure, culture and provision in England and Wales. Services have expanded, sentencing has changed and there is an emphasis on prevention and treatment (Youth Justice Board, 2004). However, there is no national needs assessment, using both corporate and individual methods. Corporate needs assessment is essential for service planning and estimating costs (Reference Harrington, Kerfoot and VerduynHarrington et al, 1999). Individual needs assessment contributes to coordination of care and risk assessment (Reference KingdonKingdon, 1994).
This research was commissioned by the Youth Justice Board to examine a national sample of young offenders using corporate and individual needs assessment methods. We report here on the individual needs research. The aims were to measure rates of mental health, social and educational needs of juvenile offenders in secure facilities and in the community and to explore differences in needs dependent on setting, gender and ethnicity.
METHOD
Context and participants
This individual needs research was part of a larger study commissioned by the Youth Justice Board in 2002 to evaluate the effectiveness of mental health provision for young offenders in custody and in the community. This larger study included cost evaluation of youth crime (Reference Barrett, Byford and ChitsabesanBarrett et al, 2006), longitudinal follow-up of the secure sample (Youth Justice Board, 2005) and qualitative aspects of service provision (Youth Justice Board, 2005).
Six sites were chosen as geographically representative areas across England and Wales. Each site comprised a secure facility and the local youth offending team. The secure facilities included four young offenders institutions and two local authority secure children's homes. Because of the small size of both secure children's homes and three of the six youth offending teams, further sites were recruited (two local authority secure children's homes and three youth offending teams). These additional sites were chosen for their geographical proximity or service connection to the original site.
Young people aged 13–18 years inclusive were recruited to the study. This involved recruiting 25 individuals attending consecutively at each of the six youth offending teams, while at the secure sites, the 25 young offenders recruited were equally divided between those just admitted and those about to be released. Within secure estates, both remanded (pre-trial and post-trial) and sentenced young offenders were eligible for the study. Those in the community included young offenders on final warnings as well as those given community orders. We aimed to oversample female young offenders and those from Black and minority ethnic groups. At each of the youth offending teams and secure sites we attempted to recruit five young offenders from Black and minority ethnic groups and five female offenders with the aim of finally recruiting 60 female offenders and 60 offenders from Black and minority ethnic groups out of a total of 300 young offenders (150 in custody and 150 in the community).
Eligible young people willing to participate in the study were referred by staff at the secure and community sites to the research assistants. The young person was then informed about the study and consent was obtained by one of three research interviewers. Where young people were judged to be not competent to give written consent, consent was obtained from their parent or legal guardian. Ethical approval was obtained from the North West Multicentre Research Ethics Committee.
Measures
Although previous studies of juvenile offenders have often used psychiatric diagnosis as a measure of mental health problems, this method has certain limitations: for example, the prevalence of a disorder does not necessarily equate to the level of services required (Reference Harrington, Kerfoot and VerduynHarrington et al, 1999). The latter is influenced by a number of factors including the availability of an effective intervention and a willingness to accept the intervention. Increasingly, therefore, needs assessment is seen as a more useful measure of health problems in children and adults, including juvenile offenders. The Salford Needs Assessment Schedule for Adolescents (SNASA; Reference Kroll, Woodham and RothwellKroll et al, 1999) is a semi-structured interview specifically designed for research on adolescents and has good psychometric properties (Reference Kroll, Woodham and RothwellKroll et al, 1999). In addition to psychiatric symptoms, the SNASA covers several other needs, including education and social needs. For each domain, the interviewer gathers information on symptom severity (on a five-point scale), client cooperation (three-point scale), client perception of the problem (three-point scale) and keyworker stress (four-point scale). This instrument also allows researchers to obtain information about interventions that have been offered recently or not offered. From this information, the SNASA identifies needs. A need is defined as a significant problem requiring some form of intervention and is automatically identified by the program if a threshold is crossed either in one area (severity criteria) or in a combination of areas.
Within the final stage of the SNASA, experienced clinicians (child psychiatrists) are required to make judgements about interventions offered based on available information about the young person obtained from both the individual and a carer. A final needs status is generated, rated as ‘no need’, ‘unmet need’ (in need of an intervention that has not been given), ‘suspended need’ (an intervention has been offered recently, but it is too soon to assess whether it has been beneficial) or ‘need that persists despite intervention’.
The different needs domains are described within the results section. For both the research interviewers’ and the clinicians’ needs ratings, reliability of the ratings was ensured by frequent meetings between the research interviewers and clinicians to agree on scoring. There was also assessment of the percentage of pairwise agreement between research interviewers (81–87%) and clinicians (85–91%) on individual cases.
Details of offending behaviour were obtained from self-reports from the young person. Psychometric assessments used included the Weschler Abbreviated Schedule Interview (WASI; Psychological Corporation, 1999) and the Weschler Objective Reading Dimension (WORD; Psychological Corporation, 1992). Youth offending workers and either keyworkers or personal officers who knew the young people were also interviewed for carer information.
Statistical analysis
The software Statistical Package for the Social Sciences version 10 for Windows was used to analyse the data. Total levels of needs and cardinal problems were parametric in their distribution and subsequently two-tailed t-tests and analysis of variance were used to assess the correlation of different variables with them. The presence or absence of cardinal problems in both major domains and individual areas were categorical variables and subsequently chi-squared analysis was used to assess the correlation with other variables.
It was calculated that with 150 participants the study would have an 80% chance of detecting an effect size of 0.3 between custody and community groups using the SNASA. To be able to detect an effect size of 0.5 between juvenile offenders of different genders (male v. female) and different ethnic groups (White British v. Black and minority ethnic) we estimated that we would need to recruit a sample of 64 female offenders and 64 young offenders from Black and minority ethnic groups (Reference Machin and CampbellMachin & Campbell, 1987). The significance of differences was calculated using a 95% confidence interval (Reference Gardner and AltmanGardner & Altman, 1989).
RESULTS
Study sample
At the secure sites, 162 young people were eligible for the study. Consent was obtained from 151 of these young people. The remaining 11 refused to participate in the study. Within community sites, 173 young people were referred and 150 were interviewed. The remaining 23 young people either refused or consistently failed to attend their interview appointments. Thus, 301 young offenders were interviewed using the demographic pro-forma and SNASA accompanied by 174 SNASA carer interviews. Missing carer interviews were owing to the youth offending team member or personal officer being unavailable. The WASI and WORD assessments were completed by 257 and 259 young people respectively.
Demographic characteristics
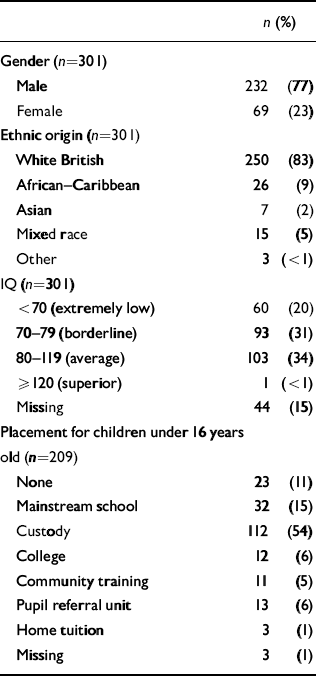
The characteristics of participants in the study are given in Table 1. The mean age of the sample recruited was 15.7 years (s.d.=1.3, range 13–18). Over three-quarters of the sample were male (77%). The majority of young offenders classified themselves as White British (83%). Although the study specifically oversampled young offenders from Black and minority ethnic groups, these figures were similar to those found within the youth justice system (Youth Justice Board Conference, 2004). Three-quarters (74%) of young offenders were from families where the family structure had broken down, with only 36% of biological parents still married or cohabiting. A third of young offenders (37%) had been in care at some time, and 77% had parents in manual employment. Of those under 16 years who should have been in statutory education (n=209), 89% were obtaining some form of educational provision, although only 16% of young people were in mainstream school. One in five young offenders had an IQ below 70 (n=60) and therefore met the criteria for learning disability, and almost one in three (n=93) was assessed as having borderline learning disability (Table 1). The mean full-scale IQ of the sample was found to be 78.8 (s.d.=12.7, range 53–123), with a mean verbal score of 74.8 and mean performance score of 87.4. The mean reading age was 11.3 years (s.d.=3.3, range 6–17). This is significantly lower (P=0.015) than the mean chronological age (15.7 years).
Table 1 Characteristics of participants
| n (%) | ||
|---|---|---|
| Gender (n=301) | ||
| Male | 232 | (77) |
| Female | 69 | (23) |
| Ethnic origin (n=301) | ||
| White British | 250 | (83) |
| African—Caribbean | 26 | (9) |
| Asian | 7 | (2) |
| Mixed race | 15 | (5) |
| Other | 3 | (<1) |
| IQ (n=301) | ||
| <70 (extremely low) | 60 | (20) |
| 70-79 (borderline) | 93 | (31) |
| 80-119 (average) | 103 | (34) |
| ≥120 (superior) | 1 | (<1) |
| Missing | 44 | (15) |
| Placement for children under 16 years old (n=209) | ||
| None | 23 | (11) |
| Mainstream school | 32 | (15) |
| Custody | 112 | (54) |
| College | 12 | (6) |
| Community training | 11 | (5) |
| Pupil referral unit | 13 | (6) |
| Home tuition | 3 | (1) |
| Missing | 3 | (1) |
Those in custody had on average spent 3.9 months in custody (s.d.=3.6, range 0.03–18.0). With regard to previous sentences, 26% of young offenders had a previous custodial sentence, whereas 39% had a previous community order. The mean number of offences committed by these young people was 41.7 (s.d.=93.1, range 1–578); this included both convictions and non-convictions. A few offenders were responsible for the majority of the crimes committed (mean 42, median 9).
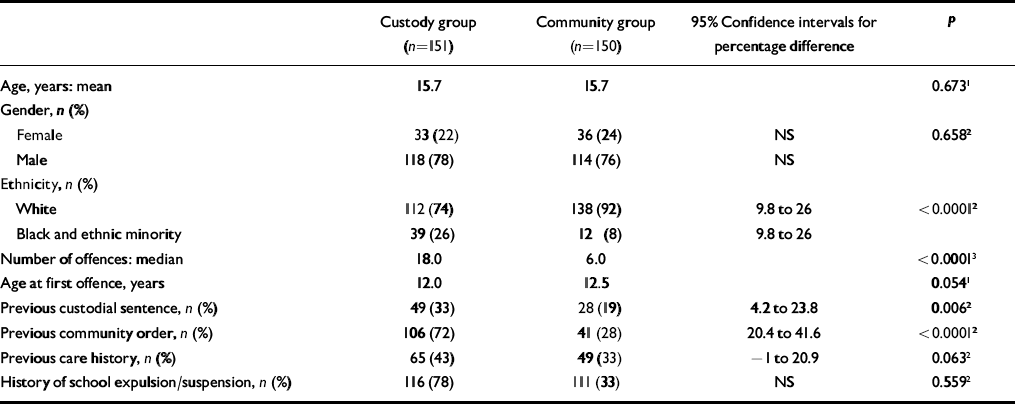
Table 2 explores the differences between the custody and community samples. Those in custody were significantly more likely to have a history of previous custodial sentences and community orders. There was also a significantly higher proportion of young offenders from Black and minority ethnic groups in custody. This finding has been documented previously (Home Office, 1992).
Table 2 Differences between custody and community groups
| Custody group (n=151) | Community group (n=150) | 95% Confidence intervals for percentage difference | P | |
|---|---|---|---|---|
| Age, years: mean | 15.7 | 15.7 | 0.6731 | |
| Gender, n (%) | ||||
| Female | 33 (22) | 36 (24) | NS | 0.6582 |
| Male | 118 (78) | 114 (76) | NS | |
| Ethnicity, n (%) | ||||
| White | 112 (74) | 138 (92) | 9.8 to 26 | < 0.00012 |
| Black and ethnic minority | 39 (26) | 12 (8) | 9.8 to 26 | |
| Number of offences: median | 18.0 | 6.0 | < 0.00013 | |
| Age at first offence, years | 12.0 | 12.5 | 0.0541 | |
| Previous custodial sentence, n (%) | 49 (33) | 28 (19) | 4.2 to 23.8 | 0.0062 |
| Previous community order, n (%) | 106 (72) | 41 (28) | 20.4 to 41.6 | < 0.00012 |
| Previous care history, n (%) | 65 (43) | 49 (33) | – 1 to 20.9 | 0.0632 |
| History of school expulsion/suspension, n (%) | 116 (78) | 111 (33) | NS | 0.5592 |
Needs
Figure 1 shows the percentage of young offenders in custody and the community with needs in five different domains: mental health (depression, anxiety, post-traumatic stress, psychosis, self-harm and hyperactivity); education (education attendance, educational performance and weekday occupation for young people aged over 16 years); risky behaviour (inappropriate sexual behaviour, drug and alcohol misuse); violent behaviour (violence to people and property); and relationships (relationships with peers and family members). Almost a third of young offenders had a mental health need (31%), whereas 29% had a need because of some form of risky behaviour. About one in three young people had educational or work needs (36%) or needs in relation to violence to people and property (35%). Significant needs with peer and family relationships were found in almost half of the study sample (48%).
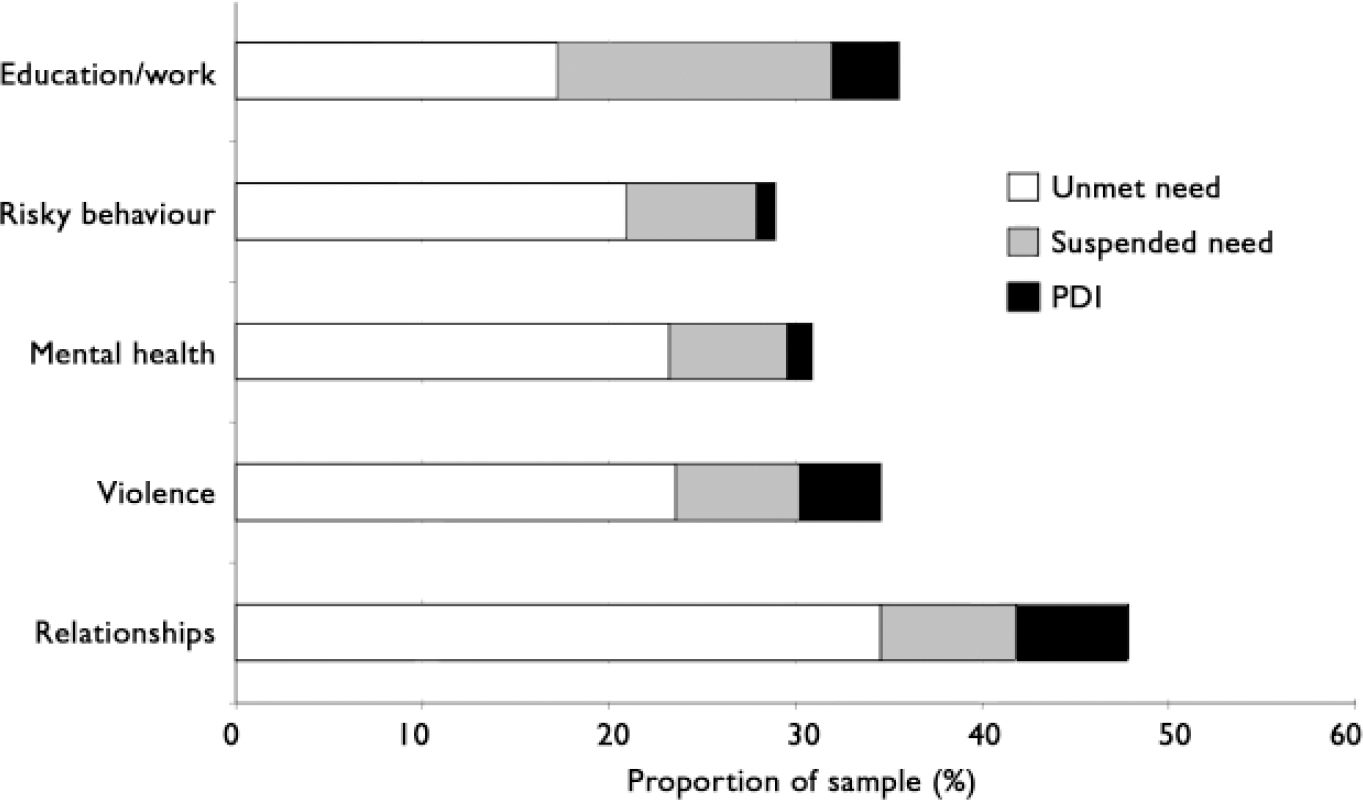
Fig. 1 Needs of juvenile offenders in different domains: unmet needs, suspended needs and persistent needs despite intervention (PDI).
Mental health
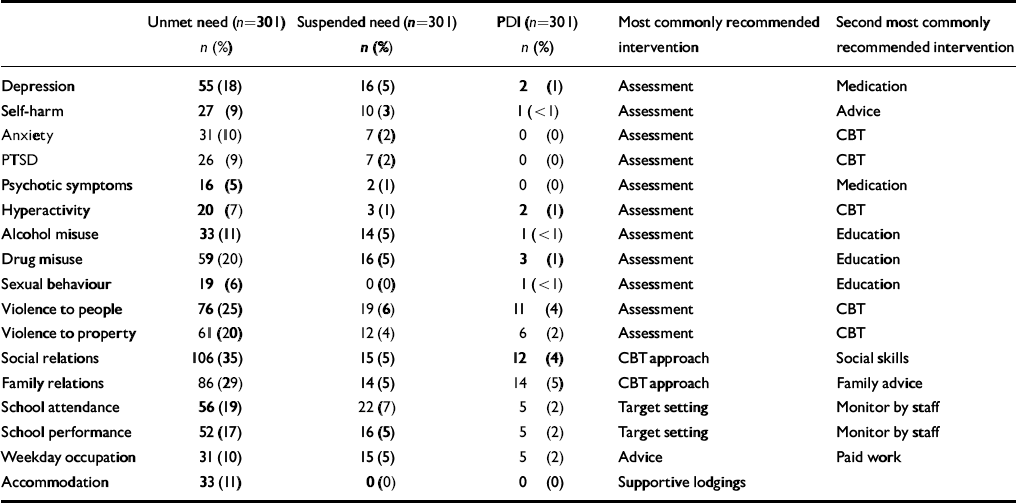
Table 3 shows the different types of needs (unmet, suspended or persistent despite intervention) of the sample. Within the mental health domain, almost one in five young people had significant depressive symptoms, and one in ten reported anxiety or post-traumatic stress symptoms. Self-harm within the past month was reported by almost one in ten young offenders.
Table 3 Needs and recommended interventions from the Salford Needs Assessment Schedule for Adolescents
| Unmet need (n=301) n (%) | Suspended need (n=301) n (%) | PDI (n=301) n (%) | Most commonly recommended intervention | Second most commonly recommended intervention | |
|---|---|---|---|---|---|
| Depression | 55 (18) | 16 (5) | 2 (1) | Assessment | Medication |
| Self-harm | 27 (9) | 10 (3) | 1 (<1) | Assessment | Advice |
| Anxiety | 31 (10) | 7 (2) | 0 (0) | Assessment | CBT |
| PTSD | 26 (9) | 7 (2) | 0 (0) | Assessment | CBT |
| Psychotic symptoms | 16 (5) | 2 (1) | 0 (0) | Assessment | Medication |
| Hyperactivity | 20 (7) | 3 (1) | 2 (1) | Assessment | CBT |
| Alcohol misuse | 33 (11) | 14 (5) | 1 (<1) | Assessment | Education |
| Drug misuse | 59 (20) | 16 (5) | 3 (1) | Assessment | Education |
| Sexual behaviour | 19 (6) | 0 (0) | 1 (<1) | Assessment | Education |
| Violence to people | 76 (25) | 19 (6) | 11 (4) | Assessment | CBT |
| Violence to property | 61 (20) | 12 (4) | 6 (2) | Assessment | CBT |
| Social relations | 106 (35) | 15 (5) | 12 (4) | CBT approach | Social skills |
| Family relations | 86 (29) | 14 (5) | 14 (5) | CBT approach | Family advice |
| School attendance | 56 (19) | 22 (7) | 5 (2) | Target setting | Monitor by staff |
| School performance | 52 (17) | 16 (5) | 5 (2) | Target setting | Monitor by staff |
| Weekday occupation | 31 (10) | 15 (5) | 5 (2) | Advice | Paid work |
| Accommodation | 33 (11) | 0 (0) | 0 (0) | Supportive lodgings |
Risky and violent behaviour
In terms of risky and violent behaviour, 11% of young offenders had alcohol problems and 20% had drug problems. Problems with aggressive behaviour towards people and property were found in about one in four and one in five young people respectively.
Education and relationships
Significant social difficulties were also found, with 29% of young offenders experiencing difficulties with family relationships and 35% with peers. Educational needs, with poor school attendance and performance difficulties, were found (for those under 16 years old) in 17% and 19% of young offenders respectively. Those over 16 years old fared only slightly better, with education or work needs found in one in ten young people interviewed.
Unmet need and recommended interventions
Table 3 shows the level of unmet need in individual domains of the SNASA. Few young people had had any type of intervention for their needs. Within some domains, such as inappropriate sexual behaviour, none of the young people identified with needs was receiving any form of intervention. Therefore rates of unmet need were very high. The intervention most commonly recommended from the SNASA was the need for assessment (penultimate column in Table 3). Assessment is the first intervention to offer for most needs areas. If completed, other interventions are then chosen from a menu of interventions by clinicians. The second most commonly recommended intervention (final column) was either an educational approach or cognitive–behavioural therapy.
Between-group differences
Gender
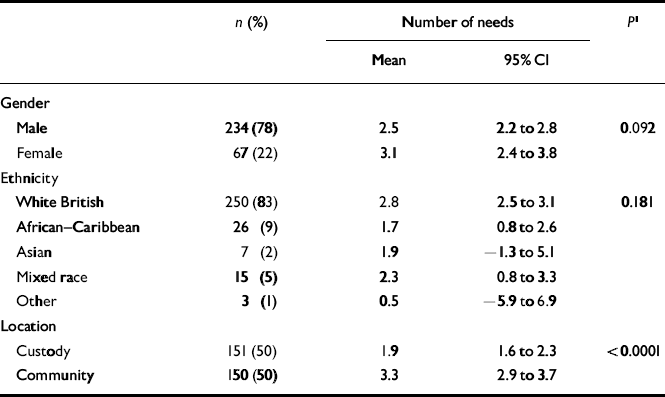
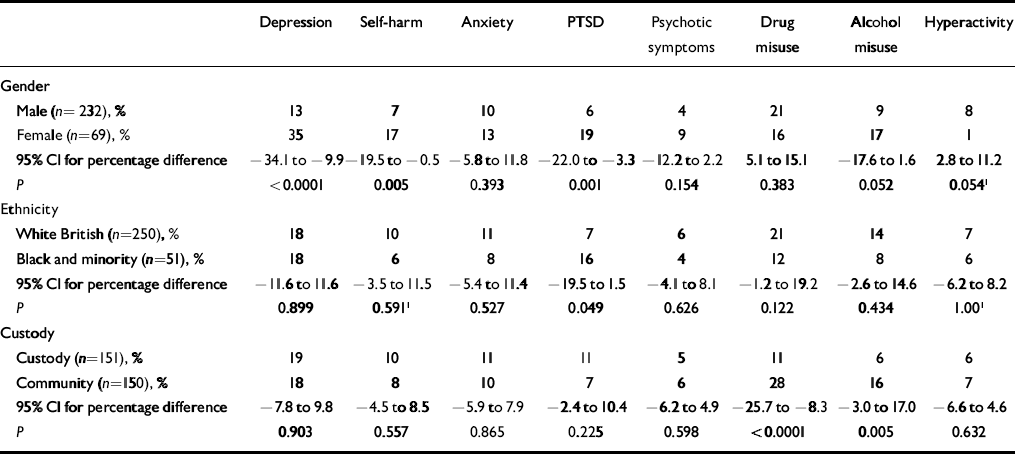
Table 4 shows that although female offenders had more needs than males, this was not significantly different. The only domain that showed a significant difference was mental health, in the areas of depression, self-harm and post-traumatic stress (see Table 6). Similar results have been found in other studies (Reference Timmons-Mitchell, Brown and SchulzTimmons-Mitchell et al, 1997).
Table 4 Correlates of total levels of need
| n (%) | Number of needs | P 1 | ||
|---|---|---|---|---|
| Mean | 95% CI | |||
| Gender | ||||
| Male | 234 (78) | 2.5 | 2.2 to 2.8 | 0.092 |
| Female | 67 (22) | 3.1 | 2.4 to 3.8 | |
| Ethnicity | ||||
| White British | 250 (83) | 2.8 | 2.5 to 3.1 | 0.181 |
| African—Caribbean | 26 (9) | 1.7 | 0.8 to 2.6 | |
| Asian | 7 (2) | 1.9 | -1.3 to 5.1 | |
| Mixed race | 15 (5) | 2.3 | 0.8 to 3.3 | |
| Other | 3 (1) | 0.5 | -5.9 to 6.9 | |
| Location | ||||
| Custody | 151 (50) | 1.9 | 1.6 to 2.3 | <0.0001 |
| Community | 150 (50) | 3.3 | 2.9 to 3.7 | |
Table 5 Correlates of needs in different domains

| Education | Risky behaviour | Violence | Relationships | Mental health | |
|---|---|---|---|---|---|
| Gender | |||||
| Male (n=232), % | 36 | 28 | 34 | 47 | 27 |
| Female (n=69), % | 33 | 30 | 36 | 48 | 44 |
| 95% CI for percentage difference | -9.7 to 15.7 | -14.3 to 10.3 | -14.9 to 10.9 | -14.4 to 12.4 | -4.0 to -30.0 |
| P 1 | 0.662 | 0.749 | 0.738 | 0.952 | 0.010 |
| Ethnicity | |||||
| White British (n=250), % | 38 | 32 | 36 | 50 | 32 |
| Ethnic minorities (n=51), % | 22 | 14 | 26 | 35 | 26 |
| 95% CI for percentage difference | 3.1 to 28.9 | 6.9 to 29.1 | -2.3 to 24.3 | 0.5 to 29.5 | -7.4 to 19.4 |
| P 1 | 0.022 | 0.0092 | 0.135 | 0.055 | 0.359 |
| Custody | |||||
| Custody (n=151), % | 23 | 17 | 30 | 35 | 31 |
| Community (n=150), % | 48 | 41 | 39 | 60 | 31 |
| 95% CI for percentage difference | -14.6 to -35.4 | -14.1 to -33.9 | -19.7 to 1.7 | -14.1 to -35.9 | -10.4 to 10.4 |
| P 1 | <0.0001 | <0.0001 | <0.082 | <0.0001 | 0.931 |
Table 6 Correlates of mental health needs
| Depression | Self-harm | Anxiety | PTSD | Psychotic symptoms | Drug misuse | Alcohol misuse | Hyperactivity | |
|---|---|---|---|---|---|---|---|---|
| Gender | ||||||||
| Male (n=232), % | 13 | 7 | 10 | 6 | 4 | 21 | 9 | 8 |
| Female (n=69), % | 35 | 17 | 13 | 19 | 9 | 16 | 17 | 1 |
| 95% CI for percentage difference | - 34.1 to - 9.9 | - 19.5 to - 0.5 | - 5.8 to 11.8 | - 22.0 to - 3.3 | - 12.2 to 2.2 | 5.1 to 15.1 | - 17.6 to 1.6 | 2.8 to 11.2 |
| P | < 0.0001 | 0.005 | 0.393 | 0.001 | 0.154 | 0.383 | 0.052 | 0.0541 |
| Ethnicity | ||||||||
| White British (n=250), % | 18 | 10 | 11 | 7 | 6 | 21 | 14 | 7 |
| Black and minority (n=51), % | 18 | 6 | 8 | 16 | 4 | 12 | 8 | 6 |
| 95% CI for percentage difference | - 11.6 to 11.6 | - 3.5 to 11.5 | - 5.4 to 11.4 | - 19.5 to 1.5 | - 4.1 to 8.1 | - 1.2 to 19.2 | - 2.6 to 14.6 | - 6.2 to 8.2 |
| P | 0.899 | 0.5911 | 0.527 | 0.049 | 0.626 | 0.122 | 0.434 | 1.001 |
| Custody | ||||||||
| Custody (n=151), % | 19 | 10 | 11 | 11 | 5 | 11 | 6 | 6 |
| Community (n=150), % | 18 | 8 | 10 | 7 | 6 | 28 | 16 | 7 |
| 95% CI for percentage difference | - 7.8 to 9.8 | - 4.5 to 8.5 | - 5.9 to 7.9 | - 2.4 to 10.4 | - 6.2 to 4.9 | - 25.7 to - 8.3 | - 3.0 to 17.0 | - 6.6 to 4.6 |
| P | 0.903 | 0.557 | 0.865 | 0.225 | 0.598 | < 0.0001 | 0.005 | 0.632 |
Ethnicity
White British juvenile offenders had more needs than those from Black and minority ethnic groups, although this was not significant (Table 4). Because of their small numbers, Black and minority ethnic groups were grouped for statistical analysis. There was a significant difference between the two groups in education needs, as White British young offenders had significantly more needs (Table 5). The reasons for this are unclear and may be related to differences in cultural attitudes and socio-economic characteristics. Significant differences were found in the level of risky behaviour between the two groups (Table 5). However, low numbers within the Black and minority ethnic group precluded further analysis. We also found that young offenders from Black and minority ethnic groups had significantly more post-traumatic stress symptoms than those who were White British (Table 6). This may be secondary to a higher number of refugees or asylum seekers from Black and minority ethnic groups. As the study did not collect this information, we are unable to verify this hypothesis.
Location
Young offenders in the community had significantly more needs than those in custody (see Table 4) in relation to education, risky behaviour and relationships (see Table 5). There was no significant difference between young offenders in custody and those in the community in terms of mental health. However, young offenders in the community were found to have significantly more alcohol and drug misuse needs than those in secure accommodation (see Table 6). This may be secondary to reduced access to these substances while young people are in custody.
DISCUSSION
There are a number of important findings from this study. The first is the high level of mental health, educational and social needs among this sample of young people. This is in keeping with findings from other studies that have highlighted the psychosocial adversity within this group (Reference Kroll, Rothwell and BradleyKroll et al, 2002; Reference Teplin, Abram and McCellandTeplin et al, 2002). However, educational needs were lower than reported by previous studies (Reference Kroll, Rothwell and BradleyKroll et al, 2002). Second, young offenders in the community had significantly more needs than those in custody in the areas of education, risky behaviour and social relationships. Secure accommodation may meet some of the needs of young people by providing statutory education, particularly for those under 16 years of age, and reducing access to alcohol and drugs. The intense supervision provided may also reduce opportunities for peer relationship difficulties. However, it is unclear how much of this reduction in needs is sustained once young people leave secure accommodation. We report elsewhere on a longitudinal follow-up study that explored how needs change for young offenders in custody over time (Youth Justice Board, 2005); it found that needs increased on discharge into the community in the areas of alcohol and drug misuse and social (peer and family) relationships. There was no change in mental health needs. This suggests that needs are only temporarily lower while young offenders are in custody and increase again on release. This finding is similar to that of a previous follow-up study (Reference Harrington, Kroll and RothwellHarrington et al, 2004).
Third, for many problem areas needs were unmet, with few offenders having any form of intervention for their problems. This included not only mental health areas but also education, social and aggressive needs. The most commonly recommended intervention across many areas of the SNASA was the need for assessment. Finally, high levels of learning disability were found in this study, as in previous studies (Reference Henry, Moffitt, Stoff, Breiling and MaserHenry & Moffitt, 1997; Reference Kroll, Rothwell and BradleyKroll et al, 2002). This has a number of implications for educational provision for these young people.
Limitations of the study
There are a number of limitations to this study which need to be considered. First, the SNASA includes both client and carer information in its final rating, although it can be used without carer information. In just under half of cases an informant (carer) was unavailable for interview. This may have resulted in lower needs ratings owing to an underreporting of symptoms by young people, particularly those relating to alcohol and drug use. In addition, 15% of young people in our sample declined to complete the psychometric assessment, often because of interview fatigue. Second, even though the study aimed to oversample Black and minority ethnic groups, numbers were too small for independent analysis and aggregation of groups was necessary. This may potentially mask differences between individual ethnic groups. Finally, as the sample was restricted to young people from England and Wales, our findings do not necessarily reflect the needs of young offenders in other countries.
CLINICAL IMPLICATIONS
The assessment of mental health and the promotion of mental well-being of young people within the youth justice system is integral to the delivery of effective youth justice services (Reference Callaghan, Pace and YoungCallaghan et al, 2003). Within the youth justice system, the mental health screening programme was launched in England and Wales in November 2003, at the end of this study. In practice the mental health screening programme has been launched within the youth offending teams, but not within secure facilities. However, lack of screening may not be the only reason for high levels of unmet need. Other problems, identified in interviews with carers, included poor access to services and difficulties engaging young people in treatment. The perception of those interviewed was that provision of mental health services across the country was variable and often influenced by local factors; reasons included lack of resources and funding as the primary obstacle to provision.
In terms of education, although there appeared to be good provision of educational services for young offenders in custody, services were less comprehensive for those in the community, especially for those under 16 years old for whom non-mainstream alternatives were limited. The introduction of agencies such as Connexions (http://www.connexions.gov.uk) has been a helpful resource for a number of young people wanting training and apprenticeships rather than mainstream education. With the high level of learning disabilities identified in this study and previous studies, there is a need to consider tailored educational provision based on individual needs and ability, particularly for those under 16 years of age. It is important to address these issues of service provision for young offenders with learning disabilities, as they may be a particularly vulnerable group.
This cross-sectional survey was part of a larger study examining service provision for young offenders within the youth justice system and continuity of care as young offenders moved from secure to community sites (Youth Justice Board, 2005). This study and previous studies (Reference Little, Bullock, Bailey and DolanLittle & Bullock, 2004) have highlighted concerns regarding the continuity of care for young people within the criminal justice system. This supports the recommendation to implement a care programme approach for children and young people with complex needs (Youth Justice Board, 2005).
In addition to their high levels of needs, young offenders place a significant financial burden on public services. However, the extent of the problem nationally to services is unknown. The second part of this study estimates the cost of young offenders to the criminal justice system and other services (health, social services and the voluntary sector) and also explores the relationship between needs, service use and cost (Reference Barrett, Byford and ChitsabesanBarrett et al, 2006).
Future research
Future research is needed to improve understanding of the needs of female offenders and those from different Black and minority ethnic populations. Conducting research in this area has been a challenge in view of the rapidly changing context of the criminal justice and national health systems (Department of Health, 2004). This pace of change does not appear to be slowing, with new initiatives constantly being developed. It is thus important for any future research in this area to continue to keep up to date with this rapidly changing environment and understand the context in which these changes are occurring.
Clinical Implications and Limitations
CLINICAL IMPLICATIONS
-
▪ Needs of young offenders are high but often unmet; a structured assessment programme across custody and community sites is recommended.
-
▪ A care programme approach is recommended to improve continuity of care for these young people with complex needs.
-
▪ Review of the educational provision for young offenders is required, as a significant number have learning disabilities.
LIMITATIONS
-
▪ Data from carer interviews and psychometric assessments were incomplete.
-
▪ Aggregation of data from different Black and minority ethnic groups might have missed differences between the groups.
-
▪ The sample may not have been representative, with oversampling of female offenders.
Acknowledgements
We thank the young people who gave up so much of their time to take part in this study. We also thank all the staff of the youth offending teams, secure establishments and providers of child and adolescent mental health services for their patience, support and interest in the research. Finally, a special tribute to Professor Richard Harrington, who died in May 2004, and was the driving force of this study. The legacy of his work, his enthusiasm and leadership continue to inspire us all. He is greatly missed.


eLetters
No eLetters have been published for this article.