Depression is a highly prevalent condition, as confirmed by many national (Reference Kessler, McGonagle and ZhaoKessler et al, 1994; Reference AngstAngst, 1997; Reference Lepine, Gastpar and MendlewiczLépine et al, 1997) and international studies (Reference Ustun and SartoriusUstun & Sartorius, 1995), with many possible outcomes. Predicting outcome at the time of diagnosis can have a strong clinical impact, since it can help to distinguish people in need of specific treatment from those likely to recover spontaneously. Nevertheless, studies of predictors of outcomes in depression show mixed results (Reference Bagby, Ryder and CristiBagby et al, 2002). Research challenges include the need to determine if any specific predictor is independent of other predictors, and to know whether predictors identified in the USA and Europe are also valid in other settings.
Some of these challenges could be clarified through a cross-cultural longitudinal study of depression. The Longitudinal Investigation of Depression Outcomes (LIDO) is a multicentre, cross-national observational study which followed patients with depressive disorders in primary care settings for 12 months in six countries (Reference Chisholm, Amir and FleckChisholm et al, 2001; Reference Herrman, Patrick and DiehrHerrman et al, 2002). The objective of our study was to use the LIDO data to identify baseline factors associated with 9-month clinical outcomes across six sites.
METHOD
The design, instruments and methodology of the LIDO study are described in detail elsewhere (Reference Chisholm, Amir and FleckChisholm et al, 2001; Reference Herrman, Patrick and DiehrHerrman et al, 2002). Briefly, patients presenting at primary care centres in six sites (Barcelona, Spain; Be'er Sheva, Israel; Melbourne, Australia; Porto Alegre, Brazil; Seattle, USA, and St Petersburg, Russia) were screened for symptoms of depression. Those meeting inclusion criteria – new and/or untreated episode and a score of over 16 on the Center for Epidemiological Studies – Depression scale (CES–D; Reference RadloffRadloff, 1977) – were interviewed and assessed with a standardised diagnostic instrument for major depression, the Composite International Diagnostic Interview (CIDI; Reference Robins, Wing and WittchenRobins et al, 1988).
Sample selection
For inclusion in the study participants had to be 18–75 years old, be a patient in a participating primary care setting and meet CIDI criteria for current major depression. They also had to be able and willing to participate in all scheduled visits and/or study-required contacts; provide adequate contact details to ensure follow-up; give written informed consent; read, understand and complete the self-administered surveys in the primary language at the site; and plan to be available for the 12 months of the study. They were not included if they:
-
(a) were currently receiving treatment for depression or had been treated for depression during the past 3 months;
-
(b) had a known major psychiatric disorder or psychoses;
-
(c) had a diagnosis of dementia, Alzheimer's disease or organic brain syndrome;
-
(d) had any other condition that in the opinion of the site investigator would interfere with the study objectives.
Selection of primary care settings by the investigators was pragmatic, and based primarily on good working relationships with the primary care physicians and clinic managers (Reference Herrman, Patrick and DiehrHerrman et al, 2002). Most differences in the baseline socio-demographic profile and service use patterns of the six sampled populations could be attributed to national differences between the study sites (Reference Chisholm, Amir and FleckChisholm et al, 2001).
Measures
Outcome of depression
Depression was assessed at the 9-month follow-up using the CIDI and the CES–D. Findings from these measures were used to assign the participants to one of two categories: ‘complete remission’ for patients who did not meet CIDI criteria for major depression and had a CES–D score of 16 or below; and ‘non-complete remission’ for patients who still met CIDI criteria for major depression, or who still had depressive symptoms (CES–D score >16) even though they no longer met the criteria for major depression.
Baseline predictor variables
The independent variables listed below were measured at the baseline visit.
Intensity of depression. The CES–D is a 20-item scale designed to measure symptoms of depression in community populations. In this study it is used as a continuous variable with potential score ranging from 0 to 60.
Demographic characteristics. Continuous variables were age and years of education; binary variables were gender (% of females), marital status (% married) and employment (% employed).
Comorbidity. The participants’ primary care physicians were asked to complete a ‘yes/no’ checklist to indicate whether the following 12 medical conditions were present: angina, arthritis, asthma and/or chronic bronchitis, cancer (past 3 years), chronically inflamed bowel, heart attack (myocardial infarction), heart failure, hypertension, diabetes, kidney disease, major paralysis and ulcer. Risk of alcoholism was assessed with the first three questions of the ten-item Alcohol Use Disorders Identification Test (AUDIT; Reference Babor, de la Fuente and SaundersBabor et al, 1989), a measure developed by the World Health Organization to identify levels of alcohol use; these ask about levels of alcohol consumption and have individualised five-point response options for each item. The criterion used for the presence of risk was a consumption level of more than 14 units per week for men or more than 10 units per week for women, or consumption of six or more drinks (bingeing) once a month or more. The presence of anxiety disorder was assessed using the seven-item phobia sub-scale and the ten-item anxiety sub-scale of the Symptom Checklist (SCL–90; Reference Derogatis, Rickels, Uhlenhuth and PichotDerogatis et al, 1974); each item is responded to on a five-point Likert scale, and a cut-off point of 1.7 was used to define probable anxiety disorder. The lifetime prevalence of dysthymia was evaluated with the CIDI. All the comorbidity variables were binary (% yes response).
Quality of life. Quality of life was assessed with the following measures:
-
(a) Quality of Life Depression Scale (QLDS; Reference Hunt and McKennaHunt & McKenna, 1992) (continuous). This is a 34-item quality of life measure specific to patients with depression. A simple ‘yes’ (true) or ‘no’ (false) scale is used. Scores range from 0 (good quality of life) to 34 (poor quality of life).
-
(b) World Health Organization Quality of Life Instrument – Abbreviated version (WHOQoL–Bref; WHOQoL Group, 1997) (continuous in each of the four domains). This is a 26-item measure taken from the larger WHOQoL–100, a multilingual assessment for generic quality of life, which was developed concurrently across 15 international field centres. The 26 items of the WHOQoL–Bref distribute into four domains (physical, psychological, social relationships and environment) and are answered using individualised five-point scales. Each sub-scale is scored positively and then normalised for comparability with the WHOQoL–100.
Functional status. The Medical Outcomes Study 12-item Short Form Health Survey (SF-12; Reference Ware, Kosinski and KellerWare et al, 1996) (continuous in each of the two domains) is a multipurpose generic measure of health status used in clinical practice and research in general population surveys. It measures eight concepts commonly represented in widely used surveys: physical functioning, role limitations due to physical health problems, bodily pain, general health, vitality (energy/fatigue), social functioning, role limitations due to emotional problems, and mental health. The scoring generates both a physical component and a mental component summary score.
Other measures. Number of work days lost in the past 3 months and previous episodes of depression before entering the study were included as continuous variables.
Life events between baseline and follow-up
The occurrence of any of 10 key life events (severe illness; assault; severe illness, injury or assault of a close friend or relative; death of a parent; death of a son, daughter or partner; serious problem in a close relationship, separation or divorce; job loss; other severe economic problems; problem with the law/police; change of residence) during the 9 months between the baseline and follow-up assessment was recorded (binary).
Analysis
All statistical analyses were conducted using the Statistical Package for the Social Sciences (SPSS) for Windows 10.1 (SPSS Inc., Chicago, Illinois, USA). All predictors were used in the univariate analysis, and a subset was also entered for the multivariate models as explained below. Means for each baseline predictive factor were compared through one-way analysis of variance (ANOVA) for the two outcomes (complete remission and non-complete remission). Predictors of complete remission were examined using logistic regression models initially including data from all sites (pooled), with the study centre included as a covariate in all models to ensure that any other observed effects were not simply due to the confounding effect of the centre.
The criteria for selecting predictors were primarily derived from previous research, current associations with depression outcome, and congruency with a conceptual model for predictors. The following predictors were selected and grouped into ‘families’:
-
(a) socio-demographic data, including age, gender, marital status, education and employment;
-
(b) severity/chronicity of depressive disorder at baseline, including CES–D score, presence of dysthymia and number of previous episodes;
-
(c) comorbidity including anxiety disorder, alcohol use and medical conditions;
-
(d) functional status and health-related quality of life, including QLDS, WHOQoL and SF–12 scores and number of disability days;
-
(e) key life events
These ‘families’ were subjected to regression analyses in the order listed, with the demographic factors remaining in each model.
As successive models were tested, predictors were either discarded or kept in the overall model if they made a significant contribution. For instance, if predictors in family (b) did not contribute to prediction, none of the variables would be retained and we would evaluate family (c); however, if family (b) did contribute, we would select the best predictor and keep it in the model before moving on with family (c). For family (c) we chose to keep any predictor that contributed significantly, but for family (d) we kept only the best predictor, to avoid issues of co-linearity.
Once the final model was agreed, tests were conducted to assess whether any effects observed in the entire sample were consistent across the study centres. If predictors were found to be not consistent in different primary care settings, the observed variability might be due to chance. In such cases, predictor×centre variables were computed and evaluated for each predictor separately to test whether there was a significant variability in effect across centres. It was our hypothesis that these interactions would not be statistically significant; this would not mean that predictors did not vary, but that the observed variability could just be due to chance.
RESULTS
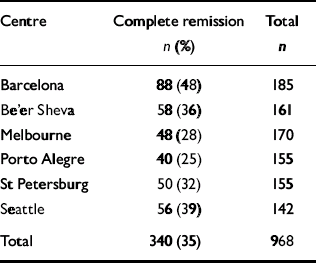
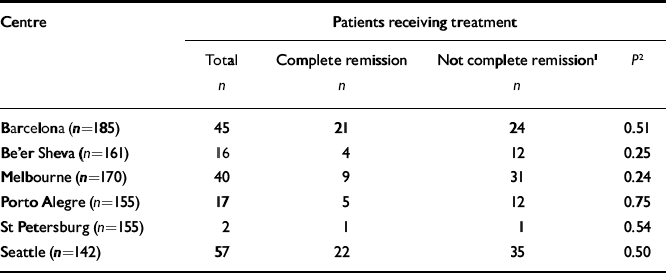
A total of 968 primary care patients across all sites were diagnosed as having major depression at baseline. Sample sizes ranged from 142 in Seattle to 185 in Barcelona. At the 9-month follow-up assessment the proportion of those in complete remission ranged from 25% in Porto Alegre to 48% in Barcelona (Table 1); the withdrawal rate was 15.4%. The likelihood of receiving potentially effective antidepressant or mental health treatment at 3 months or 9 months did not differ across the six sites between the patients who were in complete remission and those who were not (Table 2).
Table 1 Participants in complete remission at 9 months
| Centre | Complete remission n (%) | Total n |
|---|---|---|
| Barcelona | 88 (48) | 185 |
| Be'er Sheva | 58 (36) | 161 |
| Melbourne | 48 (28) | 170 |
| Porto Alegre | 40 (25) | 155 |
| St Petersburg | 50 (32) | 155 |
| Seattle | 56 (39) | 142 |
| Total | 340 (35) | 968 |
Table 2 Patients receiving potentially effective antidepressant or mental health treatment at 3 months or 9 months
| Centre | Patients receiving treatment | |||
|---|---|---|---|---|
| Total n | Complete remission n | Not complete remission1 n | P 2 | |
| Barcelona (n=185) | 45 | 21 | 24 | 0.51 |
| Be'er Sheva (n=161) | 16 | 4 | 12 | 0.25 |
| Melbourne (n=170) | 40 | 9 | 31 | 0.24 |
| Porto Alegre (n=155) | 17 | 5 | 12 | 0.75 |
| St Petersburg (n=155) | 2 | 1 | 1 | 0.54 |
| Seattle (n=142) | 57 | 22 | 35 | 0.50 |
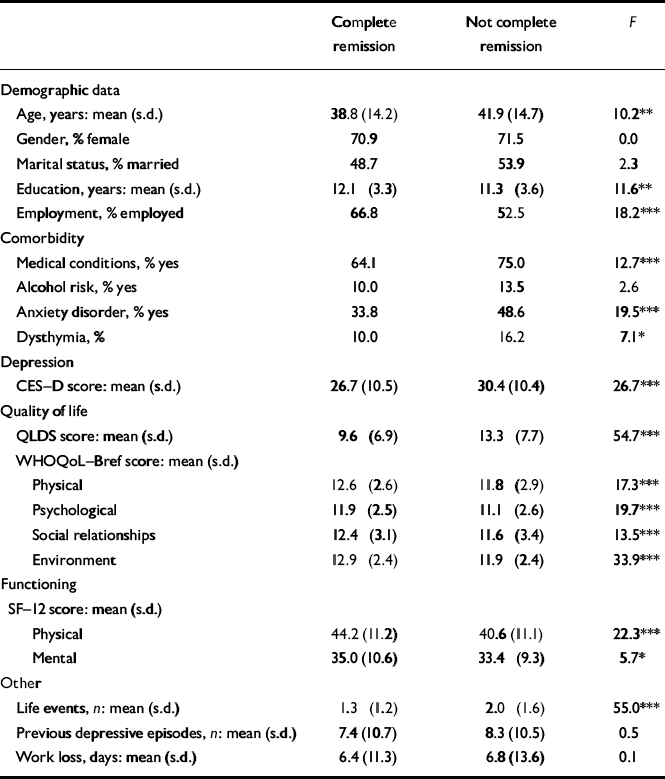
The comparison of scores at baseline for the complete remission and non-complete remission groups using univariate analysis is shown in Table 3. For all variables with a significant difference, the complete remission group did better at baseline. Comparison of socio-demographic data for the two groups showed that people in complete remission were younger, had more years of schooling and were more often employed at baseline. There was no difference in gender and marital status between the two groups. Comorbidity data show that those in complete remission had fewer medical conditions, dysthymia and anxiety disorders. No difference was found for alcohol risk. This group also had less intensity of depression as measured by the CES–D and better quality of life and functioning as measured by the QLDS, WHOQoL and SF–12 at baseline, as well as fewer previous episodes of depression. There was no difference in number of work days lost.
Table 3 Baseline scores for participants in complete remission and those not in complete remission at the 9-month follow-up (n=968)
| Complete remission | Not complete remission | F | |
|---|---|---|---|
| Demographic data | |||
| Age, years: mean (s.d.) | 38.8 (14.2) | 41.9 (14.7) | 10.2** |
| Gender, % female | 70.9 | 71.5 | 0.0 |
| Marital status, % married | 48.7 | 53.9 | 2.3 |
| Education, years: mean (s.d.) | 12.1 (3.3) | 11.3 (3.6) | 11.6** |
| Employment, % employed | 66.8 | 52.5 | 18.2*** |
| Comorbidity | |||
| Medical conditions, % yes | 64.1 | 75.0 | 12.7*** |
| Alcohol risk, % yes | 10.0 | 13.5 | 2.6 |
| Anxiety disorder, % yes | 33.8 | 48.6 | 19.5*** |
| Dysthymia, % | 10.0 | 16.2 | 7.1* |
| Depression | |||
| CES-D score: mean (s.d.) | 26.7 (10.5) | 30.4 (10.4) | 26.7*** |
| Quality of life | |||
| QLDS score: mean (s.d.) | 9.6 (6.9) | 13.3 (7.7) | 54.7*** |
| WHOQoL-Bref score: mean (s.d.) | |||
| Physical | 12.6 (2.6) | 11.8 (2.9) | 17.3*** |
| Psychological | 11.9 (2.5) | 11.1 (2.6) | 19.7*** |
| Social relationships | 12.4 (3.1) | 11.6 (3.4) | 13.5*** |
| Environment | 12.9 (2.4) | 11.9 (2.4) | 33.9*** |
| Functioning | |||
| SF-12 score: mean (s.d.) | |||
| Physical | 44.2 (11.2) | 40.6 (11.1) | 22.3*** |
| Mental | 35.0 (10.6) | 33.4 (9.3) | 5.7* |
| Other | |||
| Life events, n: mean (s.d.) | 1.3 (1.2) | 2.0 (1.6) | 55.0*** |
| Previous depressive episodes, n: mean (s.d.) | 7.4 (10.7) | 8.3 (10.5) | 0.5 |
| Work loss, days: mean (s.d.) | 6.4 (11.3) | 6.8 (13.6) | 0.1 |
Univariate analysis was performed for each country separately (data not shown). The results showed the same tendency as in the pooled sample, although statistical significance was not obtained for all predictors in all sites, probably because of sample size limitations. Two predictors not significant for the pooled sample were identified for individual centres: low alcohol risk was a baseline significant predictor of complete remission in Be'er Sheva and St Petersburg, and a lower percentage of females was associated with complete remission in St Petersburg.
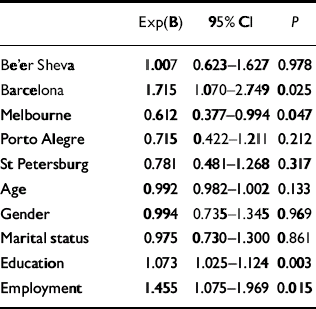
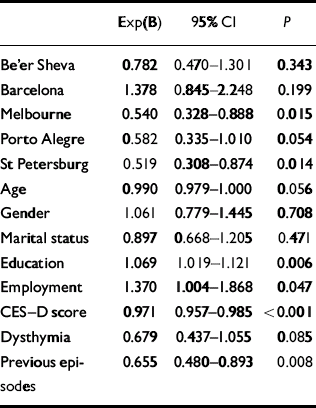
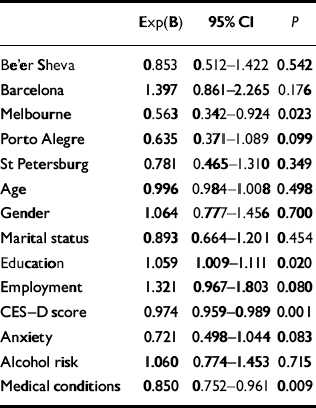
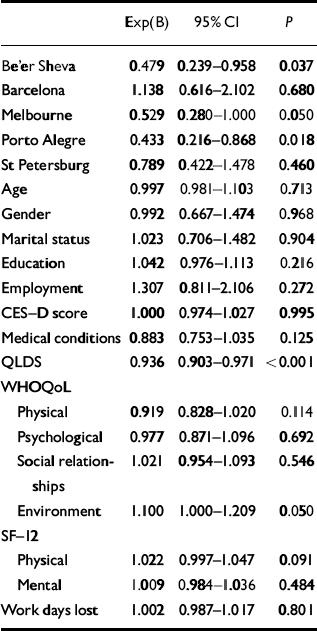
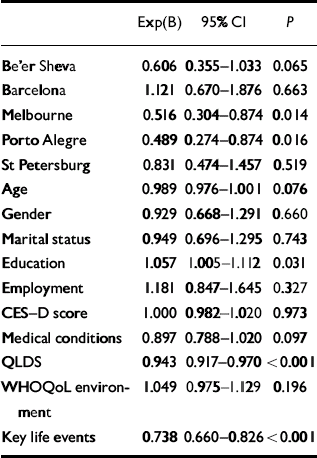
Multivariate analyses (logistic regression) were used to evaluate the relative weight of each predictor, using centres as a covariate in all models in the pooled sample (n=968). In the first step, socio-demographic data were entered adjusted for centres (Table 4); education and employment were the significant predictors. In step 2 (depression severity), education and employment continued to be significant predictors and CES–D score and number of previous depressive episodes were also significant predictors after adjusting for socio-demographic data (Table 5). In step 3, comorbidity variables were entered adjusted for CES–D and socio-demographic data: education and CES–D score remained significant and medical comorbidity was a significant predictor, adjusted for socio-demographic data and severity of depression (Table 6). In step 4 (quality of life), QLDS and the environment domain of WHOQoL–Bref were the significant predictors, adjusted for socio-demographic data, severity of depression and comorbidity (Table 7). In this analysis CES–D score and education were no longer significant, probably because of the high degree of co-linearity between quality of life measures, severity of depression and education. Finally, in step 5, when key life events were entered in the model adjusted for the preceding families of variables (socio-demographic data, severity of depression and comorbidity), education, QLDS and key life events were the significant predictors (Table 8). All significant predictors were modest in effect, since the odds ratios were close to 1.
Table 4 Step 1: logistic regression using centres and socio-demographic data as covariates
| Exp(B) | 95% CI | P | |
|---|---|---|---|
| Be'er Sheva | 1.007 | 0.623-1.627 | 0.978 |
| Barcelona | 1.715 | 1.070-2.749 | 0.025 |
| Melbourne | 0.612 | 0.377-0.994 | 0.047 |
| Porto Alegre | 0.715 | 0.422-1.211 | 0.212 |
| St Petersburg | 0.781 | 0.481-1.268 | 0.317 |
| Age | 0.992 | 0.982-1.002 | 0.133 |
| Gender | 0.994 | 0.735-1.345 | 0.969 |
| Marital status | 0.975 | 0.730-1.300 | 0.861 |
| Education | 1.073 | 1.025-1.124 | 0.003 |
| Employment | 1.455 | 1.075-1.969 | 0.015 |
Table 5 Step 2: logistic regression using centres, demographic data and depression as covariates
| Exp(B) | 95% CI | P | |
|---|---|---|---|
| Be'er Sheva | 0.782 | 0.470-1.301 | 0.343 |
| Barcelona | 1.378 | 0.845-2.248 | 0.199 |
| Melbourne | 0.540 | 0.328-0.888 | 0.015 |
| Porto Alegre | 0.582 | 0.335-1.010 | 0.054 |
| St Petersburg | 0.519 | 0.308-0.874 | 0.014 |
| Age | 0.990 | 0.979-1.000 | 0.056 |
| Gender | 1.061 | 0.779-1.445 | 0.708 |
| Marital status | 0.897 | 0.668-1.205 | 0.471 |
| Education | 1.069 | 1.019-1.121 | 0.006 |
| Employment | 1.370 | 1.004-1.868 | 0.047 |
| CES-D score | 0.971 | 0.957-0.985 | <0.001 |
| Dysthymia | 0.679 | 0.437-1.055 | 0.085 |
| Previous episodes | 0.655 | 0.480-0.893 | 0.008 |
Table 6 Step 3: logistic regression using centres, demographic data, depression and comorbidity as covariates
| Exp(B) | 95% CI | P | |
|---|---|---|---|
| Be'er Sheva | 0.853 | 0.512-1.422 | 0.542 |
| Barcelona | 1.397 | 0.861-2.265 | 0.176 |
| Melbourne | 0.563 | 0.342-0.924 | 0.023 |
| Porto Alegre | 0.635 | 0.371-1.089 | 0.099 |
| St Petersburg | 0.781 | 0.465-1.310 | 0.349 |
| Age | 0.996 | 0.984-1.008 | 0.498 |
| Gender | 1.064 | 0.777-1.456 | 0.700 |
| Marital status | 0.893 | 0.664-1.201 | 0.454 |
| Education | 1.059 | 1.009-1.111 | 0.020 |
| Employment | 1.321 | 0.967-1.803 | 0.080 |
| CES-D score | 0.974 | 0.959-0.989 | 0.001 |
| Anxiety | 0.721 | 0.498-1.044 | 0.083 |
| Alcohol risk | 1.060 | 0.774-1.453 | 0.715 |
| Medical conditions | 0.850 | 0.752-0.961 | 0.009 |
Table 7 Step 4: logistic regression using centres, demographic data, depression, comorbidity and quality of life as covariates
| Exp(B) | 95% CI | P | |
|---|---|---|---|
| Be'er Sheva | 0.479 | 0.239-0.958 | 0.037 |
| Barcelona | 1.138 | 0.616-2.102 | 0.680 |
| Melbourne | 0.529 | 0.280-1.000 | 0.050 |
| Porto Alegre | 0.433 | 0.216-0.868 | 0.018 |
| St Petersburg | 0.789 | 0.422-1.478 | 0.460 |
| Age | 0.997 | 0.981-1.103 | 0.713 |
| Gender | 0.992 | 0.667-1.474 | 0.968 |
| Marital status | 1.023 | 0.706-1.482 | 0.904 |
| Education | 1.042 | 0.976-1.113 | 0.216 |
| Employment | 1.307 | 0.811-2.106 | 0.272 |
| CES-D score | 1.000 | 0.974-1.027 | 0.995 |
| Medical conditions | 0.883 | 0.753-1.035 | 0.125 |
| QLDS | 0.936 | 0.903-0.971 | <0.001 |
| WHOQoL | |||
| Physical | 0.919 | 0.828-1.020 | 0.114 |
| Psychological | 0.977 | 0.871-1.096 | 0.692 |
| Social relationships | 1.021 | 0.954-1.093 | 0.546 |
| Environment | 1.100 | 1.000-1.209 | 0.050 |
| SF-12 | |||
| Physical | 1.022 | 0.997-1.047 | 0.091 |
| Mental | 1.009 | 0.984-1.036 | 0.484 |
| Work days lost | 1.002 | 0.987-1.017 | 0.801 |
Table 8 Step 5: logistic regression using centres, demographic data, depression, comorbidity, quality of life and key life events as covariates
| Exp(B) | 95% CI | P | |
|---|---|---|---|
| Be'er Sheva | 0.606 | 0.355-1.033 | 0.065 |
| Barcelona | 1.121 | 0.670-1.876 | 0.663 |
| Melbourne | 0.516 | 0.304-0.874 | 0.014 |
| Porto Alegre | 0.489 | 0.274-0.874 | 0.016 |
| St Petersburg | 0.831 | 0.474-1.457 | 0.519 |
| Age | 0.989 | 0.976-1.001 | 0.076 |
| Gender | 0.929 | 0.668-1.291 | 0.660 |
| Marital status | 0.949 | 0.696-1.295 | 0.743 |
| Education | 1.057 | 1.005-1.112 | 0.031 |
| Employment | 1.181 | 0.847-1.645 | 0.327 |
| CES-D score | 1.000 | 0.982-1.020 | 0.973 |
| Medical conditions | 0.897 | 0.788-1.020 | 0.097 |
| QLDS | 0.943 | 0.917-0.970 | <0.001 |
| WHOQoL environment | 1.049 | 0.975-1.129 | 0.196 |
| Key life events | 0.738 | 0.660-0.826 | <0.001 |
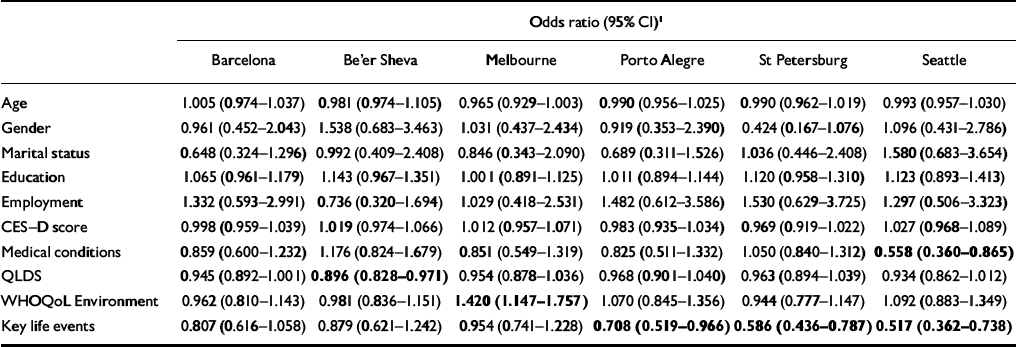
When logistic regression was run for individual sites using selected predictors (Table 9), complete remission was predicted by key life events in three sites (St Petersburg, Porto Alegre and Seattle), medical conditions in Seattle, QLDS in Be'er Sheva and WHOQoL–Bref environment domain in Melbourne. No variable appeared as a consistent predictor across all sites. However, sample sizes at individual centres were modest. A logistic regression model for all sites including site×predictor interactions found that variation in predictors across sites was not statistically significant (data not shown).
Table 9 Odds ratios from logistic regression using selected predictors for 9-month complete remission by centre
| Odds ratio (95% CI)1 | ||||||
|---|---|---|---|---|---|---|
| Barcelona | Be'er Sheva | Melbourne | Porto Alegre | St Petersburg | Seattle | |
| Age | 1.005 (0.974-1.037) | 0.981 (0.974-1.105) | 0.965 (0.929-1.003) | 0.990 (0.956-1.025) | 0.990 (0.962-1.019) | 0.993 (0.957-1.030) |
| Gender | 0.961 (0.452-2.043) | 1.538 (0.683-3.463) | 1.031 (0.437-2.434) | 0.919 (0.353-2.390) | 0.424 (0.167-1.076) | 1.096 (0.431-2.786) |
| Marital status | 0.648 (0.324-1.296) | 0.992 (0.409-2.408) | 0.846 (0.343-2.090) | 0.689 (0.311-1.526) | 1.036 (0.446-2.408) | 1.580 (0.683-3.654) |
| Education | 1.065 (0.961-1.179) | 1.143 (0.967-1.351) | 1.001 (0.891-1.125) | 1.011 (0.894-1.144) | 1.120 (0.958-1.310) | 1.123 (0.893-1.413) |
| Employment | 1.332 (0.593-2.991) | 0.736 (0.320-1.694) | 1.029 (0.418-2.531) | 1.482 (0.612-3.586) | 1.530 (0.629-3.725) | 1.297 (0.506-3.323) |
| CES-D score | 0.998 (0.959-1.039) | 1.019 (0.974-1.066) | 1.012 (0.957-1.071) | 0.983 (0.935-1.034) | 0.969 (0.919-1.022) | 1.027 (0.968-1.089) |
| Medical conditions | 0.859 (0.600-1.232) | 1.176 (0.824-1.679) | 0.851 (0.549-1.319) | 0.825 (0.511-1.332) | 1.050 (0.840-1.312) | 0.558 (0.360-0.865) |
| QLDS | 0.945 (0.892-1.001) | 0.896 (0.828-0.971) | 0.954 (0.878-1.036) | 0.968 (0.901-1.040) | 0.963 (0.894-1.039) | 0.934 (0.862-1.012) |
| WHOQoL Environment | 0.962 (0.810-1.143) | 0.981 (0.836-1.151) | 1.420 (1.147-1.757) | 1.070 (0.845-1.356) | 0.944 (0.777-1.147) | 1.092 (0.883-1.349) |
| Key life events | 0.807 (0.616-1.058) | 0.879 (0.621-1.242) | 0.954 (0.741-1.228) | 0.708 (0.519-0.966) | 0.586 (0.436-0.787) | 0.517 (0.362-0.738) |
DISCUSSION
There are few studies focused on factors associated with depression outcomes in primary care, and most of them have been conducted in North America and Europe. The data provided by the LIDO study have important implications since this is one of the few studies with longitudinal data in a cross-national perspective.
Our first major finding is the low proportion of complete remission among participants at the 9-month follow-up at most of the study sites. Since major depression (and even sub-syndromal depression) is highly associated with present disability (Reference Wells, Steward and HaysWells et al, 1989) and future relapse or recurrence (Reference Keller, Lavori and RiceKeller et al, 1986), the low prevalence of complete remission at follow-up in this cross-cultural naturalistic study (from 25% in Porto Alegre to 48% in Barcelona) is an important finding. Mynor-Wallis et al (Reference Mynor-Wallis, Gath and Baker2000) in the UK found higher proportions (56–66%) of complete remission at 1-year follow-up in a non-naturalistic study in a primary care setting. Simon (2000) found 45% remission from a 6-month follow-up period in a naturalistic primary care study in the USA, which was closer to the highest proportion found in the present study. Differences between studies in overall remission rates may, of course, reflect differences in screening, selection procedures or levels of treatment. In any case, major depression is not a benign condition for the majority of primary care patients.
The second important finding of our study is that some baseline characteristics emerged as modest predictors of outcome, using pooled data from the six study sites. Education, key life events and QLDS were the final predictors after adjusting for centres, socio-demographic data, severity of depression, comorbidity, general quality of life and key life events. Scores on CES–D and WHOQoL–Bref environment domain could also be considered as potential predictors since possible co-linearity with QLDS and education, respectively, could explain why these variables left the model in the final step. These findings were consistent with previous studies in which none of the reviewed variables was a particularly powerful or consistent predictor of remission in depression (Reference Bagby, Ryder and CristiBagby et al, 2002). Our study has supported this conclusion using a cross-cultural sample, suggesting that this conclusion could be applied for primary care patients of heterogeneous countries.
In reality we do not know what the relationship is between predictors and outcome in depression: are they actually moderators (or conditions which are necessary for the outcome to occur) or mediators (conditions closer to a causal model)? Multivariate analysis does not answer this important point. Two possible attitudes toward multivariate analysis could be assumed: the first is to throw in all the possible predictors to see what happens; the second is to construct theoretical models despite the lack of evidence but at least with a rationale to guide the analysis (Reference Victora, Huttly and FuchsVictora et al, 1997). We used the second option, with a hierarchical model entering variables in ‘families’ in a series of steps. For example, we found – interestingly – that quality of life rather than intensity of depression remained in the final step after adjusting for all variables. Some authors have suggested that quality of life and depression are in fact different facets of the same construct, or ‘tautological measures’ (Reference Katschnig and AngermeyerKatschnig & Angermeyer, 1997). As far as we know this is the first time that quality of life has emerged as a possible predictor of depression outcome. Although this might be seen as a statistical artefact (due to co-linearity), it could be regarded as a stimulus for the development of more complex models to elucidate the relationship between depression and quality of life.
There are some limitations to our study. Sites were selected on the basis of their research capacity and importance in terms of the primary care system of the city they were part of. Moreover, the screening involved a convenience sample of clinic attenders at each site. The sampling was relatively systematic; however, this was not a representative study of primary care attenders at the sites or in the six countries, nor was it a representative population study. Consequently, it is not possible to state that the sample is representative of the primary care population of each site. Rather, the LIDO study was designed to screen for and recruit patients with depression in primary care in six clinical and cultural settings as different from one another as possible, reflecting the heterogeneity of the countries involved in this project.
At least three possible hypotheses could be put forward to explain why we found only modest predictors of complete remission across a pooled sample from different sites. First, the design or measures used in the LIDO study might not have been adequate to identify more robust predictors. Although we cannot exclude this possibility, we can point to several important strengths: a systematically identified cohort, use of instruments well tested in cross-national research and a low rate of attrition. One area of potential difficulty with this conclusion is found in the heterogeneity of the study sites involved. Chisholm et al (Reference Chisholm, Amir and Fleck2001), comparing the assessment of local health systems and resource utilisation across the six LIDO study sites, concluded that:
‘a basic, though unsurprising, finding apparent from comparison of these profiles is the wide diversity observed between sites with respect to key health service indicators, not only in terms of overall expenditures and service inputs...but also in terms of the underlying model of health care finance and provision.’
Although this is an important limitation of the study, it also reflects the primary care setting from which the study population was drawn. The heterogeneity of the sites could explain why only modest predictors could be identified. The strategy we adopted to control this important confounding effect was to use logistic regression adjusted for centres. A second hypothesis to explain the lack of consistent predictors for complete remission across sites is that depression is really not predictable. It is impossible either to confirm or refute this hypothesis with the empirical data found in the LIDO study, since it involves the interpretation of conceptual issues. The concept of major depression has been criticised by many authors and researchers. For example, Van Praag considers that mood disorders as defined by the DSM system are not properly validated and are utterly heterogeneous and overlapping; this author states, ‘The assumption that such presumably pseudo-entities will be carried by single well-definable pathophysiology is implausible’ (Reference Van PraagVan Praag, 1993). As a result, one should consider that it would also be implausible to find consistent predictors across sites if we are dealing with a heterogeneous entity. Finally, a third possible explanation is that the course of depression is somewhat predictable, but that the predictors themselves vary or are other than those under investigation.
APPENDIX
The Longitudinal Investigation of Depression Outcomes study
The Longitudinal Investigation of Depression Outcomes (LIDO) study is a cross-national observational study of major depression and its correlates, conducted in six field study centres involved in the development of the World Health Organization Quality of Life Instrument (WHOQoL) (in Australia, Brazil, Israel, Spain, the USA and the Russian Federation). Development and conduct of the study was a collaborative effort between the research team, a panel of study advisers and the site investigators in each of the six centres. Eli Lilly and Company provided the overall project sponsorship and Health Research Associates, Inc. served as the international coordinating agency for the study. The LIDO Group comprises the following members:
Research team
Donald Patrick, University of Washington, Seattle, Washington, USA; Don Buesching, Carol Andrejasich, Michael Treglia, Eli Lilly and Company, Indianapolis, Indiana, USA; Mona Martin, Don Bushnell, Health Research Associates, Inc., Seattle, Washington, USA; Diane Jones-Palm, Health Research Associates, European Office, Frankfurt, Germany; Stephen McKenna, Galen Research, Manchester, UK; John Orley, Rex Billington, World Health Organization, Mental Health Division, Geneva, Switzerland.
Study advisers
Greg Simon, Group Health Cooperative of Puget Sound, Seattle, Washington, USA; Daniel Chisholm, Martin Knapp, Institute of Psychiatry, London, UK; Diane Whalley, Galen Research, Manchester, UK; Paula Diehr, University of Washington, Seattle, Washington, USA.
Site investigators
Helen Herrman, University of Melbourne, Australia; Marcelo Fleck, Federal University of the State of Rio Grande do Sul, Brazil; Marianne Amir, Ben-Gurion University of the Negev, Be'er Sheva, Israel; Ramona Lucas, Barcelona, Spain; Aleksandr Lomachenkov, V.M. Bekhterev Psychoneurological Research Institute, St Petersburg, Russia; Donald Patrick, University of Washington, Seattle, Washington, USA.
Clinical Implications and Limitations
CLINICAL IMPLICATIONS
-
▪ Level of education, quality of life and key life events are modest predictors of depression outcome.
-
▪ Only a small proportion of people achieve complete remission from depression over a time scale of months.
-
▪ Depression may be a heterogeneous disorder with outcomes that are difficult to predict with accuracy.
LIMITATIONS
-
▪ Participants were drawn from a convenience sample of clinic attenders.
-
▪ The LIDO study sites were selected to provide a wide diversity of clinical and cultural settings.
-
▪ Predictors of depression might be other than those investigated.
Acknowledgements
The authors thank Dr Mário Wagner, for his contributions in. statistical planning.


eLetters
No eLetters have been published for this article.