Depression, with or without anxiety, is the most prevalent form of mental disorder in primary care (Reference Goldberg, Lecrubier, Üstün and SartoriusGoldberg & Lecrubier, 1995) but it is often unrecognised by general practitioners (GPs). Most studies report detection rates between 30 and 40% (range 7-70%: Reference DochertyDocherty, 1997). Higher rates have been reported in women, the middle aged, the unemployed, those with more severe disorders or comorbid anxiety, while physical symptoms impede recognition (Reference Marks, Goldberg and HillierMarks et al, 1979; Reference Bridges and GoldbergBridges & Goldberg, 1985; Reference BoardmanBoardman, 1987; Reference Von Korff, Shapiro and BurkeVon Korff et al, 1987; Reference Ormel, Van Den Brink and KoeterOrmel et al, 1990; Reference Kirmayer, Robbins and DworkindKirmayer et al, 1993; Reference Coyne, Schwenk and Fechner-BatesCoyne et al, 1995; Reference DowrickDowrick, 1995; Reference Simon and Von KorffSimon & von Korff, 1995; Reference Sartorius, Ustun and LecrubierSartorius et al, 1996; Reference Tiemens, Ormel and SimonTiemens et al, 1996; Reference Odell, Surtees and WainwrightOdell et al, 1997; Reference Ronalds, Creed and StoneRonalds et al, 1997). Almost all of these studies have adopted a categorical definition of depression such as major depressive disorder (DSM-IV; American Psychiatric Association, 1994), or depressive episode (ICD-10; World Health Organization, 1992) or have dichotomised relatively small samples into those above or below a threshold on a severity rating scale. Although this has the advantage of simplicity it may also introduce bias since, in primary care, minor psychiatric morbidity seldom separates out into discrete diagnostic entities (Reference Goldberg and HuxleyGoldberg & Huxley, 1992). It may be better conceptualised as a continuum in which anxiety and depression behave as highly correlated aspects of the same disorder. We have therefore re-xamined the evidence for poor recognition of depression by GPs, assessing severity as a continuum, and have explored the effects of age, gender and concomitant anxiety, and socio-economic status, on the relationship between recognition and severity. This approach requires large sample sizes such as that accumulated during the Hampshire Depression Project (Reference Thompson, Kinmonth and StevensThompson et al, 2000), in which an educational intervention failed to produce a significant effect on recognition allowing us to aggregate the subjects into a single large multiple consecutive sample of general practice attenders.
METHOD
Setting
The Hampshire Depression Project was a randomised controlled trial to investigate the effects of a clinical practice guideline and practice-based education on the recognition and outcome of depression. Full details of the methods have been published elsewhere (Reference Thompson, Kinmonth and StevensThompson et al, 2000). Since no effect of the intervention on detection was seen at any stage of the study, patient contacts from all four screening phases have been combined for this study.
All general practices in Hampshire (n=224) were invited to take part. One hundred and fifty-two GPs in 55 practices completed the study and, although they were to some degree self-selected, were shown to be representative of Hampshire in their list size, the number of principals, patients per principal, the proportion of women and the proportion of part-time partners. These 152 GPs and their attending patients formed the sample for this study.
Measures
Self-ratings of depression and anxiety
In each of four screening phases over 2 years researchers distributed the Hospital Anxiety and Depression (HAD) scale to consecutive attenders aged 16 years and above in the practice waiting room during routine surgeries. This continued until at least 30 patients had been screened per GP in multi-partner practices and 40 for sole partner GPs. The HAD scale is a self-administered rating scale with 14 questions yielding separate scores for anxiety and depression (Reference Zigmond and SnaithZigmond & Snaith, 1983). It has been validated as a screening tool in general practice (Reference Wilkinson and BarczakWilkinson & Barczak, 1988), and the sub-scales appear to provide a valid measure of the severity of mood disorders in primary care (Reference Upadhyaya and StanleyUpadhyaya & Stanley, 1993). A score ≥8 on the HAD depression sub-scale (HAD-D) is the conventional threshold for identifying ‘possible depression’. GPs' age, gender, qualifications and working time were ascertained at recruitment to the study.
Patients were also asked to record their gender, date of birth and employment status.
GP ratings
Blind to the result of the HAD scale, practitioners completed a four-point rating of depression for each patient. Ratings were: 0, no depression detected; 1, sub-clinical emotional disturbance; 2, clinically significant depressive illness — mild; 3, clinically significant depressive illness — moderate or severe.
In the original study the recognition of depression was defined as the proportion of patients with a score ≥8 on the HAD—D sub-scale who were scored ≥2 on the GP scale. In this study an analysis of recognition rates for each HAD—D score was carried out and the effects on recognition and false positive rates of varying the threshold were explored.
Subjects
Each attender was eligible to take part once during each of four phases of the trial. Acceptance by those approached was 89%, 20 832 attenders were screened. All patients attending more than once therefore had their second attendance removed. Analysis was carried out on 18 414 consultations by unique patients (85.4%).
Socio-economic status
Underprivileged area (Reference JarmanJarman, 1983) scores were allocated to practices according to the electoral ward of the surgery address. The score has been shown to account for almost half the variance in the prevalence of depressive symptoms between practices in this study population (Reference Ostler, Thompson and KinmonthOstler et al, 2001).
Hypotheses
Practitioner characteristics
The average GP case recognition rate at a standard HAD scale threshold of 7/8 will be around 30-40%, consistent with previous literature. GP characteristics such as gender and length of time in practice will influence the recognition of depressive symptoms.
Patient characteristics
More severe depressive symptoms will be recognised more frequently. A sensitivity analysis will identify the effect on recognition rates of changing the threshold for case definition. Low anxiety scores, male gender and increasing age will reduce recognition rates independently of depression scores.
Socio-economic setting
Underprivileged area score might be expected to influence recognition rate in two contrasting ways. Taking the GP's interview with the patient as a diagnostic test, their performance might be expected to be more sensitive, but less specific, in high deprivation areas where prevalence of depression is higher (Reference KraemerKraemer, 1988). Alternatively, GPs in high deprivation areas might more often attribute depressive symptoms to social conditions rather than illness — thus reducing recognition rates. The relative effect of these two contrasting influences is unknown.
Statistical analysis
Diagnostic sensitivity (Reference BoardmanBoardman, 1987; Reference Goldberg and HuxleyGoldberg & Huxley, 1992) was defined for each GP as the proportion of patients with an HAD—D ≥8 who were rated as scoring 2 or 3 by the GP. For each value of the HAD—D score from 0 to 21, the proportion of patients with a GP rating of 2 or 3 was calculated. Logistic regression was used to model the data, generating equations in the form
logit (p)=c+(b*HAD—D)
where p is the probability of a positive GP score (≥2).
Recognition (or sensitivity) curves were plotted for patients grouped by age (16-64 v. 65+ years), gender, HAD—A sub-scale (0-10 v. 11-21) and underprivileged area score (<-10, −10 to +10, > 10). These thresholds were adopted prior to analysis. Finally, multiple logistic regression was used to examine the effect of controlling for the severity of depression and anxiety on the recognition of screened cases by gender, age and occupational group of patients.
RESULTS
Sample characteristics
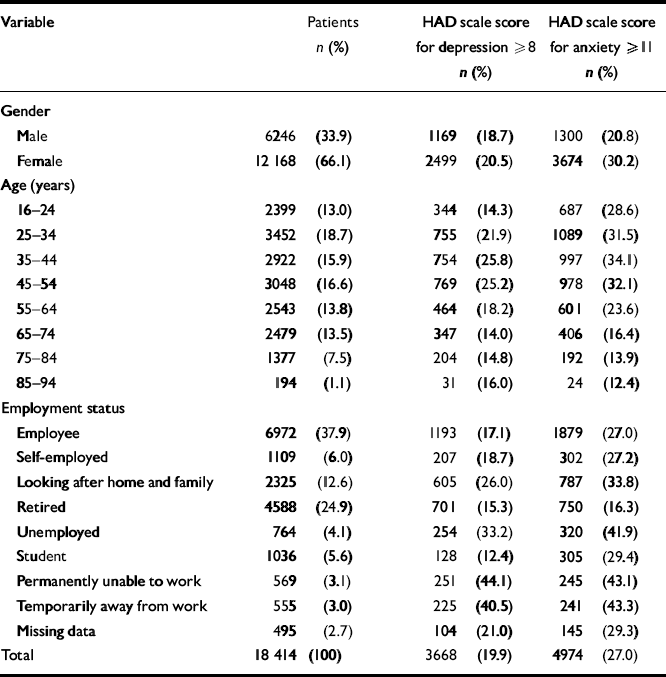
Characteristics of the aggregated patient sample are given in Table 1. The prevalence of possible depression was 19.9% in this sample ranging from 12.4% in students to 44% in those permanently unable to work. The median number of patients screened per GP over the four phases was 123 (interquartile range 32.75), with only four GPs contributing less than 50 patients.
Table 1 Characteristics of the patient sample
| Variable | Patients n (%) | HAD scale score for depression ≥8 n (%) | HAD scale score for anxiety ≥11 n (%) |
|---|---|---|---|
| Gender | |||
| Male | 6246 (33.9) | 1169 (18.7) | 1300 (20.8) |
| Female | 12 168 (66.1) | 2499 (20.5) | 3674 (30.2) |
| Age (years) | |||
| 16-24 | 2399 (13.0) | 344 (14.3) | 687 (28.6) |
| 25-34 | 3452 (18.7) | 755 (21.9) | 1089 (31.5) |
| 35-44 | 2922 (15.9) | 754 (25.8) | 997 (34.1) |
| 45-54 | 3048 (16.6) | 769 (25.2) | 978 (32.1) |
| 55-64 | 2543 (13.8) | 464 (18.2) | 601 (23.6) |
| 65-74 | 2479 (13.5) | 347 (14.0) | 406 (16.4) |
| 75-84 | 1377 (7.5) | 204 (14.8) | 192 (13.9) |
| 85-94 | 194 (1.1) | 31 (16.0) | 24 (12.4) |
| Employment status | |||
| Employee | 6972 (37.9) | 1193 (17.1) | 1879 (27.0) |
| Self-employed | 1109 (6.0) | 207 (18.7) | 302 (27.2) |
| Looking after home and family | 2325 (12.6) | 605 (26.0) | 787 (33.8) |
| Retired | 4588 (24.9) | 701 (15.3) | 750 (16.3) |
| Unemployed | 764 (4.1) | 254 (33.2) | 320 (41.9) |
| Student | 1036 (5.6) | 128 (12.4) | 305 (29.4) |
| Permanently unable to work | 569 (3.1) | 251 (44.1) | 245 (43.1) |
| Temporarily away from work | 555 (3.0) | 225 (40.5) | 241 (43.3) |
| Missing data | 495 (2.7) | 104 (21.0) | 145 (29.3) |
| Total | 18 414 (100) | 3668 (19.9) | 4974 (27.0) |
Practitioner characteristics and recognition rates
The mean recognition rate (sensitivity) across all practitioners was 36.1% (95% CI 33.8-38.4) with specificity 91.5% (95% CI 90.6-92.5) and κ=0.31 (0.28-0.33), consistent with previous studies.
Practitioners rated a mean of 13.6% (s.d.=6.9%) patients as being depressed with extremes of 0/95 (0%) and 28/73 (38.4%). Median diagnostic sensitivity was 0.67 (interquartile range 0.38), only slightly lower than the figure of 0.78 quoted by Goldberg et al (Reference Goldberg, Steele and Johnson1982) for the recognition of psychological morbidity by British GPs.
Part-time practitioners were less likely to diagnose depression (median recognition rates 0.57) than full-time GPs (median 0.70, Mann—Whitney U-test, P=0.033) and they also tended to work in less deprived areas (mean underprivileged area score difference −9.00, t-test P=0.004). There was no significant effect on recognition of GPs' gender (Mann—Whitney U-test P=0.67), length of time working in general practice (r s=0.111, P=0.172), prevalence rate in the patient sample (r s=-0.101, P=0.216) or underprivileged area score (r s=-0.099, P=0.221).
Depression severity and recognition rate
Figure 1 shows the relationship between severity of depressive symptoms and recognition rates. Apart from the very high scores at 19-21, where there are few cases, there is a strong relationship between HAD—D sub-scale score and recognition.
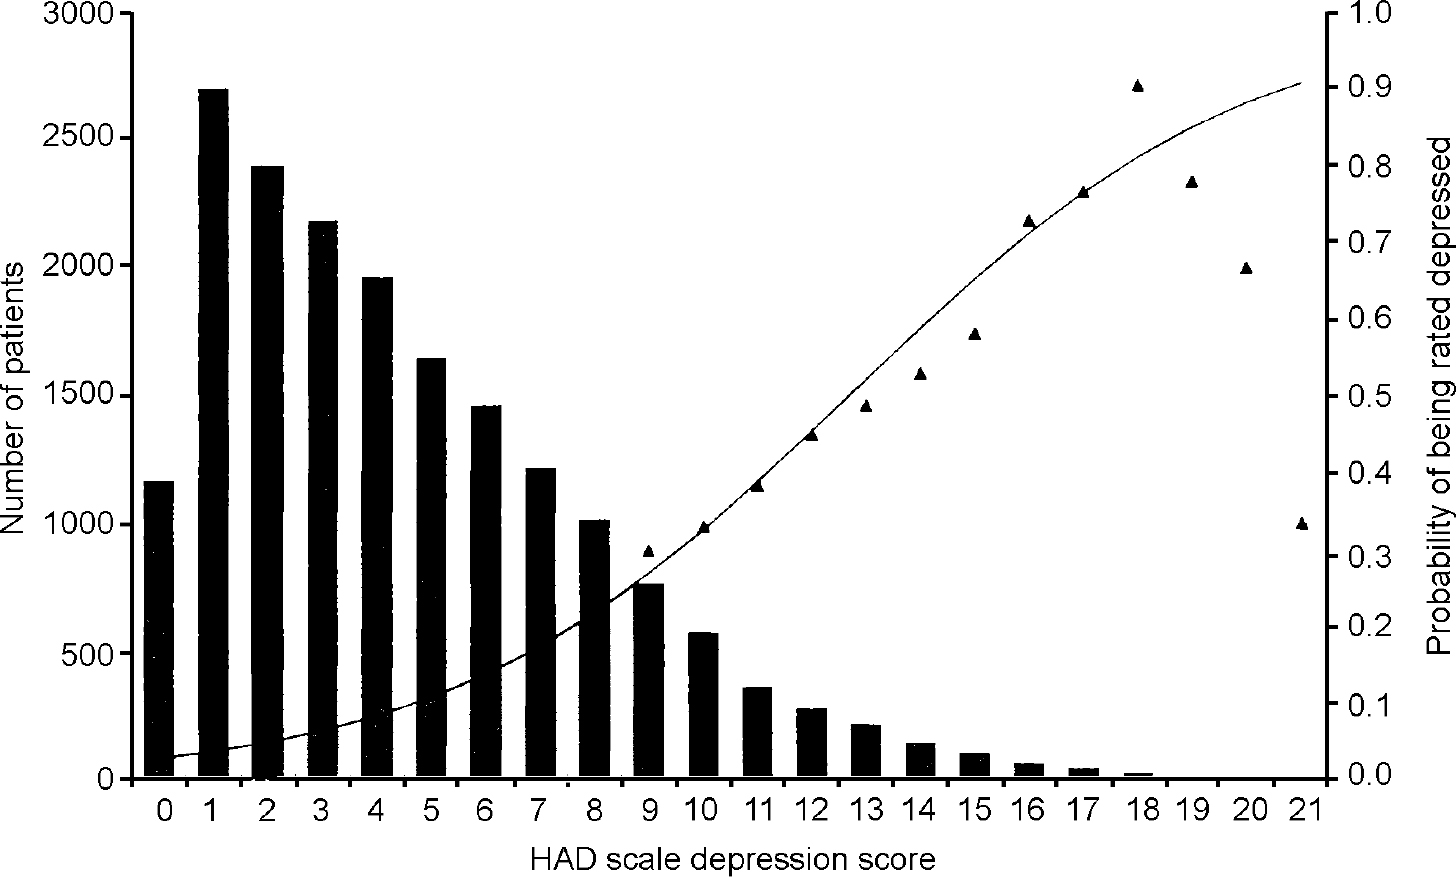
Fig. 1 Distribution of Hospital Anxiety and Depression (HAD) scale depression scores (Reference Zigmond and SnaithZigmond & Snaith, 1983) and probability of being rated as depressed.
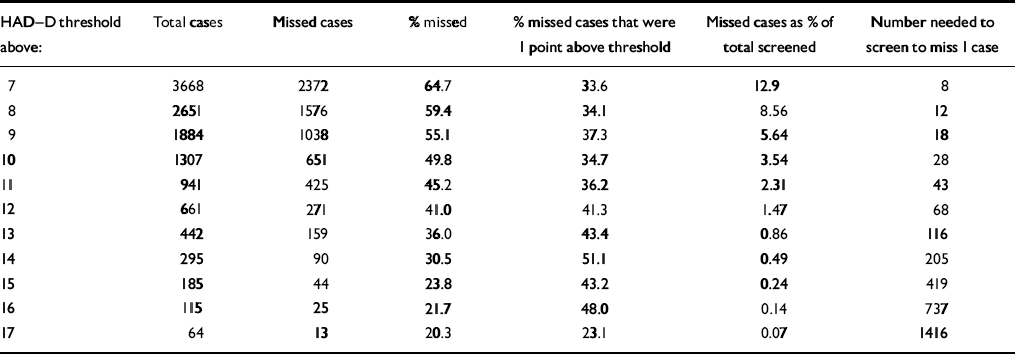
Using the conventional analysis of the number of ‘cases’ that are ‘missed’, the performance of the GPs in this study was similar to other reports (Reference DochertyDocherty, 1997). At the threshold of eight or above 64.7% of cases were missed. However, the dimensional approach to the data demonstrates that at progressively higher scores the lower prevalence and the increasing recognition rate makes this simple analysis misleading. This is because the proportion of missed cases drops markedly with small increments of the threshold score and the total number of cases also falls. Thus, 72.6% of all ‘missed cases’ scored 8-10 (‘mild’ or ‘doubtful’ depression).
This dimensional approach shows the critical effect of the choice of threshold for defining the ‘case’ of depression. It can be illustrated by examining the effect of a progressive rise, by a single point at a time, in the threshold for case definition. Table 2 shows that the proportion of missed cases diminishes as the threshold increases, which is not surprising — although the rate at which it diminishes may be. In addition (bearing in mind the difficulty of identifying a ‘gold standard diagnosis for depression) wherever the threshold is set, 30-50% of all missed cases lie only one point above that threshold.
Table 2 Effect of threshold on the proportion of missed cases, and the missed cases as a proportion of the total screened group
| HAD—D threshold above: | Total cases | Missed cases | % missed | % missed cases that were I point above threshold | Missed cases as % of total screened | Number needed to screen to miss I case |
|---|---|---|---|---|---|---|
| 7 | 3668 | 2372 | 64.7 | 33.6 | 12.9 | 8 |
| 8 | 2651 | 1576 | 59.4 | 34.1 | 8.56 | 12 |
| 9 | 1884 | 1038 | 55.1 | 37.3 | 5.64 | 18 |
| 10 | 1307 | 651 | 49.8 | 34.7 | 3.54 | 28 |
| 11 | 941 | 425 | 45.2 | 36.2 | 2.31 | 43 |
| 12 | 661 | 271 | 41.0 | 41.3 | 1.47 | 68 |
| 13 | 442 | 159 | 36.0 | 43.4 | 0.86 | 116 |
| 14 | 295 | 90 | 30.5 | 51.1 | 0.49 | 205 |
| 15 | 185 | 44 | 23.8 | 43.2 | 0.24 | 419 |
| 16 | 115 | 25 | 21.7 | 48.0 | 0.14 | 737 |
| 17 | 64 | 13 | 20.3 | 23.1 | 0.07 | 1416 |
The results of recognition rate studies are usually presented as the proportion of ‘true’ cases that are missed. However, a better indicator of the acceptability of practice would set the denominator as the total consultations, that is, 18 414, rather than the number of ‘cases’. On this analysis 12.9% of all consultations contain a failure to identify a ‘possible or doubtful case’ (33.6% of which are one point above that threshold at the time of interview). Some 3.5% of consultations contain a failure to identify a ‘probable case’ (of which 34.7% are one point above that threshold at the time of interview). Thus at this more robust, higher threshold one patient with a probable depression is missed every 28.6 consultations without allowing for error in the questionnaire.
GPs may recognise depressive symptoms but categorise them as sub-clinical emotional symptoms (score one on their questionnaire), a clinical judgement that may be appropriate at borderline levels of severity. Of those patients with probable depression 75.9% were rated by the GP as having some emotional disturbance (score one or above). Figure 2 shows the effect of different recognition thresholds on the relationship between recognition and severity. Using a score of one as the criterion the number needed to screen before a case of probable depression is missed increases from one in 28.6 to one in 58 consultations.
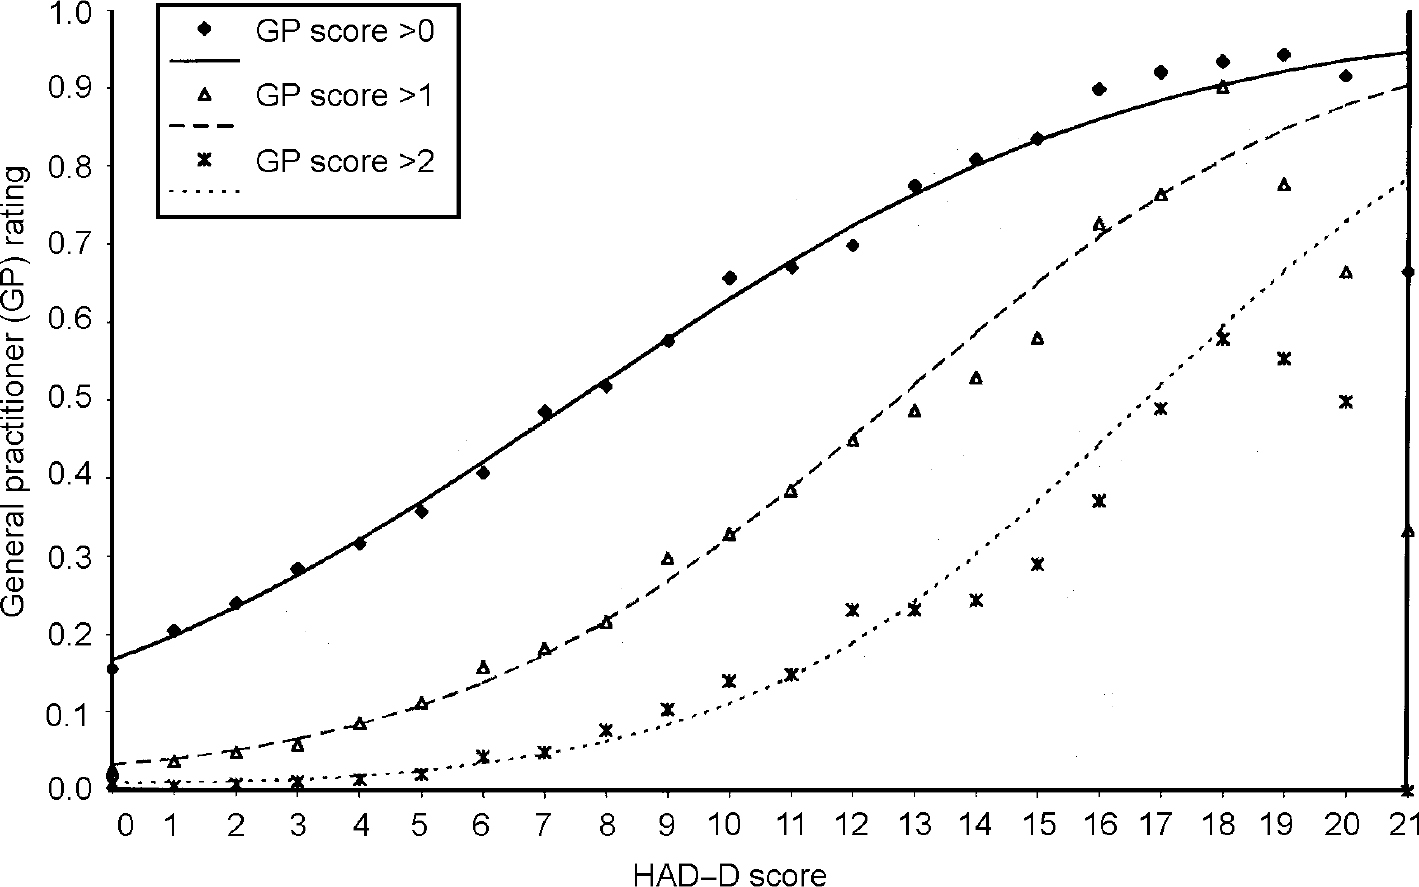
Fig. 2 Recognition and severity of depression. HAD—D, Hospital Anxiety and Depression scale — depression sub-scale score (Reference Zigmond and SnaithZigmond & Snaith, 1983).
Factors affecting the relationship between recognition and severity
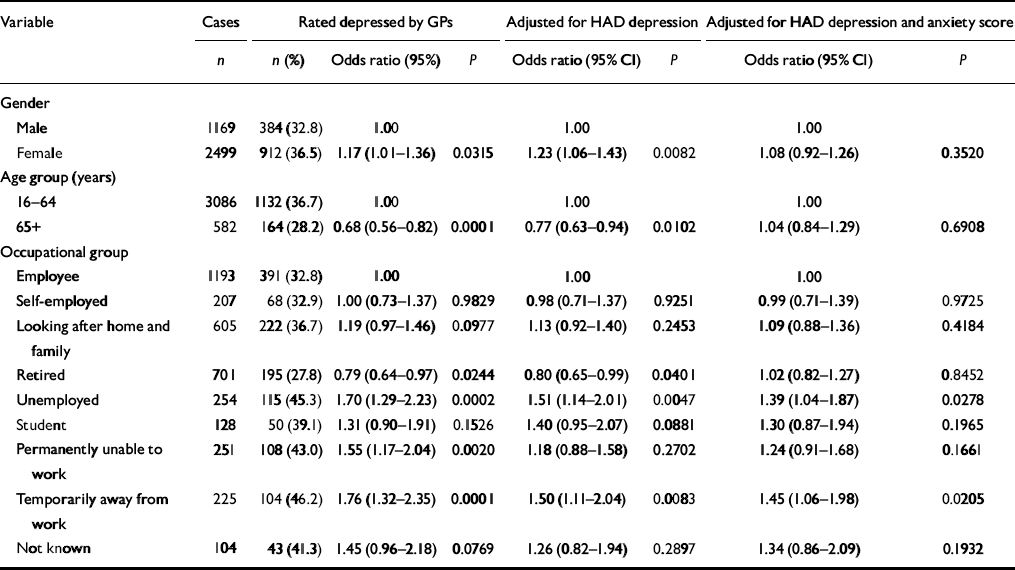
Figure 3 shows that patients with higher anxiety scores were more likely to be recognised as depressed at all levels of depression severity. There was a moderate correlation between HAD scale anxiety and depression scores (r=0.599, P<0.0005). The effect of adjusting for severity of depression and anxiety on the recognition of screened cases is shown in Table 3. Before adjusting for severity, women, the unemployed and those who were permanently unable to work were significantly more likely to be recognised, while the elderly and retired patients were more likely to be missed. Adjusting for depression severity eliminated the significance of being permanently unable to work so their higher rate of recognition is explained by more severe symptoms. Adjustment for both anxiety and depression scores eliminated the significance of gender, age and retirement status. Thus, after adjusting for the severity of depression and anxiety symptoms the only remaining bias was an increased sensitivity to depression among the unemployed and those temporarily away from work, possibly mediated by prior knowledge of treated depression.
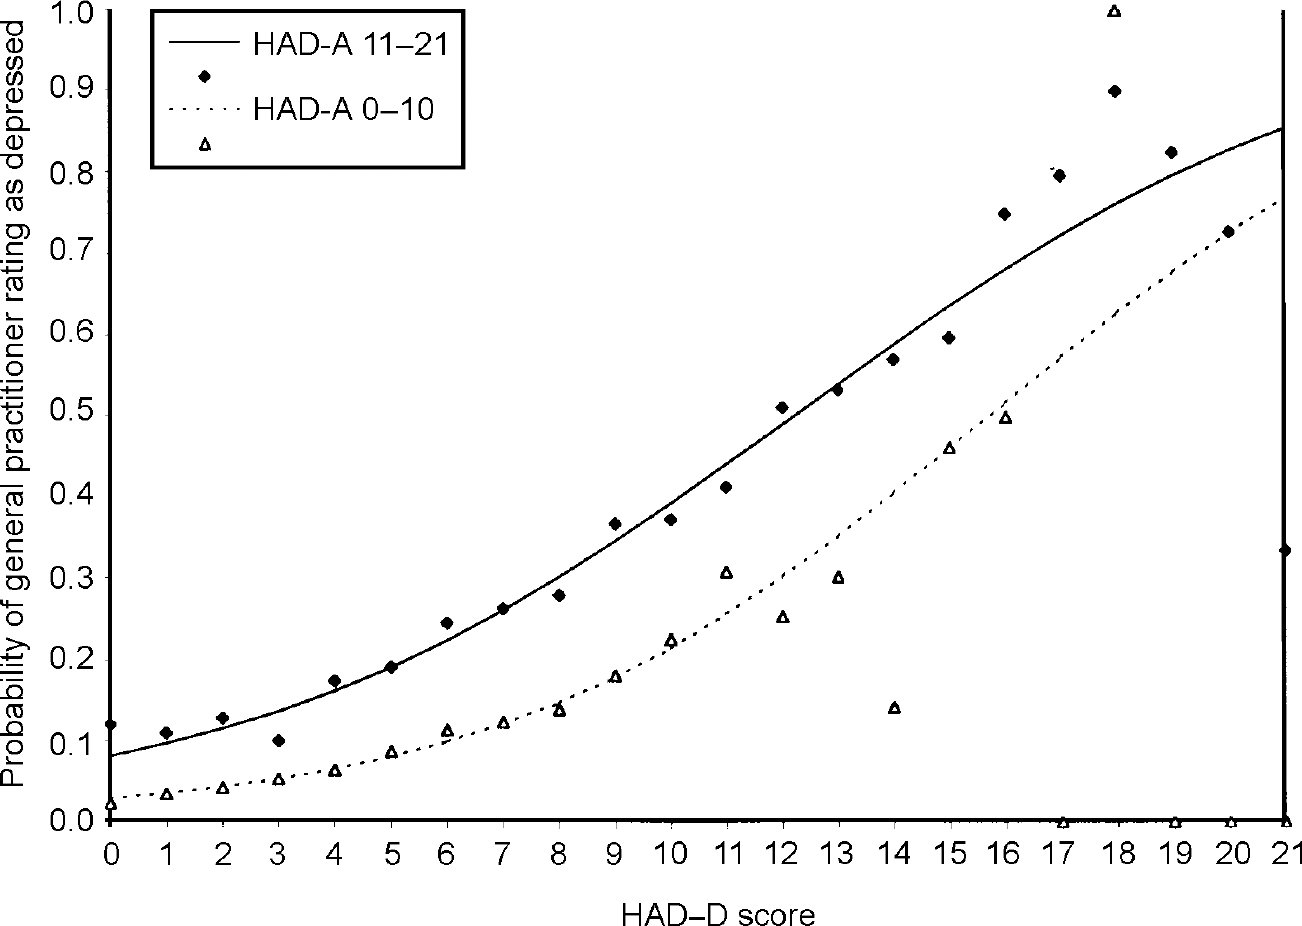
Fig. 3 Recognition of depression: effect of anxiety. HAD—D, Hospital Anxiety and Depression scale — depression sub-scale (Reference Zigmond and SnaithZigmond & Snaith, 1983)
Table 3 Effect of controlling for severity of depression and anxiety on recognition of screened cases by gender, age and occupational group. Cases defined as HAD depression score ≥8 general practitioner (GP) rating of depression as ≥2 (clinically significant depressive illness, mild moderate and severe)
| Variable | Cases | Rated depressed by GPs | Adjusted for HAD depression | Adjusted for HAD depression and anxiety score | ||||
|---|---|---|---|---|---|---|---|---|
| n | n (%) | Odds ratio (95%) | P | Odds ratio (95% CI) | P | Odds ratio (95% CI) | P | |
| Gender | ||||||||
| Male | 1169 | 384 (32.8) | 1.00 | 1.00 | 1.00 | |||
| Female | 2499 | 912 (36.5) | 1.17 (1.01-1.36) | 0.0315 | 1.23 (1.06-1.43) | 0.0082 | 1.08 (0.92-1.26) | 0.3520 |
| Age group (years) | ||||||||
| 16-64 | 3086 | 1132 (36.7) | 1.00 | 1.00 | 1.00 | |||
| 65+ | 582 | 164 (28.2) | 0.68 (0.56-0.82) | 0.0001 | 0.77 (0.63-0.94) | 0.0102 | 1.04 (0.84-1.29) | 0.6908 |
| Occupational group | ||||||||
| Employee | 1193 | 391 (32.8) | 1.00 | 1.00 | 1.00 | |||
| Self-employed | 207 | 68 (32.9) | 1.00 (0.73-1.37) | 0.9829 | 0.98 (0.71-1.37) | 0.9251 | 0.99 (0.71-1.39) | 0.9725 |
| Looking after home and family | 605 | 222 (36.7) | 1.19 (0.97-1.46) | 0.0977 | 1.13 (0.92-1.40) | 0.2453 | 1.09 (0.88-1.36) | 0.4184 |
| Retired | 701 | 195 (27.8) | 0.79 (0.64-0.97) | 0.0244 | 0.80 (0.65-0.99) | 0.0401 | 1.02 (0.82-1.27) | 0.8452 |
| Unemployed | 254 | 115 (45.3) | 1.70 (1.29-2.23) | 0.0002 | 1.51 (1.14-2.01) | 0.0047 | 1.39 (1.04-1.87) | 0.0278 |
| Student | 128 | 50 (39.1) | 1.31 (0.90-1.91) | 0.1526 | 1.40 (0.95-2.07) | 0.0881 | 1.30 (0.87-1.94) | 0.1965 |
| Permanently unable to work | 251 | 108 (43.0) | 1.55 (1.17-2.04) | 0.0020 | 1.18 (0.88-1.58) | 0.2702 | 1.24 (0.91-1.68) | 0.1661 |
| Temporarily away from work | 225 | 104 (46.2) | 1.76 (1.32-2.35) | 0.0001 | 1.50 (1.11-2.04) | 0.0083 | 1.45 (1.06-1.98) | 0.0205 |
| Not known | 104 | 43 (41.3) | 1.45 (0.96-2.18) | 0.0769 | 1.26 (0.82-1.94) | 0.2897 | 1.34 (0.86-2.09) | 0.1932 |
DISCUSSION
Methodological considerations
The practices in this sample were 24% of all those available in Hampshire and were representative of the whole group in terms of organisation and personnel. Although the participants may be assumed to have a greater interest in depression than the non-participants this effect must also have operated in previous studies and indeed these GPs fared no better than their colleagues who were studied in previous reports when we used a standard dichotomous analysis.
The study might be criticised for not employing a diagnosis of depression based on a research interview against which to judge practitioners' skills rather than a self-rating questionnaire. Such an approach would have appropriately eliminated some patients with depressive symptoms whose primary diagnosis was not depression and would have set a longer duration of symptoms for identification than the HAD scale response period. We discuss below the value of the dimensional approach, but in addition the size of this study rendered full diagnostic procedures impractical. They would also have introduced observer bias in the interpretation of the depressive symptoms that is not present when dealing with self-ratings. The patients included only those who were ambulatory and able to attend the doctors' practice premises, excluding potentially depressed patients among the chronically ill and disabled group, who were therefore under-represented.
Findings in the context of the previous literature
The recognition of depression by GPs has been a subject of investigation in many studies, all of which have suggested low true positive rates of identification. Some of these have previously shown that recognition is dependent on severity (Reference Coyne, Schwenk and Fechner-BatesCoyne et al, 1995; Reference Ormel and TiemensOrmel & Tiemens, 1995; Reference DowrickDowrick, 1995), a conclusion with which we concur. We disagree, however, with previous research suggesting that there is better recognition of depression in women and the middle-aged, and poorer recognition in the elderly (Reference BoardmanBoardman, 1987; Reference Katona, Free ling and HinchcliffeKatona et al, 1995). These effects may have been significantly confounded by severity of illness and after allowing for this we have shown that diagnosis is based on symptoms rather than stereotypes. It is also reassuring that practitioners working in deprived areas were not biased against a diagnosis of depression owing to reduced expectations of patients' quality of life. Indeed they appear to be somewhat over-sensitive to the possibility of depression in patients who were currently unemployed.
Our findings, however, go further than the prior literature in two ways. First, we calculate non-recognition rates by reference to the consulting population, rather than as a proportion of the number of patients with depression. Second, in dimensional conditions such as depression, apparently low rates of diagnosis can be produced by adopting a low score as a case threshold. We have shown that the choice of threshold critically affects the recognition rate because of the diminishing prevalence of higher scores combined with increasing recognition, thus explaining the wide variations of previous estimates. Furthermore, some of the one-third of missed cases that lie only just above any given threshold on the HAD—D sub-scale may be true negatives since all questionnaires and diagnostic procedures have rating errors. In addition, these recognition rates are obtained from a single 9-minute consultation, and the GP's prior knowledge of the patient. They must be taken together with evidence that many ‘missed’ patients are diagnosed correctly at a subsequent visit (Reference Ormel and TiemensOrmel & Tiemens, 1995).
Implications, for practice and education
One criticism of our study might be the absence of a ‘gold standard’ diagnostic criterion for depression. We believe this criticism would be hard to sustain because psychiatric diagnostic categories are rarely used routinely by GPs despite their need to make some dichotomous decisions, for example whether or not to treat with anti-depressants. This may be because of the absence of clear validity data for DSM and ICD syndromes in primary care — a category such as major depressive disorder having no dichotomous relationship to clinical disability, need for treatment or level of risk. In such a situation a dimensional approach has greater epidemiological validity then a categorical one since it makes fewer assumptions. The importance of this dimensional view of depression is strengthened by the evidence that milder, so-called sub-syndromal symptoms are very common and are associated with considerable health and social problems (Reference Judd, Paulus and WellsJudd et al, 1996).
An appropriate criterion for a gold standard definition would be validated by reference to evidence of treatment benefit and this may vary from one treatment to another depending on the definitions of treatment and of acceptable benefit. If one were to become available in the future it would make a dichotomous approach more tenable since it would demonstrate a tangibly impaired access to effective treatment as a result of missed diagnoses. Even in the absence of this evidence, however, it is reasonably safe to assume from our findings that increasing the sensitivity of GPs to depression through educational interventions will also increase the false positive diagnostic rate of some hypothetically valid depressive entity — with the consequent dangers of unnecessary treatment. Since the size of the non-depressed population is larger than that of the depressed group any shift of the recognition point to the left will lead to a greater increase in the numbers of non-depressed unnecessarily treated than in the numbers of patients with depression correctly treated. In this regard, the difference in the recognition curve between ‘sub-clinical emotional disturbance’ and ‘clinically significant depression’ demonstrates that GPs are using their clinical judgement in recognising emotional disturbance that they believe does not require medical intervention. These results should also be placed in the broader practice perspective. Patients often present multiple ill-defined complaints and GPs rarely address mental health in isolation from other problems. Indeed, focusing on mild depressive symptoms has an opportunity cost, leaving less time for possibly more pressing demands in the relatively short time of the consultation (Reference KlinkmanKlinkman, 1997). There is little evidence for the efficacy of intervention in milder depressive syndromes, and many resolve spontaneously so GPs may reasonably judge that diagnosis is not critical in these borderline states (Reference Paykel and PriestPaykel & Priest, 1992).
Taking these factors into account it seems likely that the recognition rates of depression in general practice are not so poor as has been claimed in the past. Interventions that aim to improve GPs' recognition of depression face a difficult task if they are not also to reduce specificity and lead to potentially unnecessary treatment. Educational and research programmes should therefore concentrate primarily on targeting under-performing practitioners and enabling the better treatment of diagnosed patients (Reference ThompsonThompson, 1999).
Clinical Implications and Limitations
CLINICAL IMPLICATIONS
-
• Contrary to the prevailing consensus, general practitioners only miss one ‘probable case’ of depression in every 28.6 consultations. Recognition is directly related to severity of depression, moderated appropriately by the severity of anxiety symptoms.
-
• The relationship between severity and recognition is modified only by unemployment, which increases sensitivity, and there is no evidence of bias due to age or gender.
-
• Increasing general sensitivity of general practitioners to depression will increase the false positive rates of ‘diagnosis’, thus increasing unnecessary treatment, and is unlikely to improve the care of depression as a whole. For this, more complex clinical and organisational solutions, based on better research evidence, will be needed.
LIMITATIONS
-
• The study had large numbers, but limited information about the consultation and the patient.
-
• A self-rating of depression was used rather than an interview-based definition of depression, giving dimensional rather than categorical descriptions.
-
• In the absence of a clear relationship between severity of depression and response to medical treatment we cannot be sure that the thresholds adopted were the most clinically beneficial for the patient population.
Acknowledgements
This study was funded by the Medical Research Council, the Research and Development Committee of the South West Region of the NHS Executive and the Southampton Community Health Services Trust. We are grateful to Professor Andrew Stevens who was a grant-holder for the original Hampshire Depression Project and to the general practitioners and patients who took part.


eLetters
No eLetters have been published for this article.