Case management has become an increasingly common system of care for patients suffering mental health problems in the UK since its recommendation by Sir Roy Griffiths in 1988 (Reference GriffithsGriffiths, 1988). For the care of patients with severe psychosis, intensive case management has been advocated, with evidence suggesting that a reduced case-load is beneficial in terms of the effectiveness and quality of case management care (Reference Intagliata and BakerIntagliata & Baker, 1983; Reference Harris and BergmanHarris & Bergman, 1988; Reference ThornicroftThornicroft, 1991). Because of reduced case-load size, intensive case management is a more expensive form of management than standard case management, requiring a greater number of staff to manage the same number of patients. What is unknown, however, is whether this additional expenditure can be justified in terms of reductions in the use of other resources or improvements in patient outcomes. This paper reports the results of an investigation of cost-effectiveness, carried out within a multi-centre randomised controlled trial, comparing intensive with standard case management for the treatment of patients with severe psychosis. A broad perspective was taken to assess the impact of intensive case management on all service providing sectors.
METHOD
Hypotheses
The following hypotheses regarding costs were tested in this trial: in patients with psychosis and a history of frequent admissions (a) intensive case management would result in reduced overall costs over two years compared with standard case management, and (b) that this effect would be greater for African-Caribbean patients (who are generally considered to be harder to engage and poorly served in current services) and for severely, rather than moderately, disabled patients. The clinical results and a more detailed exposition of the rationale and methods of the randomised-controlled trial have been reported elsewhere (UK700 Group: Burns et al, 1999; UK700 Group: Creed et al, 1999).
Patients
Patients were recruited from four inner city areas - three in London (St George's Hospital, St Mary's Hospital and King's College Hospital) and one in Manchester (Manchester Royal Infirmary). Patients, identified by review of in-patient and out-patient registers, were included in the study if they were aged between 18 and 65 years, had suffered from a psychotic illness of at least two years and had been admitted to a psychiatric hospital at least twice, once within the past two years. Diagnoses were determined by a structured examination of case notes, using the Operational Criteria Checklist (OPCRIT; Reference McGuffin, Farmer and HarveyMcGuffin et al, 1991). Patients were excluded if they had organic brain damage or a primary diagnosis of substance misuse.
Recruitment was carried out between February 1994 and April 1996. Patients were randomly allocated to two years of either intensive case management (case-load size 10-15) or standard case management (case-load size 30-35) and assessed at base-line, 12 and 24 months by researchers independent of those providing clinical care.
Randomisation was stratified by centre and conducted by an independent statistical centre. Ethical approval for the study was gained from all four local ethics committees.
Intervention
Case management for patients with severe mental illness is a system of care delivered by trained mental health professional (e.g. nurses, social workers or psychologists). It can involve the direct provision of care as well as the coordination of interventions required by this patient group, often including a wide range of health and social services (Reference Intagliata and BakerIntagliata & Baker, 1983; Reference ThornicroftThornicroft, 1991). Intensive case management can be distinguished from standard case management by the nature of its reduced case-load size.
In order to ensure consistency of the interventions between the four participating sites, case managers were given a two-day induction course in case management by the Sainsbury Centre for Mental Health, and instruction in outreach practice was given to intensive case managers by a team leader in assertive community treatment from Boulder, Colorado, USA.
Clinical outcomes
The primary outcome measure was days in hospital for psychiatric problems over 24 months, recorded in a modified World Health Organization (WHO) Life Chart (WHO, 1992). This measure was selected because it is the most consistently reported outcome in case management studies (Reference Holloway, Oliver and CollinsHolloway et al, 1995) and is therefore the best benchmark for locating our results. Furthermore, the two most commonly cited objectives in case management studies are improved contact and reduced hospitalisation, with reduced hospitalisation reflecting improved community tenure and social adjustment.
Secondary measures included clinical status assessed using the Comprehensive Psychiatric Rating Scale (CPRS) (Reference Asberg, Montgomery and PerrisÅsberg et al, 1978), quality of life assessed using the Lancashire Quality of Life Profile (Reference Oliver, Huxley and PriebeOliver et al, 1997), unmet needs recorded using the Camberwell Assessment of Need (Reference Phelan, Slade and ThornicroftPhelan et al, 1995), social disability measured by the WHO Disability Assessment Schedule (DAS) (Reference Jablensky, Schwartz and TomovJablensky et al, 1980) and patient satisfaction assessed using a self-report questionnaire (Reference Tyrer and RemingtonTyrer & Remington, 1979).
Cost
The perspective of this trial was that of all service providing sectors in society, thus enabling the differential impact of case management on each sector to be clearly quantified. Patient and family costs and the indirect costs associated with employment were excluded from the analysis to avoid overburdening respondents already faced with extremely long interview schedules. However, the likely impact of these exclusions is considered in the discussion section below.
Information on the use of all hospital and community services was collected prospectively for each patient over the study period. A number of sources were used, including event records of community mental health team (CMHT) activities, clinical records, patient interview at Year 1 and Year 2 follow-up, local authority social services departments and questionnaires completed by case managers.
Sources of unit costs are summarised in Table 1. Where possible, these were calculated on the basis of information provided by the relevant local service providers, thus London costs, with associated London weighting, were applied to the three London sites. Unit costs of services that could not be determined locally and those of relatively small service components were taken from national publications (Reference Schneider, Netten and DennettSchneider, 1996; HM Prison Service, 1997; Reference Netten and DennettNetten & Dennett, 1997; British Medical Association, 1998; Chartered Institute of Public Finance and Accountancy (CIPFA), 1998). For London based services only, national unit costs were weighted to take into consideration the higher cost of service provision, where appropriate. All unit costs were calculated for the financial year 1997/98. Published unit costs were inflated to 1997/98 prices where necessary (personal communication, Public Expenditure Survey Team, 1998) and future costs were discounted at an annual rate of 6%.
Table 1 Use of resources during the two-year follow-up period; mean per patient

| Service | Use of resources, mean (s.d.) | Unit | Unit cost or range (£) | Source of unit cost | |
|---|---|---|---|---|---|
| Intensive (n=335) | Standard (n=332) | ||||
| Case managers/CMHT | |||||
| Contact time | 89 (64) | 36 (26) | Hour | 15-90 | Salary scale |
| Number of contacts | 100 (67) | 46 (30) | Contacts | ||
| Hospital services | |||||
| Psychiatric in-patient1 | 76 (128) | 73 (109) | Day | 130-178 | Local provider |
| Other in-patient1 | 1 (8) | 2 (21) | Day | 211-446 | Local provider |
| Day patient | 12 (39) | 14 (53) | Attendance | 39-65 | Local provider |
| Out-patient | 4 (5) | 4 (5) | Attendance | 39-217 | Local provider |
| Accident and emergency | 1 (3) | 2 (3) | Attendance | 51-78 | Local provider |
| Out-of-hours/emergency clinic | 1 (7) | 1 (3) | Attendance | 110-167 | Local provider |
| Primary care | |||||
| General practitioner | 10 (9) | 12 (12) | Consultation | 9 | PSSRU |
| Practice nurse | 3 (8) | 5 (11) | Consultation | 7 | PSSRU |
| Medication | |||||
| Antipsychotics | 20 (7) | 20 (8) | Month | 2-159 | British National Formulary |
| Antidepressants | 4 (8) | 4 (8) | Month | 2-21 | British National Formulary |
| Anticholinergics | 10 (11) | 11 (11) | Month | 5 | British National Formulary |
| Lithium | 4 (9) | 4 (8) | Month | 3 | British National Formulary |
| Accommodation | |||||
| Staffed accommodation | 19 (35) | 19 (35) | Week | 109-508 | Local provider, CIPFA |
| Prison and police custody | |||||
| Prison/police custory | 8 (53) | 5 (40) | Day | 50-83 | HM Prison Service (1997) |
| Social and non-statutory services | |||||
| Social work | 22 (44) | 28 (60) | Contact | 21-24 | PSSRU |
| Day centre | 33 (83) | 26 (81) | Attendance | 9-31 | Local provider, CIPFA |
| Drop-in | 18 (56) | 15 (52) | Attendance | 11-12 | Local provider, CIPFA |
| Sheltered workshop | 9 (50) | 7 (40) | Day | 23 | Schneider (Reference Schneider, Netten and Dennett1996) |
| Meals | 3 (51) | 6 (55) | Meal | 1-4 | Local provider, CIPFA |
| Home care | 12 (50) | 21 (97) | Item | 1-21 | Local provider, CIPFA |
| Transport | 1 (14) | 0 (4) | Trip | 5-25 | Local provider |
Information on all contact and attempts at contact with trial participants by CMHT professionals were based on the prospective completion of event records. Five categories of events were recorded: (a) face-to-face contact with patients; (b) telephone contact with patients; (c) carer contact; (d) care co-ordination; and (e) attempted face-to-face contact with patients. For each professional, a cost per minute was calculated from the mid-point of the relevant 1997/98 salary scales and included employers' national insurance and superannuation contributions, London weighting where appropriate, and 20% for overheads. To take into consideration time spent on non-patient-specific activities such as supervision, training and paperwork, staff costs were inflated assuming a ratio of 1:1 for non-event to event recorded time. This figure was estimated on the basis of time diary exercises, audits of event recording activity and published inflation ratios for similar professionals (Reference Netten and DennettNetten & Dennett, 1997).
Statistical methods
Sample size calculations for the cost component of this trial were based on the results of the Daily Living Programme Study (Reference Knapp, Tyrer and CreedKnapp, 1995). A sample size of 350 patients in each group was anticipated to be able to detect a difference of £45 in the average weekly cost per patient (e.g. a reduction from £200 to £155, with standard deviation equal to the mean) as statistically significant at the 5% level with 80% power (UK700 Group: Creed et al, 1999).
All clinical and economic analyses were carried out on an intention to treat basis using a statistical analysis plan drawn up before looking at the data (UK700 Group: Creed et al, 1999). Although costs were not normally distributed, analyses compared the mean costs in the two groups using standard t-test methods, with the validity of results confirmed using boot-strapping (Reference Efron and TibshiraniEfron & Tibshirani, 1993). The advantage of this approach, as opposed to logarithmic transformation or conventional non-parametric tests, is the ability to make inferences about the arithmetic mean (Reference Barber and ThompsonBarber & Thompson, 1998).
The primary analysis was of total costs but results are also given by cost sector, and individual resource use components are detailed. Multiple regression was used to adjust for baseline characteristics of patients, these being centre, age, gender, ethnic group (African-Caribbean v. other), source (hospital v. community), CPRS, DAS, social class (non-manual, manual, long-term unemployed), duration of illness, days in hospital two years prior to randomisation and OPCRIT diagnosis. Subgroup analyses were performed using tests of interaction. Sensitivity analyses were carried out to assess the robustness of results to assumptions made in the costing procedure. In cost-effectiveness analyses the confidence regions for the incremental costs and effects (Reference van Hout, Al and Gordonvan Hout et al, 1994) were calculated using bivariate percentile bootstrap methods (Reference Davison and HinkleyDavison & Hinkley, 1997).
RESULTS
Patients and clinical outcomes
A total of 708 patients were randomised to either intensive or standard case management. Forty-one patients were excluded from the economic analysis due to death (n = 15), loss to follow-up (n = 14) or insufficient information for costing (n = 12). Thus, 667 patients (335 intensive and 332 standard) were entered into the economic evaluation. A comparison of the baseline characteristics of patients included in the cost analysis and those excluded revealed no significant differences. Average length of follow-up was equal in both randomised groups (104 weeks).
As previously reported, there was no difference between intensive and standard groups in terms of the primary outcome measure, days in hospital for psychiatric problems over 24 months (means 73.5 and 73.1 days, difference 0.4 days, 95% CI ‒17.4-18.1) (UK700 Group: Burns et al, 1999). Nor were there any significant differences in the secondary outcome measures between the intensive and standard groups: mean CPRS scores 18.5 and 18.1 (difference 0.4, 95% CI ‒1.8-2.7); mean quality of life scores 4.58 and 4.55 (difference 0.04, 95% CI ‒0.09-0.16); mean number of unmet needs 1.84 and 2.13 (difference ‒0.29, 95% CI ‒0.68-0.11); mean DAS total score 1.10 and 1.13 (difference ‒0.03, 95% CI ‒0.16-0.10); and mean patient's satisfaction score 16.7 and 17.1 (difference ‒0.3, 95% CI ‒1.2 to 0.5).
Cost
Table 1 details the mean number of contacts patients had with all services over the two-year follow-up, along with unit costs and the source of these costs. As would be expected, on average more event recorded activities per patient were carried out by intensive case managers compared with standard case managers and over twice as much time was spent per patient on these activities (means 89 and 36 hours, respectively). The use of all other services differed little between the two groups.
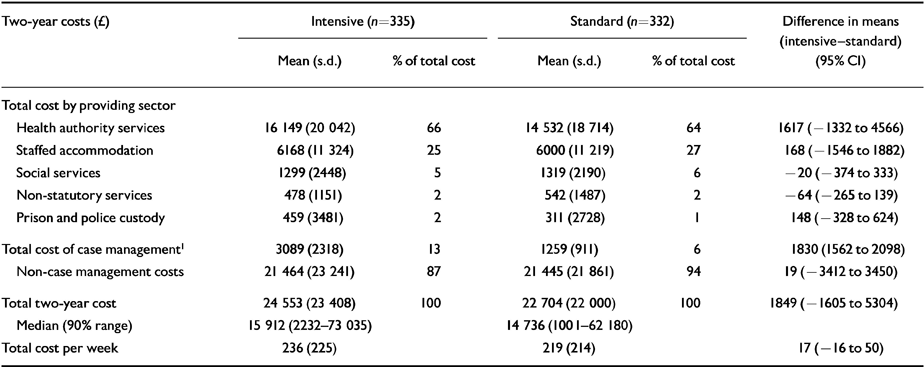
Table 2 details the total cost of all services used by the intensive and standard groups over the two-year follow-up period. The distributions of total costs in each group are displayed in Fig. 1. No significant differences were found in the average overall costs of care per patient between the intensive and standard case management groups (means £ 24 553 and £22 704 respectively; P=0.29). Adjustments for baseline variables did not materially alter these results (P=0.48). It is interesting to note that the difference observed in total costs per patient (£1849) appears to be accounted for mainly by the difference in the cost of case management per patient (£1830), with little impact of intensive case management being observed in the non-health care sectors.
Table 2 Two-year total costs per patient, by cost sector
| Two-year costs (£) | Intensive (n=335) | Standard (n=332) | Difference in means (intensive-standard) (95% CI) | ||
|---|---|---|---|---|---|
| Mean (s.d.) | % of total cost | Mean (s.d.) | % of total cost | ||
| Total cost by providing sector | |||||
| Health authority services | 16 149 (20 042) | 66 | 14 532 (18 714) | 64 | 1617 (-1332 to 4566) |
| Staffed accommodation | 6168 (11 324) | 25 | 6000 (11 219) | 27 | 168 (-1546 to 1882) |
| Social services | 1299 (2448) | 5 | 1319 (2190) | 6 | -20 (-374 to 333) |
| Non-statutory services | 478 (1151) | 2 | 542 (1487) | 2 | -64 (-265 to 139) |
| Prison and police custody | 459 (3481) | 2 | 311 (2728) | 1 | 148 (-328 to 624) |
| Total cost of case management1 | 3089 (2318) | 13 | 1259 (911) | 6 | 1830 (1562 to 2098) |
| Non-case management costs | 21 464 (23 241) | 87 | 21 445 (21 861) | 94 | 19 (-3412 to 3450) |
| Total two-year cost | 24 553 (23 408) | 100 | 22 704 (22 000) | 100 | 1849 (-1605 to 5304) |
| Median (90% range) | 15 912 (2232-73 035) | 14 736 (100 1-62 180) | |||
| Total cost per week | 236 (225) | 219 (214) | 17 (-16 to 50) | ||
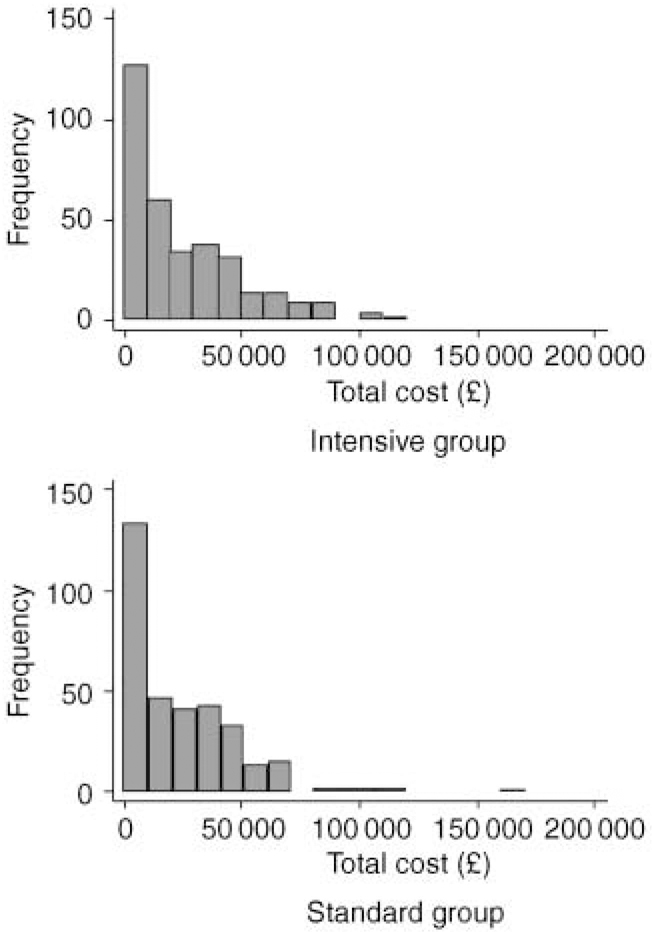
Fig. 1 Histograms of two-year total costs per patient (£) in each randomised group.
No statistically significant sectoral differences between intensive and standard groups were found. Case management constituted 13% of the total cost of care of the intensive group (mean £3089) and 6% of the standard group (£1259). The largest proportion of total cost was borne by the health sector (66% in the intensive group and 64% in the standard group). Staffed accommodation also made a relatively large contribution to the total costs of care (25% intensive; 27% standard).
Subgroup analyses
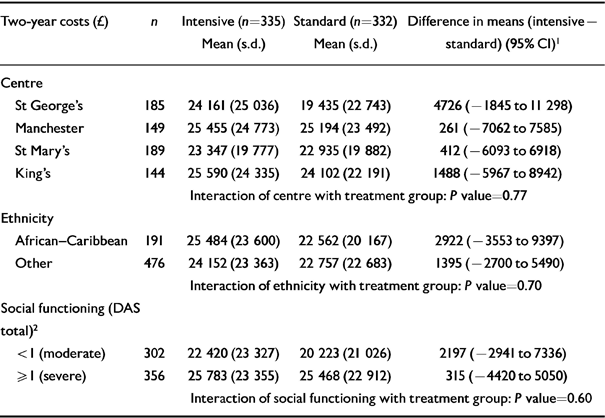
No significant differences in the effect of intensive case management on costs were found between the four centres (Table 3). Analyses according to ethnic group (African-Caribbean v. other) and severity of social functioning, measured by the DAS (moderate v. severe) also showed no evidence of differential effects (Table 3).
Table 3 Subgroup analyses for two-year total costs per patient
| Two-year costs (£) | n | Intensive (n=335) Mean (s.d.) | Standard (n=332) Mean (s.d.) | Difference in means (intensive — standard) (95% CI)1 |
|---|---|---|---|---|
| Centre | ||||
| St George's | 185 | 24 161 (25 036) | 19 435 (22 743) | 4726 (-1845 to 11 298) |
| Manchester | 149 | 25 455 (24 773) | 25 194 (23 492) | 261 (-7062 to 7585) |
| St Mary's | 189 | 23 347 (19 777) | 22 935 (19 882) | 412 (-6093 to 6918) |
| King's | 144 | 25 590 (24 335) | 24 102 (22 191) | 1488 (-5967 to 8942) |
| Interaction of centre with treatment group: P value=0.77 | ||||
| Ethnicity | ||||
| African-Caribbean | 191 | 25 484 (23 600) | 22 562 (20 167) | 2922 (-3553 to 9397) |
| Other | 476 | 24 152 (23 363) | 22 757 (22 683) | 1395 (-2700 to 5490) |
| Interaction of ethnicity with treatment group: P value=0.70 | ||||
| Social functioning (DAS total)2 | ||||
| < 1 (moderate) | 302 | 22 420 (23 327) | 20 223 (21 026) | 2197 (-2941 to 7336) |
| ≥ 1 (severe) | 356 | 25 783 (23 355) | 25 468 (22 912) | 315 (-4420 to 5050) |
| Interaction of social functioning with treatment group: P value=0.60 | ||||
Cost-effectiveness analysis
Given that neither form of case management demonstrated dominance in terms of either costs or effects, a formal cost-effectiveness analysis is not required in this trial. However, an exploration of the relationship between costs and the primary clinical outcome measure highlights the correlation between days in hospital for psychiatric problems and total costs (Fig. 2). Psychiatric in-patient costs comprised almost half of the total costs of care for the patients in both the standard (48%) and intensive groups (47%).
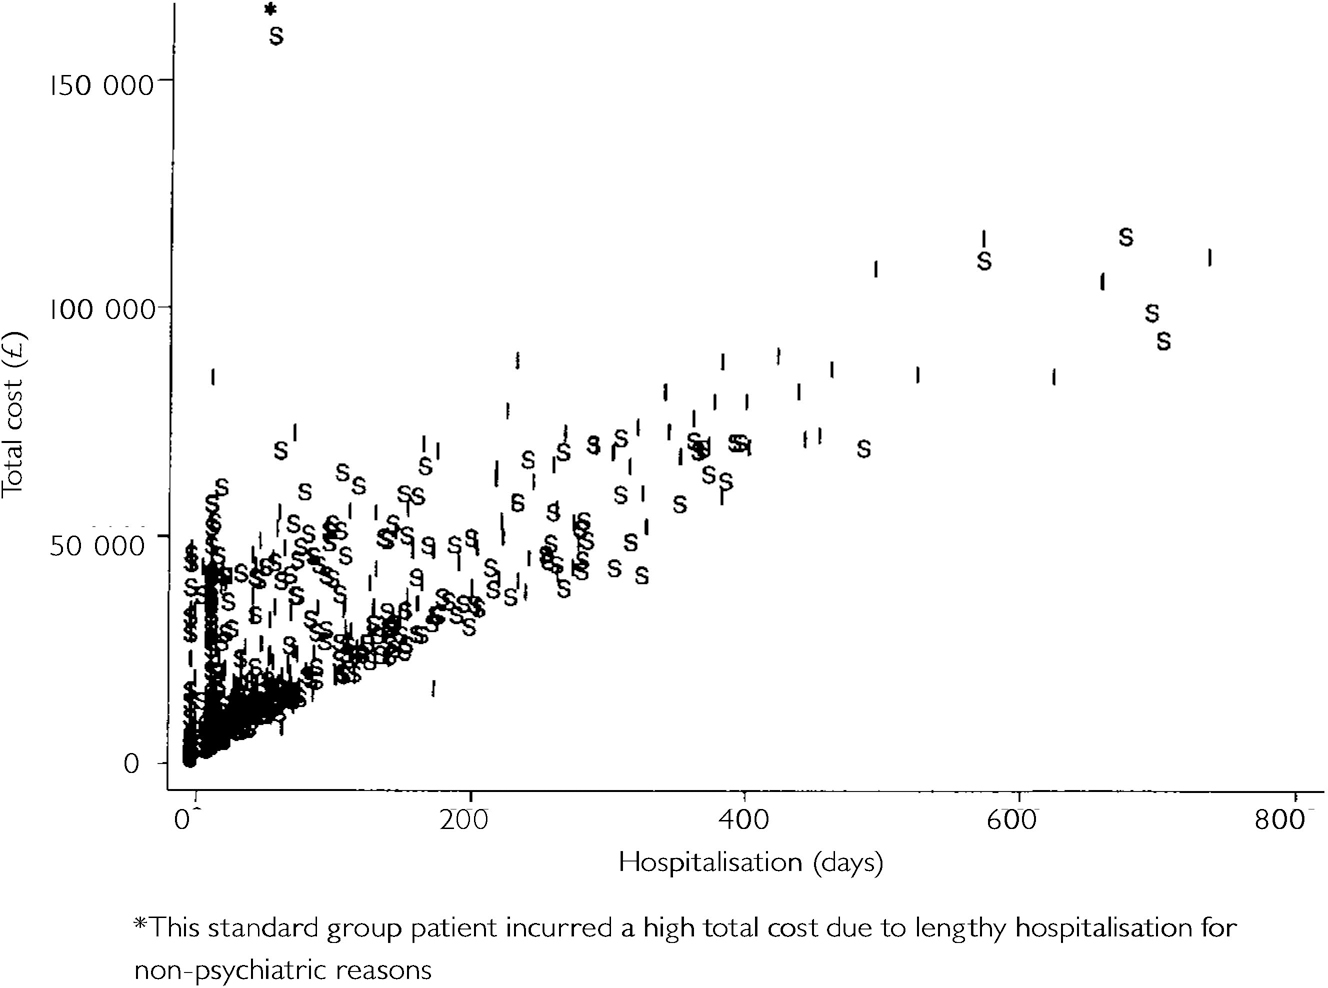
Fig. 2 Total costs (£) v. psychiatric hospitalisation over two years (S, standard; I, intensive).
Figure 3 shows the 95% joint confidence region for the average differences between intensive and standard case management in costs and in psychiatric hospitalisation. The interior of the ellipse gives the range of values for the true average cost and in-patient differences that are compatible (at a 95% confidence level) with the data from the trial. The orientation of the ellipse is a consequence of the strong relationship between total costs and hospitalisation seen in Fig. 2. The zero origin is near the centre of the region, showing the lack of evidence of differences in either costs or hospitalisation. There is thus no evidence that intensive case management is more cost-effective than standard case management, or indeed vice versa.
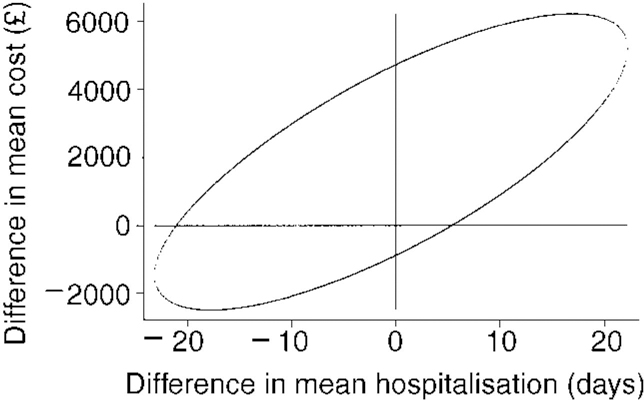
Fig. 3 95% confidence region for the difference in mean two-year cost per patient (£) against difference in psychiatric hospitalisation over two years (intensive—standard)
Sensitivity analyses
Variation of unit cost assumptions made in the analysis did not change the interpretation of the results (Table 4). The discount rate was assumed to be 6% and was varied between 0% and 10%. Capital overheads were assumed to be 20% of the cost of CMHT staff and these were varied between 0% and 40%.
Table 4 Sensitivity analyses for mean two-year cost per patient (£)

| Two-year costs | Intensive (n=335) Mean (s.d.) | Standard (n=332) Mean (s.d.) | Difference in means (intensive-standard) (95% CI) |
|---|---|---|---|
| Main analysis | 24 553 (23 408) | 22 704 (22 000) | 1849 (-1605 to 5304) |
| 0% discount rate | 25 253 (24 083) | 23 364 (22 647) | 1889 (-1666 to 5444) |
| 10% discount rate | 24 257 (23 006) | 22 353 (21 614) | 1903 (-1491 to 5298) |
| 0% capital overheads | 24 039 (23 364) | 22 494 (21 975) | 1544 (-1905 to 4993) |
| 40% capital overheads | 25 068 (23 458) | 22 914 (22 027) | 2154 (-1306 to 5615) |
| Inflation of case managers' costs - non-event to event recorded time | |||
| Minimum inflation rates - intensive 1:1 and standard 2/3:1 | 24 553 (23 408) | 22 494 (21 975) | 2059 (-1394 to 5512) |
| Maximum inflation rates - intensive 1.5:1 and standard 1:1 | 25 326 (23 485) | 22 704 (22 000) | 2621 (-839 to 6082) |
| Maximum intensive inflation rate 1.5:1 and minimum standard inflation rate 2/3:1 | 25 326 (23 485) | 22 494 (21 975) | 2831 (-627 to 6290) |
| Minimum psychiatric in-patient cost | 19 088 (16 287) | 17 618 (17 244) | 1471 (-1079 to 4021) |
| Maximum psychiatric in-patient cost | 41 706 (50 175) | 39 983 (44 121) | 1723 (-5463 to 8909) |
| Minimum cost of accommodation | 19 003 (20 778) | 17 312 (19 086) | 1691 (-1343 to 4725) |
| Maximum cost of accommodation | 38 410 (41 133) | 36 406 (40 564) | 2003 (-4208 to 8215) |
Exploration of patient contact data at each of the four sites suggested that an inflation rate of 1:1 for non-event recorded to event recorded time for both standard and intensive case managers may be too simplistic. For intensive case managers, the evidence suggested that the ratio ranged from a minimum of 1:1 to a maximum of 1.5:1, while for standard case managers, with larger case-loads and less time available for non-patient-specific activities, this range was 2/3:1 to 1:1. Three sensitivity analyses were performed using the following ratios: (a) the minimum inflation rate for both intensive and standard case managers (1:1 and 2/3:1, respectively); (b) the maximum inflation rate for both intensive and standard case managers (1.5:1 and 1:1, respectively); and (c), to influence the results against intensive case management, the maximum inflation rate for intensive case manager and the minimum for standard (1.5:1 and 2/3:1, respectively). None of these analyses altered the conclusion of the main analysis (Table 4).
To study the generalisability of the results of this trial to other locations in the UK, the key cost drivers, psychiatric in-patient care and staffed accommodation, were varied. Minimum and maximum values for the UK were taken from statistics produced by the Chartered Institute of Public Finance and Accountancy which detail the cost of accommodation by local authority (CIPFA, 1998) and the cost of hospital in-patient treatment by speciality for all National Health Service trusts (CIPFA, 1997). Again, the conclusions were unaltered (Table 4).
DISCUSSION
Previous evidence
Research into the resource use or cost implications of intensive case management is scarce and characterised by inadequate sample sizes and limited perspectives. While some studies have reported no significant differences in days in hospital (Reference Marshall, Lockwood and GathMarshall et al, 1995; Reference Holloway and CarsonHolloway & Carson, 1998), the key cost-driver in this patient group, two studies with a broader perspective found cost differences in favour of intensive case management (Reference McCrone, Beecham and KnappMcCrone et al, 1994; Reference Quinlivin, Hough and CrowellQuinlivin et al, 1995), and a third found the opposite (Reference Johnston, Salkeld and SandersonJohnston et al, 1998). None of these studies had a sample size greater than 100 patients in total, casting doubt on the adequacy of statistical power and thus the conclusions. The UK700 Case Management Trial was adequately powered to detect modest differences in costs and took a broad enough perspective to enable the impact of intensive case management on all providing sectors to be determined, not just on the health service or the hospital.
Cost
No statistically significant differences were found between intensive and standard case management in terms of either total two-year costs per patient or the main clinical outcome measures over the two-year period of the trial. Sensitivity analyses did not alter this result. The key cost-drivers in this patient group were in-patient psychiatric costs and staffed accommodation, which together accounted for approximately 73% of the total costs of care. The fact that intensive case management failed to reduce the use of either of these services explains the lack of any significant cost differences between the two groups.
Cost-effectiveness analysis
Figure 3 clearly shows the lack of evidence to suggest that intensive case management is more, or indeed less, cost-effective than standard case management. Although hospitalisation was both the main clinical outcome and a major driver of overall costs, it remains relevant to use this measure in the cost-effectiveness evaluation. However, had one of the secondary outcome measures been used in place of hospitalisation the result that intensive case management is no more cost-effective than standard case management would remain unchanged, since there is no evidence of a difference between randomised groups for any of the secondary measures.
Perspective
Although the perspective taken in this trial was broad, it was not societal, having excluded the impact of intensive case management on patients and families and on the indirect costs associated with employment. Given the lack of differences between the two groups in outcomes and resource utilisation, it seems reasonable to assume that patient and family costs would also differ little. However, the economic impact of case management on relatives and carers is being explored in one of the four centres and will be reported separately. Exploration of months in full-time employment and months unemployed at two-year follow-up revealed no significant differences between the intensive and standard groups, suggesting that the inclusion of these indirect costs would not materially alter the results of the trial.
Policy implications
This multi-centre, randomised trial indicates that intensive case management by mental health workers with a reduced case-load has no clear beneficial effect on costs, clinical outcome, or cost-effectiveness in populations with severe psychoses. The policy of advocating intensive case management for all patients with severe psychosis is not supported by these results and needs to be re-examined.
Clinical Implications and Limitations
CLINICAL IMPLICATIONS
-
▪ No beneficial effects of intensive case management on costs, clinical outcome or cost-effectiveness were observed.
-
▪ The effect of intensive case management on costs was found to be no different in African-Caribbeans than other ethnic groups, or in the patients with severe disability than moderate disability patients.
-
▪ The policy of advocating intensive case management for patients with severe psychosis is not supported by the results of this study and needs to be re-examined.
LIMITATIONS
-
▪ Although the perspective taken in this trial was broad, it was not societal, having excluded costs borne by patients and families. Such costs are being evaluated in one of the four UK700 centres and the results will be reported separately.
-
▪ The perspective was further limited by the exclusion of the indirect costs associated with employment, although differences in employment status between the two groups were explored.
-
▪ These results apply to a broadly defined population with severe psychosis. The economic impact of intensive case management on more specific subgroups is unknown.
ACKNOWLEDGEMENTS
The UK700 Group is a collaborative study team involving four clinical centres:
-
Manchester - Tom Butler, Francis Creed, Janelle Fraser, Peter Huxley, Nick Tarrier and Theresa Tattan.
-
King's Maudsley, London - Tom Fahy, Catherine Gilvarry, Kwame McKenzie, Robin Murray, Jim van Os, Elizabeth Walsh.
-
St Mary's/St Charles', London - John Green, Anna Higgitt, Elizabeth van Horn, Donal Leddy, Patricia Thornton and Peter Tyrer.
-
St George's, London - Robin Bale, Tom Burns, Matthew Fiander, Kate Harvey, Andy Kent and Chiara Samele.
-
Centre for Health Economics, York - Sarah Byford and David Torgerson.
-
London (Statistical Centre) - Simon Thompson and Ian White.
The UK700 trial was funded by grants from the UK Department of Health and NHS Research and Development Programme.


eLetters
No eLetters have been published for this article.