Medically unexplained symptoms are a common reason for admission to general hospitals (Fink, Reference Fink1992, Reference Fink1993). There is evidence that adults who report unexplained symptoms remember more physical illness during their childhood then other people (Reference BianchiBianchi, 1971; Reference Burns and NicholsBurns & Nichols, 1972; Reference Mohamed, Weisz and WaringMohamed et al, 1978; Reference Baker and MerkseyBaker & Merksey, 1982; Reference Craig, Boardman and MillsCraig et al, 1993). Such early experience may lead young people to focus on innocent physical symptoms which might otherwise be ignored. Most previous research is retrospective and prone to recall bias. Using prospective data from a national birth cohort study, we have previously shown that unexplained abdominal pain in childhood is associated with physical illness in parents (Reference Hotopf, Carr and MayouHotopf et al, 1998); and that medically unexplained symptoms in adult life are associated with experiencing abdominal pain in childhood as well as with having parents who rate their health as poor (Reference Hotopf, Mayou and WadsworthHotopf et al, 1999). The present report looks at the relationship between early illness experience and medically unexplained hospital admissions in adult life. The main hypotheses were that: (a) children whose parents reported poor health would have high rates of medically unexplained hospital admissions in adulthood; (b) children who experienced physical illness would be at risk of hospital admissions later for unexplained symptoms; (c) measures of childhood maladjustment, and neuroticism, were also risk factors for subsequent admissions for unexplained symptoms.
METHOD
The Medical Research Council National Survey of Health and Development was established in 1946. It was based on a stratified sample of all single, legitimate births occurring in England, Wales and Scotland in one week of March 1946 (n=5362). The sampling procedure and follow-up has been described in detail elsewhere (Reference Wadsworth, Mann and RodgersWadsworth et al, 1992). The stratification was based on the father's social class: all children born to farm labourers and professionals were surveyed, while those born to other manual labourers were sampled in a ratio of 1:4. Since the Survey was set up, 19 waves of data-gathering have been performed; ten before the children had reached the age of 16, the remainder at ages 19, 20, 22, 23, 25, 26, 31, 36 and 43 years. The most recent wave of data-gathering was in 1989 (age 43), when 3262 survey members were interviewed, representing 61% of the original sample. When those survey members who had died, emigrated or permanently refused to participate were excluded from the denominator, this proportion rose to 85%.
Exposures
A range of different variables was collected before the children had reached 16, and these will form the main exposures for this paper. They are organised into three main domains: (a) the health of the parents during the childhood of the subjects; (b) the health of the subjects in childhood; and (c) the personality or behaviour of the subjects in childhood.
-
(a) Parental health was enquired after in 1961 (when the children were aged 15). The mothers were asked to rate their own health and that of their husbands on a five-point scale (‘very good’ to ‘poor’). They were also asked directly about a range of health complaints, including ‘nerves’. Mothers also completed the Maudsley Personality Inventory neuroticism scale (Reference EysenckEysenck, 1958).
-
(b) The child's health was measured in several ways. First, the survey had data on all childhood diseases which had led to at least three weeks' stay in hospital. These were serious physical diseases, including poliomyelitis, tuberculosis, and serious orthopaedic conditions such as congenital dislocation of the hip. Second, the mother's report of abdominal pains at ages 7, 11 and 15 was used to generate a variable, “persistent unexplained abdominal pain”, which has been described in greater detail in a previous paper (Reference Hotopf, Carr and MayouHotopf et al, 1998). Finally, childhood illness was measured from reports of school absence. School absence was determined from school records collected between the ages of 6 and 10 years and also from the teachers' reports at ages 13 and 15 years.
-
(c) Finally, we used two main measures to assess childhood personality and behaviour. The Pintner Personality Scale (Reference Pintner and ForlanerPintner & Forlaner, 1938), which measures neuroticism and extroversion, was administered at 13 years. Teachers' reports of the children's behaviour in class at age 13 were also used.
Outcome
At each wave of data-gathering all subjects were asked whether they had been admitted to hospital since they were last seen by the Survey. For subjects who had missed the previous wave of data-gathering, the interviewer was given the date of last contact by the Survey, in order to ensure that hospital admissions which would have been reported in the previous wave were recorded. For each admission a questionnaire was sent to the hospital consultant or medical records administrator, requesting the following details: diagnosis on admission; investigations performed; diagnosis on discharge; and treatment given. The physicians or surgeons were encouraged to give full details of the admission, and often provided discharge summaries or copies of the case notes. These questionnaires have been put on microfiche. Hence details of all hospital admissions for the cohort to age 43 years were available, if needed.
Because medically unexplained admissions to hospital are the focus of this study, and these are not coded separately or given a clearly defined ICD code in the World Health Organization's International Classification of Diseases, two investigators (M.H. and C.W.J.) viewed each microfiche for the entire cohort. They noted any admission which appeared to have been medically unexplained (investigations were negative, or a discharge diagnosis suggested that the cause of the initial complaint was unknown) (269 admissions in 206 survey members). All details of such admissions, including diagnosis on admission, discharge diagnosis, treatments given, investigations performed and any further incidental comments made by the physician, were recorded verbatim in a structured manner. In order to prevent potential bias, gender was disguised where possible (this was impossible when, for example, the chief complaint was gynaecological), and any comments regarding family histories of illness, or illness before the age of 15, were omitted.
Medically unexplained hospital admissions
Medically unexplained admissions were defined as follows.
-
(a) The subject was admitted for a physical symptom.
-
(b) There was an absence of evidence that a defined organic disease caused the symptom. This was because at least one of the following conditions were satisfied:
-
(i) The final diagnosis suggested doubt surrounding diagnosis (e.g. abdominal pain, cause unknown).
-
(ii) The final diagnosis used a diagnostic entity of doubtful status (e.g. chronic appendicitis, low back pain).
-
(iii) The final diagnosis was a recognised medically unexplained syndrome (e.g. fibromyalgia, irritable bowel syndrome).
-
(iv) The results of the investigations performed were normal, or, if abnormal, the abnormality was not felt to be relevant to the presenting symptom.
-
-
(c) Where there was information on pyrexia, white cell count, erythrocyte sedimentation rate (ESR), or other non-specific indicators of inflammation or infection, these values were normal or negative.
Four medically qualified investigators (M.H., S.W., C.W.J., and R.M.) determined the likelihood that each admission was medically unexplained using the above definition. The main problem faced in diagnosing medically unexplained admissions was that in many cases there was insufficient evidence to be able to be sure that the admission was truly unexplained. For example, in many cases the initial diagnosis would read ‘abdominal pain’, the final diagnosis ‘abdominal pain ?cause’ and the treatment might have been appendectomy. Such information implies that the patient was admitted with abdominal pain, had an appendectomy, but at discharge the diagnosis remained uncertain. Thus, it implies that the appendix was not inflamed. It seemed very likely that such admissions were unexplained, in the sense that the clinicians had failed to detect a defined underlying cause for the symptoms; however, it was also possible that the presentation was due to a transient undiagnosed infectious illness, which was simply not tested for. In order to avoid misdiagnosing such presentations as medically unexplained, the presence of non-specific indicators of infection or inflammation (such as raised white cell counts, pyrexia, raised ESR) rendered such cases ineligible to qualify as medically unexplained admissions.
Operational criteria
In order to increase the degree of certainty that an admission was medically unexplained, a four-point scale was devised, with the categories: not unexplained (meaning the admission did not meet the criteria laid down above); possibly unexplained; probably unexplained; and definitely unexplained, as defined below.
Possible. The conditions described above were met, but there was a shortage of desirable information: for example, when the diagnosis on admission was suspected appendicitis, and the diagnosis on discharge was abdominal pain, cause unknown. This diagnosis implied a medically unexplained admission, but further information would have been required to say confidently that there was an absence of defined organic pathology.
Probable. The conditions for medically unexplained admission were met, and there was either more information (suggesting that a reasonable degree of thoroughness was used to investigate the symptoms), or the physician mentioned possible psychosocial reasons for the presentation, or gave a diagnosis which strongly implies medically unexplained symptoms (e.g. irritable bowel syndrome, atypical chest pain, chronic fatigue syndrome).
Definite. The conditions for medically unexplained admission were met, and there was evidence of extensive and thorough investigations which were all given normal or negative results; and the physician mentioned possible psychosocial reasons for the presentation, or gave a diagnosis which strongly implies medically unexplained symptoms (e.g. irritable bowel syndrome, atypical chest pain, fibromyalgia).
The point of these categories was to increase the degree of confidence with which the diagnosis of unexplained symptoms could be made. For some subjects, rich and complete information was available on a variety of investigations, with a clear final diagnosis of a medically unexplained syndrome. These would be designated as definite cases. In others, there was evidence either from the investigations or from the final diagnosis that the symptoms were unexplained; these fell into the probable category. The possible category would include the example of abdominal pain given above: the cause for the presentation was never determined, but there was insufficient evidence to be clear that the presentation was truly medically unexplained.
Two further categories were included: mixed admissions, where there was clear evidence of defined organic pathology but significant psychological ‘overlay’ was detected; and factitious illness.
The four investigators rated the entire sample. Agreement between the investigators for the categories ‘factitious’ and ‘mixed’ was unanimous for the small number (3) of relevant cases. For the remaining admissions the weighted kappa between investigators was 0.65-0.80. Further work has suggested that this approach can be generalised and that psychiatrists achieve acceptable agreement with physicians (Reference Reid, Crayford and NimuanReid et al, 1999).
For the purposes of this article, a medically unexplained admission was diagnosed when at least three of the four investigators thought that the admission was at least probably medically unexplained (n=95 survey members).
Statistical analyses
Statistical analyses were performed using STATA computer software (StataCorp, 1997). As medically unexplained hospital admissions could occur at any time between age 15 and age 43, rates of first admissions were analysed. The risk set was defined as all participants to the study from age 15 onwards (n=4603). The time from the 15th birthday until first admission for medically unexplained symptoms was calculated. For those who had not been admitted to hospital, time from age 15 until the last point of contact with the survey was calculated. Subjects who dropped out or who died before the last wave of data-gathering contributed person-years at risk up to the point of their last contact. For example, if a survey member had completed the assessment at age 26, but subsequently died aged 31, he or she would contribute person-years of risk up to the last point of contact with the survey, and not up to the point of death. The reason for this was that the outcome depended upon the survey member giving information; this would have been available up to the age of 26, but not between the ages 26 and 31. Using these data, rates of admission according to the key exposure variables were calculated.
Cox's proportional hazards model was used to calculate hazard ratios. These analyses were controlled for gender and father's social class, and were adjusted for sampling weights. Gender-exposure interactions were derived, and where these were statistically significant, results were stratified for gender. Cox's proportional hazard model assumes that relative risk calculated over the period of follow-up is constant. In other words, if the relative risk of developing the outcome is 2, the model assumes that this increased risk among the exposed applies throughout the period of follow-up — thus the hazards remain proportional. In order to test this assumption, the results may be represented graphically using Aalen plots. These plot the cumulative rate of the outcome over the duration of the follow-up period according to exposure group. If hazards are proportional, the plot would be expected to diverge at a constant rate. Discontinuities in the rates (for example, points where a relatively steep line for those exposed drops off, and crosses the trajectory of the unexposed) suggest that the proportionality assumption has been broken. Aalen plots are shown here for the main associations we detected.
RESULTS
Features of medically unexplained admissions to hospital
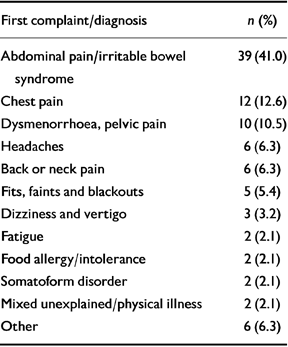
Table 1 shows the presenting symptoms for medically unexplained admissions. Abdominal pain was by far the most common reason for such admission. This was followed by chest and pelvic pain, headaches, back pain and fits or faints. Only two subjects had had hospital admissions quite clearly attributed to somatoform disorders, indicating how rarely such a category is used.
Table 1 Presenting symptoms for survey members admitted with unexplained symptoms (n=95)
| First complaint/diagnosis | n (%) |
|---|---|
| Abdominal pain/irritable bowel syndrome | 39 (41.0) |
| Chest pain | 12 (12.6) |
| Dysmenorrhoea, pelvic pain | 10 (10.5) |
| Headaches | 6 (6.3) |
| Back or neck pain | 6 (6.3) |
| Fits, faints and blackouts | 5 (5.4) |
| Dizziness and vertigo | 3 (3.2) |
| Fatigue | 2 (2.1) |
| Food allergy/intolerance | 2 (2.1) |
| Somatoform disorder | 2 (2.1) |
| Mixed unexplained/physical illness | 2 (2.1) |
| Other | 6 (6.3) |
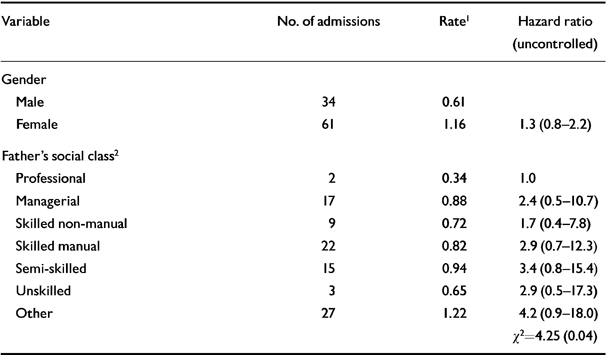
Table 2 shows the socio-demographic characteristics of individuals with unexplained admissions. The slight excess of females was not statistically significant. There was a clear relationship between medically unexplained symptoms and social class, with higher rates in non-professional classes.
Table 2 Socio-demographic variables and rates of medically unexplained admissions throughout adulthood
| Variable | No. of admissions | Rate1 | Hazard ratio (uncontrolled) |
|---|---|---|---|
| Gender | |||
| Male | 34 | 0.61 | |
| Female | 61 | 1.16 | 1.3 (0.8-2.2) |
| Father's social class2 | |||
| Professional | 2 | 0.34 | 1.0 |
| Managerial | 17 | 0.88 | 2.4 (0.5-10.7) |
| Skilled non-manual | 9 | 0.72 | 1.7 (0.4-7.8) |
| Skilled manual | 22 | 0.82 | 2.9 (0.7-12.3) |
| Semi-skilled | 15 | 0.94 | 3.4 (0.8-15.4) |
| Unskilled | 3 | 0.65 | 2.9 (0.5-17.3) |
| Other | 27 | 1.22 | 4.2 (0.9-18.0) |
| χ2=4.25 (0.04) | |||
Relationship between unexplained hospital admissions and family ill-health
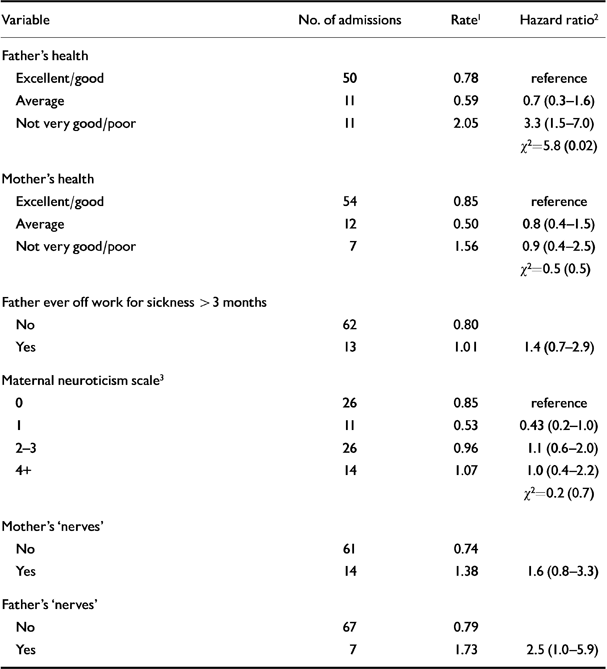
Table 3 shows the relationships between unexplained hospital admissions and illhealth in the family during the subject's childhood. Perceived ill-health in the father and paternal ‘nerves’ were found to be associated with the outcome. Figure 1 shows the Aalen plot for paternal health and Fig. 2 shows the Aalen plot for paternal ‘nerves’. These demonstrate that over the period of follow-up the rates in the three groups remained approximately proportionate.
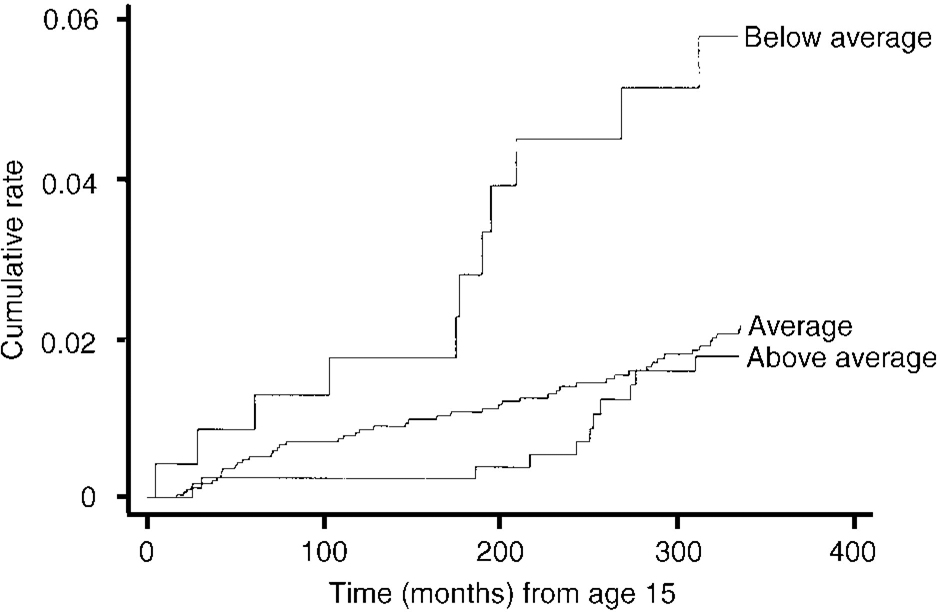
Fig. 1. Aalen plot of rates of unexplained hospital admissions and perceived health of father.
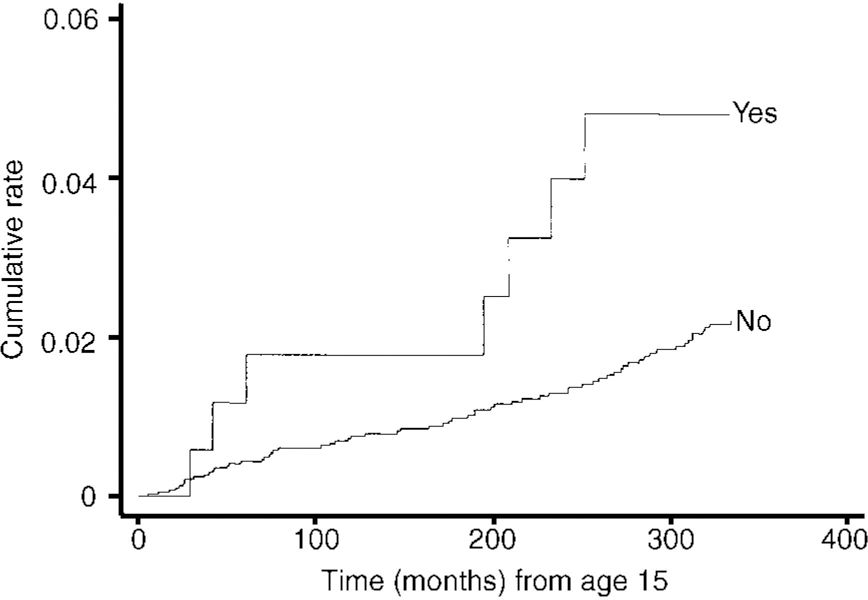
Fig. 2 Aalen plot of paternal ‘nerves’ and rate of medically unexplained hospital admissions.
Table 3 Relationship between family ill-health (when child was aged 15) and unexplained hospital admissions
| Variable | No. of admissions | Rate1 | Hazard ratio2 |
|---|---|---|---|
| Father's health | |||
| Excellent/good | 50 | 0.78 | reference |
| Average | 11 | 0.59 | 0.7 (0.3-1.6) |
| Not very good/poor | 11 | 2.05 | 3.3 (1.5-7.0) |
| χ2=5.8 (0.02) | |||
| Mother's health | |||
| Excellent/good | 54 | 0.85 | reference |
| Average | 12 | 0.50 | 0.8 (0.4-1.5) |
| Not very good/poor | 7 | 1.56 | 0.9 (0.4-2.5) |
| χ2=0.5 (0.5) | |||
| Father ever off work for sickness >3 months | |||
| No | 62 | 0.80 | |
| Yes | 13 | 1.01 | 1.4 (0.7-2.9) |
| Maternal neuroticism scale3 | |||
| 0 | 26 | 0.85 | reference |
| 1 | 11 | 0.53 | 0.43 (0.2-1.0) |
| 2-3 | 26 | 0.96 | 1.1 (0.6-2.0) |
| 4+ | 14 | 1.07 | 1.0 (0.4-2.2) |
| χ2=0.2 (0.7) | |||
| Mother's ‘nerves’ | |||
| No | 61 | 0.74 | |
| Yes | 14 | 1.38 | 1.6 (0.8-3.3) |
| Father's ‘nerves’ | |||
| No | 67 | 0.79 | |
| Yes | 7 | 1.73 | 2.5 (1.0-5.9) |
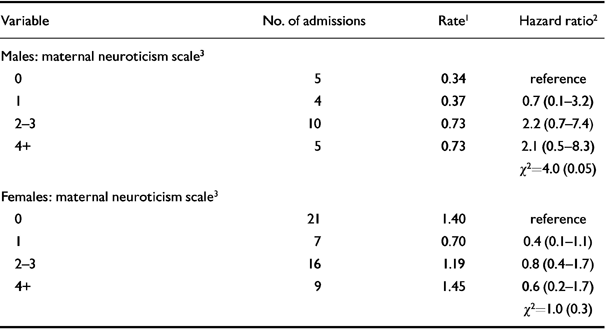
No clear pattern emerged regarding maternal neuroticism; however, this variable did have a statistically significant interaction term with gender (χ2=4.9, 1 d.f., P=0.03). Table 4 demonstrates the effect of this interaction: maternal neuroticism was associated with an increased risk of the outcome in males but not females.
Table 4 Relationship between maternal neuroticism and unexplained hospital admissions according to gender
| Variable | No. of admissions | Rate1 | Hazard ratio2 |
|---|---|---|---|
| Males: maternal neuroticism scale3 | |||
| 0 | 5 | 0.34 | reference |
| 1 | 4 | 0.37 | 0.7 (0.1-3.2) |
| 2-3 | 10 | 0.73 | 2.2 (0.7-7.4) |
| 4+ | 5 | 0.73 | 2.1 (0.5-8.3) |
| χ2=4.0 (0.05) | |||
| Females: maternal neuroticism scale3 | |||
| 0 | 21 | 1.40 | reference |
| 1 | 7 | 0.70 | 0.4 (0.1-1.1) |
| 2-3 | 16 | 1.19 | 0.8 (0.4-1.7) |
| 4+ | 9 | 1.45 | 0.6 (0.2-1.7) |
| χ2=1.0 (0.3) | |||
Relationship between unexplained hospital admissions and childhood ill-health
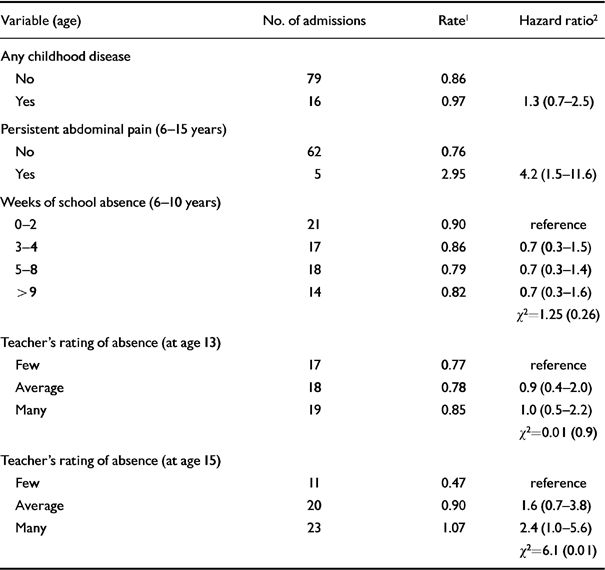
Table 5 shows the relationships between the various measures of childhood ill-health and the outcome. There was no association between well-defined childhood diseases and subsequent hospital admissions for medically unexplained symptoms. There was a strong association between persistent abdominal pain in childhood and the outcome: children who complained of persistent abdominal pain were over four times as likely to go on to experience unexplained hospital admissions as those who did not. Figure 3 shows the Aalen plot for this relationship, which suggests the proportionality assumption was not broken.
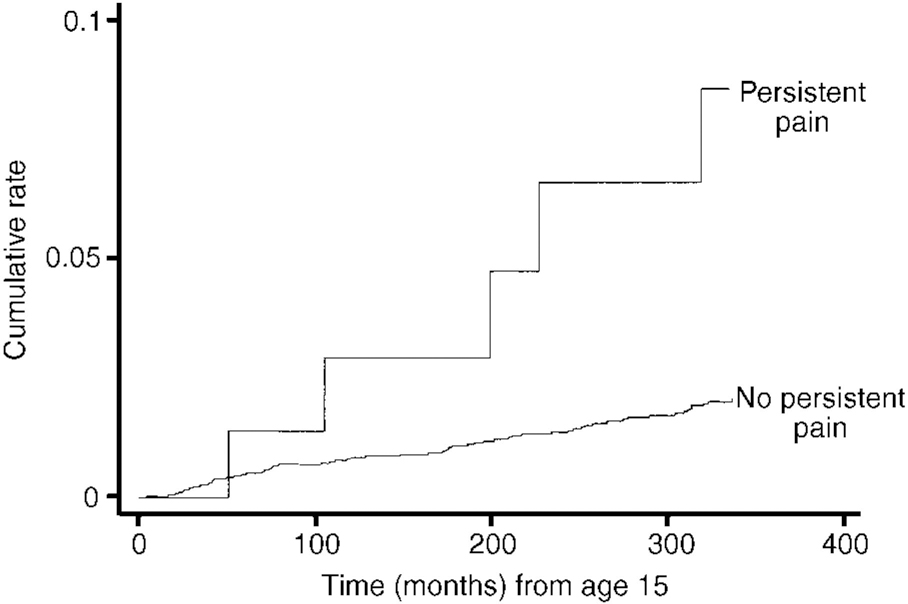
Fig. 3 Aalen plot of persistent abdominal pain in childhood and rates of medically unexplained hospital admissions.
Table 5 Relationship between defined childhood illness and unexplained hospital admissions
| Variable (age) | No. of admissions | Rate1 | Hazard ratio2 |
|---|---|---|---|
| Any childhood disease | |||
| No | 79 | 0.86 | |
| Yes | 16 | 0.97 | 1.3 (0.7-2.5) |
| Persistent abdominal pain (6-15 years) | |||
| No | 62 | 0.76 | |
| Yes | 5 | 2.95 | 4.2 (1.5-11.6) |
| Weeks of school absence (6-10 years) | |||
| 0-2 | 21 | 0.90 | reference |
| 3-4 | 17 | 0.86 | 0.7 (0.3-1.5) |
| 5-8 | 18 | 0.79 | 0.7 (0.3-1.4) |
| > 9 | 14 | 0.82 | 0.7 (0.3-1.6) |
| χ2=1.25 (0.26) | |||
| Teacher's rating of absence (at age 13) | |||
| Few | 17 | 0.77 | reference |
| Average | 18 | 0.78 | 0.9 (0.4-2.0) |
| Many | 19 | 0.85 | 1.0 (0.5-2.2) |
| χ2=0.01 (0.9) | |||
| Teacher's rating of absence (at age 15) | |||
| Few | 11 | 0.47 | reference |
| Average | 20 | 0.90 | 1.6 (0.7-3.8) |
| Many | 23 | 1.07 | 2.4 (1.0-5.6) |
| χ2=6.1 (0.01) | |||
Because abdominal and pelvic pain were the most common presenting symptoms in the medically unexplained hospital admissions, it was possible that this relationship was simply the result of a continuation of the same symptoms into early adult life. The Aalen plot demonstrates that the increased risk of childhood abdominal pain continues to act throughout adult life. In order to explore this further, the analyses were repeated for two separate groups: those whose admissions were dominated by abdominal or pelvic pain, and those who did not have these symptoms. Surprisingly, childhood abdominal pain was a less powerful predictor of admissions for unexplained abdominal pain or pelvic pain in later life (hazard ratio (HR) 2.8; 0.5-14.7) than for admissions not connected with these symptoms (HR 5.4; 1.5-19.4).
Absence from school was inconsistently associated with the outcome. Before the age of 15 there was no association. However, children whose teachers rated them as frequently absent at age 15 had an increased likelihood of subsequently being admitted to hospital with unexplained symptoms.
Relationship between unexplained hospital admissions and childhood behaviour and personality
Table 6 shows the relationships between unexplained admissions and ratings of childhood behaviour and personality. There was no association with neuroticism on the Pintner scale, but there was an association with extroversion; extrovert children were more likely to be admitted for unexplained symptoms. It is difficult to show a consistent relationship with the teachers' ratings of behaviour in the children. There were no associations between low energy, day-dreaming or disobedience, and unexplained hospital admissions. However, there was a relatively strong association between being a poor worker, and having poor powers of concentration, and the outcome.
Table 6 Relationship between ratings of personality and behaviour and subsequent unexplained hospital admissions

| Variable (all at age 13) | No. of admissions | Rate1 | Hazard ratio2 |
|---|---|---|---|
| Neuroticism on Pintner scale | |||
| Non-neurotic | 22 | 0.70 | reference |
| Mid-neurotic | 27 | 0.98 | 1.5 (0.7-2.9) |
| Neurotic | 21 | 0.76 | 1.3 (0.6-2.6) |
| χ2=0.6 (0.44) | |||
| Introversion on Pintner scale | |||
| Introvert | 14 | 0.53 | reference |
| Ambivert | 22 | 0.74 | 1.3 (0.6-3.0) |
| Extrovert | 34 | 1.09 | 2.0 (1.0-4.1) |
| χ2=5.31 (0.02) | |||
| Day-dreaming | |||
| Seldom | 43 | 0.97 | reference |
| Sometimes | 34 | 0.80 | 1.0 (0.6-1.6) |
| Frequently | 4 | 0.71 | 1.1 (0.4-3.4) |
| χ2=0 (1) | |||
| Energy levels | |||
| Never tired | 7 | 1.08 | reference |
| Normal energy levels | 69 | 0.86 | 0.8 (0.3-2.0) |
| Always tired | 3 | 0.62 | 0.6 (0.1-2.7) |
| χ2=0.72 (0.4) | |||
| School work | |||
| Very hard worker | 15 | 0.71 | reference |
| Average | 53 | 0.85 | 1.2 (0.6-2.5) |
| Poor worker or lazy | 12 | 1.46 | 2.8 (1.2-6.6) |
| χ2=6.94 (0.008) | |||
| Power of concentration | |||
| High | 5 | 0.48 | reference |
| Average | 60 | 0.86 | 1.4 (0.5-4.2) |
| Little/none | 16 | 1.30 | 2.7 (0.8-8.8) |
| χ2=6.43 (0.01) | |||
| Disobedience | |||
| Seldom or never | 63 | 0.89 | reference |
| Sometimes | 19 | 0.88 | 1.2 (0.6-2.0) |
| Frequently | 1 | 0.61 | 1.0 (0.1-6.9) |
| χ2=0.14 (0.7) | |||
Individuals who had had a medically unexplained hospital admission as a child were at increased risk of having been admitted to a ward during their adult life (unadjusted odds ratio (OR) 6.9; 95% CI: 4.1-11.5).
DISCUSSION
Main findings
The main findings of this paper are: (a) some measures of parental ill-health are associated with later admissions to hospital for unexplained symptoms. Perceived health in the father, and father's ‘nerves’, were both associated; mother's ill-health was not associated, and maternal neuroticism was a risk factor in male, but not in female, subjects. (b) Physical diseases in childhood were not associated with later unexplained admissions; however, abdominal pain in childhood was, as was school absence at the age of 15. Finally, (c) some childhood personality and behavioural traits were associated, including extroversion, poor concentration and poor work performance. It is important to note, however, that many of these risk factors were relatively uncommon, and the majority of those who were admitted to hospital with unexplained symptoms were not exposed to them.
Shortcomings
It is likely that many more hospital admissions in this sample were medically unexplained, but we had insufficient details to make the diagnosis in those cases. Such incomplete ascertainment could lead to bias if the diagnosis of unexplained admissions was influenced by the exposures under study. For example, if a childhood history of severe physical illness was taken into account in the diagnosis, this could lead to an exaggeration of the relationships detected. This could account for the relationship between unexplained abdominal pain and later hospital admissions, as consultants might have been more convinced the symptoms were unexplained, given this history. However, it seems unlikely that this would influence the relationships between hospital admissions and parental ill-health. Ascertainment of some of the childhood risk factors was also incomplete; these factors may have been non-random, and led to biases which are difficult to predict.
Mechanisms
These findings partially confirm previous reports that exposure to illness in childhood is a risk factor for subsequent unexplained symptoms. Father's ill-health appears more important than mother's, and exposure to illness in the individual in childhood seems to be specific to certain types of ill-health. Thus, severe chronic physical diseases are not associated with later unexplained hospital admissions, whereas persistent abdominal pain in childhood is. This is consistent with the relatively good psychosocial outcome for the former and the poor psychosocial outcome for the latter, which has been reported elsewhere (Reference Hotopf, Carr and MayouHotopf et al, 1998; Reference Pless, Cripps and DaviesPless et al, 1989). These studies suggest that future interventions aimed at reducing the longer-term harmful effects of paediatric illness on psychological health should be targeted at children with unexplained symptoms. Paediatricians should be reassured that severe chronic diseases have not been found to be associated with later unexplained symptoms.
The relationship between abdominal pain in childhood and subsequent unexplained hospital admissions was not due to a simple continuation of the symptom in adulthood. Instead, children with persistent abdominal pain appear to go on to develop a range of other symptoms relating to different bodily systems. This concurs with evidence suggesting that medically unexplained syndromes such as irritable bowel syndrome, fibromyalgia and chronic fatigue syndrome all have considerable overlap with one another (Reference Kirmayer, Robbins and KapustaKirmayer et al, 1988; Reference Yunus, Masi and AldagYunus et al, 1989; Reference Goldenberg, Simms and GeigerGoldenberg et al, 1990; Reference Lane, Manu and MatthewsLane et al, 1991; Reference Hudson, Goldenberg and PopeHudson et al, 1992; Reference Nooregaard, Bulow and PrescottNooregaard et al, 1993). These appear not to be specific syndromes, but overlapping conditions.
It is unclear how the relationship between paternal ill-health and hospital admissions operates, and why it should be present in the father and not the mother. Unfortunately, there were insufficient details on the exact nature of the fathers' health problems. One intriguing possibility derives from the method of data collection: the father's health status was reported by the mother. Thus, the ‘active ingredient’ behind this association may be having a parent who identifies and reacts to illness in others in the family. There is some evidence from laboratory studies of social learning that subjects react to pain at a lower threshold when in the presence of a model who cannot tolerate the pain (Craig & Weiss, Reference Craig and Weiss1971, Reference Craig and Weiss1972). Individuals from families where one parent is distressed by symptoms may, therefore, react to symptoms more readily than those who do not have such experiences. There is some (retrospective) evidence that avoidant illness behaviour (for example, retiring to bed with a headache) is influenced by parental reactions to common illnesses (Reference Hotopf and NoskinTurkat & Noskin, 1983). Such parental reactions may also affect illness behaviour in well-defined diseases such as diabetes (Reference TurkatTurkat, 1982).
There was a relationship between unexplained hospital admissions and childhood personality; however, this seemed to operate in a different direction to that predicted by our hypothesis. Neuroticism and other ‘internalising’ traits such as fatigue and day-dreaming were not associated, but extroversion and other similar traits (poor concentration and poor school work) were. This may reflect the nature of the outcome used — i.e. actual use made of services in cases of unexplained symptoms. It may be that more introverted individuals have precisely the same rates of unexplained symptoms, but do not contact their doctors or visit accident and emergency departments.
This paper indicates that certain childhood risk factors are associated with later unexplained symptoms leading to hospital admissions. The diagnoses of such unexplained symptoms tend to be diagnoses of exclusion, made following exhaustive investigations. Research such as this may be able to build up a profile of risk factors which allow clinicians to make positive diagnoses of unexplained symptoms.
Clinical Implications and Limitations
CLINICAL IMPLICATIONS
-
▪ Children whose fathers have poor general health are more likely to be admitted to hospital with unexplained symptoms.
-
▪ Medically unexplained symptoms in childhood also predict subsequent hospital admissions for unexplained symptoms.
-
▪ There is no evidence that children with clear-cut organic physical disease are more likely to be admitted for unexplained symptoms in later life.
LIMITATIONS
-
▪ The rates of admissions for unexplained symptoms were very low in this cohort, indicating that we may not have been able to ascertain a sizeable proportion of them.
-
▪ The nature of father's ill-health was poorly characterised.
-
▪ Not all the exposures were comprehensively ascertained.


eLetters
No eLetters have been published for this article.