The association between depression and an increased risk of death has been established for major depressive disorder (Reference Tsuang and WoolsonTsuang & Woolson, 1977), but remains inconclusive for more prevalent minor or mild depressive syndromes. Earlier studies in the elderly differed in their assessment of depression, in controlling for physical health, functional impairments and organic disorder and in follow-up time (Reference Davidson, Dewey and CopelandDavidson et al, 1988; Reference Fredman, Schoenbach and KaplanFredman et al, 1989; Reference Thomas, Kelman and KennedyThomas et al, 1992; Reference Pulska, Pahkala and LaippalaPulska et al, 1998; Reference Sharma, Copeland and DeweySharma et al, 1998). Although the association between depression and mortality may be gender-related (Reference Zheng, Macer and CroftZheng et al, 1997), this possible effect modifier has rarely been examined. In order to establish the relationship between depression and mortality in the elderly, studies are needed that include a range of potential risk factors, with a sufficient sample size and follow-up time, and specific attention to gender differences and to different depression severity levels. The current study has these characteristics.
METHOD
Sample
This study is part of the Amsterdam Study of the Elderly (AMSTEL): a longitudinal study designed to screen a large and representative sample of non-institutionalised community-living older persons on mental health problems, medical diagnoses and demographic characteristics. The sampling and data collection procedures and non-response have been described in depth elsewhere (Launer et al, Reference Launer, Dinkgreve and Jonker1993, Reference Launer, Wind and Deeg1994). In short, a random sample was drawn from the registers of 30 general practices in the city of Amsterdam. These registers include almost all of the non-institutionalised population, who have to consult their general practitioner (GP) to gain access to the health care system. The mean proportion of elderly individuals (15%) and the profile, in terms of age and gender, of the general practice population over 65 years of age corresponded to the non-institutionalised Amsterdam population. An age-stratified sample was drawn in the 65-84-year age bracket, and all those who responded and gave their informed consent were interviewed (71.5%). In total, 4051 subjects were enrolled for the baseline interviews, which were conducted between May 1990 and November 1991.
Baseline measures
A 1-hour interview was developed to gather information on psychiatric symptoms, demographic and medical status, previous history and family history. The interview consisted of the Dutch translation of the Mini-Mental State Examination (MMSE; Reference Folstein, Folstein and McHughFolstein et al, 1975), all Geriatric Mental State (GMS) items related to organic, affective and anxiety syndromes (Reference Copeland, Dewey and Griffiths-JonesCopeland et al, 1986), the Activities of Daily Living (ADL) scale (Reference Katz, Ford and MoskowitzKatz et al, 1963), the Instrumental Activities of Daily Living (IADL) scale (Reference Lawton and BrodyLawton & Brody, 1969) and the Cambridge Mental Disorders of the Elderly Examination (CAMDEX) interview (Reference Roth, Tym and MountjoyRoth et al, 1986). The interview was administered during home visits by lay interviewers who were specially trained using video sessions and were regularly supervised.
Depression and dementia
Diagnoses of dementia and depression were made according to the GMS-AGECAT system (Copeland et al, Reference Copeland, Dewey and Griffiths-Jones1986, Reference Copeland, Dewey and Henderson1988). The Dutch-language version has proven reliability for epidemiological work in replication studies (Reference Hooijer, Jonker and DeweyHooijer et al, 1991). Depression caseness was defined as GMS-AGECAT level 3 or higher. A distinction is made between neurotic and psychotic depression, indicating increasing severity levels of depression.
Socio-demographic factors
Potentially confounding covariates were age, gender and level of education. Educational status was dichotomised into lower (primary school or less) and higher (more than primary school) education.
Environmental vulnerability factors
Marital status was assessed based on the questions in GMS-AGECAT.
Physical health
The presence of chronic diseases was assessed with the pertinent CAMDEX questions on cardiovascular disease, cancer, lung disease, diabetes, Parkinson's disease, arthritis and epilepsy. Cognitive status was assessed by MMSE score. Subjects were considered to have functional disability if their ADL or IADL scores were two or more points below the maximum score on the respective scales.
Mortality
The follow-up for recording deaths extended from the date of the clinical examination until 1 July 1996. The dates of death were ascertained from the registers of the municipality of Amsterdam, or the municipalities to which subjects had moved during the study period. The follow-up period was 6 years, with an average of 55.5 months (s.d. = 16.7, range 1-73 months). Data were missing on six subjects (0.1%).
Data analysis
Baseline sample characteristics were compared between men and women using χ2 statistics. Mortality rates per 1000 person-years were calculated according to depressed mood status. Bivariate associations of mortality at follow-up (deceased or alive on 1 July 1996) with independent variables at baseline were assessed by calculating relative risks. When the 95% confidence interval of the latter did not include one, the association was regarded as statistically significant.
Kaplan-Meier curves and Cox proportional hazard regression models were used to examine further the association between depression and time to mortality in men and women separately. The risk of mortality was expressed as the mortality rate ratio (RR). In multivariate analysis, the effect of depression on mortality was studied for the two types of depression (neurotic and psychotic), with successive adjustment for potential confounding factors: sociodemographic factors, environmental factors, cardiovascular and other chronic diseases, cognitive decline and functional disability. As disability may be a consequence of depression (Reference Penninx, Guralnik and FerrucciPenninx et al, 1998) and therefore may cause over-correction for the effect of depression on mortality, this variable was entered as a last, separate step. The difference between two mortality RR values was considered to be statistically significant if the confidence intervals of either variable did not overlap with the value of the opposing variable.
RESULTS
Sample characteristics
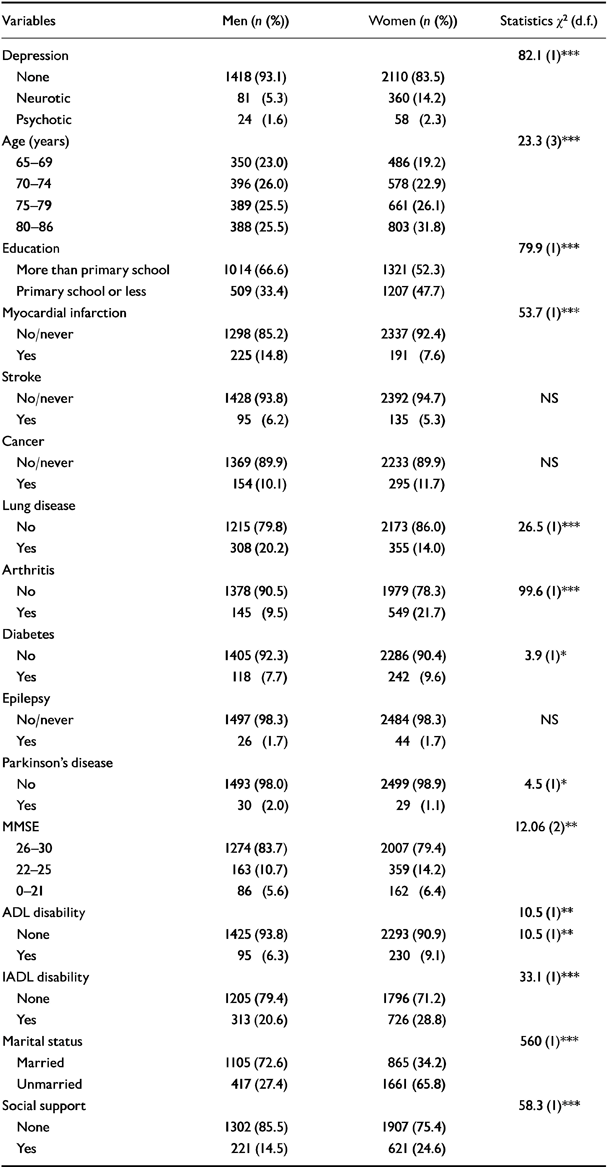
Depression prevalence at baseline was 12.9% overall (neurotic 10.9%, psychotic 2.0%), with 6.9% depression in men and 16.5% in women. The demographic and functional profiles of the study sample are presented in Table 1. In bivariate analysis men and women differed on most disease variables: men had more myocardial infarction and lung disease; women had more arthritis and diabetes. Functional disabilities were more common in women. The majority of men (72.6%) were married, whereas women were more often not or no longer married (65.8%).
Table 1 Baseline sample characteristics for men (n=1523) and women (n=2528)
| Variables | Men (n (%)) | Women (n (%)) | Statistics χ2 (d.f.) |
|---|---|---|---|
| Depression | 82.1 (1)*** | ||
| None | 1418 (93.1) | 2110 (83.5) | |
| Neurotic | 81 (5.3) | 360 (14.2) | |
| Psychotic | 24 (1.6) | 58 (2.3) | |
| Age (years) | 23.3 (3)*** | ||
| 65-69 | 350 (23.0) | 486 (19.2) | |
| 70-74 | 396 (26.0) | 578 (22.9) | |
| 75-79 | 389 (25.5) | 661 (26.1) | |
| 80-86 | 388 (25.5) | 803 (31.8) | |
| Education | 79.9 (1)*** | ||
| More than primary school | 1014 (66.6) | 1321 (52.3) | |
| Primary school or less | 509 (33.4) | 1207 (47.7) | |
| Myocardial infarction | 53.7 (1)*** | ||
| No/never | 1298 (85.2) | 2337 (92.4) | |
| Yes | 225 (14.8) | 191 (7.6) | |
| Stroke | |||
| No/never | 1428 (93.8) | 2392 (94.7) | NS |
| Yes | 95 (6.2) | 135 (5.3) | |
| Cancer | |||
| No/never | 1369 (89.9) | 2233 (89.9) | NS |
| Yes | 154 (10.1) | 295 (11.7) | |
| Lung disease | |||
| No | 1215 (79.8) | 2173 (86.0) | 26.5 (1)*** |
| Yes | 308 (20.2) | 355 (14.0) | |
| Arthritis | |||
| No | 1378 (90.5) | 1979 (78.3) | 99.6 (1)*** |
| Yes | 145 (9.5) | 549 (21.7) | |
| Diabetes | |||
| No | 1405 (92.3) | 2286 (90.4) | 3.9 (1)* |
| Yes | 118 (7.7) | 242 (9.6) | |
| Epilepsy | |||
| No/never | 1497 (98.3) | 2484 (98.3) | NS |
| Yes | 26 (1.7) | 44 (1.7) | |
| Parkinson's disease | |||
| No | 1493 (98.0) | 2499 (98.9) | 4.5 (1)* |
| Yes | 30 (2.0) | 29 (1.1) | |
| MMSE | 12.06 (2)** | ||
| 26-30 | 1274 (83.7) | 2007 (79.4) | |
| 22-25 | 163 (10.7) | 359 (14.2) | |
| 0-21 | 86 (5.6) | 162 (6.4) | |
| ADL disability | 10.5 (1)** | ||
| None | 1425 (93.8) | 2293 (90.9) | 10.5 (1)** |
| Yes | 95 (6.3) | 230 (9.1) | |
| IADL disability | 33.1 (1)*** | ||
| None | 1205 (79.4) | 1796 (71.2) | |
| Yes | 313 (20.6) | 726 (28.8) | |
| Marital status | 560 (1)*** | ||
| Married | 1105 (72.6) | 865 (34.2) | |
| Unmarried | 417 (27.4) | 1661 (65.8) | |
| Social support | 58.3 (1)*** | ||
| None | 1302 (85.5) | 1907 (75.4) | |
| Yes | 221 (14.5) | 621 (24.6) |
Associations of risk factors with mortality
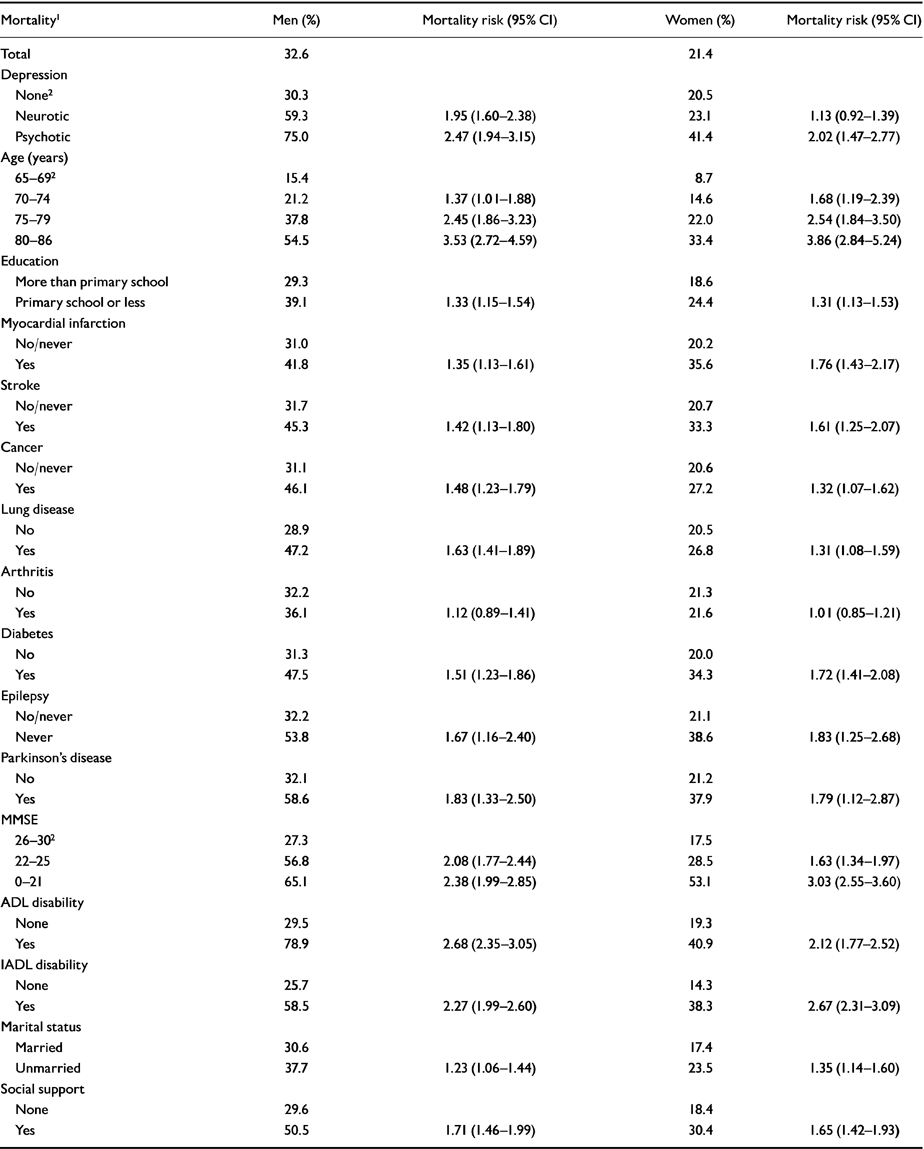
The total follow-up time of the sample was 18 726 person-years, and 1035 (25.6%) subjects had died during the study period. The crude mortality rate was 55.3 deaths per 1000 person-years. Bivariate analysis of baseline characteristics with mortality showed that all risk factors, except arthritis, were associated with mortality in both men and women (Table 2). Of the men with psychotic depression, 75% had died at follow-up, whereas in women this figure was ‘only’ 41.4%. The presence of neurotic depression in men doubled the mortality from 30.3% (without depression) to 59.3%. In women the presence of neurotic depression only slightly raised the mortality from 20.5% to 23.1% (RR not statistically significant).
Table 2 Bivariate associations of risk factors with mortality in men (n=496) and women (n=539)
| Mortality1 | Men (%) | Mortality risk (95% CI) | Women (%) | Mortality risk (95% CI) |
|---|---|---|---|---|
| Total | 32.6 | 21.4 | ||
| Depression | ||||
| None2 | 30.3 | 20.5 | ||
| Neurotic | 59.3 | 1.95 (1.60-2.38) | 23.1 | 1.13 (0.92-1.39) |
| Psychotic | 75.0 | 2.47 (1.94-3.15) | 41.4 | 2.02 (1.47-2.77) |
| Age (years) | ||||
| 65-692 | 15.4 | 8.7 | ||
| 70-74 | 21.2 | 1.37 (1.01-1.88) | 14.6 | 1.68 (1.19-2.39) |
| 75-79 | 37.8 | 2.45 (1.86-3.23) | 22.0 | 2.54 (1.84-3.50) |
| 80-86 | 54.5 | 3.53 (2.72-4.59) | 33.4 | 3.86 (2.84-5.24) |
| Education | ||||
| More than primary school | 29.3 | 18.6 | ||
| Primary school or less | 39.1 | 1.33 (1.15-1.54) | 24.4 | 1.31 (1.13-1.53) |
| Myocardial infarction | ||||
| No/never | 31.0 | 20.2 | ||
| Yes | 41.8 | 1.35 (1.13-1.61) | 35.6 | 1.76 (1.43-2.17) |
| Stroke | ||||
| No/never | 31.7 | 20.7 | ||
| Yes | 45.3 | 1.42 (1.13-1.80) | 33.3 | 1.61 (1.25-2.07) |
| Cancer | ||||
| No/never | 31.1 | 20.6 | ||
| Yes | 46.1 | 1.48 (1.23-1.79) | 27.2 | 1.32 (1.07-1.62) |
| Lung disease | ||||
| No | 28.9 | 20.5 | ||
| Yes | 47.2 | 1.63 (1.41-1.89) | 26.8 | 1.31 (1.08-1.59) |
| Arthritis | ||||
| No | 32.2 | 21.3 | ||
| Yes | 36.1 | 1.12 (0.89-1.41) | 21.6 | 1.01 (0.85-1.21) |
| Diabetes | ||||
| No | 31.3 | 20.0 | ||
| Yes | 47.5 | 1.51 (1.23-1.86) | 34.3 | 1.72 (1.41-2.08) |
| Epilepsy | ||||
| No/never | 32.2 | 21.1 | ||
| Never | 53.8 | 1.67 (1.16-2.40) | 38.6 | 1.83 (1.25-2.68) |
| Parkinson's disease | ||||
| No | 32.1 | 21.2 | ||
| Yes | 58.6 | 1.83 (1.33-2.50) | 37.9 | 1.79 (1.12-2.87) |
| MMSE | ||||
| 26-302 | 27.3 | 17.5 | ||
| 22-25 | 56.8 | 2.08 (1.77-2.44) | 28.5 | 1.63 (1.34-1.97) |
| 0-21 | 65.1 | 2.38 (1.99-2.85) | 53.1 | 3.03 (2.55-3.60) |
| ADL disability | ||||
| None | 29.5 | 19.3 | ||
| Yes | 78.9 | 2.68 (2.35-3.05) | 40.9 | 2.12 (1.77-2.52) |
| IADL disability | ||||
| None | 25.7 | 14.3 | ||
| Yes | 58.5 | 2.27 (1.99-2.60) | 38.3 | 2.67 (2.31-3.09) |
| Marital status | ||||
| Married | 30.6 | 17.4 | ||
| Unmarried | 37.7 | 1.23 (1.06-1.44) | 23.5 | 1.35 (1.14-1.60) |
| Social support | ||||
| None | 29.6 | 18.4 | ||
| Yes | 50.5 | 1.71 (1.46-1.99) | 30.4 | 1.65 (1.42-1.93) |
In Kaplan-Meyer analysis, depression was found to have a significant negative effect on survival. This effect was more pronounced in men than in women. In men, both neurotic and psychotic depression were associated with higher mortality, whereas in women this was only the case for psychotic depression (Figs 1 and 2).
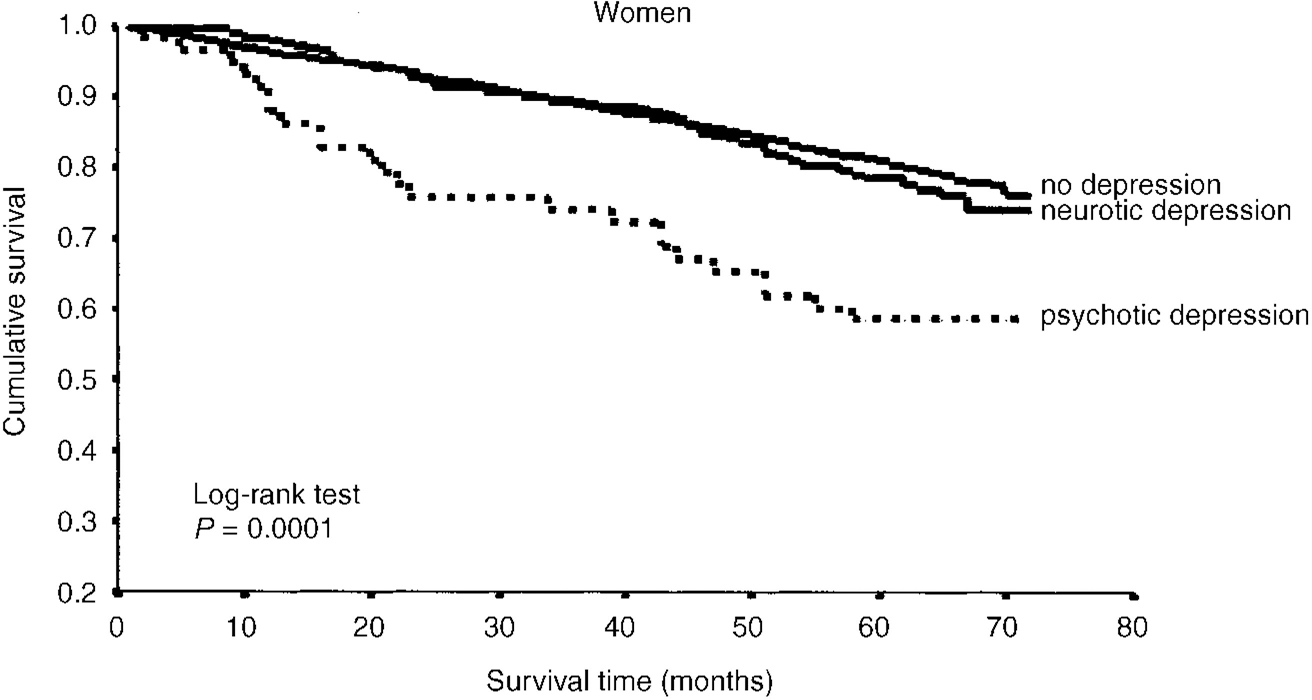
Fig. 1 Kaplan-Meier survival curve for women.
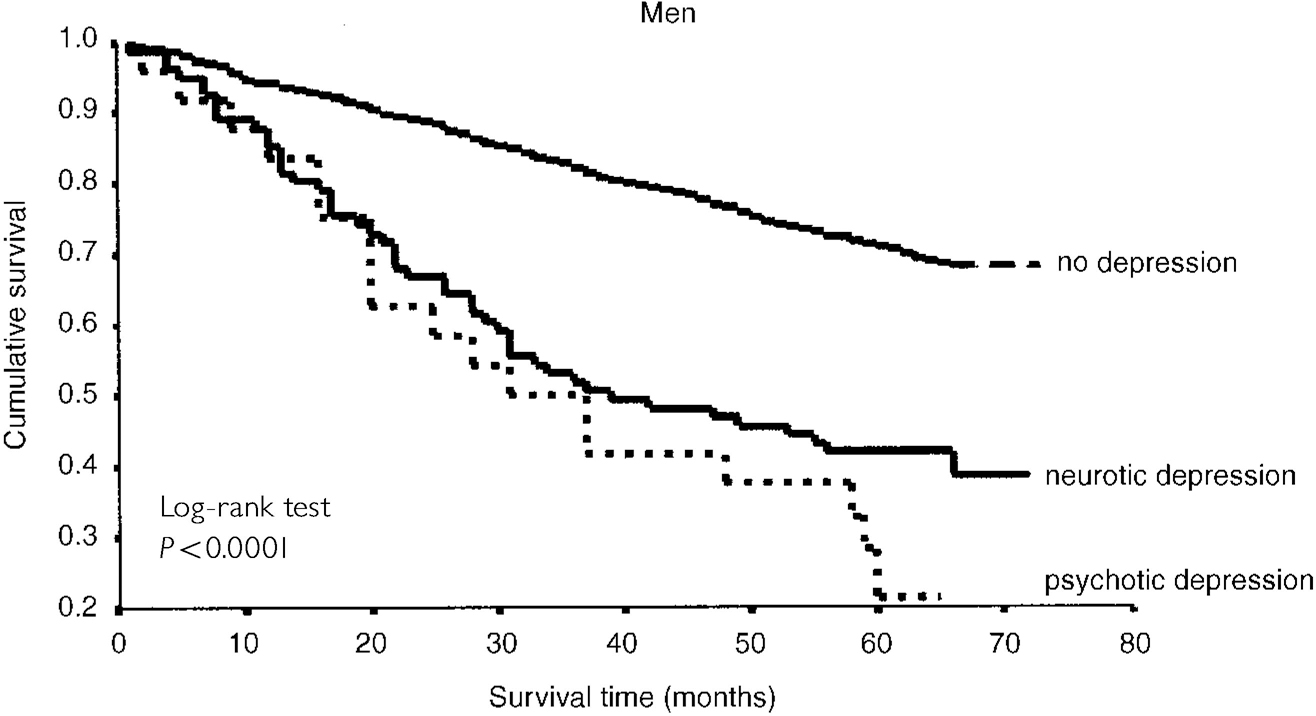
Fig. 2 Kaplan-Meier survival curve for men.
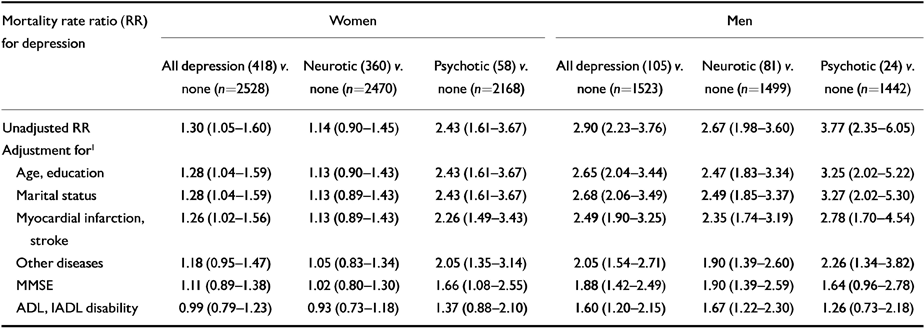
Stepwise hierarchical regression using the Cox proportional hazards model, with successive adjustment for potential confounding and explanatory variables, also showed different results for men and women (Table 3). In women, the mortality risk for ‘all depression’ was significantly lower than in men, and was reduced to a statistically non-significant level when adjusting for other variables. The unadjusted mortality risk for neurotic depression was not statistically significant in women (RR=1.14, 95% CI 0.90-1.45) and less than half of the associated mortality risk in men (RR=2.67, 95% CI 1.98-3.60), yielding a statistically significant difference between men and women. In men, the higher initial mortality risks for both ‘all depression’ and for neurotic depression still showed a statistically significant impact of depression after adjustment for all other possible explanatory factors.
Table 3 Mortality rate ratio (RR) for depression in men and women with successive adjustment for potential confounders and explanatory variables (Cox proportional hazards model, 95% CI)
| Mortality rate ratio (RR) for depression | Women | Men | ||||
|---|---|---|---|---|---|---|
| All depression (418) v. none (n=2528) | Neurotic (360) v. none (n=2470) | Psychotic (58) v. none (n=2168) | All depression (105) v. none (n=1523) | Neurotic (81) v. none (n=1499) | Psychotic (24) v. none (n=1442) | |
| Unadjusted RR | 1.30 (1.05-1.60) | 1.14 (0.90-1.45) | 2.43 (1.61-3.67) | 2.90 (2.23-3.76) | 2.67 (1.98-3.60) | 3.77 (2.35-6.05) |
| Adjustment for1 | ||||||
| Age, education | 1.28 (1.04-1.59) | 1.13 (0.90-1.43) | 2.43 (1.61-3.67) | 2.65 (2.04-3.44) | 2.47 (1.83-3.34) | 3.25 (2.02-5.22) |
| Marital status | 1.28 (1.04-1.59) | 1.13 (0.89-1.43) | 2.43 (1.61-3.67) | 2.68 (2.06-3.49) | 2.49 (1.85-3.37) | 3.27 (2.02-5.30) |
| Myocardial infarction, stroke | 1.26 (1.02-1.56) | 1.13 (0.89-1.43) | 2.26 (1.49-3.43) | 2.49 (1.90-3.25) | 2.35 (1.74-3.19) | 2.78 (1.70-4.54) |
| Other diseases | 1.18 (0.95-1.47) | 1.05 (0.83-1.34) | 2.05 (1.35-3.14) | 2.05 (1.54-2.71) | 1.90 (1.39-2.60) | 2.26 (1.34-3.82) |
| MMSE | 1.11 (0.89-1.38) | 1.02 (0.80-1.30) | 1.66 (1.08-2.55) | 1.88 (1.42-2.49) | 1.90 (1.39-2.59) | 1.64 (0.96-2.78) |
| ADL, IADL disability | 0.99 (0.79-1.23) | 0.93 (0.73-1.18) | 1.37 (0.88-2.10) | 1.60 (1.20-2.15) | 1.67 (1.22-2.30) | 1.26 (0.73-2.18) |
Although the initial mortality risk for psychotic depression was considerably higher in men (RR=3.77 v. 2.43 in women), the difference was not statistically significant. Successive adjustment for other variables then reduced the mortality risk for psychotic depression in both men and women to a statistically non-significant level. However, if the last step, adjustment for functional disabilities, was not taken into account, the mortality rate ratio for psychotic depression in women remained statistically significant (RR=1.66, 95% CI 1.08-2.55), whereas in men it only just failed to reach statistical significance (RR=1.64, 95% CI 0.96-2.78). It should be noted that, especially in men, the numbers of patients with psychotic depression were rather small to perform statistical testing with a relatively large number of control variables (24 men with psychotic depression and 58 women). Finally, there were no substantial interactions between depression (all, neurotic, psychotic) and somatic or organic disorders in either men or women.
DISCUSSION
This study sought to identify whether depression may influence survival in community-living elderly. Owing to the large sample size, the relatively long follow-up time and the incorporation of a wide range of other risk factors of mortality, the design of the study was suitable to perform this task. Specific attention was paid to gender differences and to differences in depression severity, based on the hypothesis that these two aspects may be important in understanding some of the contradictory findings of earlier studies.
Main findings
The overall prevalence of depression (12.9%) was well within the range of what has been found in other studies of depression in community-living elderly (Reference Beekman, Copeland and PrinceBeekman et al, 1999). The unadjusted mortality risks showed depression to be associated with mortality, with a considerably stronger impact on survival of the more severe, psychotic depression. This trend is consistent with earlier findings (Reference Penninx, Geerlings and DeegPenninx et al, 1999), and confirms that the more severe the depression, the higher the associated mortality. These effects, however, were modified by gender. Although, consistent with the literature (Reference Wolk and WeismanWolk & Weisman, 1995), the total prevalence of depression was found to be 2.4 times higher in women than in men, its negative effect on survival in women was less pronounced. A very large proportion of men with psychotic depression (75%) had died after a follow-up of six years, whereas in women this was clearly lower, although still considerable (41.4%). Likewise, neurotic depression in men showed a much higher mortality risk than in women.
After controlling for other explanatory variables, this overall impression did not change. The mortality risk of psychotic depression remained statistically significant in women, and very nearly significant in men, when the last step in subsequent adjustment was not taken into account. As functional disability has been found to be a consequence of depression, and the numbers of men with psychotic depression were rather small, it appears to be a reasonable conclusion that psychotic depression is associated with a higher mortality risk in both men and women. The gender differences were, however, most striking when investigating the more prevalent neurotic depression. Even unadjusted, neurotic depression in women was not found to be significantly associated with mortality. The mortality risk in men, however, remained statistically significant after controlling for all competing factors that may have affected survival.
Methodological considerations
A first methodological explanation for the gender differences observed may be that there has been report bias, differentially affecting prevalence rates of depression in men and women. One possible explanation is that women are culturally more prone to report depressive complaints, and therefore have higher depression scores. A de facto broader definition of depression in women would thus conceal the real effect that more severe, clinically relevant levels of depression may have on mortality. There are some data that support this proposition (Reference Angst and Dobler-MikolaAngst & Dobler-Mikola, 1984), but most studies failed to confirm it (Reference Wolk and WeismanWolk & Weisman, 1995). Symptom patterns in men and women are very much alike, and studies in different adult age groups consistently show a female preponderance in depression (Reference Sonnenberg, Beekman and DeegSonnenberg et al, 2000). If the current study had taken into account only psychotic depression, the gender distribution would have been less skewed (women have 1.4 times more psychotic depression than men, instead of 2.7 times that of men in neurotic depression). Still, the mortality risk (RR) for psychotic depression was almost two-fold higher in men, demonstrating a robust difference between the effects of depression in men and women.
A second methodological explanation for the observed gender difference may be that depressed subjects are more inclined to report negatively about their own health (Reference Raphael and CloitreRaphael & Cloitre, 1994). In studies such as ours, in which every effort was made to control for confounding, report bias may lead to overcorrection in multivariate analysis. Owing to the higher prevalence of depression, this effect may be stronger in women. However, the unadjusted mortality RR values for depression are already much lower or statistically insignificant in women, suggesting that a possible control bias does not account for the difference. Report bias thus appears to be an improbable explanation for the observed gender differences.
A third source of bias may be selective non-response. A previous study in this sample by Launer et al (Reference Launer, Wind and Deeg1994) revealed that non-responders to the baseline assessment more often reported a heart attack, stroke and diabetes, and were more likely to be unmarried, to have a lower education, to do poorly on cognitive tests and to have a history of psychiatric illness. There were no differences in response rate between men and women (OR=1.0, 95% CI 0.6-1.5). We therefore conclude that only the very ill and cognitively impaired may have been underrepresented in the current study. This appears similar to the non-response pattern found in other community studies. Risk factors for mortality, however, were well represented in men and women throughout the age strata of the study population. Owing to the efficient functioning of Dutch community registers, measurement of the outcome variable of this study was 99.9% complete. Thus, the results do not appear to be fundamentally affected by this non-response pattern.
The conclusion is therefore justified that depression is associated with a higher mortality in older men than in older women. This is especially true for depression syndromes generally considered to be ‘milder’ that do not meet the criteria for major depressive disorder. Our findings offer an explanation for some of the contradictory findings of earlier studies on pervasive or minor depression and mortality, most of which did not specifically address gender as an effect modifier.
Implications
Both the theoretical and clinical implications of this finding are considerable. Earlier research has shown that depressive symptoms are of major importance to physical, social and role functioning (Reference Beekman, Deeg and BraamBeekman et al, 1997). After controlling for the effects of a variety of serious somatic conditions our data show that depression also exerts an influene on mortality in men. Even though there is a growing consensus on the fact that mild or ‘sub-threshold’ depressive syndromes (not meeting full diagnostic criteria for DSM-IV (American Psychiatric Association, 1994) or ICD-10 (World Health Organization, 1993)) identified by screening methods such as GMS-AGECAT deserve clinical attention (Reference Pincus, Wakefield Davis and McQueenPincus et al, 1999), recognition is poor (Reference German, Shapiro and SkinnerGerman et al, 1987). The majority of depressed patients living in the community do not receive any specific treatment for their depressive complaints. Treatment studies, however, confirm the gender-specific pattern and suggest that the potential effect of depression on mortality can be affected by treatment. Avery & Winokur (Reference Avery and Winokur1976) showed that treatment of clinically admitted patients with major depression significantly reduced the number of deaths through myocardial infarctions. They found the impact of adequate treatment of depression to be especially influential on the survival of older men. A study by Craig & Lin (Reference Craig and Lin1981), comparing pre-drug era and post-drug era patient samples, revealed that the decline in mortality associated with the introduction of psychiatric drug treatment was also especially marked in elderly men.
Possible explanations for the observed gender differences
Although it has long been pointed out that untreated depressed subjects tend to be in worse health due to continuous agitation, malnourishment, intercurrent infections and cardiovascular problems (Reference MalzbergMalzberg, 1937), and are also more likely to die from accidents or suicide (Reference Tsuang and WoolsonTsuang & Woolson, 1978), a clear explanation for the gender-specific pattern has not been provided.
A possible explanation may be that men have more cardiovascular pathology, the course of which is affected more strongly by comorbid depression. A number of studies have shown depression to be related to a less favourable course of cardiovascular disease (Reference Avery and WinokurAvery & Winokur, 1976; Reference Frasure-Smith, Lesperance and TalaijcFrasure-Smith et al, 1995). These studies, however, investigated the impact of major depression and not of less severe depressive syndromes.
A tentative psychological explanation for the excess mortality in men may be that men are less equipped to deal with feelings of hopelessness and depression than women. Women are more inclined to discuss such feelings with others (Reference BriscoeBriscoe, 1982), are more open to accepting support from others when experiencing them (Reference Longino and LipmanLongino & Lipman, 1981) and therefore are more able to sustain and overcome feelings of depression (Reference Grootheest, Beekman and Broese van GroenouGrootheest et al, 1999). The male coping style is more externalising, and feelings of depression will only be experienced by men when other, more typical forms of coping have not been successful. A depressive syndrome in men thus signifies a more invalidating and threatening condition than such a syndrome in women, which is reflected in the robust differences in mortality.
A third, possibly related, mechanism explaining the gender differences we found may be that depressed elderly men are more inclined to commit suicide than depressed women (Reference Conwell, Duberstein and HermannConwell et al, 1996).
As the current data do not include the causes of death, the question on the exact mechanism cannot be addressed directly. However, the finding of a relation between ‘milder’ depression and mortality, especially in elderly men, is robust in this study. For a clinician to focus solely on patients with DSM-IV major depressive disorder, a diagnostic convention imposed on a continuum of depressive symptoms of varying severity and duration, appears once more to be an underestimation of the actual level of morbidity. Although the majority of the community-dwelling elderly with depressive syndromes who were investigated in this study had not been treated for depression, earlier data suggest that they might have derived important benefits from it. With an average total prevalence of 13.5% (Reference Beekman, Copeland and PrinceBeekman et al, 1999), later-life depressive syndromes are likely to be found in all medical settings and may affect the course of a variety of conditions. This study lends a strong basis to the notion that, together with patients suffering from more severe levels of depression, elderly men with neurotic or ‘minor’ depression deserve to be recognised and treated more vigorously than is currently practised.
Clinical Implications and Limitations
CLINICAL IMPLICATIONS
-
▪ Late-life depression is associated with excess mortality, with a higher impact of more severe levels of depression.
-
▪ Major depressive syndromes are associated with excess mortality in both men and women. Mild or minor depressive syndromes are related to a higher mortality risk in older men, but not in older women.
-
▪ Late-life depression often remains unrecognised and untreated by the health services. However, research suggests that, together with other vital aspects of life, survival may be positively affected by adequate treatment of depression.
LIMITATIONS
-
▪ The current data do not include the causes of death, so the exact mechanism linking depression and mortality cannot be addressed directly.
-
▪ Selective attrition to the baseline assessment of the study has probably occurred among the very frail.
-
▪ The study is a naturalistic follow-up in the community, not controlling for (low levels of) ongoing treatment.
ACKNOWLEDGEMENTS
The Amsterdam Study of the Elderly (AMSTEL) was supported by grants from the Netherlands Health Research Programme (SGO) and the Netherlands Fund of Mental Health (NFGV). The AGECAT computer program was installed with the kind cooperation and final authorisation of Michael E. Dewey.


eLetters
No eLetters have been published for this article.