1 INTRODUCTION
Molecular clouds comprise the densest regions of the interstellar medium, and are the nurseries in which stars form. In order to determine how molecular clouds themselves form, surveys of the three principal forms of carbon (i.e. C+, C, and CO) are needed to trace the gas in its ionised, atomic and molecular forms respectively. In particular, surveys along the Galactic plane, where the great majority of molecular clouds lie, provide us with a picture of the molecular structure of our Galaxy.
The Mopra southern Galactic plane CO Survey is designed to map the distribution and dynamics of the carbon monoxide (CO) molecule along the Fourth Quadrant of the Galaxy, from l = 270 to 360° with b = ±0.5° (Burton et al. Reference Burton2013, Paper I). Using the Mopra radio telescope, the J = 1–0 line of CO at 2.6 mm is being mapped at 35-arcsec spatial and 0.1 km s−1 spectral resolution, in order to determine where giant molecular clouds (GMCs) lie in the Galaxy and to explore the connection between molecular clouds and the ‘missing’ gas inferred from gamma-ray observations. The CO data will be combined with similar survey data collected of the sub-millimetre neutral carbon line (C) taken with the Nanten2 telescope in Chile, and the terahertz neutral and ionized carbon lines (C and C+) from the balloon-borne Stratospheric Terahertz Observatory 2 (STO2) and the ice-bound High Elevation Antarctic Telescope (HEAT), both in Antarctica. With these surveys, it will be possible to determine the distribution and motion of the principal forms of carbon in the interstellar medium.
Data Release 1 (hereafter DR1) covers the first 10 deg2 of the survey, from l = 320 to 330° with b = ±0.5°, along with an additional three half-square degrees over l = 327–330°, b = +0.5–1.0° (see Figures 1 and 2). The G323 sightline has previously been published in Paper I; however, it is discussed here because the G323 data was taken in the summer months and compares less favourably to the other data cubes, which were obtained in the Austral winter. The improved atmospheric conditions make it possible to observe all four of the major CO isotopologues (12CO, 13CO, C18O, and C17O), although the C17O line is very weak and only detectable at a 2σ level at best, as measuring it typically requires longer integration times than our fast-mapping survey mode allows (see Paper I). The isotopologue ratios allow examination of the distribution of columns of molecular gas through GMCs (Heyer et al. Reference Heyer, Krawczyk, Duval and Jackson2009), so that variance in the XCO factor, used to link the CO intensity to the H2 column density in order to obtain molecular cloud masses, can be determined (see e.g. Bolatto, Wolfire, & Leroy Reference Bolatto, Wolfire and Leroy2013).

Figure 1. Three-colour image of the Galactic plane from the Spitzer GLIMPSE 8 μm (red; Churchwell et al. Reference Churchwell2009; Benjamin et al. Reference Benjamin2003) and MIPSGAL 24 μm (green; Carey et al. Reference Carey2009) surveys, with a moment-0 map calculated over v = −120 to 0 km s−1 from the Mopra 12CO J = 1–0 survey (blue). The region enclosed by the white box, containing Galactic longitudes l = 320–330° and latitudes b = ±0.5°, as well as l = 327–330°, b = +0.5–1.0°, is that published here as Data Release 1 (DR1).

Figure 2. The moment-0 map calculated over v = −120 to 0 km s−1 from the Mopra 12CO J = 1–0 Southern Galactic Plane survey. The region illustrated is that published here as Data Release 1 (DR1).
In Section 2 of this paper (Paper II), the data are described, along with the various metrics used to quantify the noise and data quality. Section 3 will present some sample science results; however, detailed science investigations are left for focussed studies, such as Burton et al. (Reference Burton2014), which described a filamentary molecular cloud in the G328 sightline. The data are being made available at the survey websiteFootnote 1, and in the CSIRO-ATNF data archiveFootnote 2, as they are published.
2 DATA RELEASE 1
The data presented in this paper were taken in 2011 March, and over the Austral winters of 2011–2013. The observations performed in 2011 (l = 323–330°, b = ±0.5°) used the UNSW Digital Filter Bank (the UNSW–MOPS) in its ‘zoom’ mode, with 4 × 137.5 MHz dual-polarization bands; in 2012 this was increased to 8 bands, so that the data from l = 320–323°, b = ±0.5° and l = 327–330°, b = +0.5–1.0° cover a larger spectral region. Very little emission is observed in these extended bands away from the Galactic centre, but it is possible that high-velocity clouds could be detected. The full line parameters are given in Table 1 of Paper I; the DR1 dataset has a spectral resolution of ~ 0.1 km s−1 over at least 4096 channels for each of the four CO isotopologues.
Table 1. Sky reference beam positions for each square degree of DR1; the additional half-square degree regions from l = 327 to 330°, b = +0.5–1.0° use the same sky reference positions as their main survey counterparts. Several of the cubes were affected by contamination due to 12CO line emission at the sky reference position; the central velocity and intensity (in T ⋆A [K] units) of this contamination is also noted.

The angular resolution of the Mopra beam at 115 GHz is 33-arcsec FWHM (Ladd et al. Reference Ladd, Purcell, Wong and Robertson2005); after the median filter convolution is applied during the data reduction process, the beam size is around 35 arcsec in the final data set. The extended beam efficiency, used to convert brightness temperatures into line fluxes, is ηXB = 0.55 at 115 GHz (rather than the main beam efficiency ηMB = 0.42; Ladd et al. Reference Ladd, Purcell, Wong and Robertson2005).
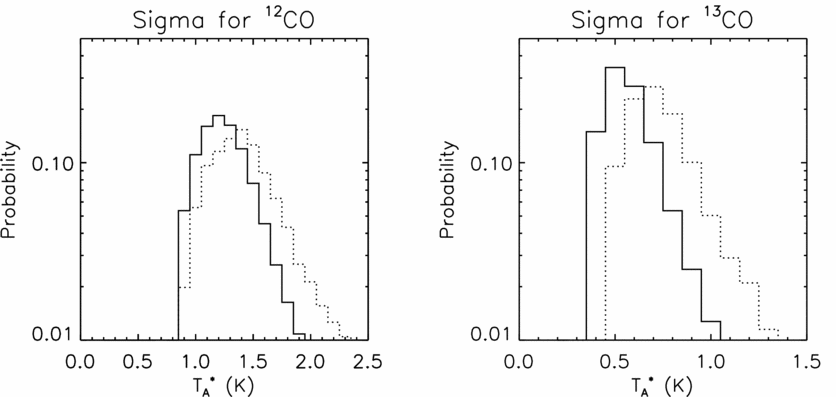
There are a number of metrics used to assess the quality of DR1. Figure 3 shows histograms of the noise per channel, σcont, as well as the previously-published distribution from the G323 sightline for both the 12CO and 13CO lines (the C18O and C17O lines have similar noise characteristics to 13CO). These are calculated by finding the standard deviation of the channels outside of the range where line emission occurs, where V LSR < −120 km s−1 and V LSR > +20 km s−1 (Figure 11 shows that some emission exists where V LSR > +20 km s−1, but it occurs in very few pixels and does not affect these statistics). Although the G323 data were taken in the summer months, the noise distribution is not significantly different from those data obtained in winter. While the tails of the histograms are ~ 0.5 K higher in the summer observations due to the poorer conditions, the mode values for 12CO and 13CO are 1.5 and 0.7 K per 0.1 km s−1 velocity channel, in comparison to 1.3 and 0.5 K per 0.1 km s−1 channel in winter. The 12CO line has higher noise than the 13CO line (and those of the other isotopologues not shown here), as there is a molecular oxygen absorption line near 115 GHz, making the atmosphere inherently worse than it is for the other isotopologues at 109–112 GHz.

Figure 3. Probability distribution of the noise level in the 12CO (left) and 13CO data cubes, σcont, as determined from the standard deviation in the continuum channels (in T ⋆A [K] units) for each pixel. The dotted distribution in each is the noise level in the l = 323–324° field (described in Paper I), highlighting the effect of observing in the summer months.
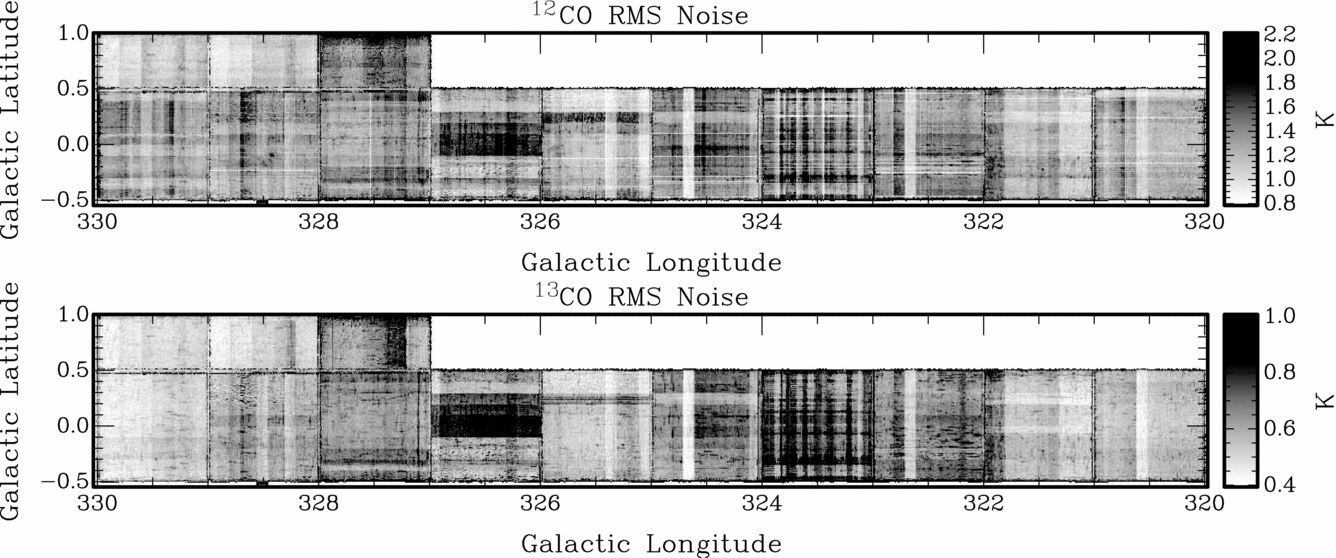
Figure 4 shows the 1σ noise maps for the 12CO and 13CO data cubes, determined from the standard deviation of the continuum channels between v = 0 and v = +90 km s−1 in each pixel. The wider visible striping in these maps is an effect of the scans in the l and b directions being taken with a variety of different system temperatures and observing conditions. Thinner stripes or spots of lower apparent noise occur where ‘bad’ pixels, rows or columns were identified and interpolated over (the lower noise is a result of interpolating over several nearby pixels; see Paper I). As in Figure 3, the higher noise occurring in the G323 field is a result of poorer conditions in the summer months.

Figure 4. Maps showing the noise level (in T ⋆A [K] units) for 12CO and 13CO, determined from the standard deviation of the continuum channels between 0 and + 90 km s−1 for each pixel. Note that the intensity scales differ, as the 12CO observations have ~ 3 times higher noise than 13CO. The higher noise in the G323 region (Paper I) is also evident.
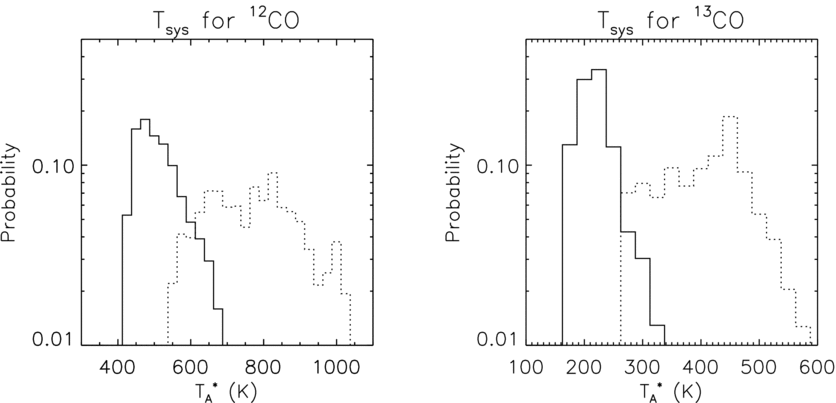
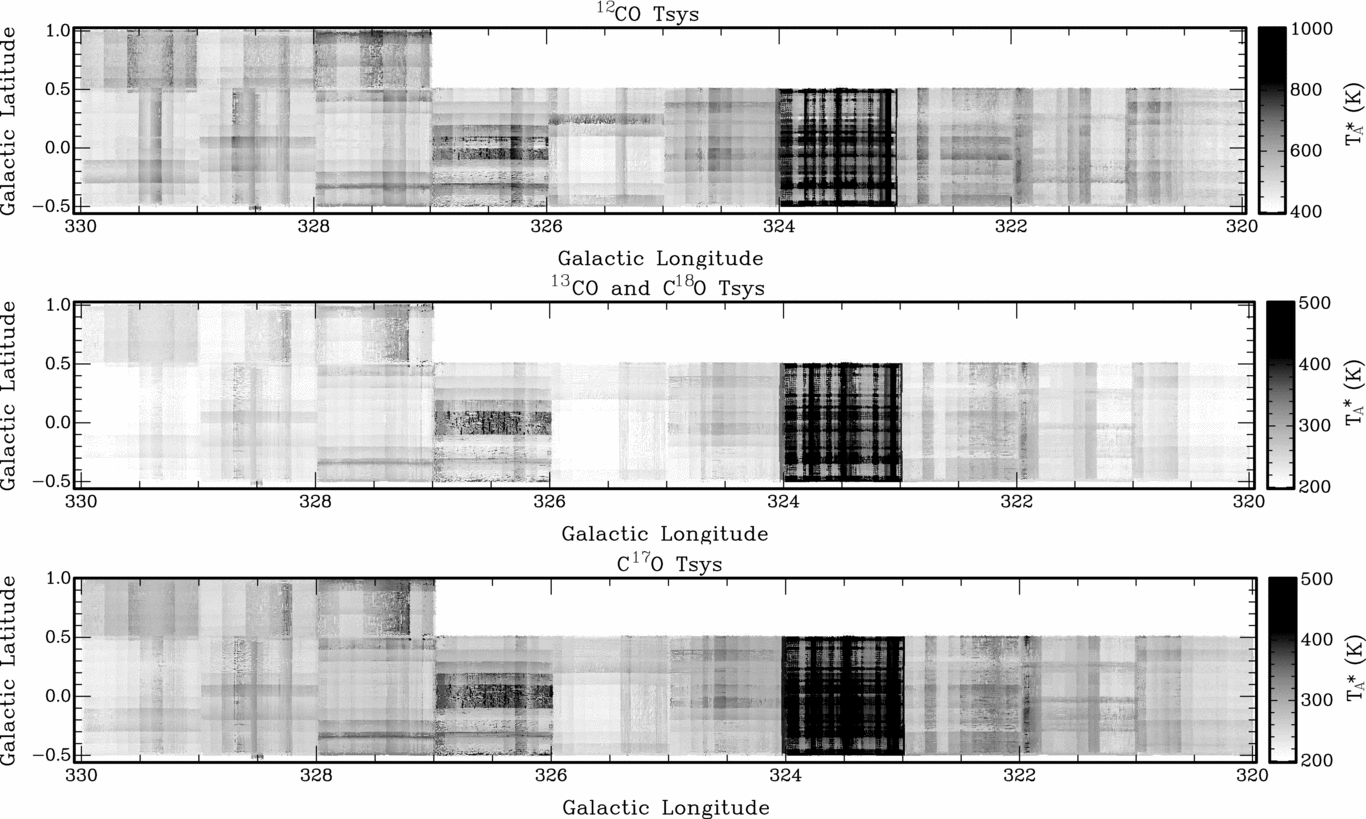
The system temperature, T sys, measures the level of the received signal from the source, sky, telescope, and instrument. It is calibrated every 30 min with reference to an ambient temperature paddle that is placed in front of the beam. Figure 5 shows histograms of the probability distribution of T sys for 12CO and 13CO, alongside their counterparts for the G323 sightline. Again, the 12CO line has T sys about a factor of 2 higher than the values for the other lines due to the inferior conditions. Maps of the system temperature for all four of the CO isotopologues are shown in Figure 6; 13CO and C18O share the same T sys map as these lines are in the same 2-GHz band of the correlator. As before, the striping is a result of combining data from scans in both the l and b directions (minimising artefacts from poor sky conditions), while spots occur where the data cube has been thresholded to remove that data with excessive T sys values (see Paper I for more details). Scans with particularly high T sys values were repeated (these are also visible in Figure 4 as wide stripes of lower noise).

Figure 5. Probability distribution of the system temperature, T sys (in T ⋆A [K] units) for 12CO and 13CO, in the data for each pixel, determined from the ambient temperature load paddle measurements. The dotted distribution in each is the l = 323–324° field described in Paper I; the higher T sys values highlight the effect of observing in the summer months.

Figure 6. T sys images for (from top): 12CO, 13CO, and C18O (which share the same 2-GHz band of the correlator), and C17O, in units of T ⋆A (K) (as indicated by the scale bars). The striping pattern is inherent to the data set, resulting from scanning in the l and b directions in variable observing conditions. The darkest square degree region, l = 323–324°, was observed in 2011 March when the summer conditions were less favourable for CO observations.
Several of the data cubes were affected by contamination from faint molecular clouds in the sky reference beam (of typical intensity ~ − 0.5 K in 12CO and ~ −0.1 K in 13CO; the other lines are generally too weak for sky emission to be visible). While tests of the sky reference positions were carried out prior to survey observations, these were quick observations and the faint sky signal was typically lost in the noise. In DR1, this contamination has been removed by calculating the average spectra in a region of ~ 100 pixels where the sky contamination is uniform, such that there is no true emission within ± 3 km s−1 of the negative emission profile. A Gaussian template is fit to this contaminating profile and then subtracted from the individual spectrum at each pixel in the full square degree. The central velocity of the sky emission varies across each square degree, as the reduction process (see Paper I) does not control for any variation relative to the local standard of rest in the sky spectrum; this is compensated for by linearly varying the central velocity of the template spectrum in both longitude and latitude (typically by ≲ 1 km s−1 in either direction). Table 1 gives the position of the sky reference beam for each square degree, along with the intensity and central velocity of the contamination in the average spectrum for the square degree.
DR1 has been made available at the survey website and in the CSIRO-ATNF data archive as a series of fits files for each isotopologue, each containing a square degree of the survey, centred at each half degree along the Galactic plane. Although the full range of velocity space available for 12CO is [ − 1000, +1000] km s−1 (with file sizes ~ 800 MB deg−2), it is expected that most users would prefer to download the smaller ( ~ 300 MB deg−2) files covering the velocity range [ − 150, +50] km s−1 illustrated in this paper. No emission has yet been detected outside this range, although closer to the Galactic centre a wider velocity range will be included within the smaller files. Also available are the T sys, beam coverage and rms noise images for each line. The 10° × 1.5° cube used for the analysis in this paper was created using the imcomb task in miriadFootnote 3 (Sault, Teuben, & Wright Reference Sault, Teuben, Wright, Shaw, Payne and Hayes1995).
3 RESULTS
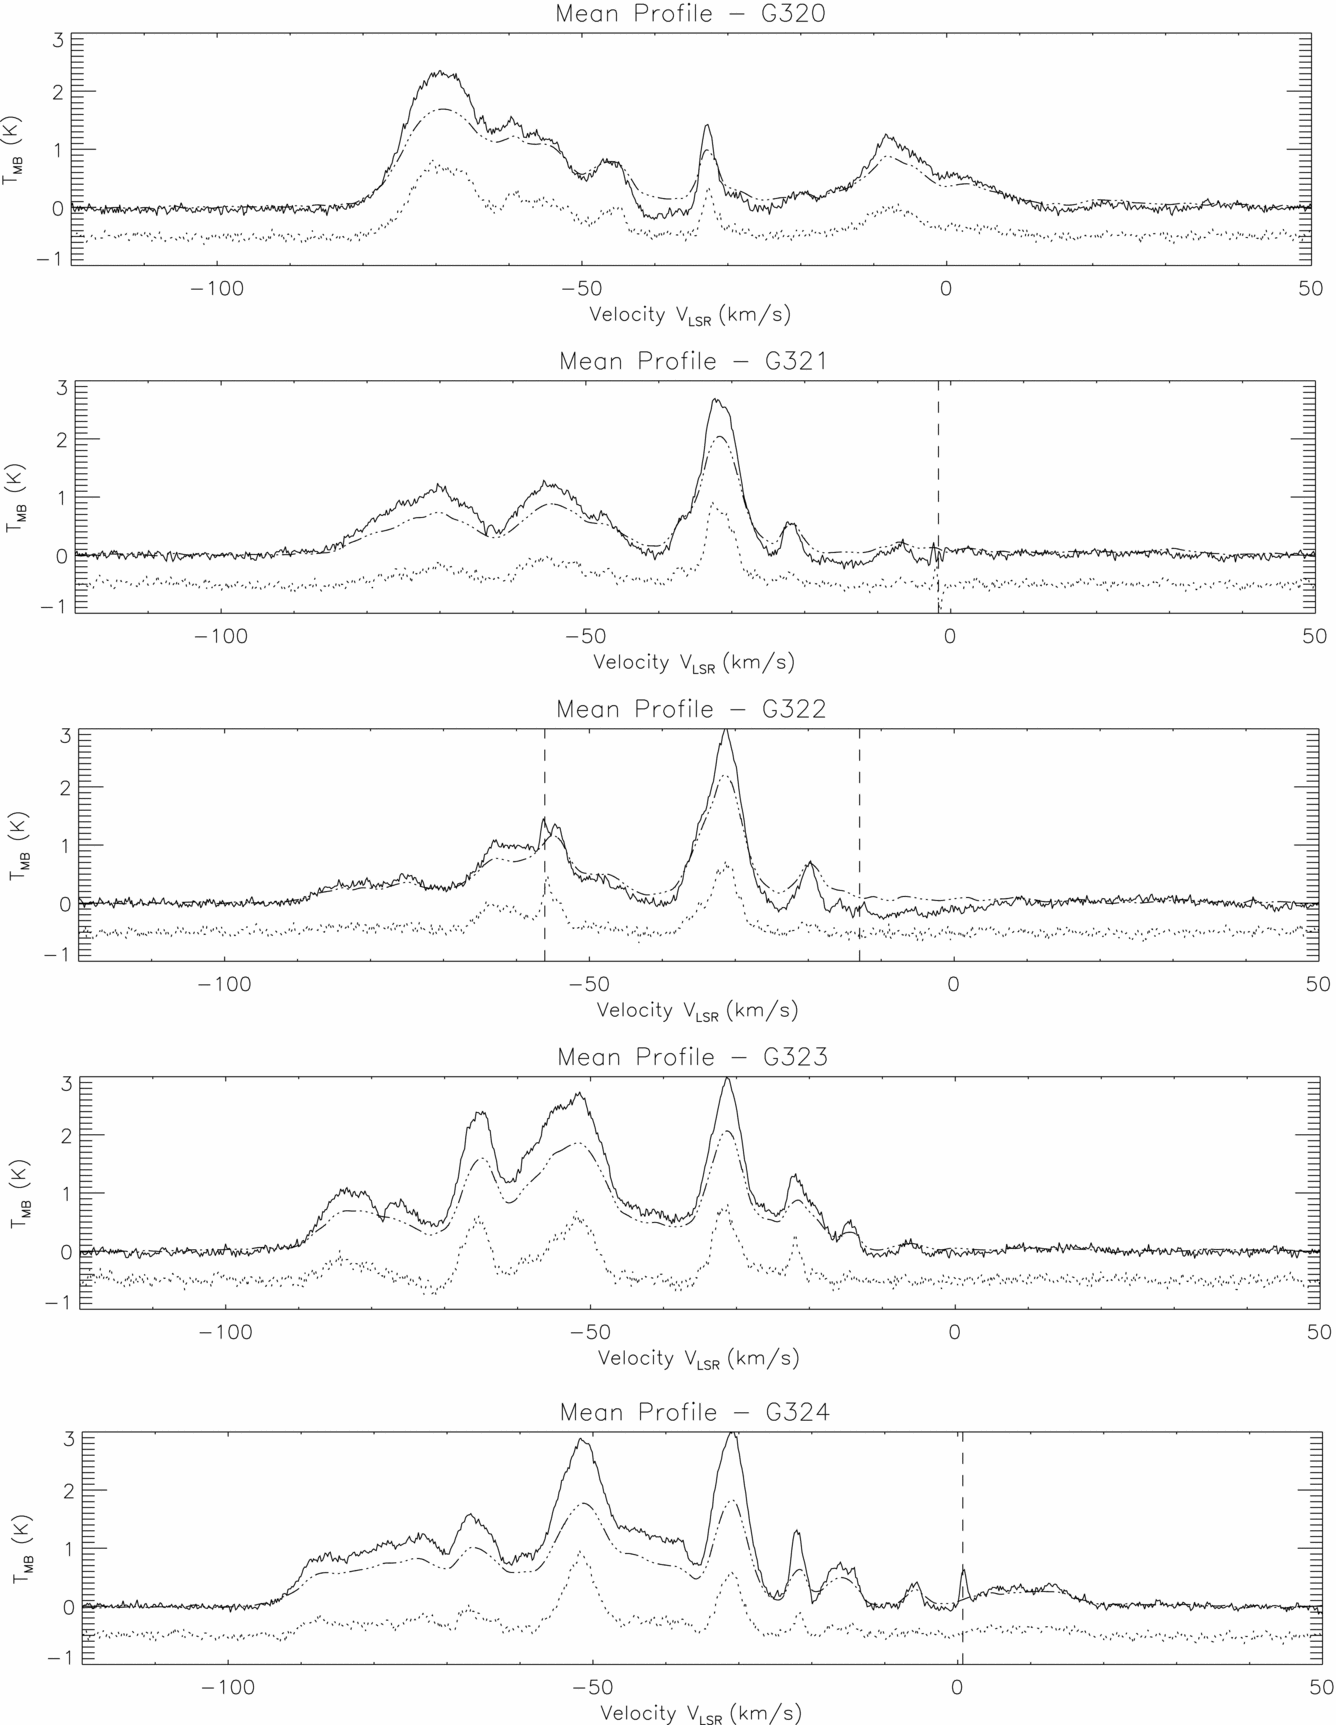
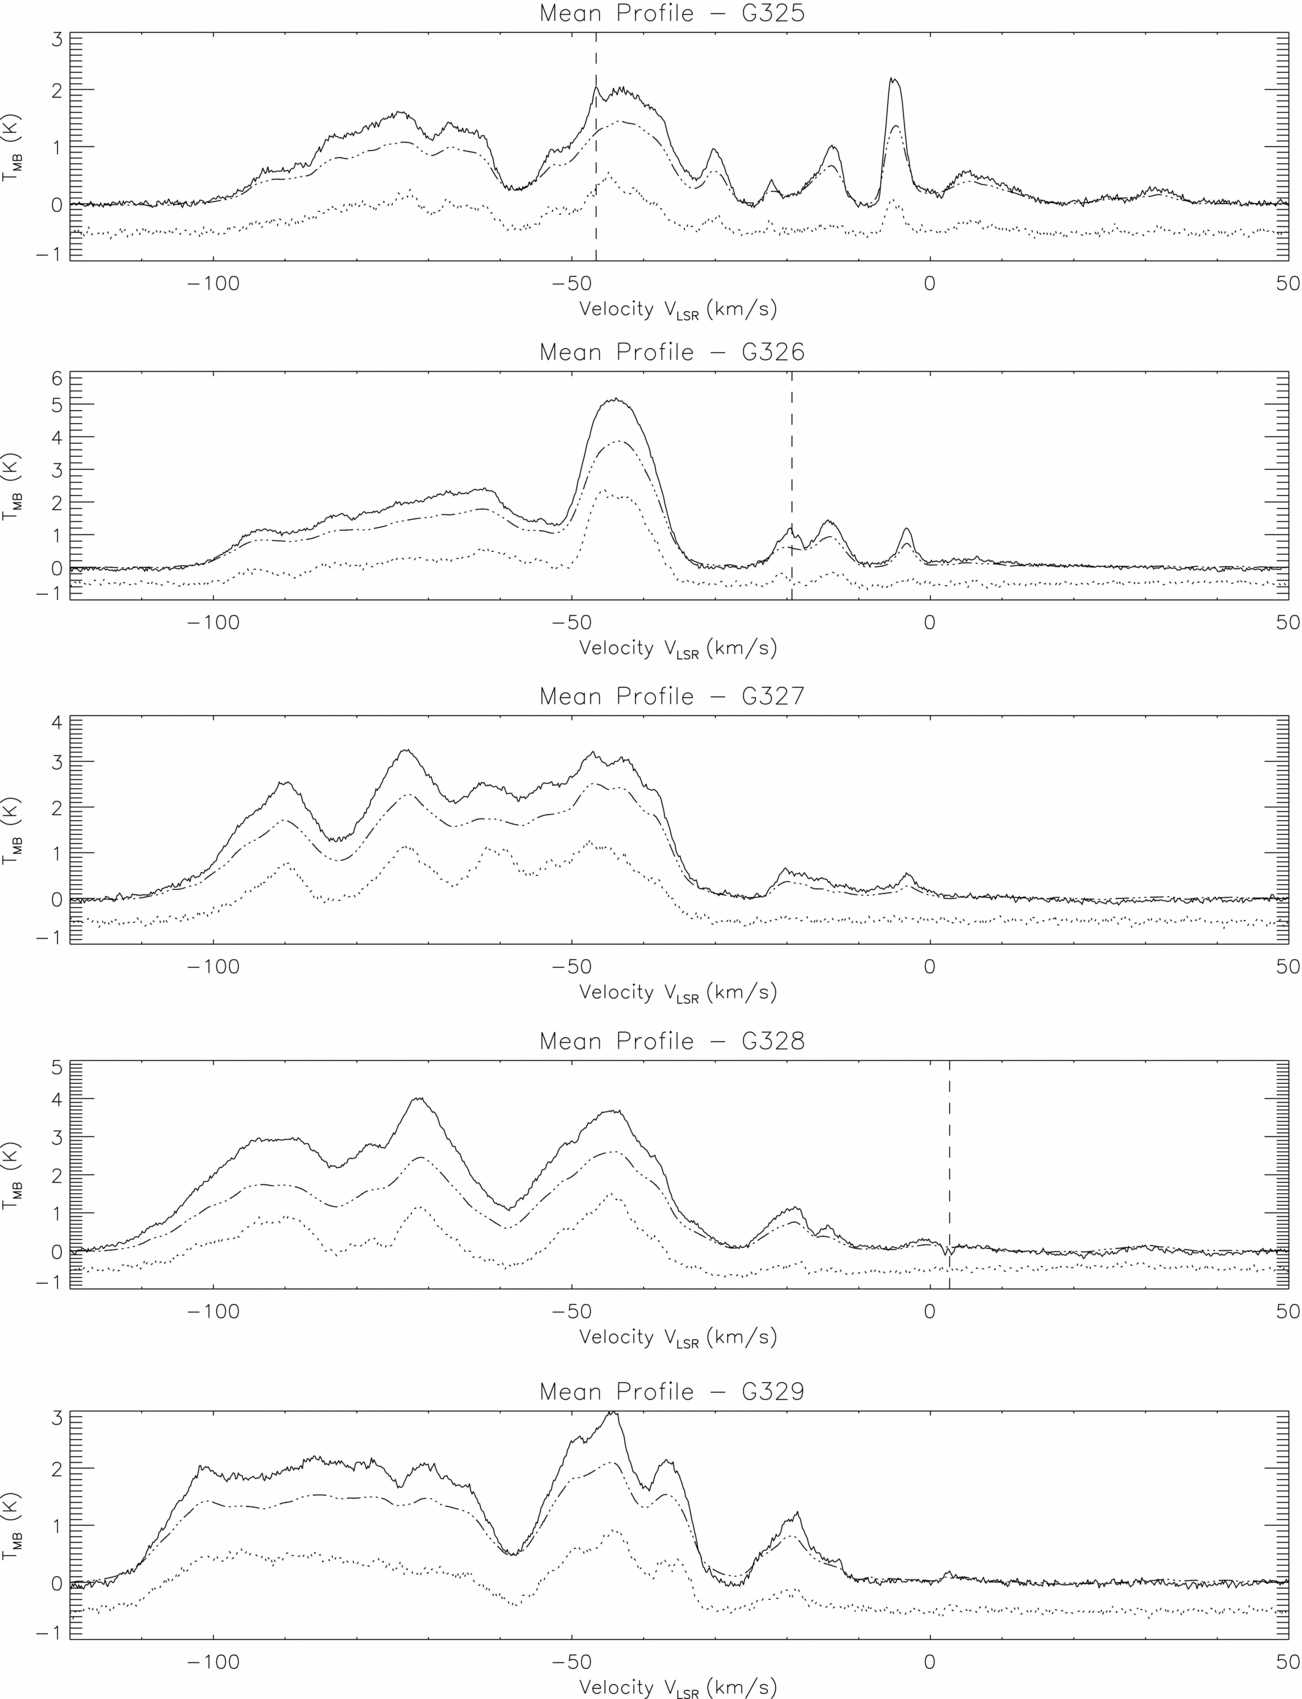
Figures 7 and 8 show the average 12CO and 13CO line profiles for each square degree cube in DR1. The 12CO profiles from the lower spatial (8 arcmin) and spectral (1.3 km s−1) resolution survey of Dame et al. (Reference Dame, Hartmann and Thaddeus2001) are overlaid on the plots, showing that the structure of the profiles match well, although the intensity of the Mopra line peaks is ~ 1.4 times higher than the corresponding Dame et al. (Reference Dame, Hartmann and Thaddeus2001) intensities (see Table 2). The intensity ratio was determined using the average spectra for each square degree over the velocity range v = [ − 120, 20] km s−1 where the majority of the emission lies, and has been found to be relatively consistent across DR1. Wong et al. (Reference Wong2011) found the average of the Mopra-extended beam efficiency (ηXB) had a typical rms deviation of ~ 10% over their eight observing seasons (each about a month in duration), with much of the variation reflecting changes in the system temperature scale due to instrument modifications. Their beam efficiencies were lower than those used to calculate T MB in this paper; using these would only increase the ratio of the Mopra CO fluxes to those of Dame et al. (Reference Dame, Hartmann and Thaddeus2001).

Figure 7. The CO line profiles, averaged over each square degree from l = 320 to 325°, in units of T MB (K) (i.e. divided by the telescope efficiency, ηXB = 0.55). The solid line is 12CO; the dotted line is 13CO (which has been multiplied by 3 and offset by − 0.5 K for clarity); these spectra are binned in velocity by 2 pixels (0.2 km s−1). The dot–dashed line is the equivalent 12CO spectrum from the Dame et al. (Reference Dame, Hartmann and Thaddeus2001) survey, and the vertical dashed lines are the velocities from which contaminating sky emission was removed (see Table 1).

Figure 8. Further CO line profiles, averaged over each square degree from l = 325 to 330°, in units of T MB (K). Other details are as in Figure 7.
Table 2. The median and mode of the ratio of the Mopra CO intensities to those of the Dame, Hartmann & Thaddeus (Reference Dame, Hartmann and Thaddeus2001) survey, calculated using the average spectra in each square degree over the velocity range v = [ − 120, 20] km s−1.

The integrated intensity maps in Figures 9–11 highlight molecular clouds in the Mopra 12CO and 13CO data cubes over each 10 km s−1 interval between − 110 and + 40 km s−1 in units of K km s−1, corrected for the beam efficiency ηXB = 0.55. These have been calculated using the dilated mask code developed for the MAGMA survey of the Magellanic Clouds in CO (Wong et al. Reference Wong2011). The dilated CPROPS mask (Rosolowsky & Leroy Reference Rosolowsky and Leroy2006) is calculated by identifying regions of high significance ( > 4σ) and expanding these to connected regions of lower significance ( > 3σ). Masking the data in this way reduces the number of high-noise artefacts in the intensity images, although some remain. In particular, the upper boundary of the main survey at l = 320–327°, b = +0.5° is clearly visible as a series of high-noise points in both the 12CO intensity map and the 13CO contours.

Figure 9. 12CO intensity maps with 13CO contours in K km s−1, corrected for the beam efficiency ηXB = 0.55, from v = −110 to − 60 km s−1 integrated over 10 km s−1 intervals. The 13CO contours are at 5, 15, 25, 35 K km s−1. Note that the boundary of the survey is evidenced by spots of poor signal to noise along the b = +0.5° boundary.

Figure 10. As per Figure 9, 12CO intensity maps with 13CO contours in K km s−1, from v = −60 to − 10 km s−1 integrated over 10 km s−1 intervals. Note that from the third map the intensity scale differs from Figure 9 due to the weaker fluxes in these velocity ranges, and the 13CO contours are now at 1, 8, 15, 22 K km s−1. Due to the weaker signal fluxes, there are more localised instances of high noise apparent in the 13CO contours in this Figure, most obviously the column at l ≈ 323.8° in the lower three maps.

Figure 11. As per Figure 10, 12CO intensity maps with 13CO contours in K km s−1, from v = −10 to + 40 km s−1 integrated over 10 km s−1 intervals.
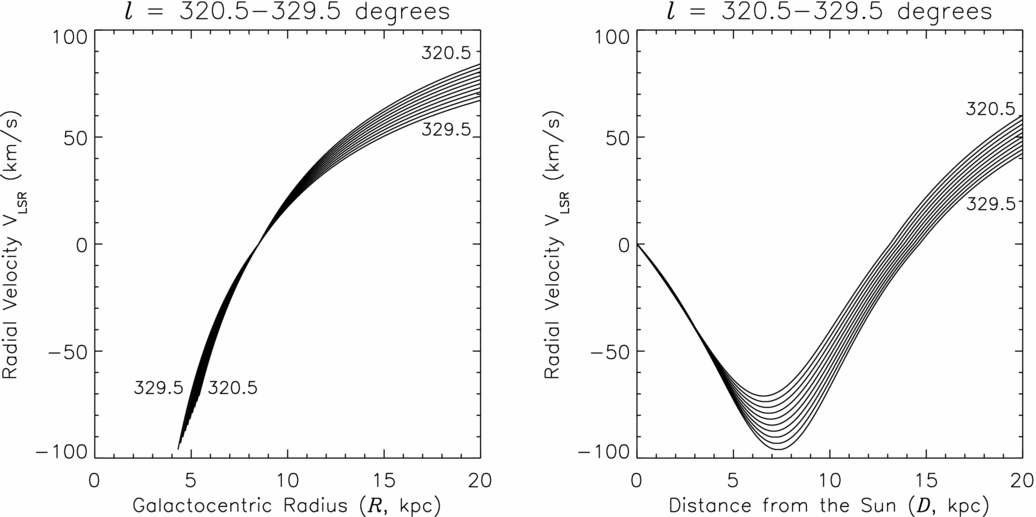
To aid interpretation of the data, Figure 12 shows derived relationships between the radial velocity and galactocentric radius (R, left) and the distance from the Sun (D, right) for the central longitude of each square degree in DR1. This is an expansion of Figure 9 in Paper I, now showing the variation across the whole 10°. As in that figure, the right plot shows the near–far ambiguity for negative velocities between 0 km s−1 and the tangent velocity along each sightline (decreasing with l). From the intensity maps in Figure 9, it is clear that a number of molecular clouds occur at ‘forbidden’ velocities (possessing velocities that are not possible under the assumption that the rotation curve holds, i.e. < −95 km s−1); in this analysis any such velocities are assigned to the tangential distance. Clouds with positive velocities have source distances greater than twice the tangent distance.

Figure 12. Radial velocity–distance relationships calculated for the centre of each square degree in DR1 using the McClure-Griffiths & Dickey (Reference McClure-Griffiths and Dickey2007) rotation curve for the inner Galaxy (i.e. negative velocities, with R < R⊙) in the fourth quadrant, with the Brand & Blitz (Reference Brand and Blitz1993) curve for the outer Galaxy (i.e. positive velocities, and scaled to give the same orbital velocity at R = R⊙). To the left, the galactocentric radius in kpc is plotted against radial velocity, V LSR in km s−1. To the right, distance from the Sun, D, in kpc is plotted against V LSR. Near-distance solutions assume D < D tangent ~ 7.0 kpc. Far-distance solutions are for D tangent < D < 2D tangent.
Figure 13 shows a position-velocity slice of the 12CO emission averaged over the primary degree of latitude of the DR1 data cube, overlaid with model positions of the spiral arms in a four-arm spiral galaxy. The parameters of the model galaxy have been taken from Vallée (Reference Vallée2014) and depict a four-arm spiral galaxy with a pitch angle of 12.5°, a central bar length of 3 kpc and Sun-Galactic centre distance of 8.0 kpc. While the molecular clouds clearly lie in striped bands across the position–velocity diagram, the exact centre of the spiral arms is harder to determine. The meta-analysis of Vallée (Reference Vallée2014) calculated the radius of the spiral arms to be near 400 pc from mid-arm to dust lane, which suggests that it is difficult to identify clearly the arm in which individual clouds reside, particularly in regions such as l = 329–330°, where the Norma and Scutum–Crux arms are close in velocity space.

Figure 13. 12CO position–velocity image for DR1, with the Galactic longitude, l on the x-axis, against the V LSR radial velocity in km s−1 on the y-axis. The data have been averaged over the central degree in latitude; residuals from poor data are evident in the vertical striping. The solid lines are model positions of the centre of the spiral arms in a four-arm spiral galaxy with pitch angle of 12.5°, a central bar length of 3 kpc, and a Sun-Galactic centre distance of 8.0 kpc (parameters from Vallée Reference Vallée2014). From the lower edge on the left axis these are: the Norma arm (near at − 100 km s−1 and far at − 60 km s−1; black dotted line), the Scutum–Crux arm (near; red dot–dashed line), the Sagittarius—Carina arm (near; blue-dashed line), the Scutum–Crux arm (far; red dot–dashed line) and the Sagittarius–Carina arm (far; blue-dashed line). Only a few clouds are visible in this furthest arm, and only in 12CO and 13CO.
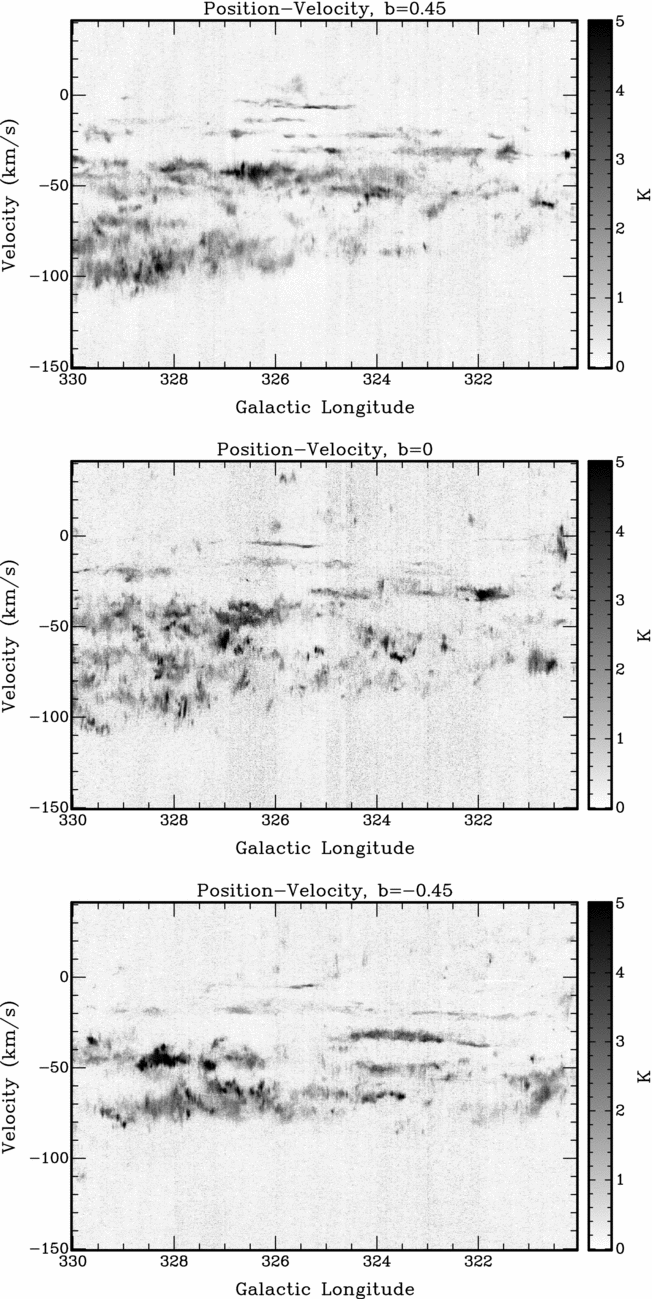
The distribution of molecular clouds with latitude is illustrated in Figure 14, which shows the position–velocity distribution of 12CO emission vertically averaged over the 6 arcmin surrounding each of b = 0° and ± 0.45°. The differences between these images is striking, showing how discrete the molecular gas is even within the Galactic plane. There is very little CO located at the ‘forbidden’ velocities indicated by Figure 12 at b = −0.45°, while the fastest negative velocities occur at the higher latitudes. It is also worth noting that the vertical streaking, caused by high-noise residuals in the data, occurs at different longitudes in the three position–velocity diagrams; these suggest that the methods used to clean high-noise columns work well, although individual pixels with poor baselines may remain.

Figure 14. 12CO position–velocity images for DR1, with the Galactic longitude, l on the x-axis, against the V LSR radial velocity in km s−1 on the y-axis. The data in each plot have been averaged over 6 arcmin in latitude, the upper image is centred on b = 0.45°, the central plot is the mid-plane b = 0° and the lower image is centred on b = −0.45°; residuals from poor data are evident in the vertical striping.
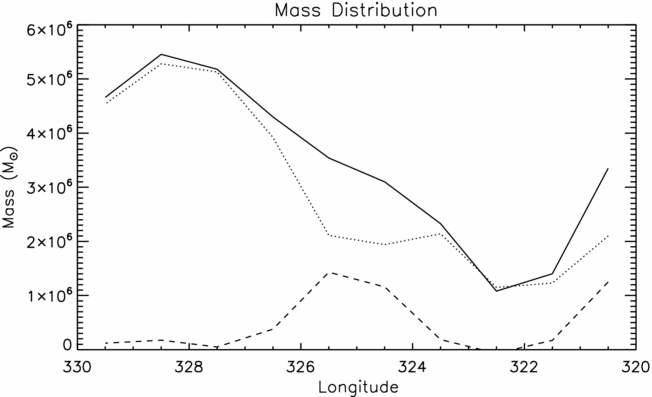
Figure 15 shows the distribution of mass in DR1, under the assumption that the clouds with negative velocities are located at the near distance (providing a lower limit on the true molecular mass), and that the X-factor used to link the CO intensity to the H2 column density is XCO = 2.7 × 1020 cm−2 (K km s−1)−1. This value is adopted for |b| < 1° using Figure 11 of Dame et al. (Reference Dame, Hartmann and Thaddeus2001), and while it is larger than their value of XCO = 1.8 × 1020 cm−2 (K km s−1)−1 for |b| > 5°, it is within the uncertainties recommended by Bolatto et al. (Reference Bolatto, Wolfire and Leroy2013) in their meta-analysis of X-factor values from observational and theoretical studies of the Milky Way. These simplifications were also adopted in Paper I to provide a lower limit on the molecular mass in G323; however, it was also shown that one of the five features in the spectrum was likely misidentified as being at the near distance rather than the far distance. This leads to an underestimate of the total mass of about one quarter, which is within the uncertainty of using a constant X-factor mass calibration.

Figure 15. Mass distribution in DR1, calculated from the 12CO emission per square degree using XCO = 2.7 × 1020 cm−2 (K km s−1)−1 (see the text). The dotted line is the mass contribution from molecular clouds at negative velocities (assumed to be at the near distance), the dashed line that from positive velocities (sited beyond the Solar circle), and the solid line is the total (all in units of Solar mass).
The mass distribution in Figure 15, while coarse, shows how the lower mass limit for each square degree varies over these 10° in longitude. The contributions to the total mass per degree from clouds at positive (far distances) and negative (nearer) velocities can be related to features in the position–velocity diagram in Figure 13. In particular, the lines of sight through l = 324–326° possess a large component of mass at positive velocities, arising from the clouds at + 35 km s−1 in the far Sagittarius–Carina arm (see Figure 11), while the increase at l = 320° is due to a large cloud at v = [ − 10, +10] km s−1, which cannot be associated with a single spiral arm using only the CO emission. The mass increases from a minimum at l ~ 322° of ~ 106 M⊙ to a maximum at l ~ 328° of ~ 5 × 10⁶ M⊙, with a total of ~ 4 × 10⁷ M⊙ within the 10° main survey span, where |b| < 0.5°. Of this, approximately 15% is situated beyond the Solar circle.
3.1 Sample science
The principal intention of this paper is to describe the CO data cubes that make up DR1. These may be used for a variety of applications, as they provide the distribution of the molecular gas along a substantive portion of the fourth quadrant of the Galaxy, as well as its dynamical motions. From this, column densities, optical depths and the three-dimensional molecular mass distribution can be inferred, such as were outlined above. Comparison with infrared to millimetre-wave continuum images, for instance, would allow star formation efficiencies to be determined, and the variation of the XCO conversion factor between CO flux and H2 column density to be examined on a galactic scale. Three sample science investigations that have been undertaken using the Mopra CO survey data are illustrated here.
The first compares the CO emission in the G328 region with that of [CI] 809 GHz (from the HEAT telescope in Antarctica) and HI 21 cm (from the Southern Galactic Plane Survey; McClure-Griffiths et al. Reference McClure-Griffiths, Dickey, Gaensler, Green, Haverkorn and Strasser2005) emission, discovering a cold, filamentary molecular cloud nearly 1° in length but only 5 arcsec across (Burton et al. Reference Burton2014). The emission was confined to a narrow (2 km s−1 FWHM) velocity range, with the hydrogen seen in self-absorption (i.e. HISA), apparently enveloping the molecular gas. The authors hypothesised that the formation of a molecular cloud was being witnessed, with the molecular material possibly condensing out of the atomic substrate. Further analysis of the entire data cube, not just the narrow velocity range associated with this filament, is now being undertaken to investigate the variation of the [CI] to CO ratio, and to search for evidence of ‘dark’ molecular gas. This is molecular gas where its normal tracer (CO) is weak, or absent (i.e. H2 without CO), so that the molecular gas has not been detected, or at least the amount has been underestimated. However, if CO is absent (presumably due to photodissociation by far-UV photons), the carbon will be present as either C or C+. These species emit in the THz spectral regime, where the HEAT telescope operates. Analysis of the complete data set (Burton et al. 2015, in preparation) indicates that at the edges of the molecular clouds there is a tendency for the [CI]/CO ratio to rise, as the CO itself falls, consistent with the existence of dark molecular gas.
The second example relates the Mopra CO data to X-ray emission. A bright X-ray flare was observed from the binary star Circinus X–1 in late 2013 by three spacecraft (Swift, Chandra, and XMM–Newton). Over a three-month period four well-defined rings were seen in the X-rays, extending outwards with time to a distance of 14 arcmin from the central source. This is in the G322 portion of our CO survey. Comparison of the Mopra data with the images from the X-ray satellites showed that each of the X-ray peaks in the rings is correlated with corresponding emission in the molecular gas. However, each has a different velocity, ranging from − 81 to − 32 km s−1 (see Heinz et al. Reference Heinz, Burton and Braiding2015). The X-rays are being scattered off clumps of dust associated with the molecular gas to produce the light echoes. Using the distances to these clumps inferred from the Galactic rotation curve, and the scattering geometry a direct kinematic distance could be determined for the source. This was found to be 9.4 kpc, significantly greater than the previously estimated 4 kpc. It implies that Circinus X–1 is a frequent super-Eddington source, producing a narrow jet with a collimation angle of θ < 3° and a Lorentz beaming factor of Γ > 22.
The final example relates the Mopra CO data to an unidentified radio continuum source known as PMN 1452–5910, thought possibly to be related to an SNR evident at 843 MHz from MOST data (Bock, Large, & Sadler Reference Bock, Large and Sadler1999), as analysed by Jones & Braiding (Reference Jones and Braiding2015). Three features are apparent in the Mopra CO spectrum towards this source, at − 50, −42, and − 1 km s−1. Their morphology, however, in comparison to that of the radio continuum, suggests that it is the − 1 km s−1 CO feature that is associated with the radio, so providing a distance to the source. This also identifies the source with an H2O maser at a similar velocity, and enables an interpretation of infrared images from the Spitzer telescope to be made. Jones & Braiding concluded that the source is a previously-unidentified massive star-forming region about 13 kpc away. They then determine parameters for the region: ~ 2 × 10⁴M⊙ of molecular gas with an average column of ~ 1021cm−2, enclosing several UCH ii regions with emission measures ~ 106 − 7 pc cm−6 and electron densities ~ 103 cm−3. Three OB stars (2 of type B0, 1 of O8) can account for the radio emission.
4 CONCLUSIONS
In their forthcoming Annual Review of molecular clouds in the Milky Way, Heyer & Dame (Reference Heyer and Dame2015) state: ‘For further progress in [molecular cloud census studies], surveys comparable to the Galactic Ring Survey (Jackson et al. Reference Jackson2006) in resolution and sensitivity in the fourth quadrant are required’. The first 10° of such a survey have been presented here. The Cherenkov Telescope Array will produce a new survey of the high energy gamma-ray sources in the Galactic plane (Dubus et al. Reference Dubus2013) at a resolution approaching 1 arcmin (Bernlöhr et al. Reference Bernlöhr2013). High-resolution molecular gas surveys such as this will be required to properly identify these sources amongst the diffuse TeV gamma-ray emission components CTA will likely detect (e.g. Acero et al. Reference Acero2013). The Mopra CO survey of the southern Galactic plane aims to address these community needs by observing the entirety of the fourth quadrant along the plane from l = 270 to 360° where |b| < 0.5°, at a spatial resolution of 35 arcsec and a spectral resolution of 0.1 km s−1, in the J = 1–0 lines of 12CO, 13CO, C18O, and C17O. This is a significant improvement over previous studies conducted of the fourth quadrant of the Galaxy.
DR1 from the Mopra CO survey covers the 11.5 deg2 from l = 320 to 330°, b = ±0.5° and l = 327 to 330°, b = +0.5–1.0°. Included in this paper are a number of metrics describing the quality of the dataset, which has a typical rms noise of ~ 1.3 K in the 12CO frequency band and ~ 0.5 K in the other isotopologue frequency bands, and a discussion of the improvement in the data taken during the winter months compared to the initial square degree observed in summer that was published in Paper I. The line intensities in the Mopra CO survey are ~ 1.4 times those of the Dame et al. (Reference Dame, Hartmann and Thaddeus2001) survey, and our higher resolution CO line profiles match those of their survey quite well. Sample line profiles for each square degree are presented, as well as integrated intensity maps that show the filamentary nature and complexity of the molecular clouds in the survey. The primary 10° × 1° strip of the Galactic plane in DR1 has been found to contain ~ 4 × 10⁷ M⊙ of molecular gas.
The Mopra CO survey is ongoing, with the intention of covering the entirety of the fourth quadrant of the Galactic plane by the end of 2015. The data are being made available at the survey website (see footnote 1), and in the CSIRO-ATNF data archive (see footnote 2), as they are published.
ACKNOWLEDGMENTS
The Mopra radio telescope is currently part of the Australia Telescope National Facility. Operations support was provided by the University of New South Wales and the University of Adelaide. Many staff of the ATNF have contributed to the success of the remote operations at Mopra. We particularly wish to acknowledge the contributions of David Brodrick, Philip Edwards, Brett Hiscock, Balt Indermuehle, and Peter Mirtschin. The University of New South Wales Digital Filter Bank used for the observations with the Mopra Telescope (the UNSW–MOPS) was provided with support from the Australian Research Council (ARC). We also acknowledge ARC support through Discovery Project DP120101585.
Finally, we thank the anonymous referee whose thoughtful comments have improved the clarity and accessibility of this paper.


