


1. Introduction
Reflection Nebulae (RNe) are diffuse clouds of gas and dust typically associated with star-forming regions. These RNe are illuminated by young stars and may be accompanied by emission nebulae (Mueller & Graham Reference Mueller and Graham2000; Eiermann et al. Reference Eiermann, Caputo, Lai and Witt2024). These nebulae are prominent in visible wavelengths, but the visible emission of a RN may be obstructed by dark molecular gas and dust, so the full extent is often better seen in near-infrared (Whitcomb et al. Reference Whitcomb1981) and far-infrared (Sellgren Reference Sellgren1984) wavelengths.
VdB-80 (also known as [RK68]-59), is a known Galactic RN in the constellation Monoceros, below the Galactic plane at
 $l\,=\,219.\!^\circ$
26,
$l\,=\,219.\!^\circ$
26,
 $b\,=\,-8{.\!^\circ}$
93 (RA(J2000)
$b\,=\,-8{.\!^\circ}$
93 (RA(J2000)
 $\sim 06^{\mathrm h}31^{\mathrm m}$
, DEC(J2000)
$\sim 06^{\mathrm h}31^{\mathrm m}$
, DEC(J2000)
 $\sim -9^\circ39^\prime$
, van den Bergh Reference van den Bergh1966; Rozhkovskij & Kurchakov Reference Rozhkovskij and Kurchakov1968; Magakian Reference Magakian2003).
$\sim -9^\circ39^\prime$
, van den Bergh Reference van den Bergh1966; Rozhkovskij & Kurchakov Reference Rozhkovskij and Kurchakov1968; Magakian Reference Magakian2003).
Hii regions are typically associated with sites of early star formation or young stellar clusters embedded in molecular clouds and are comprised of ionised hydrogen (Dyson & Williams Reference Dyson and Williams1997). Ahumada et al. (Reference Ahumada, Clariá, Bica, Dutra and Torres2001) did not see any signs of an Hii region towards VdB-80 in their optical spectra. Nonetheless, we identify radio emission detected by Australian Square Kilometre Array Pathfinder (ASKAP) as an Hii region that we name ‘Lagotis’,Footnote a associated with a stellar cluster in the ‘Crossbones’ molecular cloud, and it is proposed that the star HD 46060 is the centre of both RN and Hii region.
The Crossbones is a filamentary cloud structure located within the Mon R2 complex, first characterised by Maddalena et al. (Reference Maddalena, Morris, Moskowitz and Thaddeus1986), potentially related to the Orion-Eridanus superbubble (Lee & Chen Reference Lee and Chen2009). This ‘X’ shaped structure is an active star-forming region, with VdB-80 bordering the cloud near to its centre. The structure is most clear in maps of the (J = 1–0) rotational transition of
 $^{12}$
CO (Dame et al. Reference Dame1987; Ghosh, Remazeilles, & Delabrouille Reference Ghosh, Remazeilles and Delabrouille2024.
$^{12}$
CO (Dame et al. Reference Dame1987; Ghosh, Remazeilles, & Delabrouille Reference Ghosh, Remazeilles and Delabrouille2024.
The ASKAP (Hotan et al. Reference Hotan2021) Evolutionary Map of the Universe (EMU) (Norris et al. Reference Norris2011, Reference Norris2021, Hopkins et al., PASA, submitted.) survey has provided new radio-continuum observations of this region with improved sensitivity compared to any previous radio-continuum surveys. Higher sensitivity has allowed for the first reliable detection of radio-continuum emission toward VdB-80. This new radio detection allows us to estimate properties of the RN that confirm the presence of a Hii region, as well as confirming HD 46060’s role as the star responsible for creating both features.
This radio detection demonstrates the ability of the newest generation of radio surveys, such as EMU, to detect new low surface-brightness emission. This has been demonstrated in several new discoveries, such as supernova remnants G181.1–9.5 (Kothes et al. Reference Kothes, Reich, Foster and Reich2017), J0624–6948 (Filipović et al. Reference Filipović2022), G288.8–6.3 (Ancora; Filipović et al. Reference Filipović2023; Burger-Scheidlin et al. Reference Burger-Scheidlin2024), G121.1–1.9 (Khabibullin et al. Reference Khabibullin, Churazov, Bykov, Chugai and Sunyaev2023), G308.7+1.4 (Raspberry; Lazarević et al. Reference Lazarević2024a), G312.6+ 2.8 (Unicycle; Smeaton et al. Reference Smeaton2024), and a pulsar wind nebula (Potoroo; Lazarević et al. Reference Lazarević2024b).
The paper is structured as follows: Section 2 outlines the data used, including radio, optical, and infrared data, both new and archival. Section 3 provides analysis and interpretation of Lagotis, this includes distance, size, emission properties and the context of the RN within the Crossbones filaments. Section 4 provides a brief summary of our results and interpretation of Lagotis.
2. Data
2.1 Radio observations
2.1.1 TheAustralian Square KilometreArray Pathfinder
The radio emission associated with VdB-80 was discovered in the ASKAP EMU (AS201) survey. Lagotis appears in two separate EMU observations: Scheduling Block SB59692 observed tile EMU
 $\_0626-09$
A on 2024 March 02, and SB61077 observed tile EMU
$\_0626-09$
A on 2024 March 02, and SB61077 observed tile EMU
 $\_0626-09$
B on 2024 April 13. Both observations were taken at 943.5 MHz with a bandwidth of 288 MHz. The data were reduced using the standard ASKAP pipeline, ASKAPSoft, using multi-frequency synthesis imaging, multi-scale cleaning, self-calibration and convolution to a common beam size (Guzman et al. Reference Guzman2019).
$\_0626-09$
B on 2024 April 13. Both observations were taken at 943.5 MHz with a bandwidth of 288 MHz. The data were reduced using the standard ASKAP pipeline, ASKAPSoft, using multi-frequency synthesis imaging, multi-scale cleaning, self-calibration and convolution to a common beam size (Guzman et al. Reference Guzman2019).
We merged the two images using Multichannel image reconstruction, image analysis and display (MIRIAD) (Sault, Teuben, & Wright Reference Sault, Teuben, Wright, Shaw, Payne and Hayes1995) task imcomb. This merges the images together while applying weighting in the overlapped region to minimise rms noise. SB59692 had significantly more interference from a nearby bright star, and so the weighting ratio of 1:1.5, for SB59692:SB61077, was used to produce the best image. The resulting Stokes I image (Fig. 1) has a restored beam size of
 $15\times15.\!^{\prime\prime}$
and a local rms noise of
$15\times15.\!^{\prime\prime}$
and a local rms noise of
 $\sim$
20
$\sim$
20
 $\mu$
Jy beam
$\mu$
Jy beam
 $^{-1}$
. There is no corresponding Stokes V emission.
$^{-1}$
. There is no corresponding Stokes V emission.
2.1.2 NRAO VLA Sky Survey
The NRAO VLA Sky Survey (NVSS) covers the entire sky north of
 $-40^\circ$
(Condon et al. Reference Condon1998), at 1.4 GHz in the radio continuum, with bandwidth 50 MHz. The Lagotis Hii region is also present in this survey, which is used in Section 3.1 to obtain characteristics of the RN in radio wavelengths. The NVSS image used has a resolution of 45
$-40^\circ$
(Condon et al. Reference Condon1998), at 1.4 GHz in the radio continuum, with bandwidth 50 MHz. The Lagotis Hii region is also present in this survey, which is used in Section 3.1 to obtain characteristics of the RN in radio wavelengths. The NVSS image used has a resolution of 45
 $^{\prime \prime}\times$
45
$^{\prime \prime}\times$
45
 $^{\prime \prime}$
and a measured local rms noise of
$^{\prime \prime}$
and a measured local rms noise of
 $\sim$
40
$\sim$
40
 $\mu$
Jy beam
$\mu$
Jy beam
 $^{-1}$
.
$^{-1}$
.
2.1.3 CO data
The Crossbones cloud was first observed by Maddalena et al. (Reference Maddalena, Morris, Moskowitz and Thaddeus1986) as part of the Columbia CO survey of the galaxy (Dame et al. Reference Dame1987). Newer
 $^{12}$
CO (
$^{12}$
CO (
 $J=1\rightarrow 0$
) maps of the Galaxy have been derived from the broadband millimetre-wave maps obtained by the Planck satellite (Ghosh et al. Reference Ghosh, Remazeilles and Delabrouille2024).
$J=1\rightarrow 0$
) maps of the Galaxy have been derived from the broadband millimetre-wave maps obtained by the Planck satellite (Ghosh et al. Reference Ghosh, Remazeilles and Delabrouille2024).
2.2 Optical observations
van den Bergh (Reference van den Bergh1966) identified HD 46060 as the illuminating star of the RN, noting that it is ‘in a small compact clustering which includes BD
 $-9^\circ\, 1497$
.’ Orellana et al. (Reference Orellana, De Biasi, Paz, Bustos Fierro and Calderón2015) used the UCAC4 astrometric catalogue to identify 8 cluster members of the 23 proposed by Bonatto & Bica (Reference Bonatto and Bica2009).
$-9^\circ\, 1497$
.’ Orellana et al. (Reference Orellana, De Biasi, Paz, Bustos Fierro and Calderón2015) used the UCAC4 astrometric catalogue to identify 8 cluster members of the 23 proposed by Bonatto & Bica (Reference Bonatto and Bica2009).
2.2.1 Gaia
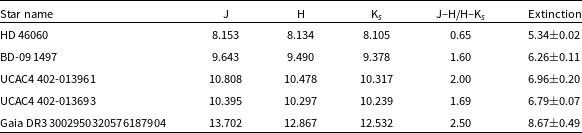
Gaia data for 5 stars that appear to lie within the radio-continuum emission were taken from the Gaia Data Release 3 (DR3) (Gaia Collaboration et al. 2016, 2023) catalogue. These values, as well as derived distances, are reported in Table 1. Three of these stars are also listed by Orellana et al. (Reference Orellana, De Biasi, Paz, Bustos Fierro and Calderón2015); the proper motions are fairly similar, except for UCAC4 402-013691 – Orellana et al. do not consider it to be a cluster member, but the Gaia proper motion (PM) measurement are much closer to the cluster average.
Table 1. Gaia properties of stars within VdB-80. Columns [2] and [3] are FK5 (J2000) right ascension and declination positions. Column [4] is parallax and its associated error in milliarcseconds. Column [5] is distance and its associated error, as calculated from column [4], in parsecs. Column [6] is the right ascension proper motion, and column [7] is the declination proper motion in milliarcseconds per year.
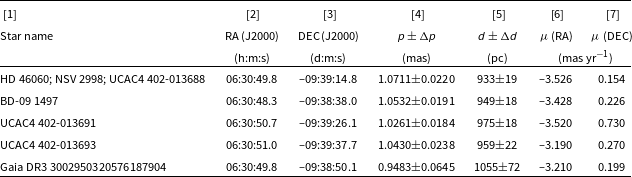
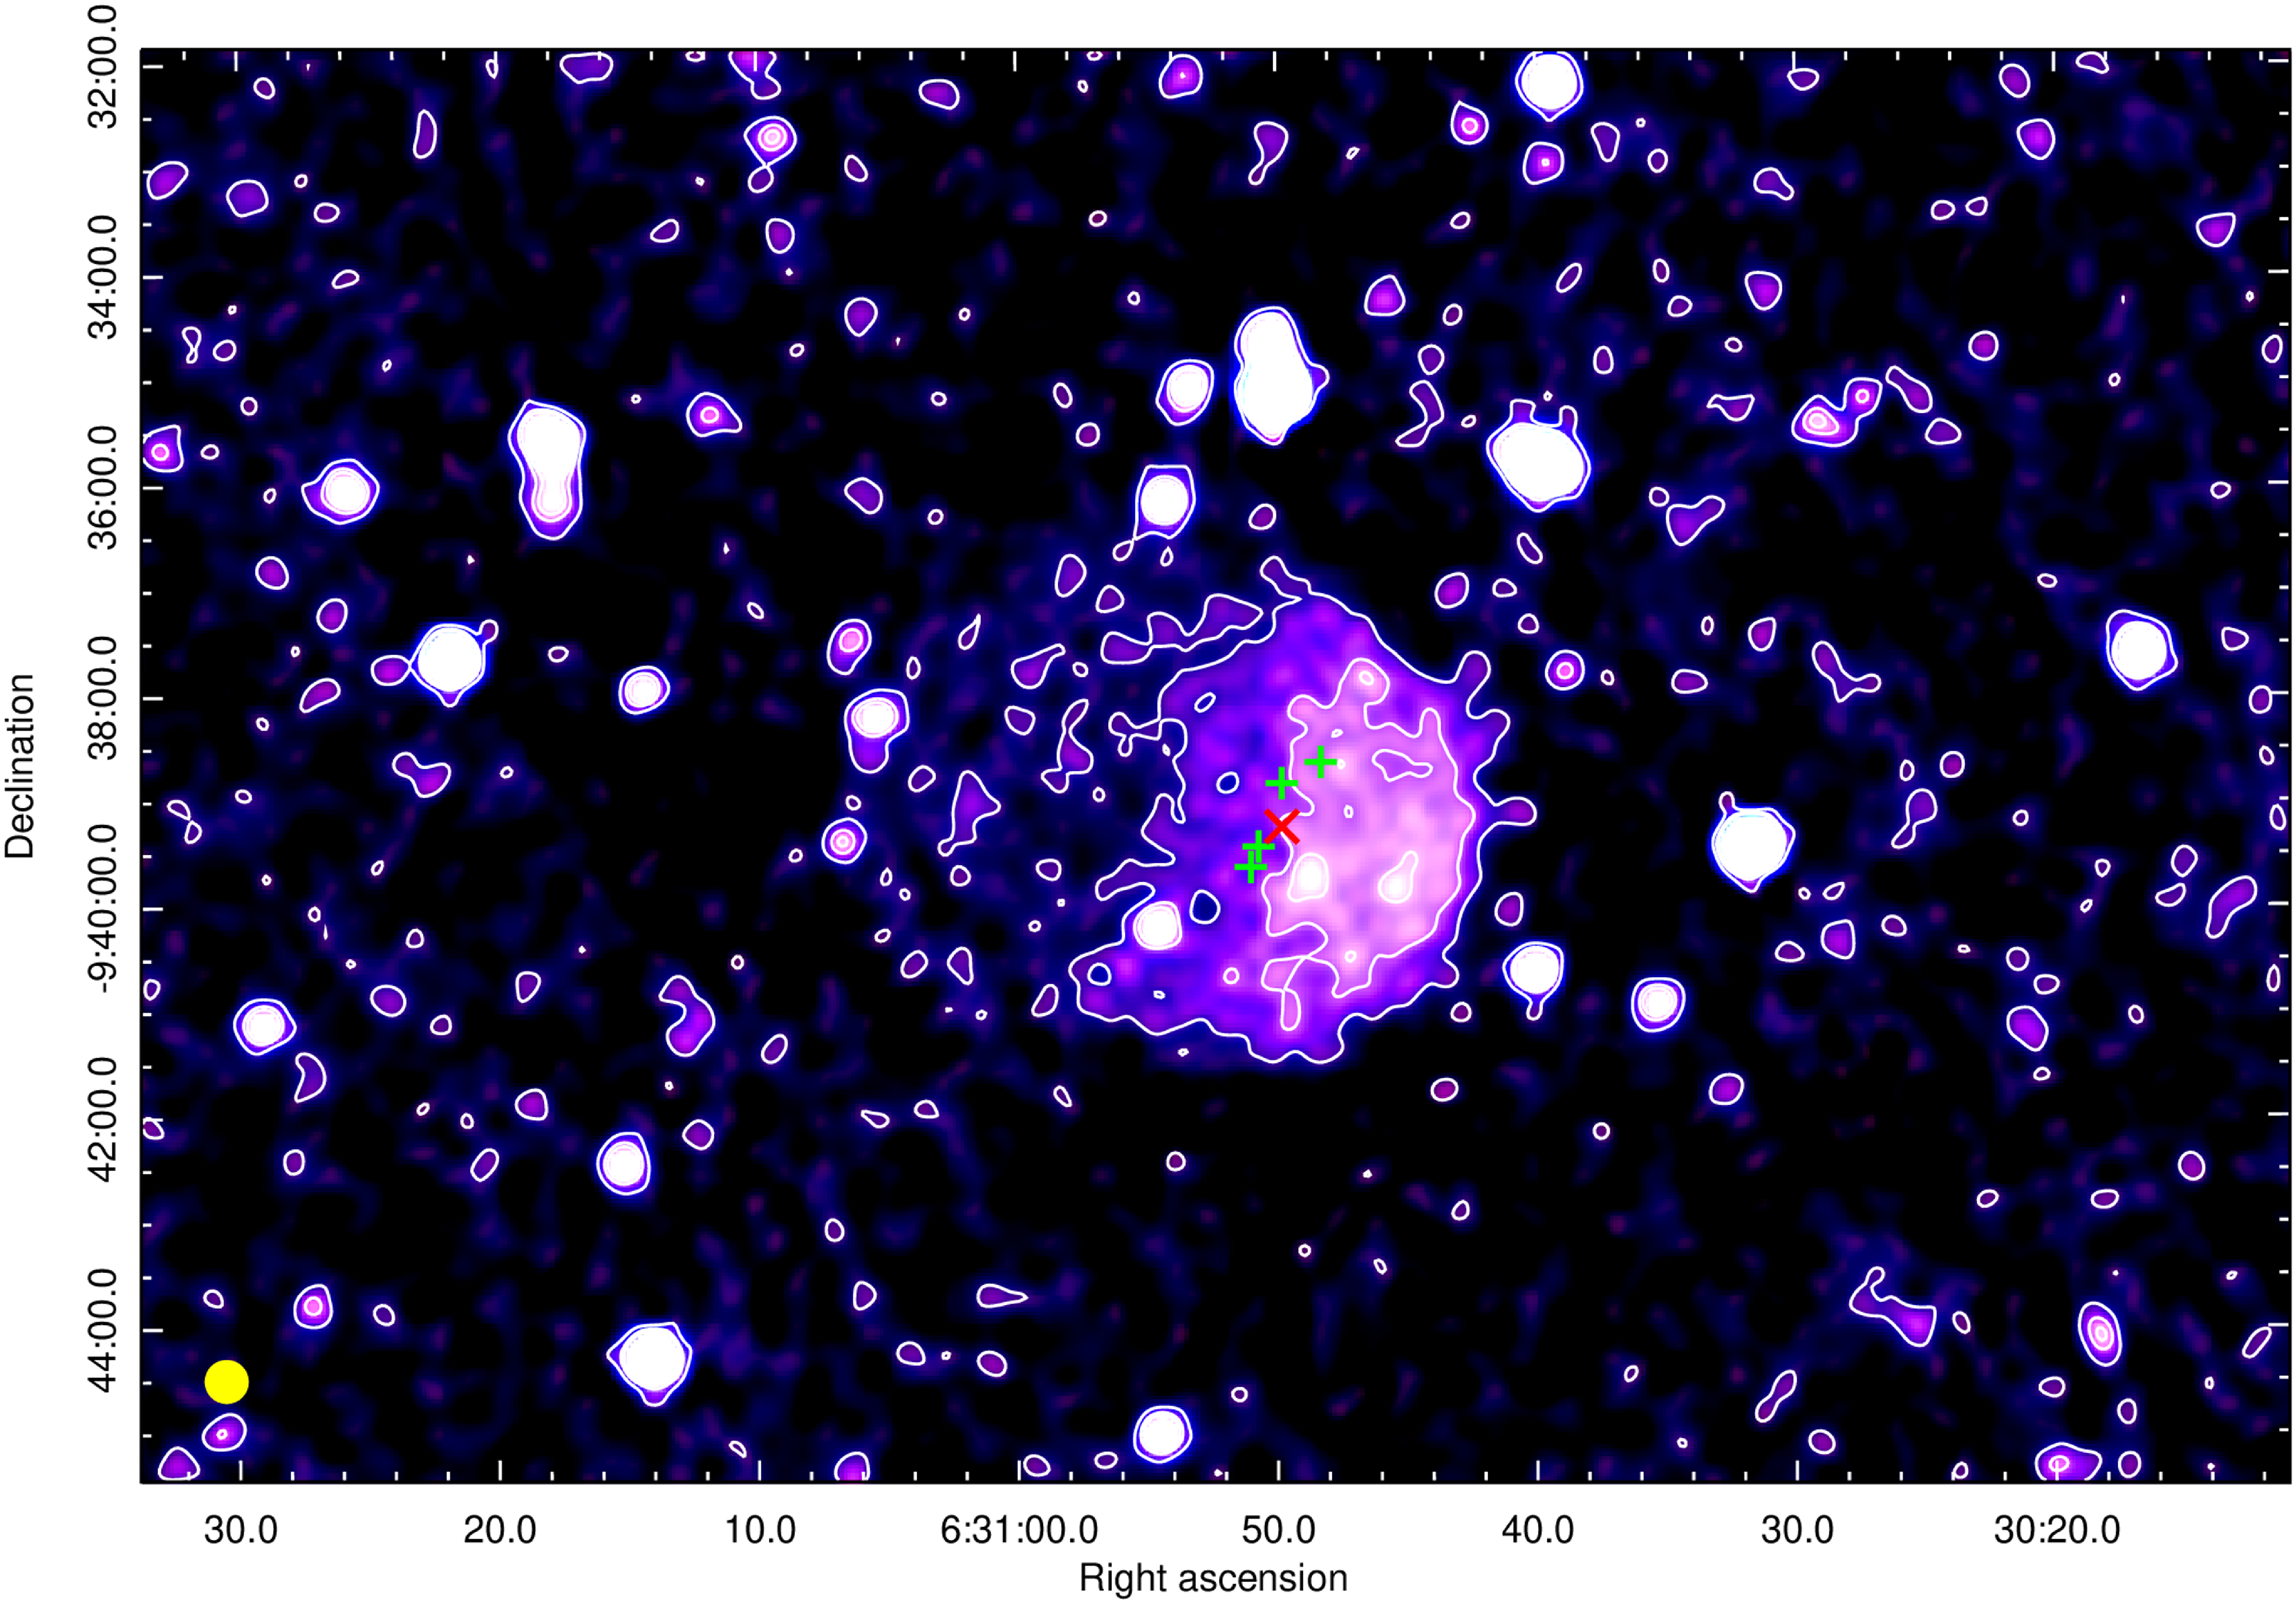
Figure 1. EMU radio-continuum image of Lagotis and VdB-80 at 944 MHz. Local RMS noise is 20
 $\,\mu$
Jy beam
$\,\mu$
Jy beam
 $^{-1}$
, and contours are at levels of 3, 10 and 15
$^{-1}$
, and contours are at levels of 3, 10 and 15
 $\sigma$
. The image resolution is
$\sigma$
. The image resolution is
 $15\times15.^{\prime\prime}$
, represented with the yellow circle in the bottom left corner. The red ‘X’ denotes the star HD 46060, and the green crosses denote the other stars in the cluster (see Table 1).
$15\times15.^{\prime\prime}$
, represented with the yellow circle in the bottom left corner. The red ‘X’ denotes the star HD 46060, and the green crosses denote the other stars in the cluster (see Table 1).
2.3 Infrared observations
2.3.1 Two Micron All Sky Survey
Data were collected from Two Micron All Sky Survey (2MASS) (Skrutskie et al. Reference Skrutskie2006) and used in Section 3.2 to determine accurate distance estimates to the VdB-80, as well as confirming the distance association to the Lagotis Hii region. The 2MASS All Sky Catalogue of point sources provides the magnitudes of the RN associated stars in the J, H and K
 $_\mathrm{s}$
(1.25, 1.65, and 2.17
$_\mathrm{s}$
(1.25, 1.65, and 2.17
 $\mu$
m) infrared bands. To verify the association of the RN and the Hii region, these magnitudes, as well as a 2MASS J–H/H–K
$\mu$
m) infrared bands. To verify the association of the RN and the Hii region, these magnitudes, as well as a 2MASS J–H/H–K
 $_s$
extinction map from Froebrich et al. (Reference Froebrich, Murphy, Smith, Walsh and Del Burgo2007), were used to determine stellar position and dust extinction values.
$_s$
extinction map from Froebrich et al. (Reference Froebrich, Murphy, Smith, Walsh and Del Burgo2007), were used to determine stellar position and dust extinction values.
2.3.2 Wide-Field Infrared Survey Explorer
The Wide-Field Infrared Survey Explorer (WISE) is an all-sky survey in near- and mid-infrared (Wright et al. Reference Wright2010). Observations were taken in four bands, W1, W2, W3, and W4 with wavelengths 3.4, 4.6, 12, and 22
 $\mu$
m. The W3 and W4 bands are used with EMU data (Fig. 2) to trace the mid-infrared emitting gas and dust that shows the full extent of the RN (Filipović & Tothill Reference Filipović and Tothill2021a) at wavelengths other than optical.
$\mu$
m. The W3 and W4 bands are used with EMU data (Fig. 2) to trace the mid-infrared emitting gas and dust that shows the full extent of the RN (Filipović & Tothill Reference Filipović and Tothill2021a) at wavelengths other than optical.
2.3.3 AKARI
The AKARI far-infrared All-Sky Survey (Doi et al. Reference Doi2015) comprises four far-infrared bands (65, 90, 140, and 160
 $\mu$
m). AKARI data show the gas and dust shroud surrounding the Lagotis Hii region and VdB-80 (Fig. 3) and are used in conjunction with optical and radio images to create an RGB composite (Fig. 4). AKARI survey data are useful for mapping the local area surrounding VdB-80, as well as the broader context of the Crossbones filaments.
$\mu$
m). AKARI data show the gas and dust shroud surrounding the Lagotis Hii region and VdB-80 (Fig. 3) and are used in conjunction with optical and radio images to create an RGB composite (Fig. 4). AKARI survey data are useful for mapping the local area surrounding VdB-80, as well as the broader context of the Crossbones filaments.
3. Results and discussion
3.1 VdB-80 radio-continuum association
Lagotis, the VdB-80-associated radio-continuum emission detected with EMU is a roughly semi-circular feature with brighter emission in the western part (Fig. 1). It can be fitted by an ellipse with size
 $2.{\!^\prime}7\times2.{\!^\prime}4$
, centred at RA(J2000) 6
$2.{\!^\prime}7\times2.{\!^\prime}4$
, centred at RA(J2000) 6
 $^\textrm{h}$
30
$^\textrm{h}$
30
 $^\textrm{m}$
53.5
$^\textrm{m}$
53.5
 $^\textrm{s}$
and Dec(J2000)
$^\textrm{s}$
and Dec(J2000)
 $9^\circ39^\prime08{{{.\!^{\prime\prime}}}}6$
. The whole Lagotis structure has an integrated flux density of 30.2
$9^\circ39^\prime08{{{.\!^{\prime\prime}}}}6$
. The whole Lagotis structure has an integrated flux density of 30.2
 $\pm$
3.1 mJy.Footnote b The western side of the feature appears much brighter than the eastern, with integrated flux densities of 25.6
$\pm$
3.1 mJy.Footnote b The western side of the feature appears much brighter than the eastern, with integrated flux densities of 25.6
 $\pm$
2.6 mJy and 4.6
$\pm$
2.6 mJy and 4.6
 $\pm$
0.5 mJy.
$\pm$
0.5 mJy.
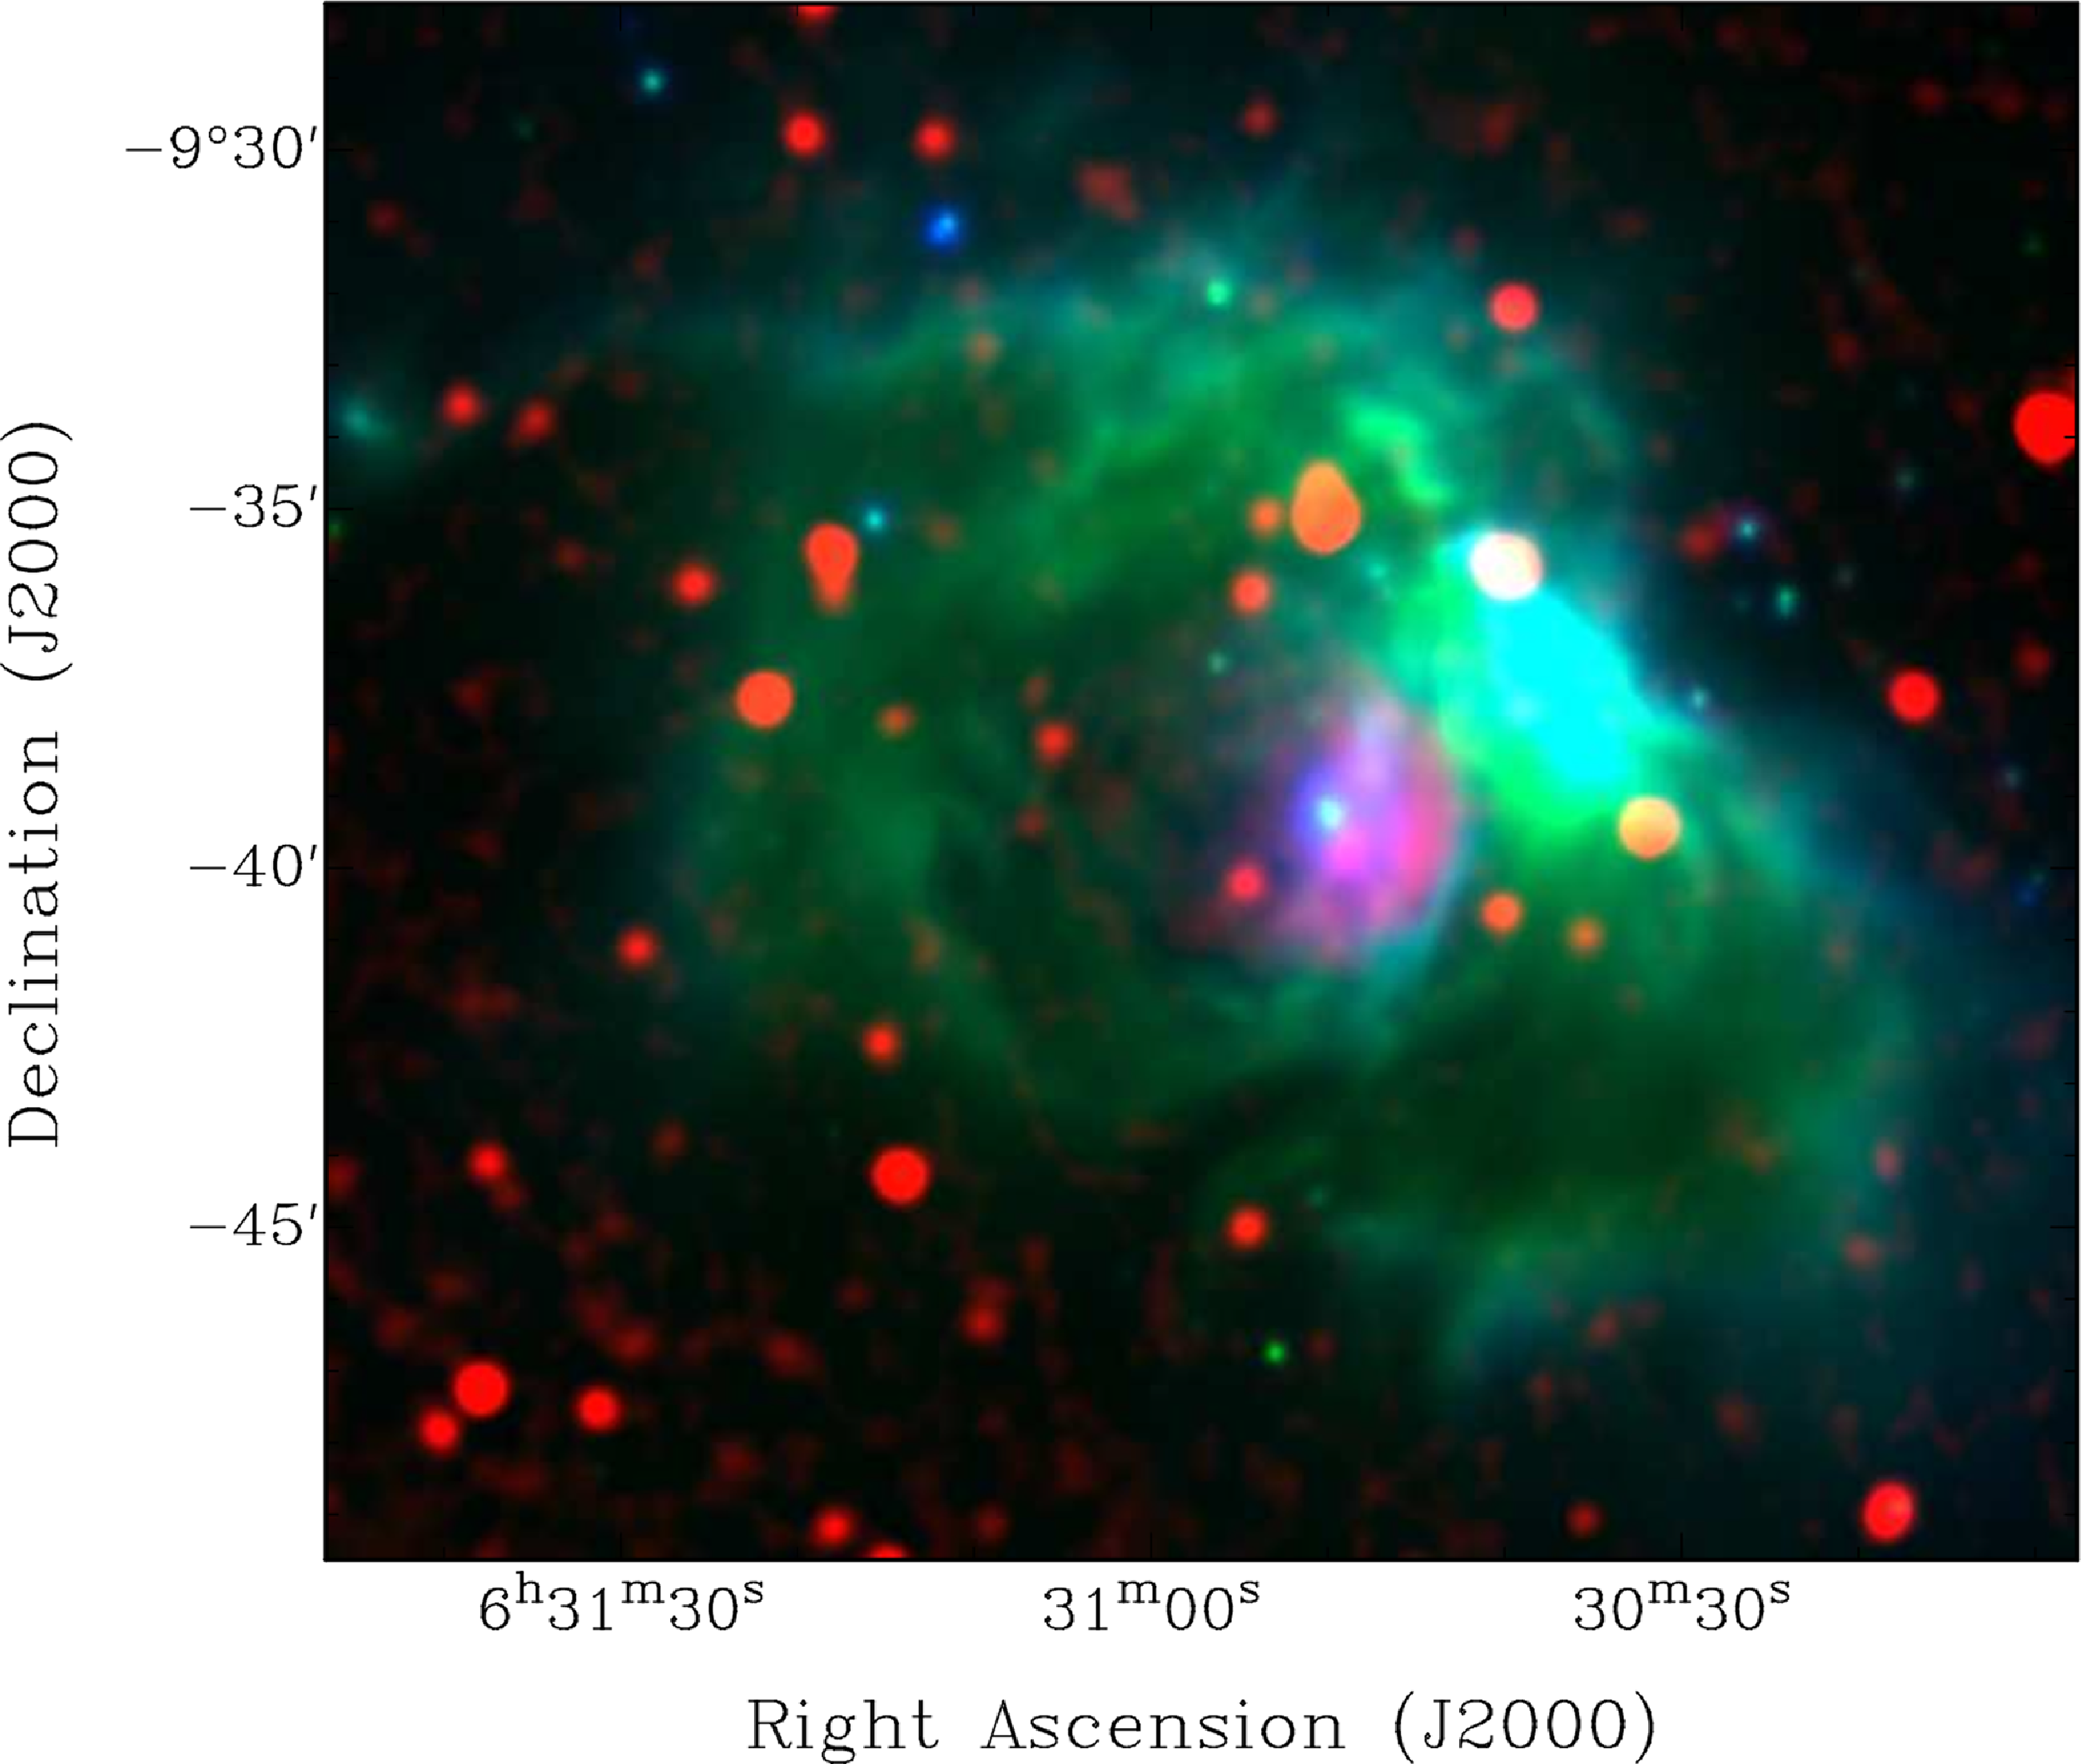
Figure 2. An RGB image tracing the near-infrared emission of VdB-80, where red is the EMU tile SB61077 (smoothed to a 25" resolution) at 943.5 GHz, green is the WISE W3 band (12
 $\mu$
m) and blue is the WISE W4 band (22
$\mu$
m) and blue is the WISE W4 band (22
 $\mu$
m).
$\mu$
m).
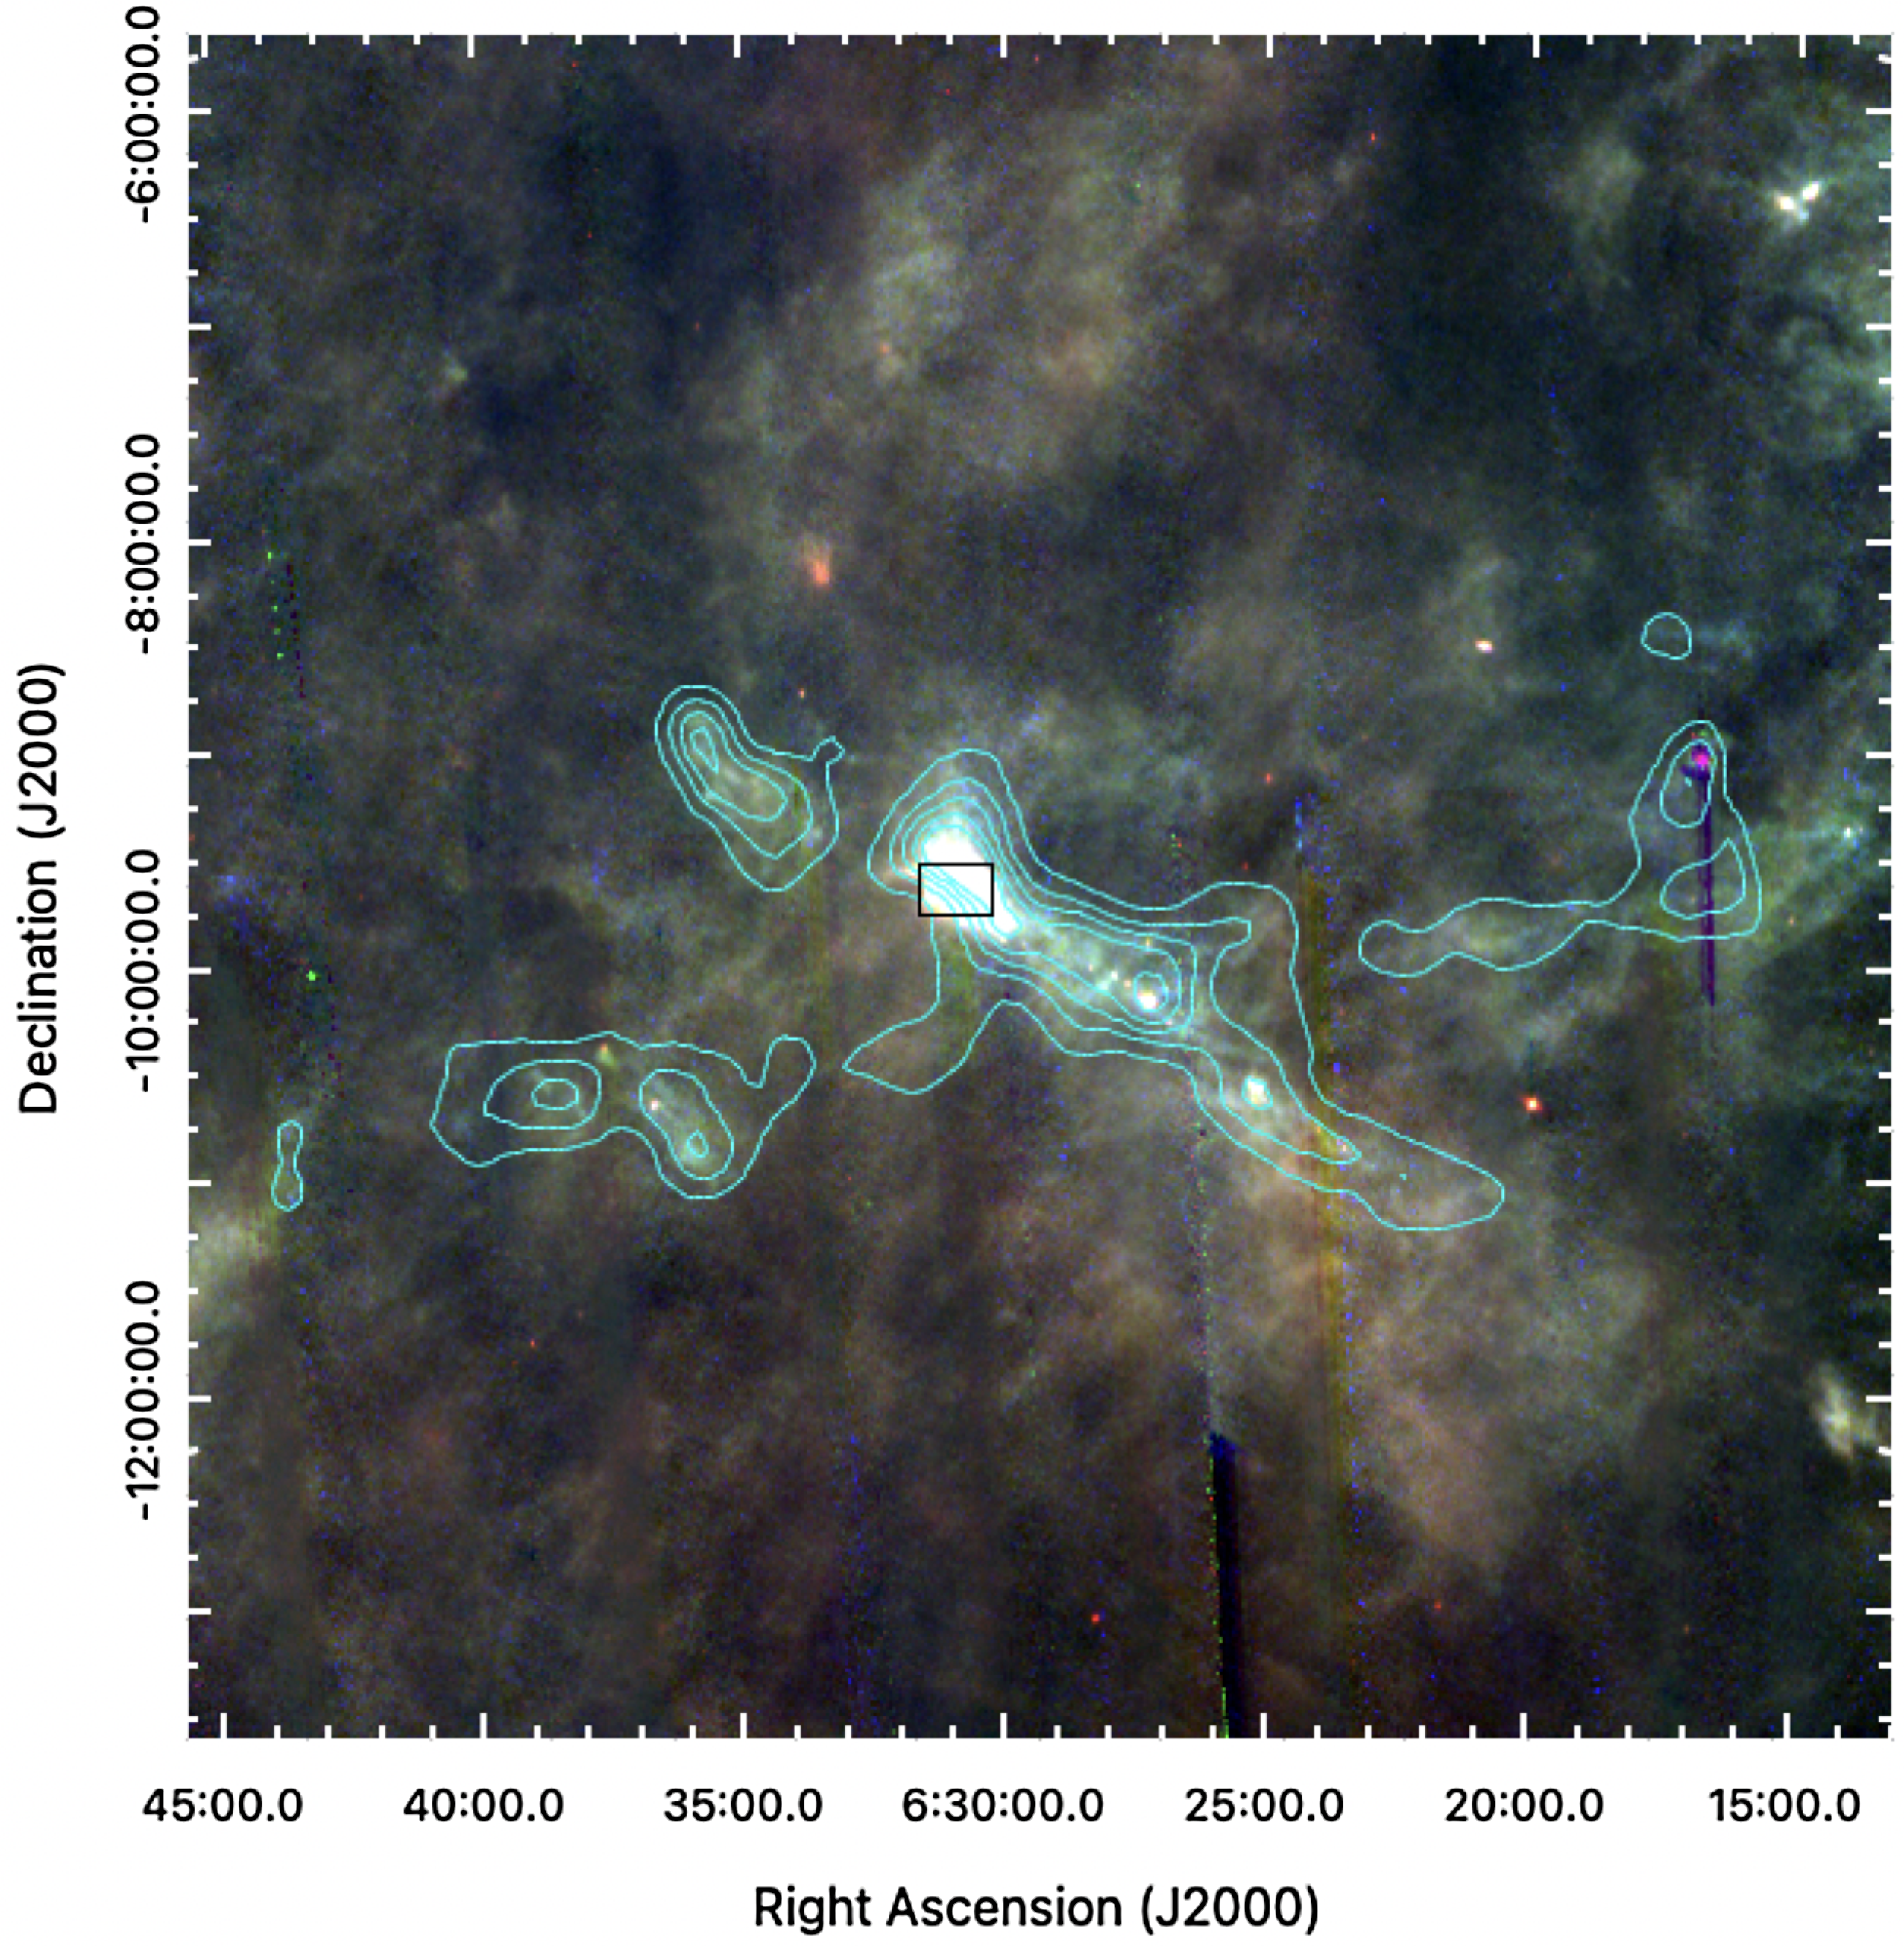
Figure 3. RGB composite image of the Crossbones filaments in far-infrared. Red is AKARI N160 (160
 $\mu$
m band), green is AKARI WIDE-L (140
$\mu$
m band), green is AKARI WIDE-L (140
 $\mu$
m band) and blue is AKARI WIDE-S (90
$\mu$
m band) and blue is AKARI WIDE-S (90
 $\mu$
m band). Contours in cyan are generated from the
$\mu$
m band). Contours in cyan are generated from the
 $^{12}$
CO (J = 1–0) map provided by Ghosh et al. (Reference Ghosh, Remazeilles and Delabrouille2024). The black square in the image represents the size of Fig. 1, Lagotis corresponds to the bright emission in far-infrared. Fragmented vertical lines present in the image are artefacts from AKARI observations.
$^{12}$
CO (J = 1–0) map provided by Ghosh et al. (Reference Ghosh, Remazeilles and Delabrouille2024). The black square in the image represents the size of Fig. 1, Lagotis corresponds to the bright emission in far-infrared. Fragmented vertical lines present in the image are artefacts from AKARI observations.
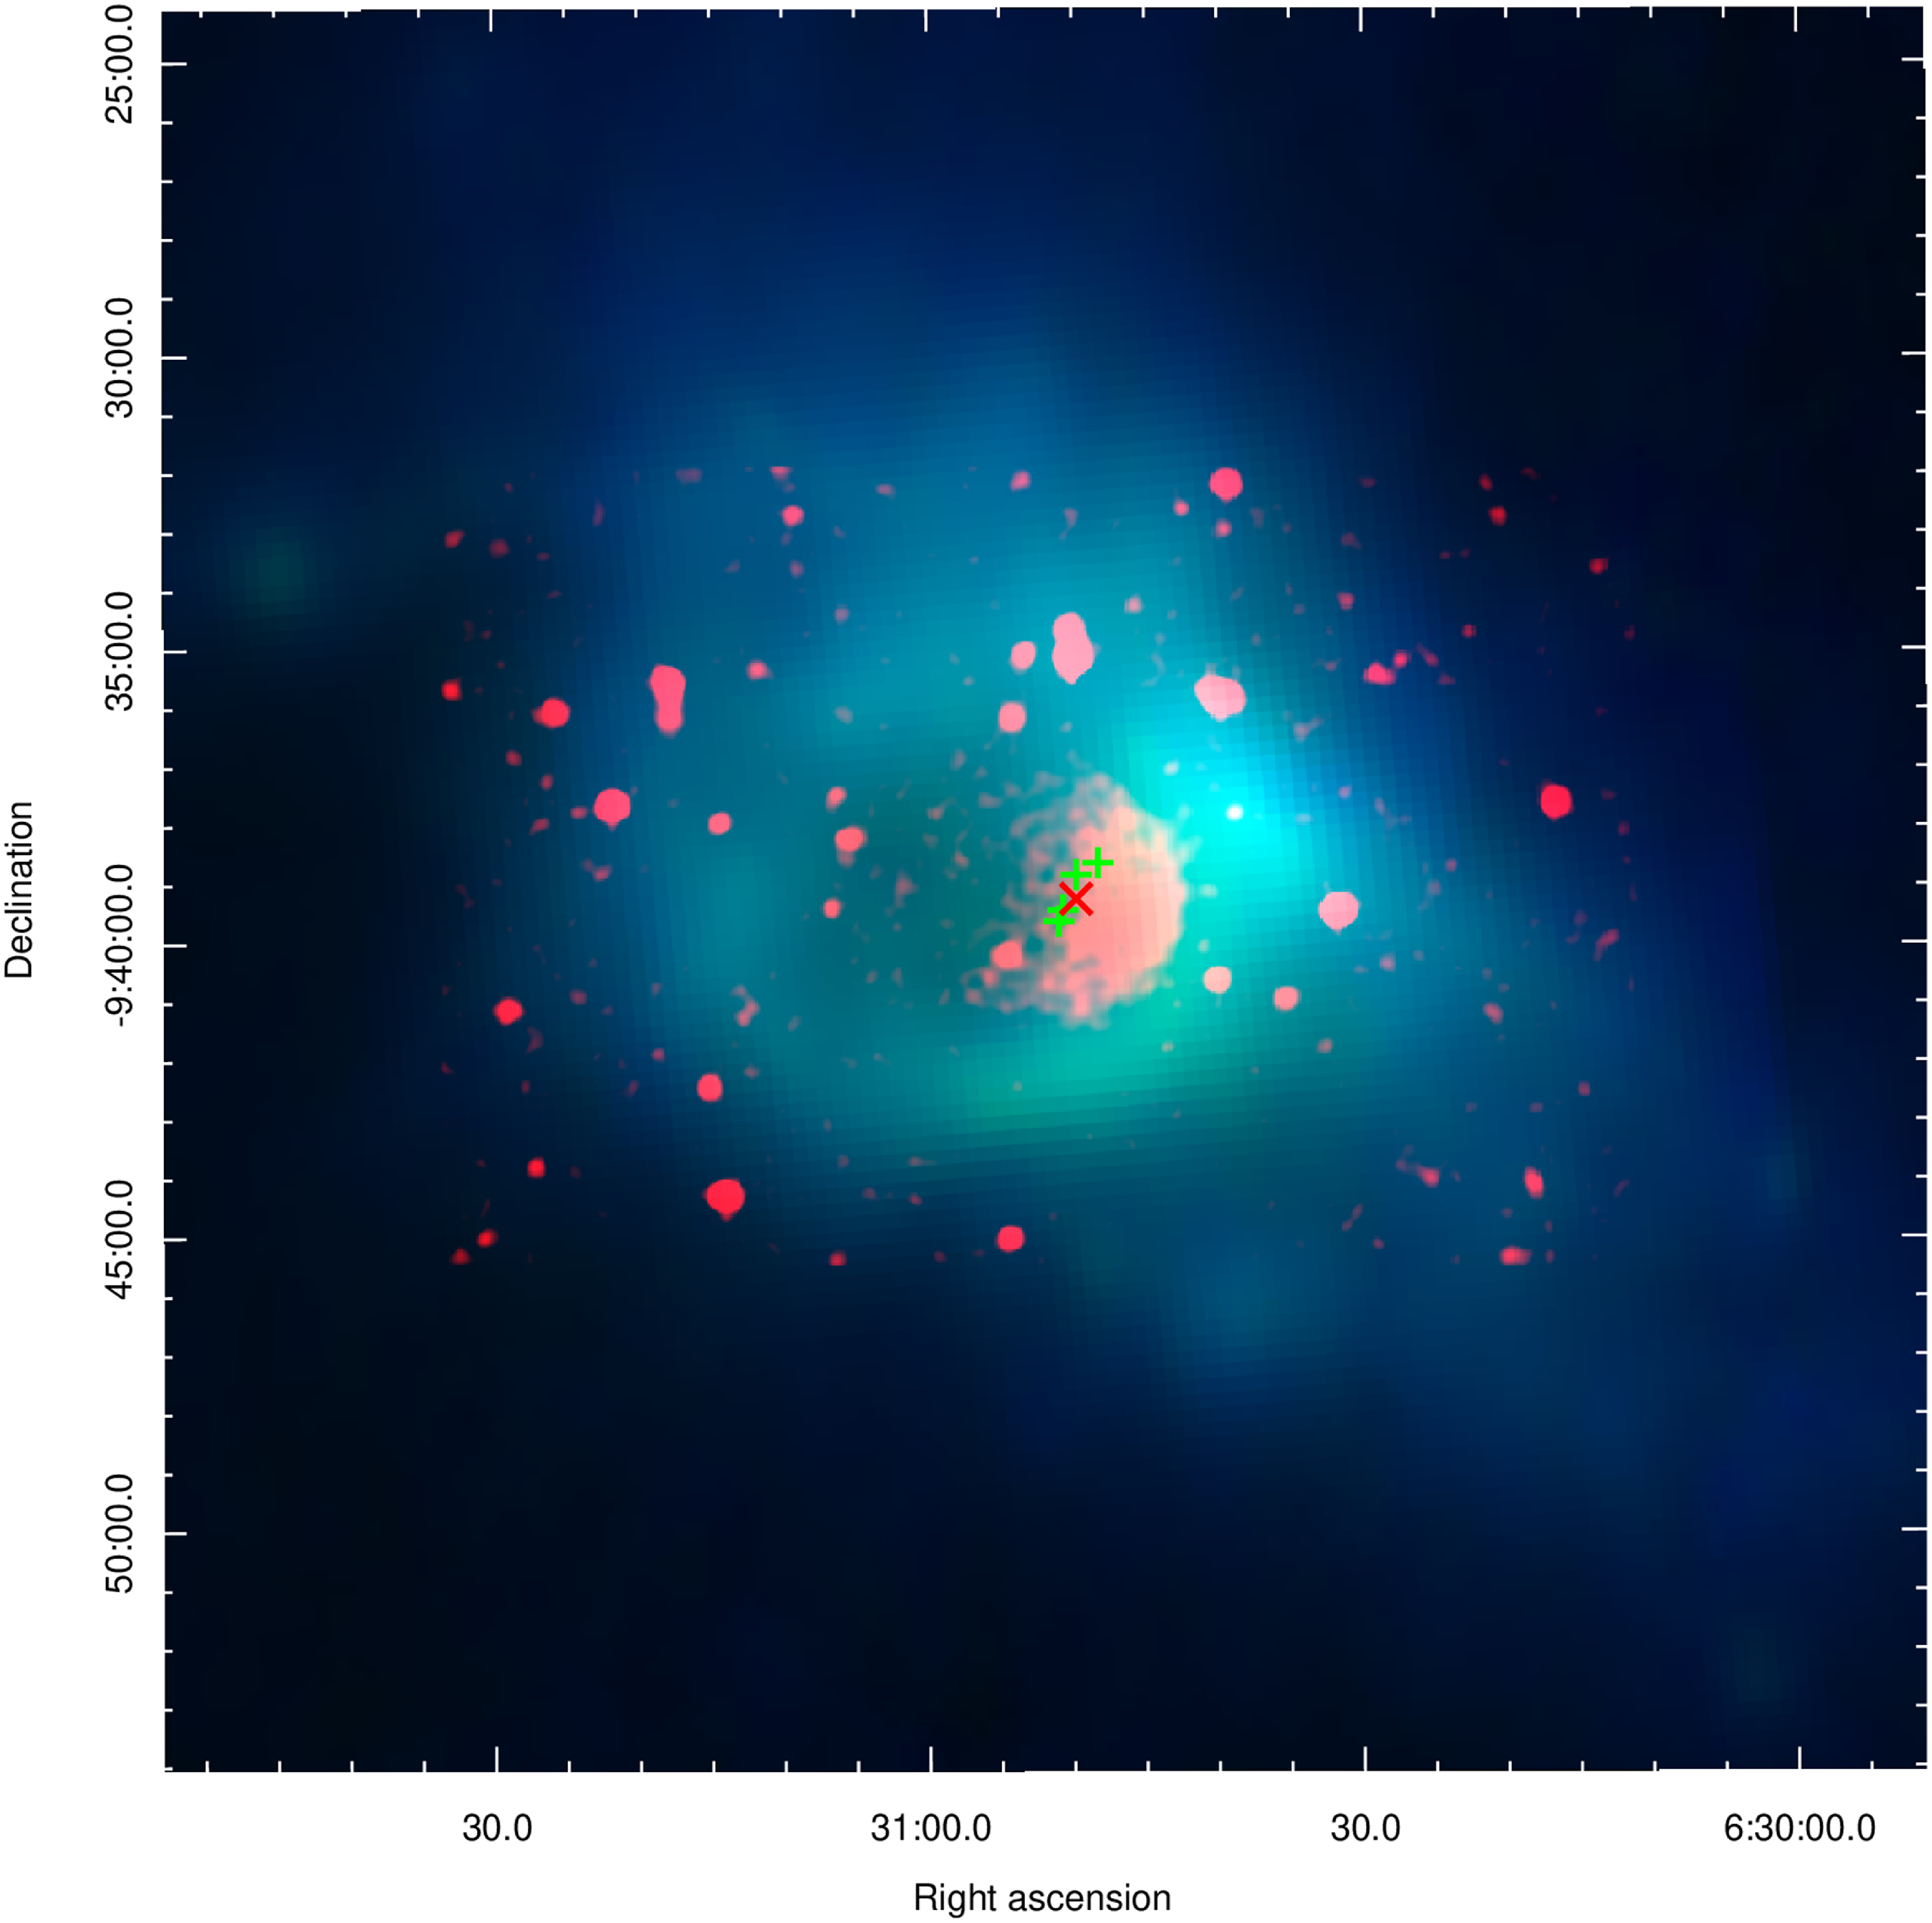
Figure 4. RGB image of Lagotis Hii region and VdB-80, where red is the EMU radio image (943.5 MHz), green is an AKARI wide-S band (90
 $\mu$
m) image, and blue is an AKARI wide-L band (140
$\mu$
m) image, and blue is an AKARI wide-L band (140
 $\mu$
m) image. The red ‘X’ denotes the star HD 46060, and the green crosses denote the other stars in the cluster (Table 1).
$\mu$
m) image. The red ‘X’ denotes the star HD 46060, and the green crosses denote the other stars in the cluster (Table 1).
Lagotis is detected in the NVSS survey at 1.4 GHz under the name NVSS 063048-094007 (Condon et al. Reference Condon1998). Whilst this has been catalogued in NVSS, there has been no study regarding this emission as an Hii region. The radio emission at 1.4 GHz has a measured flux of 39.1
 $\pm$
3.9 mJy, and so a spectral index can be estimated, following the spectral index definition
$\pm$
3.9 mJy, and so a spectral index can be estimated, following the spectral index definition
 $S\propto\nu^{\alpha}$
(Filipović & Tothill Reference Filipović and Tothill2021b). Convolving the EMU data to the same resolution as NVSS (beam size =
$S\propto\nu^{\alpha}$
(Filipović & Tothill Reference Filipović and Tothill2021b). Convolving the EMU data to the same resolution as NVSS (beam size =
 $45\times45{{{.\!^{\prime\prime}}}}$
, pixel size = 10
$45\times45{{{.\!^{\prime\prime}}}}$
, pixel size = 10
 $\times10{{{.\!^{\prime\prime}}}}$
) gives a spectral index of 0.7
$\times10{{{.\!^{\prime\prime}}}}$
) gives a spectral index of 0.7
 $\pm$
0.5, a fairly flat spectrum which is indicative of thermal radio emission. This spectral index estimate allows us to estimate a surface brightness value of
$\pm$
0.5, a fairly flat spectrum which is indicative of thermal radio emission. This spectral index estimate allows us to estimate a surface brightness value of
 $\Sigma_{1\,\text{GHz}}$
 $\sim$
7.3
$\sim$
7.3
 $\times$
10
$\times$
10
 $^{-22}$
W m
$^{-22}$
W m
 $^{-2}$
Hz
$^{-2}$
Hz
 $^{-1}$
sr
$^{-1}$
sr
 $^{-1}$
; assuming a distance of 960 pc, this gives a luminosity at 1 GHz of
$^{-1}$
; assuming a distance of 960 pc, this gives a luminosity at 1 GHz of
 $\sim3.6 \times 10^{12}$
W Hz
$\sim3.6 \times 10^{12}$
W Hz
 $^{-1}$
. The approximately circular radio emission fits well inside the far-infrared emitting shell of gas and dust, as shown in Fig. 4.
$^{-1}$
. The approximately circular radio emission fits well inside the far-infrared emitting shell of gas and dust, as shown in Fig. 4.
3.2 Distance and size
Gaia parallaxes of the young stars associated with the RN VdB-80 and in the centre of the Lagotis Hii region (Table 1) are taken from Gaia DR3 (Gaia Collaboration et al. 2016, 2023). The derived distances range from 914 to 1 127 pc. Since this range is much larger than the size of the stellar association,Footnote c we treat all stars as lying at an error-weighted average distance of 960 pc, with an uncertainty of about 100 pc.
Wilson et al. (Reference Wilson, Dame, Masheder and Thaddeus2005) estimated a distance to the Crossbones (and by extension Lagotis and VdB-80) of 465 pc using Hipparcos parallaxes, significantly closer than the distance we derive using Gaia data – this disparity is considered further in section 3.3. We take the value of 960
 $\pm$
100 pc to be accurate as Gaia parallax is more reliable than the Hipparcos parallax used for the closer distance derivation (Al-Wardat et al. Reference Al-Wardat, Hussein, Al-Naimiy and Barstow2021).
$\pm$
100 pc to be accurate as Gaia parallax is more reliable than the Hipparcos parallax used for the closer distance derivation (Al-Wardat et al. Reference Al-Wardat, Hussein, Al-Naimiy and Barstow2021).
Table 2. Near-IR 2MASS
 $JHK_s$
magnitudes for the five star subset of the stellar cluster; and calculated near-IR colour excess (
$JHK_s$
magnitudes for the five star subset of the stellar cluster; and calculated near-IR colour excess (
 $J-H/H-K_s$
) and visual extinction
$J-H/H-K_s$
) and visual extinction
 $A_V$
, derived according to Froebrich & del Burgo (Reference Froebrich and del Burgo2006). The error in extinction arises from the variation between
$A_V$
, derived according to Froebrich & del Burgo (Reference Froebrich and del Burgo2006). The error in extinction arises from the variation between
 $J-H$
and
$J-H$
and
 $H-K_s$
colours.
$H-K_s$
colours.
Within the region of the radio-continuum emission, there are around 150 identified stars (Gaia Collaboration et al. 2016, 2023) with varying magnitudes and distances. The cluster of stars proposed to be associated with the VdB-80 RN includes 12 of these, of which we use a subset of five stars, including HD 46060 (Table 1); these appear to be central to the radio feature. These stars were chosen based on their central location in the radio–continuum feature, and within 40 arcsec of the proposed host star; HD 46060 (see Section 3.4.). The distance is taken to be the error-weighted average distance of the five stars, which puts VdB-80 at 960
 $\pm$
100 pc. From the radio angular size of
$\pm$
100 pc. From the radio angular size of
 $2.{\!^\prime}7\times2.{\!^\prime}4$
, we estimate the physical size to be 0.75
$2.{\!^\prime}7\times2.{\!^\prime}4$
, we estimate the physical size to be 0.75
 $\times$
0.67(
$\times$
0.67(
 $\pm$
0.09 pc).
$\pm$
0.09 pc).
2MASS extinction data show that the stellar cluster and VdB-80 are in the same plane and share a common distance. Table 2 shows near-IR 2MASS brightnesses for the same stars, along with colour excess (
 $J-H/H-K_s$
) and visual extinction
$J-H/H-K_s$
) and visual extinction
 $A_V$
, calculated using formulae from Froebrich & del Burgo (Reference Froebrich and del Burgo2006) and Froebrich et al. (Reference Froebrich, Murphy, Smith, Walsh and Del Burgo2007). The extinction values show a few magnitudes’ reddening of the stars, similar to those found towards the Crossbones (Froebrich et al. Reference Froebrich, Murphy, Smith, Walsh and Del Burgo2007), indicating that they are embedded in the cloud. There is a distinct correlation between 2MASS extinction and Gaia distance (Tables 1 and 2): This suggests that HD 46060 is towards the front of the cloud (or may have cleared enough material to have lower extinction), while the other stars are more deeply embedded in the cloud behind HD 46060. The embedding of the stars underlines their association with the Crossbones cloud, and implies that the Gaia distance can be used for the cloud.
$A_V$
, calculated using formulae from Froebrich & del Burgo (Reference Froebrich and del Burgo2006) and Froebrich et al. (Reference Froebrich, Murphy, Smith, Walsh and Del Burgo2007). The extinction values show a few magnitudes’ reddening of the stars, similar to those found towards the Crossbones (Froebrich et al. Reference Froebrich, Murphy, Smith, Walsh and Del Burgo2007), indicating that they are embedded in the cloud. There is a distinct correlation between 2MASS extinction and Gaia distance (Tables 1 and 2): This suggests that HD 46060 is towards the front of the cloud (or may have cleared enough material to have lower extinction), while the other stars are more deeply embedded in the cloud behind HD 46060. The embedding of the stars underlines their association with the Crossbones cloud, and implies that the Gaia distance can be used for the cloud.
3.3 Crossbones
The ‘Crossbones’ in Monoceros is an ‘X’-shaped molecular cloud structure prominent in both
 $^{12}$
CO and
$^{12}$
CO and
 $^{13}$
CO maps (Maddalena et al. Reference Maddalena, Morris, Moskowitz and Thaddeus1986; Kim et al. Reference Kim, Kawamura, Yonekura and Fukui2004). It was originally identified as part of the Orion-Monoceros cloud complex by Maddalena et al.: The Orion A and B clouds run approximately N–S, with northern and southern filaments running E–W. Crossbones appears to be part of the S filament, near where the Monoceros R2 (Mon R2) molecular cloud overlaps with the filament. At a distance of 800–900 pc Mon R2 lies far behind the Orion clouds (400–500 pc) and is not associated. Crossbones has been taken to be a spatially coherent structure because the velocities of its parts appear coherent. Maddalena et al., noting that the stars associated with VdB-80 had estimated distances
$^{13}$
CO maps (Maddalena et al. Reference Maddalena, Morris, Moskowitz and Thaddeus1986; Kim et al. Reference Kim, Kawamura, Yonekura and Fukui2004). It was originally identified as part of the Orion-Monoceros cloud complex by Maddalena et al.: The Orion A and B clouds run approximately N–S, with northern and southern filaments running E–W. Crossbones appears to be part of the S filament, near where the Monoceros R2 (Mon R2) molecular cloud overlaps with the filament. At a distance of 800–900 pc Mon R2 lies far behind the Orion clouds (400–500 pc) and is not associated. Crossbones has been taken to be a spatially coherent structure because the velocities of its parts appear coherent. Maddalena et al., noting that the stars associated with VdB-80 had estimated distances
 $\sim$
800 pc, suggested that the entire southern filament might be associated with Mon R2, rather than Orion. Wilson et al. (Reference Wilson, Dame, Masheder and Thaddeus2005) derived a distance of
$\sim$
800 pc, suggested that the entire southern filament might be associated with Mon R2, rather than Orion. Wilson et al. (Reference Wilson, Dame, Masheder and Thaddeus2005) derived a distance of
 $\sim$
460 pc to the southern filament from Hipparcos stellar parallaxes.
$\sim$
460 pc to the southern filament from Hipparcos stellar parallaxes.
The Lagotis Hii region is embedded at the edge of the NE–SW arm of the Crossbones, close to the point where the arms cross (Fig. 3). This can be seen in the far-IR images, in which a larger far-IR bright region envelops the Hii region, while the CO 1–0 emission has a cavity in the same place. The pressure of the Hii region and the UV flux of its star are excavating the cavity in the molecular cloud, and the dust around the cavity is being heated up to generate the far-IR emission (Fig. 3). The calculated Lyman flux of HD 46060 (see Section 3.4.)is consistent with the Hii region observed; this supports the argument that HD46060 and its neighbours not only illuminate VdB-80, but also power the Lagotis Hii region. Hence, the distance of these stars is the likely distance of this molecular gas structure.
The most likely interpretation of the data is that Crossbones is not a contiguous structure, but a superposition of a NE–SW filamentary cloud and the southern filament of the Orion-Monoceros cloud complex. The population of YSOs found by Lee & Chen (Reference Lee and Chen2009) towards Crossbones are largely found towards the NE–SW arm, which also appears brighter in CO and far-IR. We therefore suggest that the NE–SW arm of Crossbones is a dense star-forming cloud at the distance of (and possibly associated with) Mon R2; the SE–NW arm of Crossbones is simply part of the less dense southern Orion filament. The only evidence against this interpretation is the lack of velocity discontinuity between the two arms.
From the CO 1–0 data (Ghosh et al. Reference Ghosh, Remazeilles and Delabrouille2024), we estimate an excitation temperature towards Lagotis of 12 K, compared to the 17 K found towards Mon R2 (Pokhrel et al. Reference Pokhrel2016). Considering the beam dilution in the rather large Planck beam, these temperature values are reasonably consistent.
3.4 The stellar cluster and the Hii region
The Gaia proper motions of the main stars in the stellar cluster (Table 1) suggest that the cluster is moving into the Crossbones filaments near the centre (Fig. 3). Based on this movement, we give the Hii region the designation ‘Lagotis’, as the stars are moving, or ‘burrowing’ into the Hii region and the molecular cloud.Footnote d
In the larger scope of the stellar cluster, there is a large population of stars at a similar distance (
 $\sim$
1 kpc); the majority of stars in this cluster have similar proper motion profiles to the Lagotis stars (Table 1). Due to its central location and brightness, we propose that HD 46060 is the main driver of the Hii region. This star is the brightest in the central cluster and has generally been associated with the RN itself. The distance from HD 46060 to the edge of the bright emission is 0.49 pc, and we take this to be the radius of the Hii region. We also assume the electron temperature of the Hii region to be 10
$\sim$
1 kpc); the majority of stars in this cluster have similar proper motion profiles to the Lagotis stars (Table 1). Due to its central location and brightness, we propose that HD 46060 is the main driver of the Hii region. This star is the brightest in the central cluster and has generally been associated with the RN itself. The distance from HD 46060 to the edge of the bright emission is 0.49 pc, and we take this to be the radius of the Hii region. We also assume the electron temperature of the Hii region to be 10
 $^{4}$
K. Using the equations in Dyson & Williams (Reference Dyson and Williams1997) and Schmiedeke et al. (Reference Schmiedeke2016), we derive an electron density of 26 cm
$^{4}$
K. Using the equations in Dyson & Williams (Reference Dyson and Williams1997) and Schmiedeke et al. (Reference Schmiedeke2016), we derive an electron density of 26 cm
 $^{-3}$
, which can then be used to estimate an ionising flux of
$^{-3}$
, which can then be used to estimate an ionising flux of
 $10^{45.6}\,\textit{s}^{-1}$
.
$10^{45.6}\,\textit{s}^{-1}$
.
HD 46060 has been variously classified as a spectral type of B8 (van den Bergh Reference van den Bergh1966; Ochsenbein Reference Ochsenbein1980), B3ne (Racine Reference Racine1968), B2 ii (Houk & Swift Reference Houk and Swift2000; Kharchenko Reference Kharchenko2001; Anderson & Francis Reference Anderson and Francis2012) and B2 iii-iv (Aveni & Hunter Reference Aveni and Hunter1972). Based on the most recent results, we adopt a spectral type of B2 ii. HD 46060 is about 4.5
 $\pm$
1.5 Myr old, (Ahumada et al. Reference Ahumada, Clariá, Bica, Dutra and Torres2001), so its ionising flux is expected to be higher than the zero-age-main-sequence (ZAMS) value of
$\pm$
1.5 Myr old, (Ahumada et al. Reference Ahumada, Clariá, Bica, Dutra and Torres2001), so its ionising flux is expected to be higher than the zero-age-main-sequence (ZAMS) value of
 $10^{44.7}$
s
$10^{44.7}$
s
 $^{-1}$
. Panagia (Reference Panagia1973) gives a range of ionising fluxes for B2 i-iii that is consistent with our estimated ionising flux of
$^{-1}$
. Panagia (Reference Panagia1973) gives a range of ionising fluxes for B2 i-iii that is consistent with our estimated ionising flux of
 $10^{45.6}\,\textit{s}^{-1}$
.
$10^{45.6}\,\textit{s}^{-1}$
.
We therefore put forward a self-consistent interpretation in which HD 46060 is a B2 ii star with sufficient ionising flux to power the Lagotis Hii region with radius 0.49 pc and electron density 26 cm
 $^{-3}$
. This gives rise to thermal radio continuum emission, consistent with the estimated flux density.
$^{-3}$
. This gives rise to thermal radio continuum emission, consistent with the estimated flux density.
Because VdB-80 sits on the edge of the cloud, there may be a champagne flow (Comeron Reference Comeron1997; Immer et al. Reference Immer, Cyganowski, Reid and Menten2014) from the Lagotis Hii region that is not seen in the EMU image, with supersonic movement of ionised gas caused by a steep pressure and density gradient at the edge of the cloud (Bodenheimer, Tenorio-Tagle, & Yorke Reference Bodenheimer, Tenorio-Tagle and Yorke1979). This is consistent with the roughly hemispherical shape of the Hii region and may be the cause for the dim eastern side of the radio–continuum emission. More sensitive observations at additional frequencies may be able to test this possibility.
4. Conclusion
Sensitive EMU observations have revealed radio-continuum emission at 943.5 MHz toward a known RN, VdB-80 (van den Bergh Reference van den Bergh1966). This is a unique feature for an object mainly known for its optical properties. The emission – nicknamed Lagotis – is measured to be 30.2
 $\pm$
0.3 mJy and is comprised of bright (Western side) and dim (Eastern side) portions with flux densities of 25.6
$\pm$
0.3 mJy and is comprised of bright (Western side) and dim (Eastern side) portions with flux densities of 25.6
 $\pm$
2.6 and 4.6
$\pm$
2.6 and 4.6
 $\pm$
0.5 mJy.
$\pm$
0.5 mJy.
The radio-continuum detection is a circular feature with the brighter side pointed inward toward the Crossbones cloud filaments, accompanied by a bright shroud of far-infrared emission and an extended shell of mid-infrared emission (Figs. 2 and 4). This indicates heating of the cloud surrounding the RN, which is likely to be a byproduct of a Hii region heating up the gas and dust surrounding its shell. This shows that the features associated with the RN and Hii region extend much further than shown in visible wavelengths.
VdB-80 and Lagotis are situated at the edge of the Crossbones molecular cloud structure. We find the RN to be at a distance of 960
 $\pm$
100 pc based on Gaia parallax values for a subset of stars in the stellar cluster association. From this distance, we estimate the size of the radio emission to be 0.75
$\pm$
100 pc based on Gaia parallax values for a subset of stars in the stellar cluster association. From this distance, we estimate the size of the radio emission to be 0.75
 $\times$
0.67(
$\times$
0.67(
 $\pm$
0.09 pc), and we find that the Crossbones feature is most likely a superposition of two filamentary clouds associated with Orion (in the foreground) and Mon R2 (in the background).
$\pm$
0.09 pc), and we find that the Crossbones feature is most likely a superposition of two filamentary clouds associated with Orion (in the foreground) and Mon R2 (in the background).
The proper motion (Table 1) of the stellar cluster associated with the RN shows that the cluster is moving toward, and ‘into’ the cloud. The proposed driver of the Hii region is HD 46060, a B2 ii type star at the center of the stellar cluster, with enough ionising output to power the Hii region, with an estimated electron density of 26 cm
 $^{-3}$
. Irregularities in the radio feature as well as the far-infrared emitting shell may be generated from the other stars in the cluster with unknown spectral types.
$^{-3}$
. Irregularities in the radio feature as well as the far-infrared emitting shell may be generated from the other stars in the cluster with unknown spectral types.
Objects with low surface brightness, such as Lagotis, are becoming more prominent in high sensitivity surveys such as EMU. This discovery of the radio-continuum emission associated with an RN and its analysis has indicated that HD 46060 both powers Lagotis and illuminates VdB-80. ASKAP and other new-generation telescopes enable future observations and discoveries of RNe with radio-continuum emission.
Acknowledgement
This scientific work uses data obtained from Inyarrimanha Ilgari Bundara/the Murchison Radio-astronomy Observatory. We acknowledge the Wajarri Yamaji People as the Traditional Owners and native title holders of the Observatory site. CSIRO’s ASKAP radio telescope is part of the Australia Telescope National Facility (https://ror.org/05qajvd42). Operation of ASKAP is funded by the Australian Government with support from the National Collaborative Research Infrastructure Strategy. ASKAP uses the resources of the Pawsey Supercomputing Research Centre. Establishment of ASKAP, Inyarrimanha Ilgari Bundara, the CSIRO Murchison Radio-astronomy Observatory and the Pawsey Supercomputing Research Centre are initiatives of the Australian Government, with support from the Government of Western Australia and the Science and Industry Endowment Fund.
This work has made use of data from the European Space Agency (ESA) mission Gaia (https://www.cosmos.esa.int/gaia), processed by the Gaia Data Processing and Analysis Consortium (DPAC, https://www.cosmos.esa.int/web/gaia/dpac/consortium). Funding for the DPAC has been provided by national institutions, in particular the institutions participating in the Gaia Multilateral Agreement. This publication makes use of data products from the Two Micron All Sky Survey, which is a joint project of the University of Massachusetts and the Infrared Processing and Analysis Center/California Institute of Technology, funded by the National Aeronautics and Space Administration and the National Science Foundation. This research is based on observations with AKARI, a JAXA project with the participation of ESA.
Data availability statement
EMU data can be accessed through the CSIRO ASKAP Science Data Archive (CASDA) portal: https://research.csiro.au/casda. NVSS data can be obtained from the NVSS Postage Stamp Server: https://www.cv.nrao.edu/nvss/postage.shtml. All Gaia DR3 data are obtained from the Gaia Archive website: https://gea.esac.esa.int/archive/. Data from the 2MASS Point Source Catalogue are available from the NASA/IPAC Infrared Science Archive (IRSA): https://irsa.ipac.caltech.edu/Missions/2mass.html. WISE data is available from the NASA/IPAC Infrared Science Archive (IRSA): https://irsa.ipac.caltech.edu/Missions/wise.html. Data from the AKARI all-sky survey are available at the NASA/IPAC Infrared Science Archive (IRSA): https://irsa.ipac.caltech.edu/data/AKARI/.
Funding statement
MDF, GR, and SL acknowledge Australian Research Council (ARC) funding through grant DP200100784. DU acknowledges the financial support provided by the Ministry of Science, Technological Development, and Innovation of the Republic of Serbia through the contract 451-03-66/2024-03/200104 and for support through the joint project of the Serbian Academy of Sciences and Arts and Bulgarian Academy of Sciences ‘Optical search for Galactic and extragalactic supernova remnants’.
Competing interests
None.


 Open access