1 INTRODUCTION
Of interest is the performance of adaptive optics (AO) at Siding Spring Observatory (SSO). It could be that the installation of AO for the 2.3-m Australian National University (ANU) and the 3.9-m Anglo-Australian Telescope (AAT) may open the door for new science programs and discoveries. Certain AO correction modes may provide encouraging performance gains at SSO, despite the relatively moderate seeing conditions. It is therefore important to ascertain the performance predictions for AO. In addition, AO systems are becoming more achievable and affordable for most astronomical observatories (not the case when AO was first envisioned by Horace W. Babcock in 1953; Hardy Reference Hardy1998). Evidence of this fact is the success of AO demonstrated with the modern 8–10 m class telescopes. Good performance has been reported with the 10-m Keck II Telescope (van Dam et al. Reference van Dam2006), the 8-m Very Large Telescope (Rousset et al. Reference Rousset2003), the 8.2-m Subaru Telescope (Iye et al. Reference Iye2004), and 8-m Gemini North Telescope (Stoesz et al. Reference Stoesz, Veran, Rigaut, Herriot, Jolissaint, Frenette, Dunn and Smith2004), and others.
To predict the performance of AO at SSO requires the characterisation and modelling of the atmospheric optical turbulence profile (model-OTP) based on observational results. The observational results for turbulence profiling at SSO and model-OTP are reported in a paper by Goodwin, Jenkins, & Lambert (Reference Goodwin, Jenkins and Lambert2012) and in a PhD thesis by Goodwin (Reference Goodwin2009). AO simulations use the site-characteristic model of the optical turbulence profile, or model-OTP, to predict the performance of various AO technologies.
The purpose of AO for astronomical telescopes is to remove the wavefront aberrations from the optical path between the science object and the imaging detector. When this is successful, the quality of the image is limited by the diffraction limit of the astronomical telescope. Most of the wavefront aberrations are induced by the atmospheric turbulence as random phase perturbations within the beam path. An AO system attempts to measure these phase perturbations and correct (e.g. spatial phase modulator) them in real time, typically on timescales of milliseconds, to restore image quality.
AO improves the performance of most optical instruments, including spectrographs, interferometers, and imaging detectors. AO can also compensate for telescope tracking errors and wind buffeting, as well as slow timescale aberrations such as mirror/dome seeing and mirror gravity distortions. Low-frequency errors are the largest errors and are controlled by a separate system known as ‘active optics’.
A good introduction to the subject of AO can be found in the book ‘Adaptive Optics for Astronomical Telescopes’ by Hardy (Reference Hardy1998). An overview of AO and the various correction modes can be found in the PhD thesis by Goodwin (Reference Goodwin2009).
This paper discusses the yao numerical simulation code (authored by Rigaut Reference Rigaut2007) and corresponding performance predictions for the 2.3-m ANU and 3.9-m AAT at SSO. Sections 2–4 discuss the turbulence model, simulation tool, and simulation configurations, respectively. Section 5 reports the simulation results. Concluding remarks are provided in Section 6.
2 TURBULENCE MODEL
The simulation code uses the SSO model-OTP of Goodwin et al. (Reference Goodwin, Jenkins and Lambert2012). The model-OTP is a statistical thin-layer characterization, based on measurements of the turbulence profile above SSO conducted in years 2005 and 2006. The simulation code uses fractional layer strengths, which are listed in Table 1. The simulation code uses the corresponding layer wind speeds and directions as in Goodwin et al. (Reference Goodwin, Jenkins and Lambert2012). From Table 1, it is evident that the ground layer contains the bulk fraction of the turbulence integral. It is noted by Goodwin et al. (Reference Goodwin, Jenkins and Lambert2012) and Goodwin (Reference Goodwin2009) that the free atmosphere (>500 m) is comparable to the ‘good’ seeing astronomical sites, such as Cerro Pachon, Chile.
Table 1. Tabulated Values for the Final Model-OTP for the SSO (Run 1–8: 2005 May to 2006 June), with Layers Specified as Fractional Amount of Total Turbulence Integral, J, with Corresponding Wind Speed, m s−1 (Goodwin Reference Goodwin2009; Goodwin et al. Reference Goodwin, Jenkins and Lambert2012)

3 SIMULATION CODE
The simulation code used to perform the adaptive simulations is an open-source numerical simulation code called yao, written by Rigaut (Reference Rigaut2007). The yao simulation code is a Monte Carlo AO simulation tool coded in YORICK (Munro Reference Munro2005). YORICK is an open-source interpreted programming language for scientific simulation codes. The yao simulation code has custom-developed functions to simulate the wavefront sensor (WFS), the deformable mirror (DM), and other aspects of an AO loop (Rigaut Reference Rigaut2007). This code is provided with a set of example scripts which can be easily modified to simulate single-conjugate adaptive optics (SCAO), multi-conjugate adaptive optics (MCAO), and ground-layer adaptive optics (GLAO) for a specific model atmosphere, telescope, and AO system configuration. The yao simulation code was selected based on its extensive functionality, ease of use (documentation and examples), as well as being open-source software. The code has been verified with an independent code for the case of SCAO (Goodwin Reference Goodwin2009).
4 SIMULATION CONFIGURATIONS
The simulation results are based on the AO correction modes of SCAO, MCAO, and GLAO for the ANU 2.3 m and AAT 3.9 m using the yao AO numerical simulation code. Each AO correction mode and telescope specification is associated with a set of simulation input configuration parameters and system geometry.
The schematic for the system geometry of the SCAO, MCAO, and GLAO AO models, as used for the ANU 2.3-m and AAT 3.9-m telescopes, is shown in Figure 1. The large number of field stars (FS) in Figures 1(b) and (c) are artificial and inserted onto a regular grid to calculate the Strehl, full width half maximum (FWHM), and encircled energy 50% diameter (EE50d) performance parameters as a function of field location.

Figure 1. Geometry of configurations for (a) SCAO, (b) MCAO, and (c) GLAO configurations as used in AO simulations for the ANU 2.3-m and AAT 3.9-m telescopes. The NGS are marked with filled triangles; LGS are marked with filled circles and field stars (FS) as plus signs.
The sky coverage for the SCAO AO model, given an NGS (tip–tilt) magnitude within a search radius of 30 arcsec from LGS (science target), as used for the ANU 2.3-m and AAT 3.9-m telescopes, is given in Table 2, and calculated by Chun et al. (Reference Chun, D’Orgeville, Ellerbroek, Graves, Northcott and Rigaut2000). The input configuration parameters for the SCAO AO model, as used for the ANU 2.3-m and AAT 3.9-m telescopes, are given in Table 3.
Table 2. Estimated Sky Coverage for SCAO Based on NGS (tip–tilt) Search Radius of 30 arcsec from LGS (Science Target)

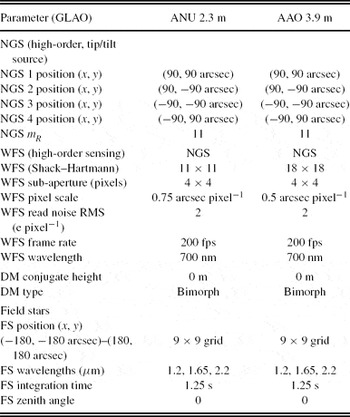
Table 3. Parameters of the Models Used in SCAO Simulation Codes

The input configuration parameters for the MCAO model, as used for the ANU 2.3-m and AAT 3.9-m telescopes, are tabulated in Table 4.
The input configuration parameters for the GLAO model, as used for the ANU 2.3-m and AAT 3.9-m telescopes, are tabulated in Table 5.
The input parameters, for example mirror type and transmission, were in part adapted from the test examples that were distributed with yao given the complexity involved in the simulations. The hardware simulation choices are based on readily available technology at the time of simulation (around the year 2008/2009). The parameters were sensible and kept consistent amongst the correction modes, for example for SCAO, an NGS of 15 mag for tip–tilt sensing seems appropriate as performance starts to fall off with fainter tip–tilt stars.
5 SIMULATION RESULTS
This section reports the results of AO techniques SCAO, MCAO, and GLAO as applied to the ANU 2.3-m and AAT 3.9-m telescopes for wavelength bands J, H, and K using the SSO model-OTP as tabulated in Table 1 (see Section 2).
5.1 SCAO Results
The input SCAO configuration parameters, as used in the yao simulation code for the ANU 2.3-m telescope, are tabulated in Table 3, with a schematic of the geometry shown in Figure 1. Likewise, for the AAT 3.9-m telescope, the parameters are tabulated in Table 3 and the geometry shown in Figure 1.
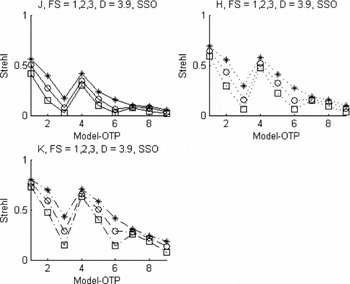
To model the sky coverage performance, the Strehl results are shown in Figure 2 (ANU 2.3 m) and Figure 3 (AAT 3.9 m) for three tip–tilt NGS of increasing limiting magnitude, mR . The percentage of the sky coverage for these tip–tilt NGS is tabulated in Table 2. From Figures 2 and 3 it can be seen that both telescopes have similar trends in Strehl performance for model atmospheres 1–9. However, the AAT 3.9-m telescope shows a marginally poorer performance in Strehl. A noticeable drop in Strehl occurs for a tilt guide star magnitude mR = 19 (73% sky coverage at 30° galactic latitude) for all model atmospheres. This is an unacceptable performance, particularly for the shortest wavelength J band. It is also noted that the H and K bands have poor Strehls for model atmospheres 7–9 that represent a bad ground layer resulting in the worst overall seeing conditions. Noticeable improvements in the Strehl occur for the H and K bands for model atmospheres 1 and 4, both having good free-atmosphere conditions with a good/typical ground layer.

Figure 2. yao numerical SCAO simulation Strehl results for a tilt guide star having mR = 15 (asterisks), 17 (open circles), and 19 (open squares) for the ANU 2.3-m telescope with the SSO model-OTP (1–9). This simulation models sky coverage performance for wavelength bands J, H, and K.

Figure 3. yao numerical SCAO simulation Strehl results for a tilt guide star having mR = 15 (asterisks), 17 (open circles), and 19 (open squares) for the AAT 3.9-m telescope with the SSO model-OTP (1–9). This simulation models sky coverage performance.
To model the anisoplanatism (correction field of view, FOV) performance, the Strehl results are shown in Figure 4 (ANU 2.3 m ) and Figure 5 (AAT 3.9 m) for three field stars of increasing angular distance from LGS (science target). From Figures 4 and 5 we note similar trends in the performance of both telescopes. The Strehl decreases gradually, but almost identical, for the increasing angular distance of the field stars. The Strehl increases for the longer wavelengths, with highest values for the K band. Noticeable improvements in the Strehl occur for model atmospheres 1 and 4 (good free-atmosphere conditions). The results indicate that relatively large correction fields of view are possible, ~30 arcsec.

Figure 4. yao numerical SCAO simulation Strehl results for field stars having mR = 15 and angular distance from LGS (x, y) in arcsec of (0, 0) (asterisks), (0, 10) (open circles), and (20, 20) (open squares) for the ANU 2.3-m telescope with the SSO model-OTP (1–9). This simulation models anisoplanatism (correction FOV) performance for wavelength bands J, H, and K.

Figure 5. yao numerical SCAO simulation Strehl results for field stars having mR = 15 and angular distance from LGS (x, y) in arcsec of (0, 0) (asterisks), (0, 10) (open circles), and (20, 20) (open squares) for the AAT 3.9-m telescope with the SSO model-OTP (1–9). This simulation models anisoplanatism (correction FOV) performance.
5.2 MCAO Results
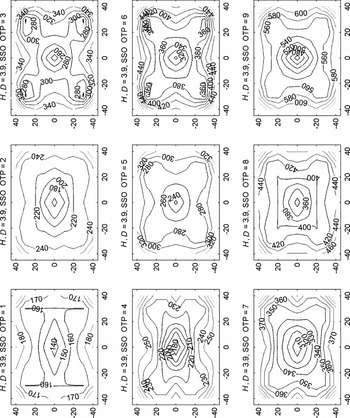
The EE50d parameter (units of milliarcsec, mas) is used as the figure of merit to assess the performance of the MCAO simulations. A representative contour plot of the EE50d over the designed angular FOV for the AAT 3.9-m telescope with the SSO model-OTP (1–9) for the H band is shown in Figure 10. The input MCAO configuration parameters, as used in the yao simulation code for the ANU 2.3-m and AAT 3.9-m telescopes, are tabulated in Table 4, with a schematic of the geometry shown in Figure 11. The nominal correction FOV for MCAO simulations is 80 arcsec. A summary of MCAO simulation results for the EE50d parameter’s field mean and field RMS for the ANU 2.3-m and AAT 3.9-m telescopes is shown in Figures 6 and 7.
Table 4. Parameters of the Models Used in the MCAO Simulation Code


Figure 6. MCAO simulation results summary (using yao) for the EE50d parameter (units of mas) for field mean and field RMS at the J-band (asterisks), H-band (open circles), and K-band (open squares) wavelengths for the ANU 2.3-m telescope with the SSO model-OTP (1–9).

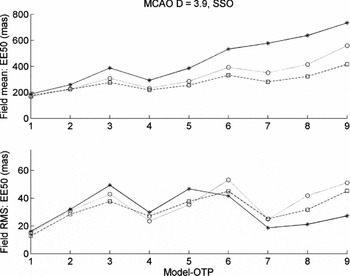
Figure 7. MCAO simulation results summary (using yao) for the EE50d parameter (units of mas) for field mean and field RMS at the J-band (asterisks), H-band (open circles), and K-band (open squares) wavelengths for the AAT 3.9-m telescope with the SSO model-OTP (1–9).
From Figures 6 and 7 we note similar trends in the MCAO performance of both telescopes. The results for MCAO simulations for SSO having an FOV of 80 arcsec show sensitivity to the ground-layer turbulence with the poorest EE50d results for ‘bad’ ground-layer conditions (poorest seeing), particularly for the shortest wavelength or the J band. Reasonable MCAO results for SSO are achievable for longer wavelengths of the H and K bands, with the field mean of EE50d between 200 and 400 mas and corresponding field RMS between 20 and 50 mas. Conditions of strong free-atmosphere turbulence (model atmospheres 3, 6, and 9) increase both the mean and RMS of EE50d, but the MCAO sensitivity to the free atmosphere is somewhat less than that for the SCAO performances. The EE50d contour plot shown in Figure 10 for bad free-atmosphere conditions shows the best corrections around the placement of the five LGS (hence large field RMS of EE50d).
5.3 GLAO Results
The input GLAO configuration parameters, as used in the yao simulation code, for the ANU 2.3-m and the AAT 3.9-m telescopes, are tabulated in Table 5, with a schematic of the geometry shown in Figure 1. The EE50d parameter (units of mas) is used as the figure merit to assess the performance of the GLAO simulations. A representative contour plot of the EE50d over the designed angular FOV for the AAT 3.9-m telescope with the SSO model-OTP (1–9) has been simulated for the H-band wavelength (Figure 11). The nominal correction FOV is 180 arcsec. A summary of the GLAO simulation results for the EE50d parameter’s field mean and field RMS for ANU 2.3-m and AAT 3.9 m is shown in Figures 8 and 9.

Figure 8. GLAO simulation results summary (using yao) for the EE50d parameter (units of mas) for field mean and field RMS at J-band (asterisks), H-band (open circles), and K-band (open squares) wavelengths for the ANU 2.3-m telescope with the SSO model-OTP (1–9).

Figure 9. GLAO simulation results summary (using yao) for the EE50d parameter (units of mas) for field mean and field RMS at J-band (asterisks), H-band (open circles), and K-band (open squares) wavelengths for the AAT 3.9-m telescope with the SSO model-OTP (1–9).

Figure 10. MCAO simulation results (using yao) for the EE50d parameter (units of mas) at H-band wavelengths for the AAO 3.9-m telescope with the SSO model-OTP (1–9). The x and y axes of the contour plots denote angular FOV (units of arcsec).

Figure 11. GLAO simulation results (using yao) for the EE50d parameter (units of mas) at H-band wavelengths for the AAO 3.9-m telescope with the SSO model-OTP (1–9). The x and y axes of the contour plots denote angular FOV (units of arcsec).
Table 5. Parameters of the Models Used in the GLAO Simulation Code

From Figures 8 and 9 we note similar trends in the GLAO performance of both telescopes, except that the AAT 3.9-m telescope has a lower, more uniform field RMS for EE50d. The results of GLAO also show a performance trend that is similar to MCAO. Performance becomes poorer at shorter wavelengths and bad free-atmosphere conditions, with the field mean of EE50d between 200 and 800 mas and the corresponding field RMS between 20 and 100 mas for all model atmospheres.
The relatively good results from the GLAO simulations may need caution due to the coarse sampling of the ground layer (37.5, 250, and 1 000 m) may be insufficient to accurately model the behaviour of a 3-arcmin FOV system. The coarse sampling can lead to obtaining a GLAO result that is too optimistic. A test to split the first few layers into many would help to verify that sampling is sufficient. This could not be fully explored due to simulation time constraints (more layers increase simulation times) and that the model is kept constant for a consistent comparison of adaptive optic correction modes.
6 CONCLUSIONS
This paper has reported on our AO simulations for the ANU 2.3-m and AAT 3.9-m telescopes based on the yao simulation code. A summary of the results has been presented for SCAO, MCAO, and GLAO based on a model-OTP derived from measurements at SSO spanning years 2005 to 2006. The results indicate that AO performance is best for the longer wavelengths (K band) and in the best seeing conditions (sub 1 arcsec).
The results for SCAO simulations for SSO show sensitivity in the performance of the turbulence strength in the free atmosphere. For a ‘good’ free atmosphere, the Strehl is excellent, while for a ‘bad’ free atmosphere the Strehl is dismal. A decreasing trend in performance is also observed for an increasing ground-layer strength (poorer seeing). Results suggest that anisoplanatism (distance of tip–tilt NGS from science target) has a minimal impact on FOV. Performance improves for longer wavelengths with the best performance in the K band. Note that the SCAO results for SSO use a powerful 10-W sodium LGS (comparable to Altair LGS for Gemini-N). The reason is that the sub-aperture sizes are smaller at SSO due to the relatively poor seeing and hence more photons are needed for wavefront sensing. We believe it to be technically feasible for SSO to implement SCAO, but it would be an expensive project due to the 10-W sodium LGS. The operation of SCAO for SSO (for Strehls between 0.3 and 0.8) would be limited to larger wavelengths (e.g. K band) with a sky coverage of ~35% (galactic latitude of 30°) for ~50% of nights having suitable conditions.
The results for MCAO simulations for SSO having an FOV of 80 arcsec show sensitivity to the ground-layer turbulence with the poorest EE50d results for ‘bad’ ground-layer conditions (poorest seeing), particularly for the shortest wavelength or the J band. Conditions of strong free-atmosphere turbulence increase the field RMS of EE50d and hence would be unsuitable for some astronomical science cases. The cost and complexity of MCAO is significantly higher than that of SCAO due to the requirement of multiple LGS and NGS with associated WFS and DM. Therefore, we do not recommend MCAO as a viable option for SSO.
The results for GLAO simulations for SSO having an FOV of 180 arcsec show a trend and performance similar to that of the MCAO results. However, the GLAO field RMS for EE50d is more uniform and minimally affected by the free-atmosphere turbulence for the AAT 3.9 m. The performance is reasonably good over the wavelength bands of J, H, and K. The field mean of EE50d is between 200 and 800 mas, which is a noticeable improvement compared with the nominal astronomical seeing (870–1 700 mas). GLAO has the advantage of performing active optics (static and gravity/temperature variations) and also correcting for dome seeing. GLAO is also well suited to use Rayleigh LGS that are cheaper with ‘industry strength’ lasers commercially available. The implementation of GLAO for SSO is therefore technically feasible, given the technical requirements of multiple NGSs (or Rayleigh LGS) over a large field radius. Therefore, we recommend GLAO as a promising option for SSO.
ACKNOWLEDGMENTS
This work makes use of observational data and analysis provided by the PhD thesis research by MG conducted at the Research School of Astronomy and Astrophysics (RSAA) of the Australian National University (ANU). The authors are grateful to Jon Lawrence of the Australian Astronomical Observatory (AAO) for his suggestions on the original version of the manuscript and to the referees for their comments.


