Introduction
While everyone will agree that risk assessment in mental health should be evidence based (Department of Health, 2007), there are problems with what constitutes the ‘evidence’ and the way it is reported. Our interest is primarily risk assessment in general adult mental health settings, but in order to elucidate the key issues we shall consider data from forensic settings as well. We aim to clarify for a non-specialist audience what the evidence means.
Assessing the quality of a risk assessment instrument
An influential paper by Mossman (Reference Mossman1994) argued for the use of receiver operating characteristic (ROC) curves and the ‘area under the curve’ (AUC) statistic in the evaluation of risk assessment instruments. ROC curves and the AUC allow comparison of instruments and provide a single statistic concerning how well the instrument classifies patients into violent versus non-violent groups.
Most studies now rely on ROC curves and the statistical significance of the AUC as the evidence that a risk assessment instrument is a valid predictor of future violence. For instance, Douglas et al. (Reference Douglas, Guy and Weir2008) in their overview of the Historical, Clinical, Risk Management-20 (HCR-20) risk assessment scheme cite the AUC as the key ‘validity index’ for the majority of studies reviewed. Recent studies of instruments (e.g. Harris et al. Reference Harris, Rice and Camilleri2004; Gray et al. Reference Gray, Taylor and Snowden2008; Snowden et al. Reference Snowden, Gray, Taylor and Fitzgerald2009) rely on the statistical significance of AUCs.
To clarify the statistics underlying risk assessment, we examine the relationship between ROC curves and the accuracy of violence prediction for an individual who scores positively on a particular test. Research on ROC statistics and other approaches for assessing predictive accuracy are developing apace, but for our purposes a relatively simple approach will suffice. Developments are unlikely to affect accuracy of prediction in the individual case. For illustration, we shall use the results from a well-executed study by Snowden et al. (Reference Snowden, Gray, Taylor and MacCulloch2007) . They tested the predictive power of two risk assessment instruments in a large sample of mentally disordered offenders, following them for at least 2 years following discharge from hospital. We shall consider the Violence Risk Appraisal Guide (VRAG; Harris et al. Reference Harris, Rice and Quinsey1993), an instrument with a substantial research base in forensic populations.
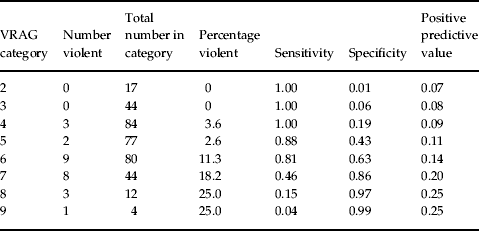
The first four columns in Table 1 show the numbers and percentages of patients reconvicted of a violent offence, for each score (‘category’) of the VRAG. Overall there were 26 cases of convictions for violence over 2 years out of 364 discharged patients (a base rate of 7.1%).
Table 1. Relationships between each VRAG category if taken as a ‘cut-off’ and some key variablesFootnote a

VRAG, Violence Risk Appraisal Guide.
a Based on data from Snowden et al. (Reference Snowden, Gray, Taylor and MacCulloch2007) .
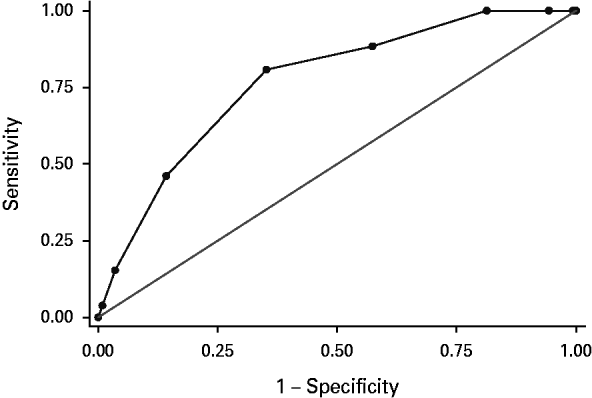
The AUC for the ROC curve is the proportion of ROC space lying under the curved line [see Fig. 1, which is the ROC curve we have derived for the Snowden et al. (Reference Snowden, Gray, Taylor and MacCulloch2007) data]. An AUC of 0.5 would be expected due to chance; 1.0 would represent perfect classification. In the Snowden et al. (Reference Snowden, Gray, Taylor and MacCulloch2007) study, the AUC was 0.77, statistically highly significant (p<0.001). The AUC in fact represents the probability that a randomly selected violent patient scores higher on the VRAG than a randomly selected non-violent patient, in this case, in nearly eight out of 10 instances. The original paper did not provide confidence limits for the AUC, but the 95% confidence interval (CI) using Stata 11 software (StataCorp LP, USA) indicates that it lies between 0.68 and 0.85.

Fig. 1. Receiver operating characteristic (ROC) curve based on data from Snowden et al. (Reference Snowden, Gray, Taylor and MacCulloch2007) . Area under ROC curve=0.7688.
The ROC and its relationship to an individual case
The ROC curve represents a series of ‘sensitivity’ versus ‘specificity’ values. So, for example, we can read off from the ROC curve that when the ‘sensitivity’ was 0.46, the ‘specificity’ was 0.86 (note that the ROC curve is plotted against (1 – specificity).
‘Sensitivity’, a/(a+c), is a characteristic of the group of patients who turned out to be violent. ‘Specificity’, d/(b+d), is a characteristic of the group of patients who turned out to be non-violent (see Table 2). If, for example, we were to take a score of 7 or above as the VRAG cut-off point, the sensitivity would be 0.46 (see Fig. 1 and Table 1). This indicates that approximately five out of 10 persons who turn out to be violent will have scored 7 or above. ‘Specificity’, in this case 0.86 at a cut-off of 7 or above, refers to the probability that a non-violent person will score as negative on the test. But it is important to note that this means that approximately one out of 10 will score as positive. ‘False positives’ – the bugbear of predictive tests for uncommon events – emerge through the ‘specificity’ of the test. Because there were so many more non-violent patients than violent ones in the population of interest – 13 times as many – the number of ‘false positives’ at a cut-off of 7 or above was four times the number of ‘true positives’. This corresponds to a positive predictive value (PPV) of 0.2; that is, the test at this cut-off would have been wrong eight times out of 10.
Table 2. Grid for calculation of sensitivity, specificity and positive predictive value

The PPV is crucial in assessing the meaning of a positive test result for a particular patient in a particular setting. It is the proportion of cases predicted by the test to be violent who turn out to be violent – a/(a+b) in the 2×2 table (Table 2). Table 1 shows the PPV for this sample at each VRAG category if it were to be taken as the cut-off. As illustrated above, using a score of 7 or above as the cut-off, the PPV was 0.2.
Table 1 shows key characteristics of the data that are obscured by presentations of results in terms only of AUCs. In addition to the PPV at each possible cut-off, the table also shows the ‘trade off’ between ‘sensitivity’ and ‘specificity’ – or between ‘true positives’ and ‘false positives’. The ‘cost’ of the VRAG getting one out of four predictions correct (PPV 0.25 for cut-off at VRAG category 8), is missing 22/26 of the violent cases.
Perhaps we would fare better if we used VRAG categories rather than cut-offs? Missing from the original paper are estimates of the uncertainties in the estimated proportions of patients in VRAG categories who were violent. For example, the 95% CI for the estimated proportion of patients scoring from 7 to 9, inclusive, was 0.11 to 0.33. If one were to argue that risk should be assessed according to groups, it is clear that the precision based on what appears to be a reasonably large study like this one is poor. Furthermore, the well-documented effect of ‘shrinkage’ is likely to make the situation worse when predicted probabilities are applied in new situations (for example, different samples). The accuracy of allocation of subjects to VRAG categories is yet another source of error. Clearly a very much larger number of subjects from the population of these patients would be required for achieving reasonable accuracy.
The value of a test such as the VRAG is further crucially influenced by the ‘base rate’ of violence in the population of interest. The ROC is, in theory at least, independent of the base rate of violence. In Snowden et al. (Reference Snowden, Gray, Taylor and MacCulloch2007), the base rate was 7.1%. If the base rate were, say 15%, it can readily be shown that the PPV, using category 7 as a cut-off, would be 0.37. At a base rate of 5% it would be 0.15; and at 1%, it would be 0.03 – that is, wrong in 97 cases out of 100.
Thus the statistical significance of the AUC of the ROC alone offers little help when it comes to a particular patient, yet this is the statistic that is now most relied upon in the risk assessment literature.
ROCs and AUCs in other studies
How good are the AUCs generated by risk assessment instruments? The VRAG has an average AUC of 0.72 over more than 30 independent replications (Harris & Rice, Reference Harris and Rice2007). A review by Douglas et al. (Reference Douglas, Guy and Weir2008) of the HCR-20, another commonly used instrument, if scored, indicates a range of AUCs from 0.48 to 0.84, and, like the VRAG, AUC is commonly around 0.7. The most comprehensive attempt to produce a risk assessment instrument, tested on almost 1000 general psychiatric patients, that by the MacArthur Foundation, produced on its first iteration an AUC of 0.80. However, on replication with an independent sample, the AUC shrunk to 0.63 (with some later readjustments in the categorisation of violence, revised to 0.70; Monahan et al. Reference Monahan, Steadman, Robbins, Appelbaum, Banks, Grisso, Heilbrun, Mulvey, Roth and Silver2005). Thus the study of Snowden et al. (Reference Snowden, Gray, Taylor and MacCulloch2007) with its ROC of 0.77 is at the high end, but the limitations of the test in practice, as we have shown, are major.
Implications for practice and policy
In general psychiatric practice, base rates for serious violence are a magnitude smaller than in forensic care, perhaps 1% per annum for patients with a psychosis. False-positive rates are extremely high even with the best instruments. When the potential costs to false positives are great (for example, coercive interventions), the situation becomes serious. The problem – also dealt with in relation to offenders, in complex statistical terms by Cook & Michie (Reference Cooke and Michie2010) – is the inherent limitation of population-derived, probabilistic data to predict individual behaviour. Our analysis above provides a concrete example of how this arises.
There is much more to the notion of risk than the probability of damage. The perception of risk (which includes factors such as the level of perceived control over the hazard, or the dread it engenders), its social amplification, as well as the degree of ‘moral outrage’ should the hazard occur (due to the belief that someone has failed in their duty to prevent it) are clearly important. A demand, impossible to meet, is being placed on clinicians to predict who will be dangerous. There are duties, highly challenging in this case, on researchers and practitioners to engage with the public to improve their understanding of what is possible and impossible, and why.
Declaration of Interest
None.


