


Introduction
Major depressive disorder (MDD), a common psychiatric disorder with a lifetime prevalence of approximately 16%, severely diminishes individuals' quality of life and limits their functioning in family, work, and social lives (Kessler et al., Reference Kessler, Angermeyer, Anthony, Demyttenaere, Gasquet and Ustün2007; Kupfer, Frank, & Phillips, Reference Kupfer, Frank and Phillips2012). As the neurobiological etiology of MDD, alterations in monoaminergic neurotransmission, dysfunction of neural circuits involved in emotion and reward processing, disturbances in the hypothalamic–pituitary–adrenal (HPA) axis, and changes in neural–immune interactions have also been suggested (Han & Ham, Reference Han and Ham2021; Kupfer et al., Reference Kupfer, Frank and Phillips2012; Malhi & Mann, Reference Malhi and Mann2018). The genetic heritability of MDD is estimated to be approximately 37% (Flint & Kendler, Reference Flint and Kendler2014), and genetic makeup can determine the risk of MDD through its genetic influences on the aforementioned neurobiological mechanisms in an interactive manner with psychosocial environmental factors such as childhood maltreatment or stressful life events (Klengel & Binder, Reference Klengel and Binder2013).
Regarding the etiology of MDD, gene-environmental interactions suggest that the impacts of psychosocial environmental exposure may be highly dependent on one's genetic vulnerability, which, in turn, can regulate the neurobiological mechanisms of response or coping with stressful stimuli such as early life adversities (Klengel & Binder, Reference Klengel and Binder2013). Epigenetic mechanisms such as DNA methylation are deeply involved in the fine modulation of the complex interplay between genes and environments through their pivotal role as mediators of the effects of adverse environmental factors on the genome in MDD (Lopizzo et al., Reference Lopizzo, Bocchio Chiavetto, Cattane, Plazzotta, Tarazi, Pariante and Cattaneo2015). DNA methylation, particularly methylation changes within promoter and enhancer regions of the gene, has been reported to have long-term effects on the transcription of genes involved in the HPA axis (e.g. FKBP5, NR3C1) (Efstathopoulos et al., Reference Efstathopoulos, Andersson, Melas, Yang, Villaescusa, Rȕegg and Lavebratt2018; Humphreys et al., Reference Humphreys, Moore, Davis, MacIsaac, Lin, Kobor and Gotlib2019; Klinger-König et al., Reference Klinger-König, Hertel, Van der Auwera, Frenzel, Pfeiffer, Waldenberger and Grabe2019), neuroplasticity (e.g. BDNF) (Ferrer et al., Reference Ferrer, Labad, Salvat-Pujol, Barrachina, Costas, Urretavizcaya and Soria2019; Januar, Ancelin, Ritchie, Saffery, & Ryan, Reference Januar, Ancelin, Ritchie, Saffery and Ryan2015), and monoaminergic neurotransmission (e.g. SLC6A4) (Kang et al., Reference Kang, Kim, Stewart, Kim, Bae, Kim and Yoon2013; Schneider et al., Reference Schneider, Kugel, Redlich, Grotegerd, Bürger, Bürkner and Hohoff2018) in an interactive manner with exposure to stressful life events in depression. More recently, alterations in DNA methylation profiles in response to psychosocial environmental factors have been found in patients with MDD not only at the specific candidate gene level, but also at an epigenome-wide level (Li, Morrison, Turecki, and Drevets, Reference Li, Morrison, Turecki and Drevets2022). A recent epigenome-wide association studies (EWAS) by Aberg et al. (Reference Aberg, Dean, Shabalin, Chan, Han, Zhao and van den Oord2020) found that DNA methylation loci within the serotonin receptor ionotropic 3, subunit c (HTR3C) gene were associated with the diagnosis of MDD and a significant overlap of EWAS findings between blood and postmortem brain tissue.
Structural and functional alterations in neural circuits influenced by genetic predispositions may mediate the association between genetic variations and development of MDD (Cattarinussi, Delvecchio, Sambataro, & Brambilla, Reference Cattarinussi, Delvecchio, Sambataro and Brambilla2022; Kim, Ham, & Han, Reference Kim, Ham and Han2019; Zhang, Mellor, & Peng, Reference Zhang, Mellor and Peng2018). For epigenetic markers, a growing body of evidence has shown that variations in DNA methylation are associated with structural changes in the brains of patients with MDD (Wheater et al., Reference Wheater, Stoye, Cox, Wardlaw, Drake, Bastin and Boardman2020). For example, Tozzi et al., reported that DNA methylation of the FKBP5 gene intron, its genetic variation plays a pivotal role in HPA axis regulation through modulation of glucocorticoid receptor sensitivity, is associated with gray-matter concentration in the inferior frontal gyrus, which corresponds to the ventrolateral prefrontal cortex, in patients with MDD (Tozzi et al., Reference Tozzi, Farrell, Booij, Doolin, Nemoda, Szyf and Frodl2018). Our previous study also reported that DNA methylation of the serotonin transporter gene (i.e. SLC6A4) was inversely correlated with the structural connectivity of the body of the corpus callosum in patients with MDD (Won et al., Reference Won, Choi, Kang, Kim, Han, Chang and Ham2016). However, most previous epigenetic neuroimaging studies on MDD have explored the potential relationship between neuroimaging markers and DNA methylation of specific candidate genes based on a priori hypothesis regarding the pathophysiology of MDD, rather than on EWAS-based systematic selection of candidate genes (Chiarella et al., Reference Chiarella, Schumann, Pomares, Frodl, Tozzi, Nemoda and Booij2020; Kaufman et al., Reference Kaufman, Wymbs, Montalvo-Ortiz, Orr, Albaugh, Althoff and Hudziak2018; Yrondi et al., Reference Yrondi, Fiori, Nogovitsyn, Hassel, Théroux, Aouabed and Turecki2021).
Therefore, in this study, we aimed to perform comprehensive epigenetic profiling using EWAS to identify novel epigenetic loci associated with the pathophysiology of MDD using a sample of patients with MDD and healthy controls (HCs). We also explored the differences in profiles regarding copy number alterations (CNAs) and gene networks between the two groups. After exploring significant epigenetic loci at the EWAS level as a neuroimaging-epigenetic study, we also investigated the potential correlation between epigenetic loci and cortical gray matter thickness to examine the potential contribution of epigenetic modifications to brain structural changes in MDD.
To delineate the brain structural signatures influenced by individual epigenomic profiles, we chose the atlas-based cortical thickness of the whole brain as the neuroimaging parameter in the present study. Among the widely studied cortical endophenotypes (i.e. cortical thickness, surface area, and local gyrification index), cortical thickness has a unique genetic origin (Panizzon et al., Reference Panizzon, Fennema-Notestine, Eyler, Jernigan, Prom-Wormley, Neale and Kremen2009) and is strongly correlated with age-related trajectories (Hogstrom, Westlye, Walhovd, & Fjell, Reference Hogstrom, Westlye, Walhovd and Fjell2013), which are associated with the pathophysiology of MDD (Miles et al., Reference Miles, Dos Santos, Byrne, Renteria, McIntosh, Adams and Nikolova2021). Furthermore, cortical thickness is one of the most intensively studied neuroimaging parameters in relation to genetic factors, such as polygenic risk score (Cattarinussi et al., Reference Cattarinussi, Delvecchio, Sambataro and Brambilla2022; Miles et al., Reference Miles, Dos Santos, Byrne, Renteria, McIntosh, Adams and Nikolova2021) and DNA methylation (Freytag et al., Reference Freytag, Carrillo-Roa, Milnik, Sämann, Vukojevic, Coynel and Papassotiropoulos2017; Gonzales et al., Reference Gonzales, Jeon, Han, Yang, Kim, Remonde and Shin2023) in MDD.
Materials and methods
Study participants
In this study, 350 patients with MDD (118 males and 232 females; 41.48 ± 14.80 years) and 161 HCs (58 males and 103 females; 39.08 ± 13.87 years) were included. Patients with MDD were recruited between July 2015 and August 2021 from the outpatient psychiatric clinic of the Korea University Anam Hospital in Seoul, Republic of Korea. The present study used a combination of two study samples: one study collected clinical and genomic data to identify antidepressant treatment response-related biomarkers, and the second study collected brain MRI data in addition to the aforementioned data (Han et al., Reference Han, Han, Kim, Kang, Kang, Kang and Ham2020a). Thus, among the total of 350 patients with MDD and 161 HCs, 234 patients with MDD and 135 HC underwent additional brain MRI scans. A standardized clinical interview using a Structured Clinical Interview for the fifth edition of the Diagnostic and Statistical Manual of Mental Disorders was conducted to diagnose MDD (First, Williams, Karg, & Spitzer, Reference First, Williams, Karg and Spitzer2016). Two board-certified Korean psychiatrists conducted the interviews (K.M. Han & B.J. Ham). This study included patients whose diagnoses were confirmed by both psychiatrists. The HCs were recruited via advertisements from the community. A total of 161 HCs were assessed by two board-certified psychiatrists who found no evidence of current or previous psychiatric illness. The following criteria, described in a previous paper, were applied to both groups for sample exclusion (Han et al., Reference Han, Tae, Kim, Kang, Kang, Kang and Ham2020b): (i) comorbidity of any other major psychiatric disorders (including personality and substance use disorders), (ii) MDD with psychotic features, (iii) acute patients with homicidal or suicidal thoughts who needed inpatient care, (iv) current or previous major medical illness, (v) current or previous neurological disease, and (vi) any contraindication for MRI. Depressive symptom severity was evaluated using the 17-item Hamilton Depression Rating Scale (HDRS) (Hamilton, Reference Hamilton1960). The duration of illness was assessed using a life chart methodology. The Edinburgh handedness test was used to determine whether each participant was right-handed (Oldfield, Reference Oldfield1971). All participants were confirmed to have Korean ancestry within the past three generations via self-report. The study protocol was approved by the Institutional Review Board (IRB) of the Korea University Anam Hospital (2017AN0185). All the participants provided written informed consent to participate in the study. For a given sample size (n = 511; 2:1 case:control ratio), DNA methylation differences of 2% and 5% reached statistical power of 42% and 72%, respectively. Statistical power was calculated using the pwrEWAS R package (online Supplementary Fig. S1) (Graw, Henn, Thompson, & Koestler, Reference Graw, Henn, Thompson and Koestler2019)
Quality control and pre-processing of DNA Methylation data
The Infinium HumanMethylationEPIC BeadChip (Illumina Inc., San Diego, CA, USA) was used to estimate DNA methylation levels (online Supplementary Materials). For signal intensity values and pre-processing, the ChAMP R package was applied to the Illumina Intensity Data files (Tian et al., Reference Tian, Morris, Webster, Yang, Beck, Feber and Teschendorff2017). A β-value was used, which coded unmethylated as 0 and fully methylated as 1, to express the methylation level of each probe. Samples with a high proportion of poor-quality probes (>0.1) were excluded. We performed principal component analysis (PCA) to check for outliers that could confound the results among the samples. Probes were eliminated using the following criteria: (i) detection p-value >0.01 probes, (ii) bead count <3 in at least 5% of the samples, (iii) annotated as SNP-associated probes (Zhou, Laird, & Shen, Reference Zhou, Laird and Shen2017), (iv) located on the sex chromosome, (v) multi-hit CpG sites (Nordlund et al., Reference Nordlund, Bäcklin, Wahlberg, Busche, Berglund, Eloranta and Syvänen2013), and (vi) non-CG probes. β-mixture quantile normalization (BMIQ) was used to correct the technical batch resulting from differences in the Infinium probe type (Teschendorff et al., Reference Teschendorff, Marabita, Lechner, Bartlett, Tegner, Gomez-Cabrero and Beck2013). Singular value decomposition (SVD) was used to identify technical batches and covariates. The batch effect correction was conducted using the ComBat algorithm (Johnson, Li, & Rabinovic, Reference Johnson, Li and Rabinovic2007). We estimated the white blood cell type composition using the FlowSorted.Blood.EPIC R package (online Supplementary Materials) as differences in white blood cell type composition between samples may act as confounding factors.
MRI data acquisition and neuroimaging processing
T1-weighted images of the participants were obtained using a 3.0-Tesla TrioTM whole-body imaging system (Siemens Healthcare GmbH, Erlangen, Germany) at the Korea University MRI Center. The T1-weighted images were acquired parallel to the anterior-commissure–posterior-commissure line using the 3D T1-weighted magnetization-prepared rapid gradient-echo (MP-RAGE) sequence with the following parameters: repetition time (TR), 1900 ms; echo time (TE), 2.6 ms; field of view, 220 mm; matrix size, 256 × 256; slice thickness, 1 mm; number of coronal slices, 176 (without gap); voxel size, 0.86 × 0.86 × 1 mm3; flip angle, 16°; and number of excitations, 1. The T1-weighted MRI neuroimaging analysis included 234 of 350 patients with MDD and 135 of 161 HCs. The gray matter thickness of each cortical region was obtained from the participants' T1 images using the FreeSurfer 6.0 version (Laboratory for Computational Neuroimaging, Athinoula A. Martinos Center for Biomedical Imaging, Charlestown, MA, USA; http://surfer.nmr.mgh.harvard.edu). The FreeSurfer provides a 3D-cortical surface reconstruction model and entails automated procedures for the calculation of cortical thickness, including automatic segmentation of gray/white-matter boundaries, smoothing of the cortical map, and parcellation of cortical regions based on the atlas, as described previous literatures (Dale, Fischl, & Sereno, Reference Dale, Fischl and Sereno1999; Fischl, Liu, & Dale, Reference Fischl, Liu and Dale2001; Fischl et al., Reference Fischl, Salat, Busa, Albert, Dieterich, Haselgrove and Dale2002; Fischl, Sereno, & Dale, Reference Fischl, Sereno and Dale1999; Fischl et al., Reference Fischl, van der Kouwe, Destrieux, Halgren, Ségonne, Salat and Dale2004; Ségonne, Pacheco, & Fischl, Reference Ségonne, Pacheco and Fischl2007). Cortical gray matter thickness was determined as the shortest distance between the gray/white matter and pial surfaces measured in millimeters (mm) (Han et al., Reference Han, Tae, Kim, Kang, Kang, Kang and Ham2020b). The cortical map was smoothed using a Gaussian kernel with a full width at half maximum of 20 mm for all cortical analyses (Han et al., Reference Han, Tae, Kim, Kang, Kang, Kang and Ham2020b). The thicknesses of the 74 cortical gyri and sulci were calculated, and we then used the gray matter thickness value of the 38 cortical gyri in each hemisphere based on the atlas by Destrieux, Fischl, Dale, and Halgren (Reference Destrieux, Fischl, Dale and Halgren2010). The total intracranial cavity volume (TICV) was automatically calculated using the FreeSurfer software.
Differentially methylated positions and regions
Differentially methylated probes (DMPs) and differentially methylated regions (DMRs) were evaluated in patients with MDD and HCs. Treatment was based on covariates consisting of cell type heterogeneity, age, sex, and two principal components (PCs). Two PCs were included to correct for unknown biases. DMPs were identified using the limma R package (Ritchie et al., Reference Ritchie, Phipson, Wu, Hu, Law, Shi and Smyth2015). Bonferroni corrected p-value was applied to the DMP results (p-value ⩽0.05/(734 794 probes) = 6.80 × 10⁻⁸). We used the dmrff R package, which is based on inverse variance-weighted statistics (Suderman et al., Reference Suderman, Staley, French, Arathimos, Simpkin and Tilling2018), to identify DMR. Significant DMR was considered based on the following criteria: (i) distance between probes in a region ⩽300 bp, (ii) number of probes in a region ⩾2, (iii) each region should be related with at least one gene, and (iv) false discovery rate (FDR) ⩽0.05. The genomic coordinates of DMPs and DMRs were represented based on the GRCh38/hg38 reference genome.
Copy number alteration
CNA was performed using the ChAMP R package, which is based on the circular binary segmentation (CBS) method using HCs as a reference (Olshen, Venkatraman, Lucito, & Wigler, Reference Olshen, Venkatraman, Lucito and Wigler2004; Tian et al., Reference Tian, Morris, Webster, Yang, Beck, Feber and Teschendorff2017). Focal- and arm-level events that contained frequent gains or losses in the MDD group were determined using the Genomic Identification of Important Targets in Cancer 2.0 (GISTIC) algorithm. The genomic coordinates of the CNAs are represented based on the GRCh38/hg38 reference genome. Copy numbers >0.5 or < −0.5 were defined as copy number gains or losses, respectively.
Network analysis
Network analysis was performed using the Ingenuity Pathway Analysis (IPA) software (Ingenuity Systems, Redwood City, CA, USA) with genes that corresponded to significant DMPs. The Δβ values of DMPs were used to determine how each gene affects the integrated network, containing estimations of direct and indirect connections as well as experimentally observed relationships. The score for each network was calculated based on the set of focused genes in the network.
Neuroimaging analysis
Neuroimaging analyses were performed in two steps: First, one-way analysis of covariance (ANCOVA) was conducted adjusting for sex, age, TICV, and years of education to identify the difference in cortical thickness between the MDD and HC groups. The Benjamini–Hochberg (BH) approach was used to correct multiple testing error (the false discovery rate [FDR] ⩽0.05) for the comparison of the cortical thickness between the two groups. Second, Pearson's partial correlation analysis was used to determine whether a relationship exists between the significant CpG sites and the thickness of the cortical regions, which showed significant differences between the two groups, for the neuroimaging-epigenetic correlation analysis. The only significant DMPs were included in the correlation analysis (i.e. p-value ⩽6.80 × 10⁻⁸). Correlation analyses were performed for the MDD and HC groups using the following covariates: Sex, age, TICV, years of education, HDRS score, medication status (coded drug-naïve patients as 0 and medicated patients as 1), and illness duration were used as covariates for the MDD group. Illness duration, HDRS score, and medication status were excluded from the covariates in the HC group, as described in our previous study (Han et al., Reference Han, Choi, Kim, Kang, Kang, Tae and Ham2022). The BH approach was also applied in the neuroimaging-epigenetic correlation analyses (FDR ⩽ 0.05). CpG sites derived from the neuroimaging-epigenetic analysis were used to confirm potential co-methylation effects using coMET R package (Martin, Yet, Tsai, & Bell, Reference Martin, Yet, Tsai and Bell2015) (see online Supplementary Materials for detail). The correlations between the DNA methylation level of the CpG sites and HDRS scores were analyzed to further investigate the relationship between DNA methylation level and MDD severity using the Spearman rank correlation coefficient. Considering the patients in remission, a linear regression method was applied to adjust for the remission status on DNA methylation level before conducting the correlation analysis. R 4.0.3 environment was applied for all statistical analyses.
Results
Differentially methylated positions and regions
We performed a differential methylation analysis in 350 patients with MDD and 161 HCs. Age, years of education, and HDRS scores were significantly different between the MDD and HC groups (p-value ⩽0.05; Table 1). After quality control, 734 794 CpG sites remained and were used for differential methylation analysis.
Table 1. Demographic and clinical characteristics of patients with MDD and HCs
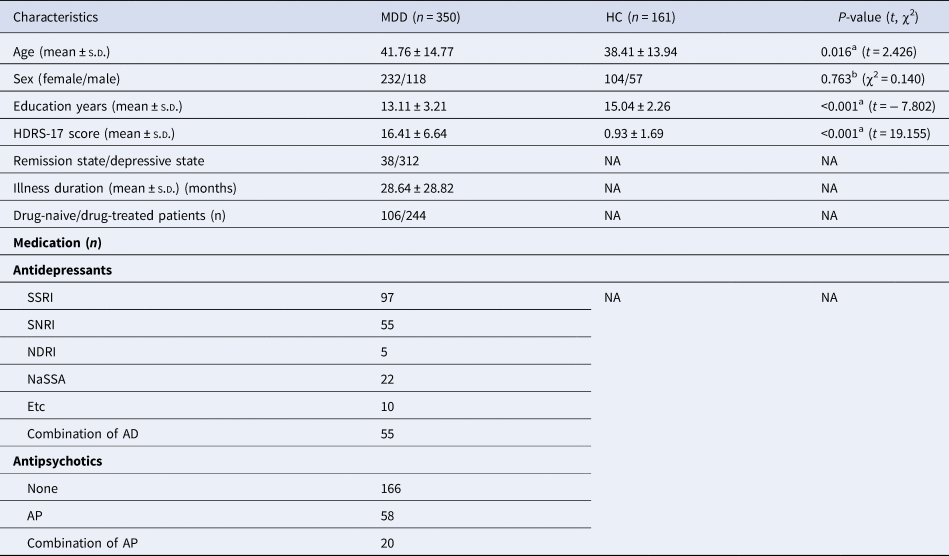
a p values for comparisons of age, years of education, HDRS scores, and TICV were obtained using independent t tests.
b p-values for sex distribution were obtained using the chi-square test.
HCs, healthy controls; MDD, major depressive disorder; SD, standard deviation; HDRS-17, 17-item Hamilton Depression Rating Scale; TICV, total intracranial cavity volume; SSRI, selective serotonin reuptake inhibitor; SNRI, serotonin and norepinephrine reuptake inhibitor; NDRI, norepinephrine-dopamine reuptake inhibitor; NaSSA, noradrenergic and specific serotonergic antidepressant; APs, antipsychotics; ADs, antidepressants.
A total of 2018 CpG sites were identified as significant DMPs with Bonferroni-corrected p-value (p-value ⩽6.80 × 10⁻⁸) (online Supplementary Table S1). These DMPs (1128 hypermethylated and 890 hypomethylated sites) were associated with 1474 unique genes, including 333 MDD-related genes (Fig. 1a, b). The top 20 DMPs are presented in Table 2 and highlighted in Fig. 1b. Among them, cg03009437 (chr22:31276850; LIMK2), cg07670259 (chr17:2613677; PAFAH1B1), and cg13128596 (chr11:104969131; CASP4) were associated with MDD-related genes with p-values of 2.84 × 10⁻¹⁵, 3.96 × 10⁻¹⁵, and 4.30 × 10⁻¹⁵, respectively (Gao et al., Reference Gao, Wang, Liu, Wang, Wang, Guan and Jiang2020; Hall et al., Reference Hall, Adams, Arnau-Soler, Clarke, Howard, Zeng and McIntosh2018; Nagel et al., Reference Nagel, Jansen, Stringer, Watanabe, de Leeuw, Bryois and Posthuma2018).
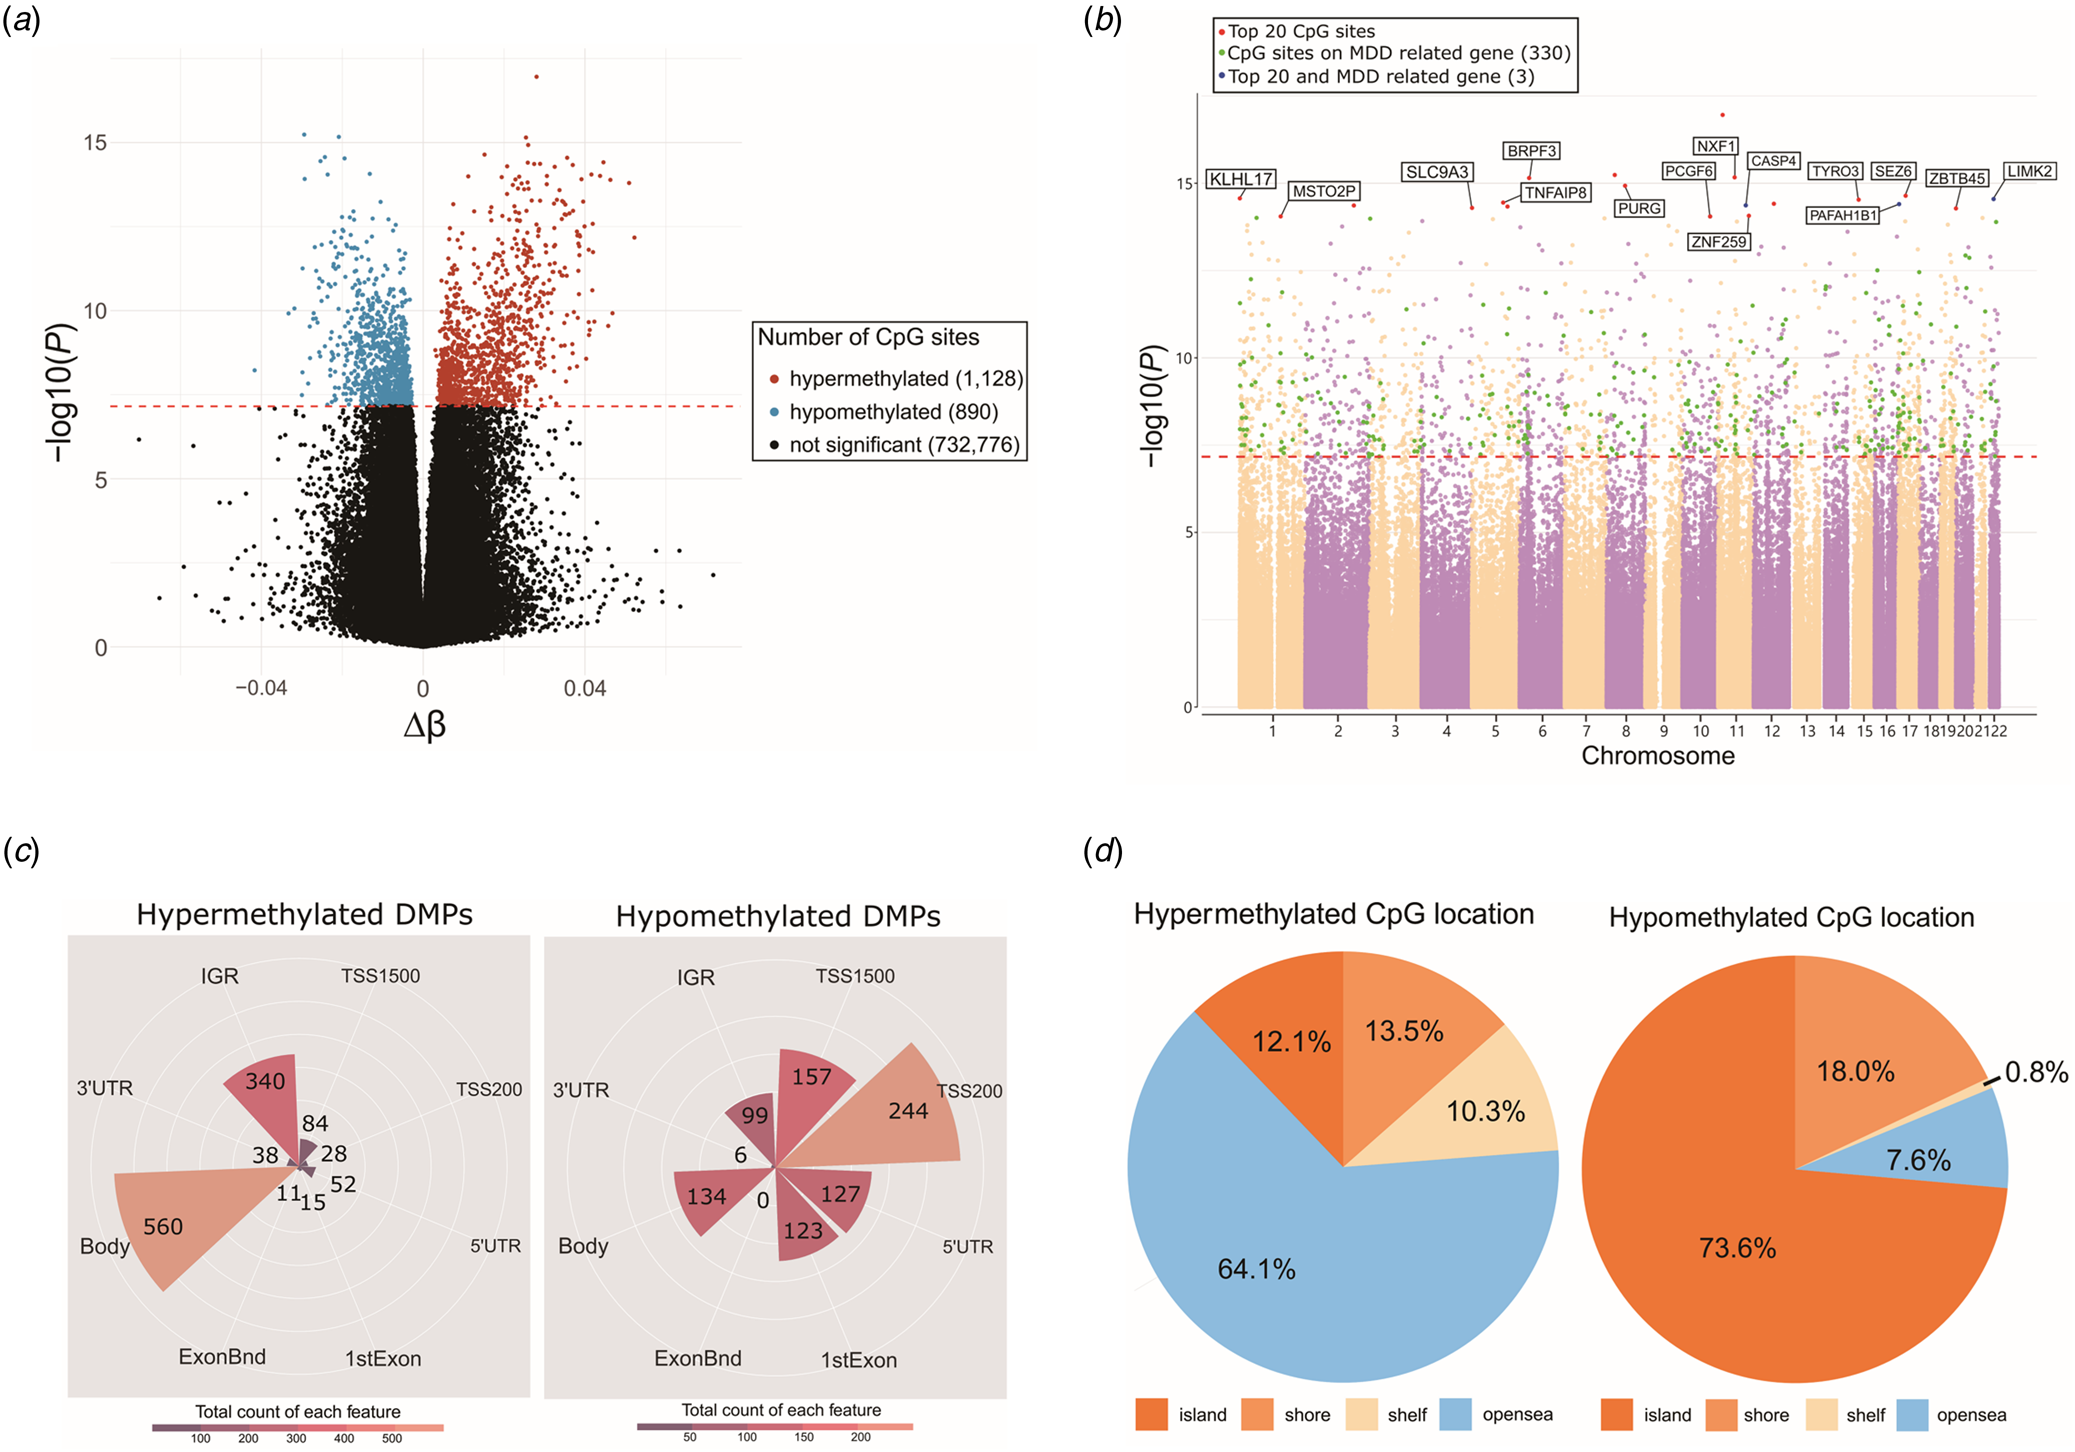
Figure 1. Differentially methylated probes (DMPs) between major depressive disorder (MDD) and healthy control (HC) groups. (a) Volcano plot of all CpG sites. X-axis represents Δβ, and y-axis represents −log10(p-value). Hypomethylated probes in MDD group are highlighted in blue, whereas hypermethylated probes are highlighted in red. Black dot represents probes that are not significant. The horizontal dashed line at −log10(6.80E − 08) indicates the Bonferroni corrected p-value of 0.05. Δβ (delta-beta), the average beta value of MDD patients minus the average beta value of HCs. (b) Manhattan plot of all CpG sites. Y-axis represents −log10(p-value), whereas x-axis represents chromosomes. Different colors are used to identify different chromosomes. DMP results were adjusted for sex, age, white blood cell composition and two principal components. The horizontal red dashed line at −log10(6.80E − 08) indicates the Bonferroni corrected p-value of 0.05. For the top 20 significant DMPs, 17 CpG sites are labeled with red dots and three CpG sites are labeled with blue dots since they are found in MDD related genes. Among the remaining, a total of 330 green labeled CpG sites are found in MDD related genes. (c) Polar bar plot indicating distributions of functional genomic regions of hypermethylated (left) and hypomethylated (right) DMPs. Colors are illustrated according to the number of probes for each functional genomic region. TSS1500, 200–1500 bp upstream of the transcriptional start site; TSS200, 0–200 bp upstream of the transcriptional start site; 5′UTR, between the transcriptional start site and the ATG start site; 1stExon, first exon; Body, between the ATG and stop codon; 3′UTR, between the stop codon and poly A signal; IGR, intergenic region; ExonBnd, Exon-boundary. (d) Pie chart illustrating distributions of hypermethylated (left) and hypomethylated (right) DMPs according to the CpG island regions. Different color labels are used to distinguish different regions. shelf, 2–4 kb from a CpG island; shore, 0–2 kb from a CpG island; openSea, >4 kb from a CpG island; island, CpG island.
Table 2. Top 20 DMPs obtained from methylation analysis of patients with MDD
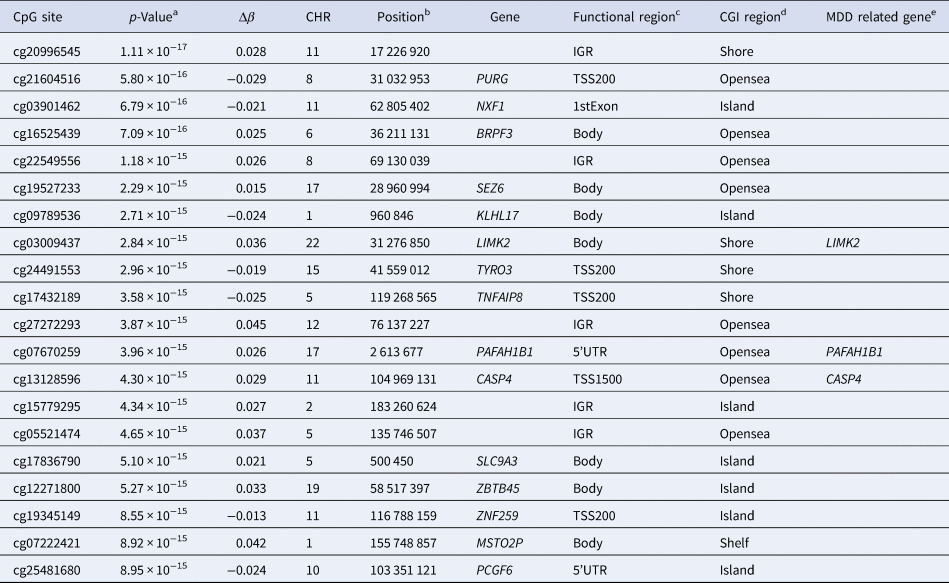
a Bonferroni corrected p-value (⩽0.05/(734 794 probes) = 6.80E − 08).
b UCSC GRCh38/hg38.
c CpG sites located in functional genomic regions, TSS1500, 200–1500 bases upstream of the transcriptional start site; TSS200, 0–200 bases upstream of the transcriptional start site; 5′UTR, between the transcriptional start site and ATG start site; 1stExon, first exon; Body, between ATG and stop codon; IGR, intergenic region.
d CpG sites located on CpG islands, Shelf, 2–4 kb from a CpG island; Shore, 0–2 kb from a CpG island; OpenSea, >4 kb from a CpG island; Island, CpG island.
e MDD-related genes were extracted from the GWAS catalog (https://www.ebi.ac.uk/gwas/) and PubMed (https://pubmed.ncbi.nlm.nih.gov/).
DMP, differentially methylated probe; MDD, major depressive disorder; Δβ (delta-beta), the average beta value of MDD patients minus the average beta value of HCs; CGI, CpG island.
The functional genomic and CpG island regions of 2018 significant DMPs were separated into hypermethylated and hypomethylated DMPs. Among the 2018 DMPs, 560 of the 1128 (49.65%) hypermethylated DMPs were aligned to the body region of the gene (Fig. 1c). The second highest number of hypermethylated DMPs (340 of 1128 DMPs, 30.14%) were aligned within the intergenic region (IGR) (Fig. 1c). Conversely, 27.4% of the hypomethylated DMPs were located at 200 bp upstream of the transcript start site (TSS200), 17.64% at 1500 bp upstream of the transcript start site (TSS1500), 15.05% in the gene body, 14.27% in the 5′ untranslated region (5′ UTR), 13.82% in the first exons, 11.12% in the IGR, 0.67% in the 3′ untranslated region (3′ UTR), and no DMPs in exon boundaries (Fig. 1c). Interestingly, we found that 64.1% of the hypermethylated DMPs were located in the open-sea region, whereas 73.6% of the hypomethylated DMPs were located in the CpG island region, which is highly distributed in mammalian gene promoters (Fig. 1d) (Saxonov, Berg, & Brutlag, Reference Saxonov, Berg and Brutlag2006). In summary, hypermethylated DMPs were found more frequently in the gene body region and IGR, whereas hypomethylated DMPs were found more frequently in promoter-associated regions. A previous study revealed that increased DNA methylation levels in the gene body regions may increase gene expression (Laurent et al., Reference Laurent, Wong, Li, Huynh, Tsirigos, Ong and Wei2010). Thus, our findings suggest that MDD-related genes are upregulated through epigenetic modifications in patients with MDD.
DMRs can capture additional signals from multiple single sites because they collect methylation variations between subsequent probes in an area. A total of 351 DMRs were identified using the criteria described in the Materials and Methods section, after adjusting for sex, age, and two principal components (online Supplementary Table S2). The most significant DMR was located on chromosome 6, which included two CpG sites associated with the gene body region of the BRPF3 gene (online Supplementary Table S2).
Copy number alteration
To detect CNAs, 350 patients with MDD were analyzed using GISTIC algorithm. A total of 37 gains and 23 losses were identified at FDR ⩽ 1.0 × 10⁻⁴ (online Supplementary Fig. S2). Recurring focal CNAs in patients included gains in HLA-DRB5 on 6p21.32, HLA-A and RNF39 on 6p22.1, olfactory receptor gene family (OR4K5, OR11H2, OR4K1, OR4K2, OR4N2, OR11H12, OR4Q3, and OR4M1) on 14q11.2, and HLA-B on 6p22.33, and losses in HCG4B on 6p22.1, HLA-B on 6p21.33, DUSP22 on 6p25.3, LOC645166 on 1q21.2, and LOC641298 on 16p12.2 (online Supplementary Table S3).
Gene network analysis
IPA was performed to identify the interactions and networks between the 1474 DMP-related genes. The IPA identified the enrichment of 25 networks involved in multiple diseases and disorders. We found two networks associated with the central nervous system (CNS): A network with a score of 29 was associated with nervous system development and function, organ morphology, and tissue morphology (online Supplementary Fig. S3a). Another network, with a score of 29, was associated with developmental disorders, hereditary disorders, and neurological diseases (online Supplementary Fig. S3b).
Cortical thickness alterations
In the neuroimaging analysis, 234 of 350 patients with MDD and 135 of 161 HCs were included (online Supplementary Table S4). Comparisons of 76 cortical thickness of the bilateral hemispheres between the MDD and HC groups showed that four significantly increased cortical regions and three significantly decreased cortical regions with FDR ⩽ 0.05 (online Supplementary Table S5). Patients with MDD showed significantly decreased cortical thicknesses in the left pars triangularis (FDR = 0.046), right transverse frontopolar gyrus (FDR = 0.018), and middle frontal gyrus (FDR = 0.018). The patient group also showed significantly increased cortical thickness in several occipital regions, including the bilateral lingual gyri (right: FDR = 0.020; left: FDR = 0.046), left superior occipital gyrus (FDR = 0.021), and the right cuneus (FDR = 0.023) (online Supplementary Table S6).
We performed an ad hoc analysis to investigate the potential correlation between cortical thickness of the left pars triangularis and illness duration or depression severity. In Pearson's partial correlation analysis, we observed a weak but significant negative correlation between illness duration and the thickness of the left pars triangularis in the MDD group (r = −0.156, p-value = 0.019), with age, sex, TICV, years of education, medication, and the HDRS score as covariates. However, we did not find any significant correlation between HDRS score and cortical thickness in the MDD group.
Correlation between DNA methylation and cortical thickness
Correlation analyses were conducted using the β values of 2018 significant DMPs and the thicknesses of 76 cortical regions. Within seven cortical regions that showed different cortical thickness between the MDD and HC groups, eight CpG sites had significant correlations at FDR ⩽ 0.05 (Table 3). For these eight CpG sites, the cortical thickness of the left pars triangularis showed negative correlations with cg09705759 (r = −0.213, FDR = 0.022), cg14706523 (r = −0.213, FDR = 0.031), cg02593636 (r = −0.231, FDR = 0.034), cg26929161 (r = −0.229, FDR = 0.038), cg01490772 (r = −0.217, FDR = 0.039), cg23644045 (r = −0.227, FDR = 0.043), cg24300703 (r = −0.227, FDR = 0.043), and cg04227758 (r = −0.225, FDR = 0.049) (Table 3) in the MDD group. This relationship was absent in the HC group entirely (Fig. 2). Additionally, we analyzed the correlation between the methylation level of eight CpG sites and HDRS scores in the MDD and HC groups, respectively. Among the eight CpG sites, cg09705759 showed a positive correlation with the HDRS scores (r = 0.120, p-value = 0.025), whereas cg01490772 showed a negative correlation with the HDRS scores (r = −0.237, p-value = 8.03 × 10⁻⁶). Those relationships were not observed in the HC group, indicating that these CpG sites may have potential as epigenetic markers for assessing MDD severity (online Supplementary Fig. S4).
Table 3. Correlation between cortical thickness of significant brain regions and DNA methylation levels of eight CpG sites in patients with MDD

a CpG sites locate in functional genomic regions, TSS1500, 200–1500 bases upstream of the transcriptional start site; Body, between the ATG and stop codon; IGR, intergenic region.
b UCSC GRCh38/hg38.
c Benjamini–Hochberg (BH) approach was applied (FDR ⩽ 0.05).
MDD, major depressive disorder; Δβ (delta-beta), the average beta value of MDD patients minus the average beta value of HCs; FDR, false discovery rate; L, left hemisphere.

Figure 2. Scatter plots of Pearson's partial correlation analysis between brain cortical thickness and differentially methylated probes (DMPs). Red dots/lines indicate MDD group and black dots/lines indicate HC group. Colored line represents the correlation between cortical thickness of brain region and methylation level of CpG sites. Each plot showed significant negative correlations between the left pars triangularis and (a) cg09705759, (b) cg14706523, (c) cg02593636, (d) cg26929161, (e) cg01490772, (f) cg23644045, (g) cg24300703, and (h) cg04227758. Cortical thickness was adjusted for age, sex, education year, total intracranial cavity volume, illness duration, HDRS score, and medication status. Methylation level was adjusted for age, sex, PC1, and PC2. Pearson correlation coefficients and p-values are indicated for both groups. MDD, major depressive disorder; HC, healthy control; L, left hemisphere; R, Pearson's partial correlation coefficient; HDRS, 17-item Hamilton Depression Rating Scale; PC, principal component.
Discussion
In this study, we performed a comprehensive analysis to examine the association between genome-wide DNA methylation and structural changes in the brain of patients with MDD. The main strength of this study was the investigation of novel epigenetic loci and their relationship with cortical thickness in patients with MDD. We found 2018 candidate CpG sites and 351 regions. Interestingly, 8 of the 2018 CpG sites from the EWAS results showed significant negative correlations with the cortical thickness of the left pars triangularis, which corresponds to the ventrolateral prefrontal cortex (VLPFC) in patients with MDD. The present study makes an important contribution to the understanding of the pathophysiology of MDD regarding the interactions between epigenetic makeup, structural brain changes, and the disease.
Of the top 20 DMP-related genes, the nuclear RNA export factor 1 (NXF1) gene has been identified as a positive regulator of the IRF5 signaling pathway that was involved in various autoimmune diseases, such as inflammatory bowel disease and multiple sclerosis (Kaur, Lee, Chow, & Fang, Reference Kaur, Lee, Chow and Fang2018). Seizure-related gene 6 (Sez6), another top DMP-related gene, encodes a transmembrane protein that modulates synaptic plasticity in the cortex and hippocampus (Gunnersen et al., Reference Gunnersen, Kim, Fuller, De Silva, Britto, Hammond and Tan2007). Sez6 is involved in psychiatric disorders, including autism spectrum disorder (ASD), childhood-onset schizophrenia, and bipolar disorder (BD) (Ambalavanan et al., Reference Ambalavanan, Girard, Ahn, Zhou, Dionne-Laporte, Spiegelman and Rouleau2016; Chapman et al., Reference Chapman, Nato, Bernier, Ankenman, Sohi, Munson and Wijsman2015; Xu et al., Reference Xu, Mullersman, Wang, Bin Su, Mao, Posada and Wang2013). Given the neural–immune interactions and synaptic plasticity are deeply involved in the etiology of MDD (Barnes, Mondelli, & Pariante, Reference Barnes, Mondelli and Pariante2017; Duman, Aghajanian, Sanacora, & Krystal, Reference Duman, Aghajanian, Sanacora and Krystal2016; Han & Ham, Reference Han and Ham2021; Troubat et al., Reference Troubat, Barone, Leman, Desmidt, Cressant, Atanasova and Belzung2021), our results suggest that NXF1 and Sez6 methylation may play an important role in the pathophysiology of MDD. Among the other top DMP-related genes, LIM kinase 2 (LIMK2), a gene that regulates cortical development and was reported to be associated with schizophrenia by a recent EWAS in the Han Chinese population (Li et al., Reference Li, Li, Qin, Tubbs, Li, Qiao and Yao2021). A previous study also reported its up-regulation in deep layer three pyramidal cells in the dorsolateral prefrontal cortex in patients with schizophrenia (Datta, Arion, Corradi, & Lewis, Reference Datta, Arion, Corradi and Lewis2015). Bromodomain and PHD finger containing protein 3 (BRPF3), which is involved in the regulation of the histone acetyltransferase activity and substrate specificity, was reported to be associated with both, MDD in a recent large-scale whole-exome sequencing study (Zhou et al., Reference Zhou, Chen, Jiang, Sun, Li, Wu and Qin2021) and antidepressant response in patients with MDD (Kang et al., Reference Kang, Kim, Yoo, Park, Kim, Kim and Kim2020). PAFAH1B1, also known as LIS1, encodes a critical mediator of neuronal migration in brain development (Sudarov et al., Reference Sudarov, Zhang, Braunstein, LoCastro, Singh, Taniguchi and Ross2018) and is suggested to be related with chronic mental illness such as schizophrenia and BD (Cukkemane et al., Reference Cukkemane, Becker, Zielinski, Frieg, Lakomek, Heise and Weiergräber2021; Tabarés-Seisdedos et al., Reference Tabarés-Seisdedos, Escámez, Martínez-Giménez, Balanzá, Salazar, Selva and Martínez2006). This gene is also deeply involved in synaptic function and plasticity of mature CA1 neurons in the hippocampus (Sudarov et al., Reference Sudarov, Zhang, Braunstein, LoCastro, Singh, Taniguchi and Ross2018). A Kelch-like 17 (KLHL17) gene, which encodes a neuron-specific F-actin binding protein, is known to regulate dendritic spine morphology or plasticity and be associated with neurodevelopment disorders such as intellectual disability and ASD (Hu, Huang, & Hsueh, Reference Hu, Huang and Hsueh2020; Huang, Fang, Kung, & Chen, Reference Huang, Fang, Kung and Chen2022). CASP4 gene encodes a caspase-4, which plays a critical role in inflammatory responses, secretion of interleukin (IL)-1b and IL-18 (Kajiwara et al., Reference Kajiwara, Schiff, Voloudakis, Gama Sosa, Elder, Bozdagi and Buxbaum2014) and is reported to be associated with schizophrenia and BD in a human study (de Baumont et al., Reference de Baumont, Maschietto, Lima, Carraro, Olivieri, Fiorini and Brentani2015). A previous mouse study also suggested that this gene contributes to the pathogenesis and cognitive impairment in Alzheimer's disease (Kajiwara et al., Reference Kajiwara, McKenzie, Dorr, Gama Sosa, Elder, Schmeidler and Buxbaum2016). The exact function of PURG, which encodes a kind of purine-rich element-binding protein, is not well understood, several genome-wide association studies have reported that PURG is associated with cognitive performance and intelligence (Hill et al., Reference Hill, Marioni, Maghzian, Ritchie, Hagenaars, McIntosh and Deary2019; Kang et al., Reference Kang, Ang, Devine, Sherva, Mukherjee, Trittschuh and Farrer2023; Lee et al., Reference Lee, Wedow, Okbay, Kong, Maghzian, Zacher and Cesarini2018).
A significantly hypermethylated region was identified in the gene body region of the histone deacetylase 3 (HDAC3) gene, which is a member of the class I HDACs (Park & Kim, Reference Park and Kim2020). Overexpression of HDAC3 has been reported to accelerate oxidative stress-induced neurodegenerative processes (Bardai & D'Mello, Reference Bardai and D'Mello2011). Furthermore, previous studies have reported that HDAC3 is associated with the pathophysiology of Parkinson's and Alzheimer's disease (Choi et al., Reference Choi, Choi, Kang, Lim, Park, Lee and Yoon2015; Mahady et al., Reference Mahady, Nadeem, Malek-Ahmadi, Chen, Perez and Mufson2018). Another significant DMR was found in the promoter hypomethylation of the orphan G protein-coupled receptor 12 (GPR12) gene, which plays a critical role in cortical development (Ignatov et al., Reference Ignatov, Lintzel, Hermans-Borgmeyer, Kreienkamp, Joost, Thomsen and Schaller2003). A previous study has reported that GPR12 is upregulated in the microglia through a neuroinflammation process (Bédard, Tremblay, Chernomoretz, & Vallières, Reference Bédard, Tremblay, Chernomoretz and Vallières2007). Given the suggested roles of these genes, epigenetic modifications may be associated with the pathophysiology of MDD.
We found significant CNAs within several genes, including the ring finger protein 39 (RNF39) and olfactory receptor gene families. According to a previous study, the hypomethylation of RNF39-containing DMR is associated with the development of PTSD after traumatic stress exposure (Rutten et al., Reference Rutten, Vermetten, Vinkers, Ursini, Daskalakis, Pishva and Boks2018). The olfactory receptor gene family, located at 14q11.2, is strongly associated with ASDs and an earlier age of Alzheimer's disease (Gibitova et al., Reference Gibitova, Dobrynin, Pomerantseva, Musatova, Kostareva, Evsyukov and Grigorenko2022; Shaw et al., Reference Shaw, Li, Wiszniewska, Chasse, Zaidi, Jin and Szigeti2011). Interestingly, the human leukocyte antigen (HLA) regions contain the most abundant focal gain and loss regions in the present study. Recently, there has been growing evidence that inflammatory markers or autoimmune diseases that play a role in the etiology of MDD are correlated with highly polymorphic HLA regions (Gough & Simmonds, Reference Gough and Simmonds2007; Osimo et al., Reference Osimo, Pillinger, Rodriguez, Khandaker, Pariante and Howes2020). Although significant alterations were observed in our study, these results warrant further investigation.
Given the epigenetic variations, we identified two gene networks associated with the CNS. The first gene network included the NF-κB complex with multiple indirect interactions. NF-κB plays a crucial role in inflammatory and structural plasticity in the mature brain (Dresselhaus & Meffert, Reference Dresselhaus and Meffert2019). The second gene network included Tumor necrosis factor-a-induced protein 8 (TNFAIP8) and TYRO3 protein tyrosine kinase (TYRO3), the top-ranked DMP-related genes. TNFAIP8 is essential for maintaining immune homeostasis via regulating IκBα/NF-κB and PI3K/Akt signaling pathways (Xue et al., Reference Xue, Tan, Dong, Tang, Yang, Shi and Qian2020). Downregulation of TYRO3 has been implicated in loss of stress resistance (e.g. hypoxia and neurotransmitter overstimulation) and neurodevelopmental diseases (Pierce & Keating, Reference Pierce and Keating2014; Zhang et al., Reference Zhang, Su, Xia, Jia, Meng, Wang and Su2023). Therefore, the complex interactions of these genes may be associated with the pathophysiology of MDD through their involvement in structural alterations and neuroinflammatory processes in the brain.
In this study, we observed significant cortical thinning of the prefrontal cortex (PFC), including the left pars triangularis, right transverse frontopolar, and middle frontal gyri, and cortical thickening in several occipital regions in the MDD group. A reduction in MDD-associated cortical thickness in the PFC has been consistently reported in numerous MRI studies (Schmaal et al., Reference Schmaal, Hibar, Sämann, Hall, Baune, Jahanshad and Veltman2017; Suh et al., Reference Suh, Schneider, Minuzzi, MacQueen, Strother, Kennedy and Frey2019). For example, a previous meta-analysis by Schmaal et al. (Reference Schmaal, Hibar, Sämann, Hall, Baune, Jahanshad and Veltman2017), using MRI data from 2148 patients with MDD and 7957 HC volunteers from 20 sites worldwide, reported significant MDD-related thinning of the PFC, including the pars triangularis, middle frontal gyrus, and frontal pole, which corresponds to the results of the present study. In particular, the pars triangularis, which corresponds to the VLPFC and its cortical thinning, was significantly correlated with epigenetic loci in the present study and is deeply involved in the cognitive control of negative emotions and reward processing with regard to the neural circuit dysfunction of MDD (Phillips et al., Reference Phillips, Chase, Sheline, Etkin, Almeida, Deckersbach and Trivedi2015; Rive et al., Reference Rive, van Rooijen, Veltman, Phillips, Schene and Ruhé2013).
We examined the association between 2018 DMPs and cortical region thickness, which showed significant differences between the MDD and HC groups, to identify novel epigenetic loci associated with cortical thickness changes in patients with MDD. The reduction in the cortical thickness of the left pars triangularis, which corresponds to the VLPFC, was strongly correlated with DNA methylation changes in eight CpG sites in the MDD group but not in the HC group. We found that six out of eight CpG sites were associated with EML6, ZFP64, CLSTN3, KCNMA1, TAOK2, and NT5E genes. CLSTN3 encodes calsyntenin-3, a synaptogenic adhesion molecule that plays an important role in GABAergic and glutaminergic synaptic development (Um et al., Reference Um, Pramanik, Ko, Song, Lee, Kim and Ko2014). This gene has been reported to be associated with ASDs and schizophrenia via its involvement in brain development (Howes & Onwordi, Reference Howes and Onwordi2023; Woodbury-Smith et al., Reference Woodbury-Smith, Lamoureux, Begum, Nassir, Akter, O'Rielly and Uddin2022). Furthermore, a recent study using maternal peripheral blood samples from 92 participants reported that DNA methylation of CLSTN3 was associated with postpartum depressive symptoms (Lapato et al., Reference Lapato, Roberson-Nay, Kirkpatrick, Webb, York and Kinser2019). EML6 encodes microtubule-associated proteins, which are associated with cytoskeletal function (Shinde et al., Reference Shinde, Sobreira, Wohler, Maiti, Hu, Silvestri and Chakravarti2021), and its genetic expression has been reported to be altered in post-mortem PFC tissue from patients with Alzheimer's disease (Sherva et al., Reference Sherva, Zhang, Sahelijo, Jun, Anglin, Chanfreau and Logue2023) and postmortem midbrain tissue from those with schizophrenia (Puvogel et al., Reference Puvogel, Alsema, Kracht, Webster, Weickert, Sommer and Eggen2022). TAOK2 is located in the 16p11.2 chromosomal deletion region, which is known to be associated with ASD and schizophrenia (Richter et al., Reference Richter, Murtaza, Scharrenberg, White, Johanns, Walker and Calderon de Anda2019). This gene has a critical role in brain development through involvement in synaptic and dendritic development (Richter et al., Reference Richter, Murtaza, Scharrenberg, White, Johanns, Walker and Calderon de Anda2019), and its genetic variant was associated with psychosis phenotype, including schizophrenia and BD, in the genome-wide association study (Steinberg et al., Reference Steinberg, de Jong, Mattheisen, Costas, Demontis, Jamain and Stefansson2014), and a most recent EWAS reported that DNA methylation of TAOK2 was associated with the degree of general psychopathology in childhood (Rijlaarsdam et al., Reference Rijlaarsdam, Cosin-Tomas, Schellhas, Abrishamcar, Malmberg, Neumann and Cecil2023). KCNMA1 encodes the BK channels, which comprise four α-subunits of the calcium ion-activated potassium channel and play an important role in the synaptic regulation of neuronal excitability (Laumonnier et al., Reference Laumonnier, Roger, Guérin, Molinari, M'Rad, Cahard and Briault2006). KCNMA1 has been reported to be associated with ASD and neurodevelopment disorders (Cheng, Qiu, & Du, Reference Cheng, Qiu and Du2021), and its de novo mutation was reported to be associated with ASD (Wu et al., Reference Wu, Li, Bai, Han, Ou, Xun and Xia2020). ZFP64 encodes a co-activator of the Notch signaling pathway (Sakamoto, Tamamura, Katsube, & Yamaguchi, Reference Sakamoto, Tamamura, Katsube and Yamaguchi2008), which is involved in the regulation of neuronal cell proliferation, differentiation, and growth (Ables, Breunig, Eisch, & Rakic, Reference Ables, Breunig, Eisch and Rakic2011). The potential contribution of the Notch signaling pathway to the predisposition to psychiatric disorders has been reported (Hoseth et al., Reference Hoseth, Krull, Dieset, Mørch, Hope, Gardsjord and Ueland2018). Previous studies have reported that ZFP64 is associated with recurrent MDD (Glahn et al., Reference Glahn, Curran, Winkler, Carless, Kent, Charlesworth and Blangero2012) and binge eating behavior in BD (Winham et al., Reference Winham, Cuellar-Barboza, McElroy, Oliveros, Crow, Colby and Biernacka2014). Another significant CpG site, cg04227758, was located in the body region of the NT5E gene. The NT5E gene encodes ecto-5′-nucleotidase (CD73), which plays a role in converting 5′-adenosine monophosphate (AMP) to adenosine (Lennon, Taylor, Stahl, & Colgan, Reference Lennon, Taylor, Stahl and Colgan1998). Dysregulation of the adenosine metabolism pathway can contribute to the etiology of psychiatric disorders, including ASD, Alzheimer's disease, and MDD (Liu et al., Reference Liu, Chen, Li, Zhou, Hu, Chu and Chen2019), because it may affect neuronal dysfunction and neurodegeneration via glutamatergic neurotransmission (Cunha, Reference Cunha2016). Previous studies have reported that NT5E is associated with diagnosis of BD (Bigdeli et al., Reference Bigdeli, Maher, Zhao, Sun, Medeiros, Akula and Fanous2013) and history of childhood trauma in patients with MDD (Van der Auwera et al., Reference Van der Auwera, Peyrot, Milaneschi, Hertel, Baune, Breen and Grabe2018).
An epigenetic modification refers to not only a potentially heritable, but also an environmentally modifiable regulation of gene function and expression by psychosocial stresses particularly for childhood maltreatments (Lopizzo et al., Reference Lopizzo, Bocchio Chiavetto, Cattane, Plazzotta, Tarazi, Pariante and Cattaneo2015). Furthermore, convergence evidence has shown that this environment-induced alteration in DNA methylation contributes to an individual's predisposition to MDD by impairing brain network development (Wheater et al., Reference Wheater, Stoye, Cox, Wardlaw, Drake, Bastin and Boardman2020). For example, a study by Tozzi et al. (Reference Tozzi, Farrell, Booij, Doolin, Nemoda, Szyf and Frodl2018) found that DNA methylation of FKBP5 gene intron seven regions was correlated with the degree of childhood adversity among patients with MDD and high-risk allele of rs1360780, and that DNA methylation was also correlated with reduced gray matter concentration in the prefrontal cortex (i.e. inferior frontal orbital gyrus). Another study suggested that childhood maltreatment was associated with higher DNA methylation levels of the oxytocin receptor (OXTR) gene, which was negatively correlated with the gray matter volume of the left orbitofrontal cortex among children (Fujisawa et al., Reference Fujisawa, Nishitani, Takiguchi, Shimada, Smith and Tomoda2019). Considering the potential interplay among epigenetic modifications, early life stress, and brain structural changes with regard to the pathophysiology of MDD (Uchida, Yamagata, Seki, & Watanabe, Reference Uchida, Yamagata, Seki and Watanabe2018; Wheater et al., Reference Wheater, Stoye, Cox, Wardlaw, Drake, Bastin and Boardman2020), epigenetic loci associated with the diagnosis of MDD or cortical thickness changes in the present study may have underlying potential interactions with psychosocial environmental factors. However, we did not investigate participants' psychosocial environmental factors, such as early life stress, which might limit our ability to unravel the complex interplay among epigenetic mechanisms, structural brain changes, and the development of MDD.
In a combined neuroimaging-epigenetic analysis, only a subset of epigenetic loci was associated with cortical thickness changes in patients with MDD. Several epigenetic loci can increase an individual's susceptibility to the development of MDD by modulating the pathophysiological pathways of MDD (Penner-Goeke & Binder, Reference Penner-Goeke and Binder2019). Among these epigenetic loci, some may be involved in neurobiological mechanisms that could impact intermediate neuroimaging phenotypes, such as structural brain changes associated with depression, including synaptic and dendritic development, neuronal cell proliferation, differentiation, growth, and glutamatergic neurotransmission (Uchida et al., Reference Uchida, Yamagata, Seki and Watanabe2018; Wheater et al., Reference Wheater, Stoye, Cox, Wardlaw, Drake, Bastin and Boardman2020). Recent large-scale collaborative imaging-genetic studies, such as the Enhancing Neuro Imaging Genetics through Meta-Analysis (ENIGMA) consortium and the IMAGEN study, have suggested that structural brain alterations were heritable and polygenic (Hibar et al., Reference Hibar, Stein, Renteria, Arias-Vasquez, Desrivières, Jahanshad and Medland2015; Stein et al., Reference Stein, Medland, Vasquez, Hibar, Senstad, Winkler and Thompson2012), and a growing body of evidence has shown the relationship between DNA methylation and brain structural changes in MDD (Wheater et al., Reference Wheater, Stoye, Cox, Wardlaw, Drake, Bastin and Boardman2020). Thus, in the present study, we presumed that among the 2018 DMPs involved in MDD pathophysiology, only a subset might be involved in the depression-related intermediate neuroimaging phenotype. This may explain why several CpG sites related to the diagnosis of MDD were associated with changes in cortical thickness in the present study.
This study had several strengths and limitations. First, we examined the DNA obtained from peripheral blood, which does not directly represent the methylation landscape in the brain tissue. However, previous studies have suggested a concordance between DNA methylation patterns in peripheral lymphocytes and several brain regions (Davies et al., Reference Davies, Volta, Pidsley, Lunnon, Dixit, Lovestone and Mill2012; Horvath et al., Reference Horvath, Zhang, Langfelder, Kahn, Boks, van Eijk and Ophoff2012). Second, causal relationship between the onset of MDD and DNA methylation level cannot be established in a case-control study and confounding factors should be considered. Although we adjusted DNA methylation results using two confounders (age, sex) and two principal components, there are still potential confounders such as functional polymorphisms and environmental factors (e.g. BMI, smoking, alcohol consumption, physical activity, and other lifestyle factors) that may affect the interpretation of our results. Therefore, our findings should be interpreted with caution and need further validation using external cohort data. Furthermore, within 10 kb genomic regions centered on each of the 8 CpG sites, we did not observe any significant co-methylation (rho > |0.5|) (online Supplementary Fig. S5). Since the potential impact of multiple CpG sites on cortical thickness might not be fully addressed, further efforts to validate co-methylation using whole-genome bisulfite sequencing are needed. Additionally, the lack of replication and relatively small sample size may limit the reliability of the present study. However, to maximize the statistical power, all samples were included in the discovery group without creating an independent replication group. Although our study is still underpowered in cases where DNA methylation differences are marginal, we comprehensively investigated the potential correlation between epigenetic loci and brain structure (i.e. cortical thickness) in patients with MDD, thereby providing a foundation for translational research in neuroimaging genomics. Future studies with larger sample sizes are expected to support the findings of this study. Finally, we did not provide further validation results at the gene expression level because of the limited sample size in the Gene Expression Omnibus (GEO) database (GSE42546, GSE80655, GSE101521, GSE102556, and GSE185855) (data not shown). Further investigation of our findings, through the combination of epigenomic, genomic, transcriptomic, and metabolomic data, will provide a deeper understanding of the pathophysiological mechanisms underlying MDD.
In conclusion, we found that the cortical thickness of the left VLPFC was negatively correlated with the DNA methylation levels of CpG sites associated with EML6, ZFP64, CLSTN3, KCNMA1, TAOK2, and NT5E, which may affect alterations in brain function and structure. In addition, genes associated with DMPs were enriched in the gene networks involved in CNS morphology and neurodevelopmental disorders. Our findings provide deeper insight into the pathophysiological mechanisms of MDD.
Supplementary material
The supplementary material for this article can be found at https://doi.org/10.1017/S0033291724000709.
Acknowledgements
The authors are grateful to all the participants who volunteered, interviewers, and technicians included in this study. All the authors agree with the published version of the manuscript.
Funding statement
This work was supported by National Research Foundation of Korea (NRF) grants funded by the Korean government (MSIT) (Nos. 2022R1A2C4001313, 2020R1C1C1012288, 2020M3E5D9080792, and 2022R1A2C2093009).
Competing interests
The authors have no potential or actual conflicts of interest.
Ethical standards
The authors assert that all procedures contributing to this work complied with the ethical standards of the relevant national and institutional committees on human experimentation and the Declaration of Helsinki of 1975, as revised in 2008. This study was approved by the Institutional Review Board of Korea University Anam Hospital (protocol code: 2017AN0185 and date of approval: June 5, 2017).


