The most widely used measure of the quality of political science departments is the US News and World Report ranking. It is based on a survey sent to political science department heads and directors of graduate studies. Respondents are asked to rate other political science departments on a 1-to-5 scale; their responses are transformed into an average score for each department. The US News ranking represents a reasonable measure of the quality of political science departments as viewed by peer political scientists. However, a drawback of the measure is that there is no clear indication of why a department was ranked where it was. This article describes a number of measures of research productivity that I devised to assess a department’s strengths and weaknesses.
To generate the measures of research productivity, I collected data from Google Scholar, which is a natural source of data for measuring research productivity: it is relatively comprehensive in indexing journal articles, books, and working manuscripts. Because it is free to use, it is relatively easy to query results for a large number of authors (as compared to commercial services such as Scopus and Web of Science).
CONSTRUCTING THE MEASURES
In building these measures, I focused on political science departments ranked 45 or higher by US News and World Report in the 2017 rankings.Footnote 1 For each of the 47 departments in the sample, I assembled a list of faculty members. I considered research faculty listed on the department’s web page who were not retired and whose primary appointment was in the political science or equivalent department. Using this list, I queried Google Scholar using the name of the faculty member and the term “political science.” For each faculty member, I saved 20 pages of search results, from which I identified publications authored by that faculty member, the journal in which the publication appeared (if applicable), and the number of citations to that article or book.
I constructed four measures for each faculty member. First, I calculated the total number of citations. This can be viewed as a quality-adjusted measure of research productivity, in which quality is assessed by peer scholars. Second, I calculated the total number of citations to articles or books published during a recent 5-year period (i.e., between 2013 and 2017).Footnote 2 This allowed separate identification of recent research productivity. Third, I calculated the sum of the 5-year impact factors of the journals in which an author’s publications appeared. This is an alternative measure of quality-adjusted productivity that is arguably more directly under the control of individual faculty members.Footnote 3 Journal publications are blind to the identity of authors to a greater degree than citations. It is possible that individuals teaching at prestigious universities may have their articles or books cited simply because they teach at prestigious universities. A measure based on impact factors may be less sensitive to this.
The fourth measure was based on the number of top publications published by each faculty member. In political science, some journals are considered “top journals” and impact factors may not fully capture the degree to which they are viewed as particularly prestigious. There is no universal agreement about which journals are considered top journals. Scholars in American politics typically consider American Political Science Review (APSR), American Journal of Political Science, and Journal of Politics (JOP) as the top journals, with APSR considered to be particularly prestigious. Scholars in international relations and comparative politics may substitute International Organization or World Politics for JOP as a top journal. To make the measure as neutral to field as possible, my measure considered each of these five journals as top journals and double counted APSR publications.Footnote 4
Although I attempted to make the fourth measure as neutral as possible, it is arguably biased against departments with large political-theory groups; the results that follow should be interpreted accordingly. The measures based on impact factors and top publications arguably also are biased against any field or subfield in which books are considered especially important. A partial solution would be to generate a separate measure based on the presses in which books were published. Unfortunately, whereas Google Scholar reliably identifies the journal in which an article was published, it does not reliably identify the press that published a book. Therefore, I could not create a measure based on book presses unless I read the vitas of approximately 1,500 faculty members, many of which do not exist online.
VALIDATING THE MEASURES
To validate these measures, I compared my count of total citations for each faculty member to the count of citations in a faculty member’s Google Scholar page (for those who had one). In my preliminary checks, I found that these numbers were generally similar; however, four differences were apparent. Those individuals who had changed their name, had special punctuation in their name, had a very common name, and were prolific outside of the field of political science produced relatively large differences. In the first three cases, I identified individuals who met these criteria and manually checked and fixed the results when appropriate. In the fourth case, I did not correct the results because my goal was to measure productivity within political science. Therefore, the fact that a search that included the term “political science” missed some of these publications or citations was beneficial rather than problematic.
Figure 1 compares my measure of total citations to the number reported in the faculty member’s Google Scholar page. As shown in the figure, the relationship is very strong (i.e., the correlation is 98%), suggesting that my measure is accurate. The advantage of my measure is that it is available for all faculty members, whereas only a third of political science faculty have a Google Scholar account.
An interesting question is which departments have been increasing their research output. The results suggest that there is relatively little movement in the research output of scholars employed by particular departments over time.
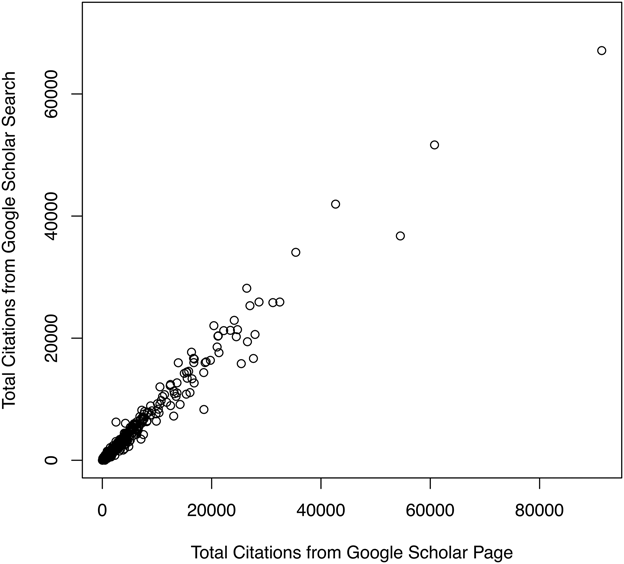
Figure 1 Google Scholar Page Citations versus Google Scholar Search Citations
MEASURES OF RESEARCH PRODUCTIVITY
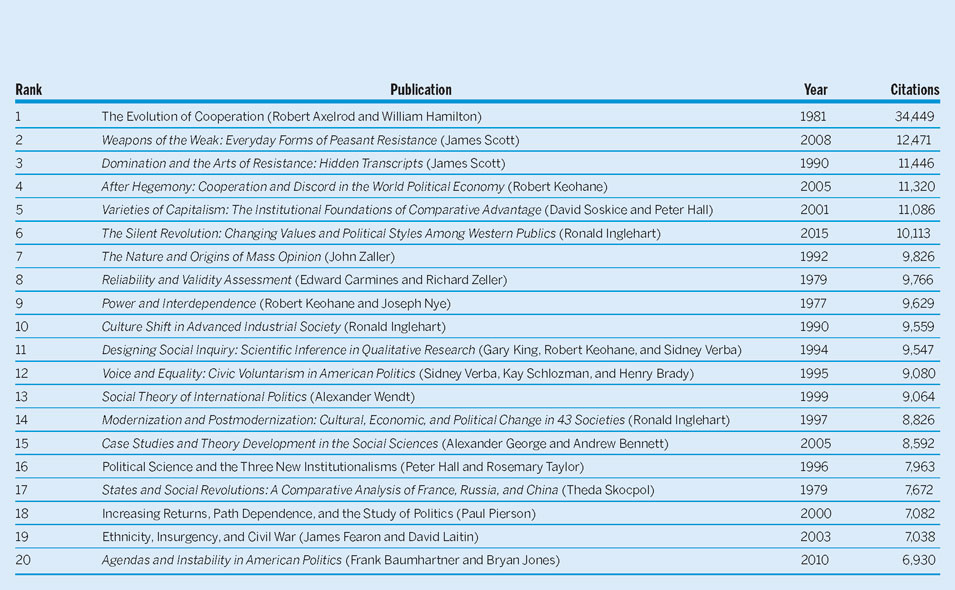
I used the estimates for individual faculty members to generate scores for the 47 departments considered. I computed department scores by summing and averaging the measures for faculty members in each department. Table 1 reports the results based on totals. Table 2 reports the results on a per-faculty basis. Table 3 lists the top 20 scholars according to the four measures. Table 4 lists the top 20 most-cited publications. The following comments describe interesting patterns found in the data:
• The department that varies the least between rankings is Columbia. The lowest it is ever ranked is 5, and it is ranked as the top department in terms of per-faculty recent citations, per-faculty impact, and per-faculty top publications.
• Other relatively stable departments include Harvard, Minnesota, UC–Irvine, and UCSD. Harvard’s rank ranges from 2 (in total citations and per-faculty citations) to 10 (in per-faculty impact). UCSD never fell below 17 (in total impact) and is ranked as high as 8 (in total and per-faculty recent citations). Minnesota’s rank varies from 29 to 38. UC–Irvine is never ranked above 35.
• UGA, UW, and Chicago vary the most in the rankings. UGA is ranked 5 in terms of recent citations per faculty and 44 in terms of total citations. UW is ranked 7 in terms of recent citations per faculty and 45 in terms of total and per-faculty top publications. Chicago is ranked 10 in terms of recent citations and 46 in terms of impact per faculty.
• In terms of recent citations, 11 of the top scholars attained their place primarily based on a reissued book, and four attained their place primarily based on a textbook. Only Gary King, James Fowler, Jens Hainmueller, Margaret Roberts, and Dustin Tingley attained their place through new scholarly work.
• The list of most-cited scholars is dominated by theorists. The list of scholars with the highest summed impact factors and the highest number of top publications is dominated by Americanists.
• The list of most-cited scholars is overwhelmingly populated by scholars from the very top universities. For the list of top scholars based on impact and top publications, this is somewhat less true.
• The most-cited publications are overwhelmingly books rather than journal articles.
• The list of most-cited publications is dominated by theory and comparative politics.
Table 1 Top Departments by Total Research Output
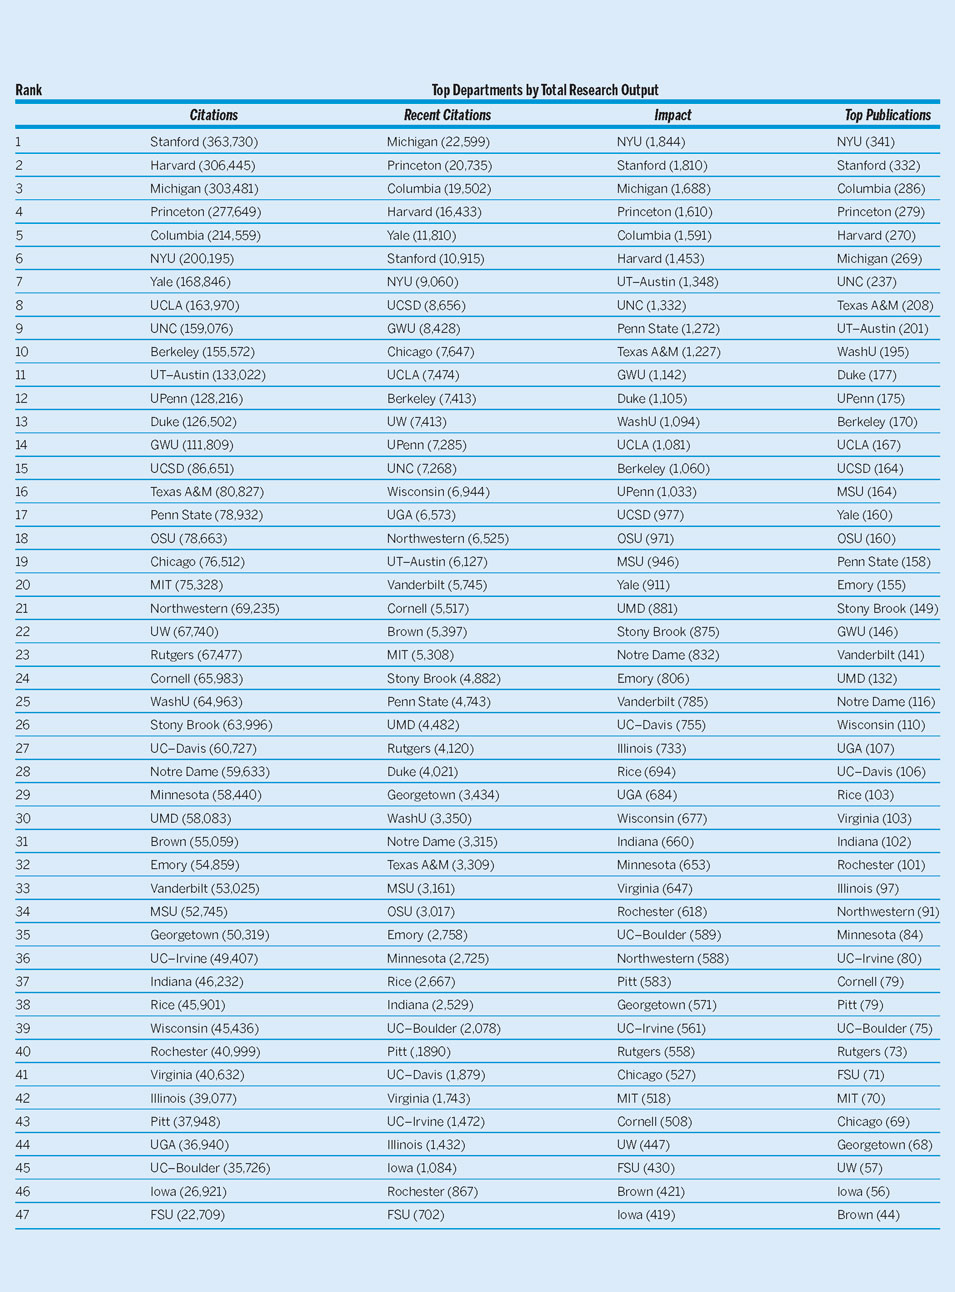
Departments are ranked by four measures of research output. Citations is the total citations to work published by faculty. Recent Citations is the total citations to work published by faculty between 2013 and 2017. Impact is the sum of the impact factors for articles published by faculty. Top Publications is the number of top publications by faculty, with APSR counting as two points.
Table 2 Top Departments by Per-Faculty Research Output
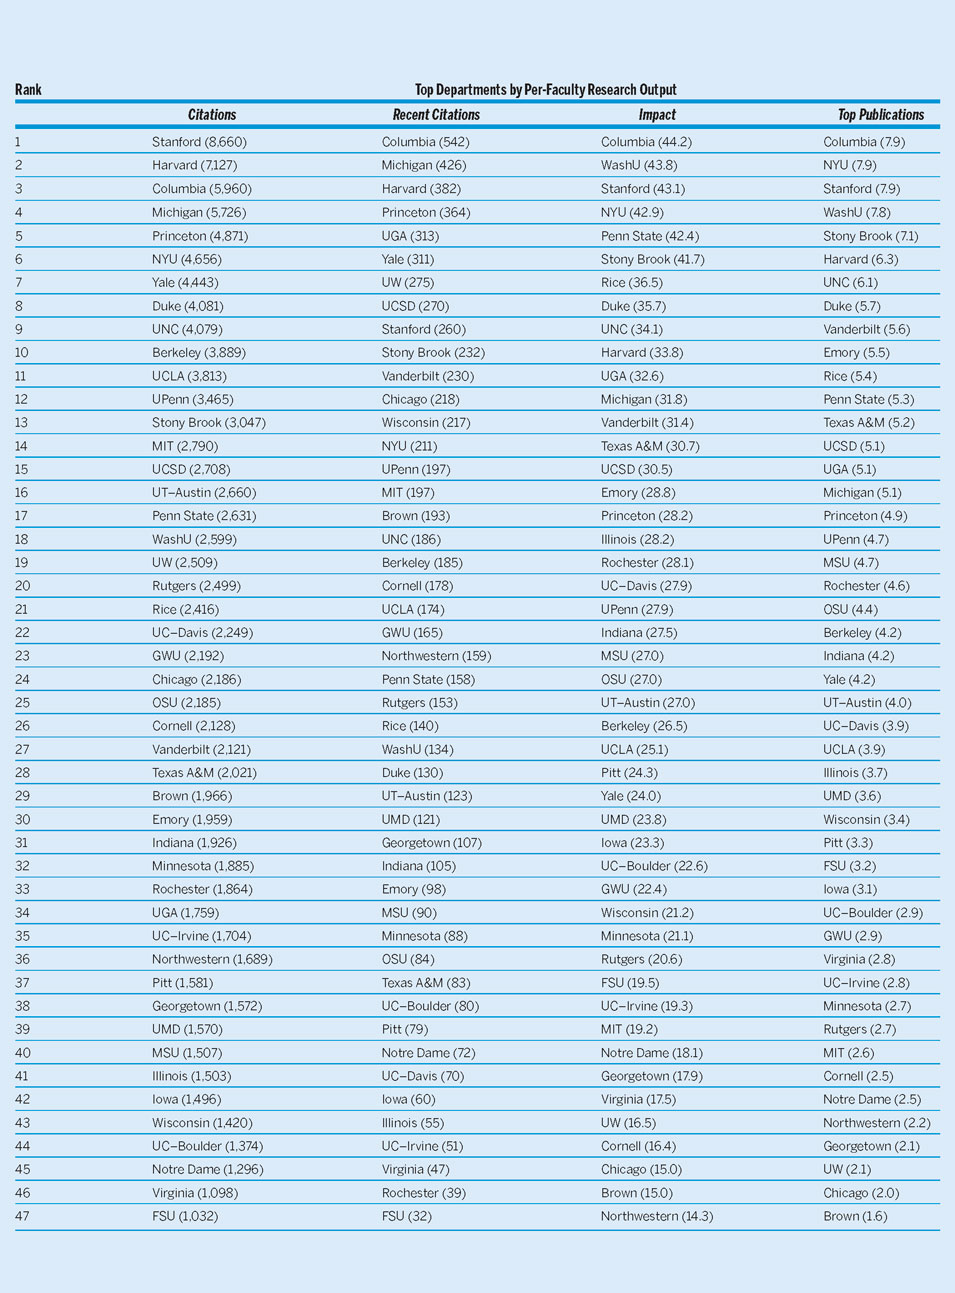
Departments are ranked by four measures of per-faculty research output. Citations is the average citations to work published by faculty. Recent Citations is the average citations to work published by faculty between 2013 and 2017. Impact is the average of the sum of the impact factors for articles published by faculty. Top Publications is the average number of top publications by faculty, with APSR counting as two points.
Table 3 Top Scholars by Research Output
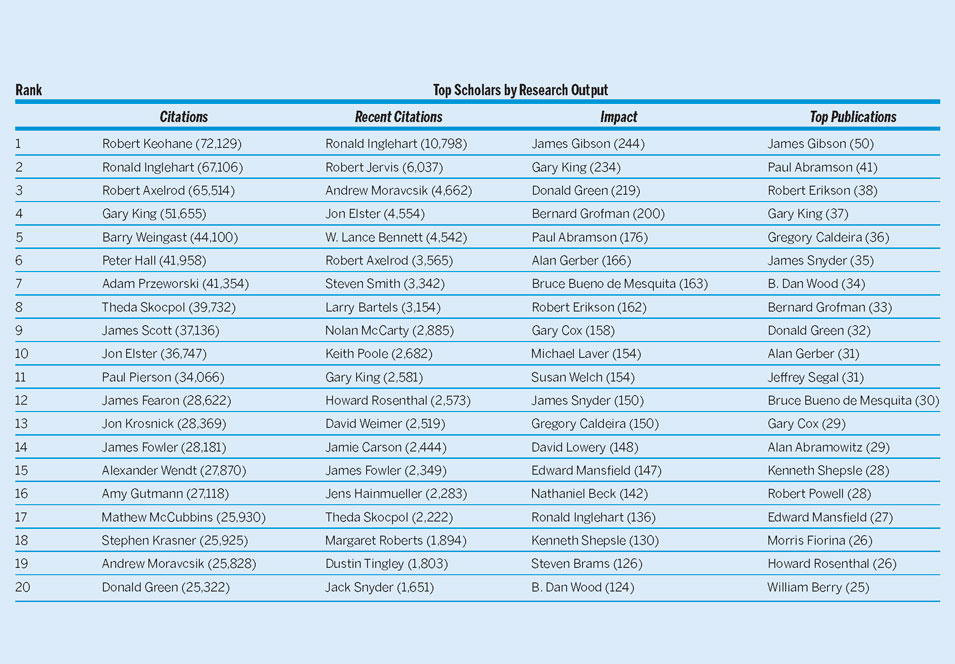
Scholars are ranked by research output. Citations is the total citations to work published by the scholar. Recent Citations is the total citations to work published by the scholar between 2013 and 2017. Impact is the sum of the impact factors for articles published by the scholar. Top Publlications is the number of top publications published by the scholar, with APSR counting as two points.
Table 4 Most Cited Publications (titles in italics indicate books)
DISCUSSION
An interesting question is which departments have been increasing their research output. The results suggest that there is relatively little movement in the research output of scholars employed by particular departments over time. The correlation between total citations and recent citations is 84% across departments. The largest mover is UGA, but even this movement may be illusory—more than half of the department’s recent citations are from two reissued books. This does not necessarily mean that the research productivity of departments has been stable over time; whereas the relative research productivity of individual scholars appears stable over time, the research productivity of a department may evolve due to personnel changes.
A second interesting question relates to the difference between total and per-faculty research output. Because departments vary greatly in size, there is a high positive correlation between the quality of a department and its size.Footnote 5 As a consequence, the correlation between total and per-faculty citations is 95%. A few exceptionally small departments move significantly: Rice, Stony Brook, UGA, and WashU are all ranked considerably higher in per-faculty research output; however, most departments do not move much.
The most interesting differences in rankings appear when comparing citations to impact and top publications. Chicago, Cornell, Northwestern, UW, and Yale are ranked considerably higher based on citations. MSU, Stony Brook, Texas A&M, and WashU are ranked significantly higher based on impact and top publications. It is fairly easy to correlate these differences with characteristics of these departments—that is, departments with significant theory groups and significant numbers of qualitative scholars do better based on citation rankings. Departments with large numbers of Americanists and quantitative scholars do better based on impact and top publications. Determining which of these measures is the most appropriate inherently entails a value judgment and is not neutral to the expectations of the different fields of political science.


