There is some debate as to whether resting metabolic rate (RMR) fluctuates during different phases of the menstrual cycle as a result of changes in estradiol and progesterone concentrations(Reference Solomon, Kurzer and Calloway1, Reference Meijer, Westerterp and Saris2). One reason for this could be the failure to establish accurate menstrual phase definition through biochemical analysis of hormone concentrations. The aim of this study was to investigate RMR at three set time points during the menstrual cycle.
Venous blood samples for baseline measurements of estradiol and progesterone were collected every other week day from eight naturally cycling women for one complete menstrual cycle; age 28 (sd 3) years, weight 62.04 (sd 9.75) kg and height 1.69 (sd 0.09) m. Indirect calorimetry using a ventilated hood system (Deltatrac, Datex Instrumentarium Corp., Helsinki, Finland) to calculate RMR was performed on three test sessions during one complete menstrual cycle. In the 24 h period prior to each RMR measurement participants replicated their diet and avoided exercise, caffeine and alcohol.
Venous blood samples were taken before each test session to confirm estradiol and progesterone levels. Participants were supine for 30 min to allow initial stabilisation and acclimatisation to the canopy and instrument noise. Respiratory gas exchange data were then collected for a further 30 min and an average RMR was calculated. Data are presented as means (sd). Variables were analysed using one-way repeated measures ANOVA. Significance was accepted at the P<0.05 level.

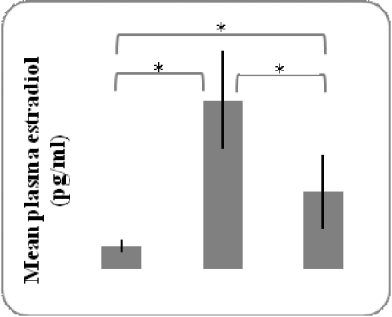
Fig. 1. Plasma estradiol concentration.

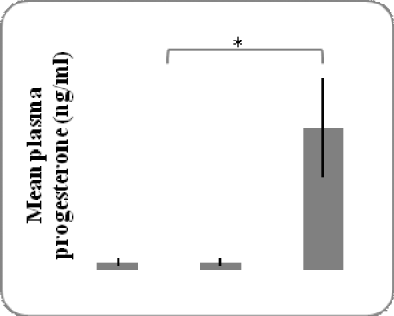
Fig. 2. Plasma progesterone concentration.

Fig. 3. RMR.
*Significant difference between test sessions. M, menstruation; F, follicular; L, luteal.
Hormone concentrations differed significantly during one complete menstrual cycle (estradiol and progesterone; Figs. 1 and 2, respectively); however, there was no significant difference in RMR between the three test sessions (Fig. 3). This suggests that fluctuations in estradiol and progesterone during the menstrual cycle may not influence RMR. If this is the case the results confirm previous research that suggests RMR can be considered as a stable tool for estimating energy requirement in women(Reference Soares, Piers and Kraai3).


