1 Introduction
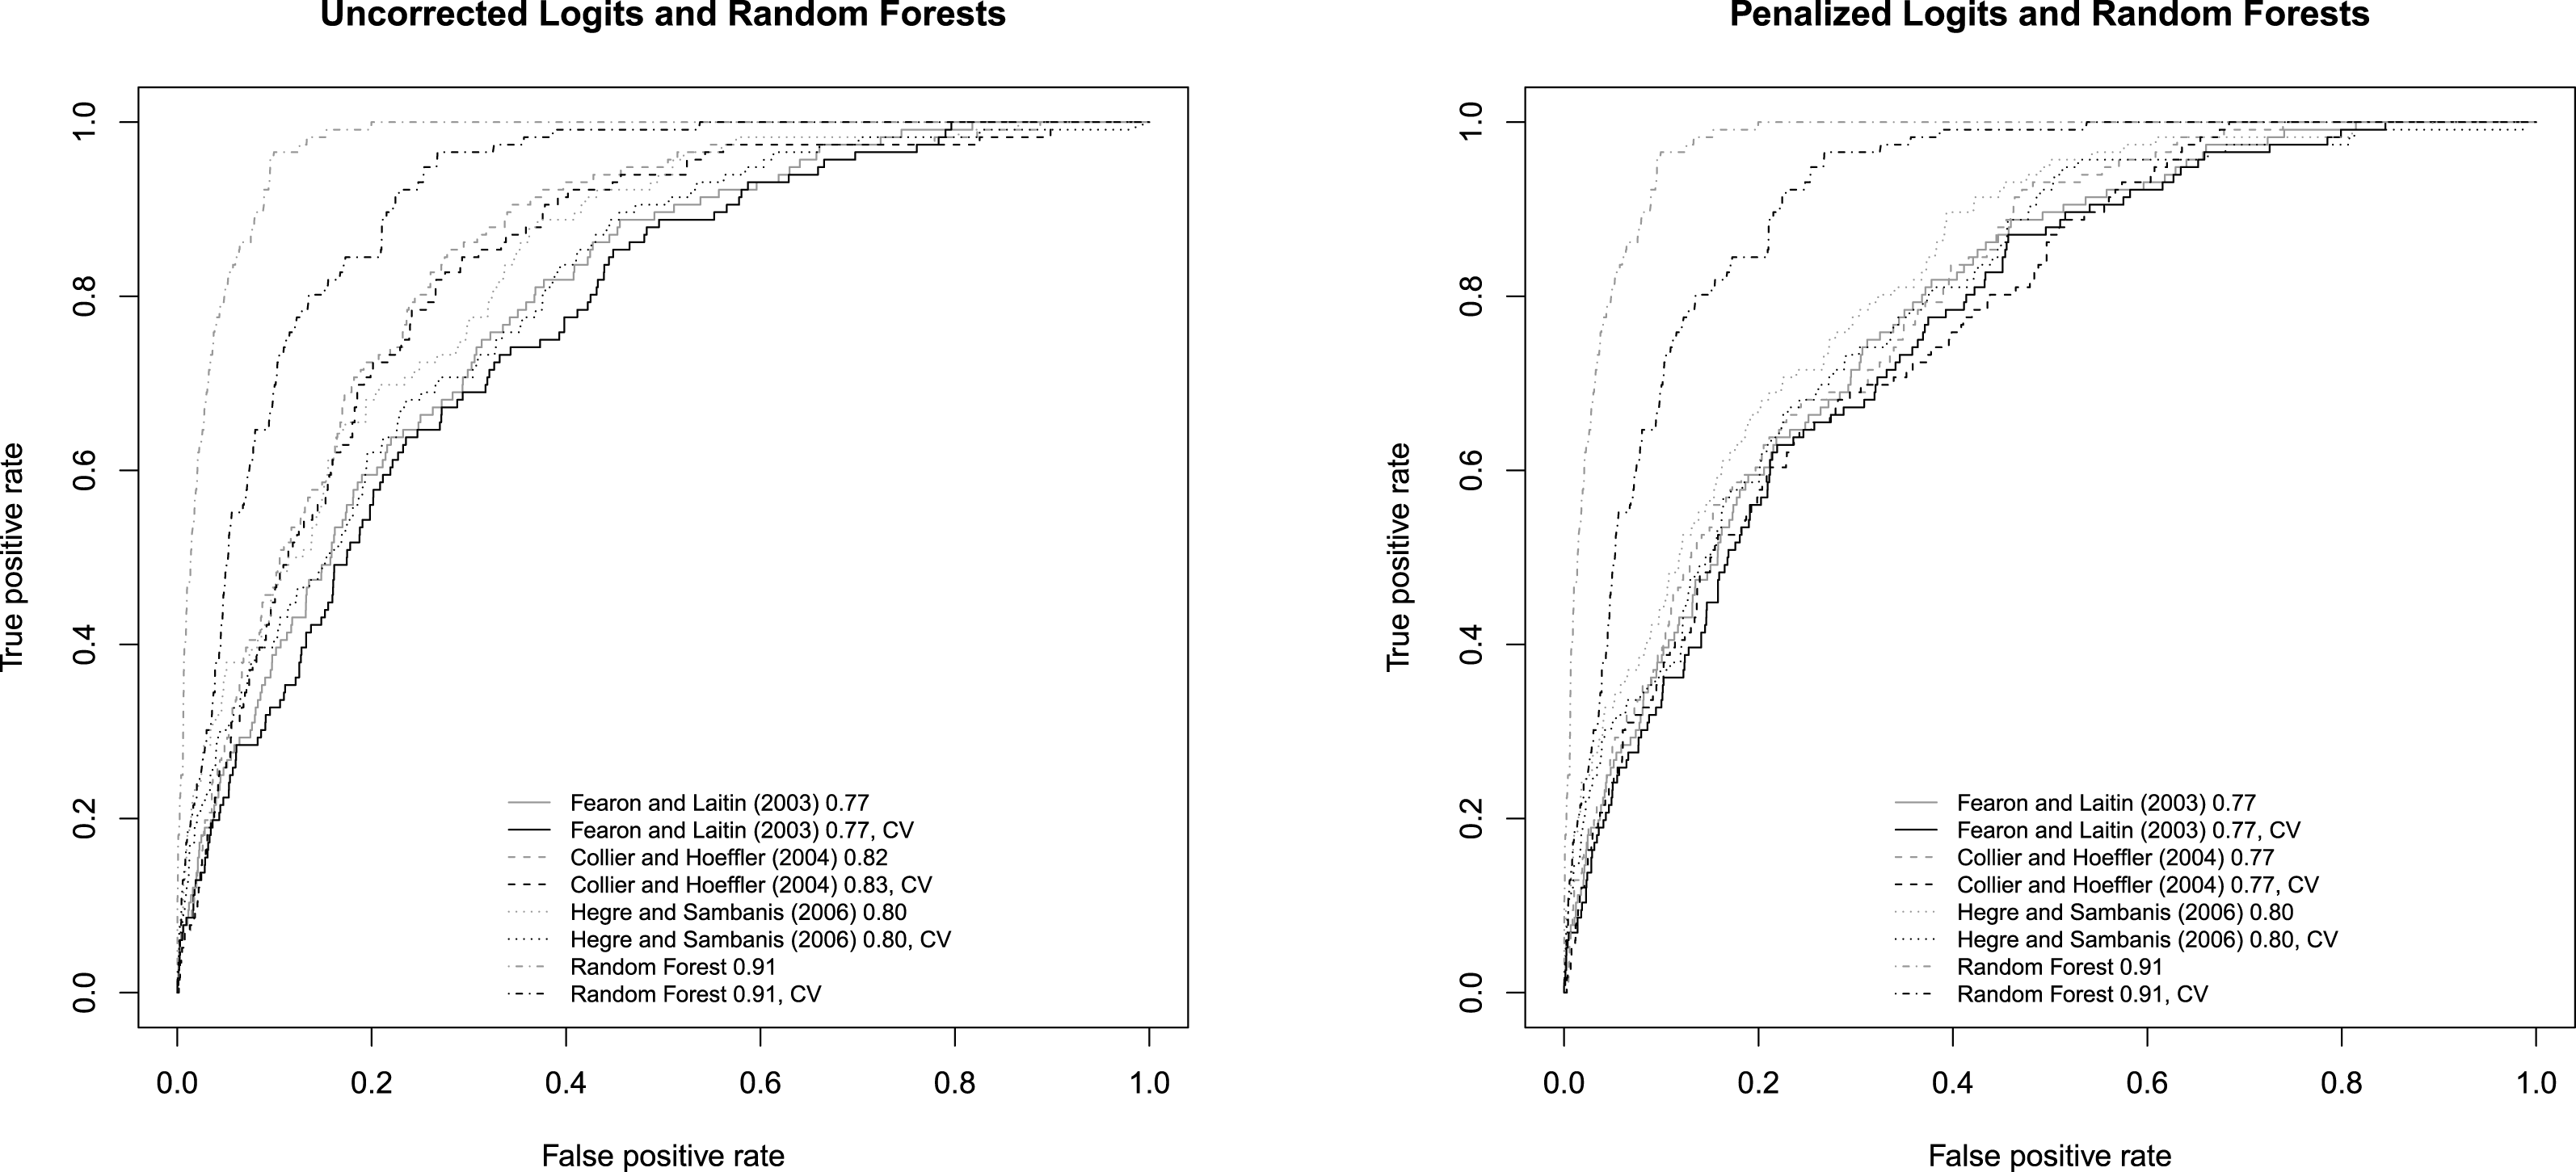
In an interesting and provocative paper, Muchlinski et al. (Reference Muchlinski, Siroky, He and Kocher2016) make an important contribution by emphasizing the significance of predictive accuracy and empirically training a highly accurate random forest model. With an area under the curve (AUC) of 0.91, their random forest model outperforms by a large margin three leading logistic regression models: Fearon and Laitin (Reference Fearon and Laitin2003) with an AUC of 0.77, Collier and Hoeffler (Reference Collier and Hoeffler2004) with an AUC of 0.82, and Hegre and Sambanis (Reference Hegre and Sambanis2006) with an AUC of 0.80. The improvement is dramatic, and the paper has quickly established itself in the machine learning/prediction-inclined community in our discipline (Cederman and Weidmann Reference Cederman and Weidmann2017; Cranmer and Desmarais Reference Cranmer and Desmarais2017).
Muchlinski et al. (Reference Muchlinski, Siroky, He and Kocher2016) have emphasized in their paper the importance of cross validation in evaluating their model’s predictive accuracy and applied tenfold cross validation throughout to tune the parameters. When evaluating the performance of their model, however, the authors have veered away from this approach and used models trained with the whole dataset instead. This leads to several incorrect presentations and interpretations of their results. In this comment, I point out and correct this error with respect to cross validation. I also report better prediction results using AdaBoosted trees and gradient boosted trees.
2 Spot the Error
One way to quickly spot the error is to notice that while the reported AUC of random forest is 0.91 based on cross validation, the area under the dot–dash curve is substantially larger than 0.91 (Figure 1). For the purpose of comparison, I have added a dashed rectangle with a height of 1, a width of 0.9 (from
![]() $x=0.1$
to
$x=0.1$
to
![]() $x=1$
), and an area of 0.9. The real AUC as presented in Figure 2 in the original article is 0.97 rather than 0.91, and the model is trained with the entirety of the dataset.Footnote
1
$x=1$
), and an area of 0.9. The real AUC as presented in Figure 2 in the original article is 0.97 rather than 0.91, and the model is trained with the entirety of the dataset.Footnote
1

Figure 1. One way to spot the error is to visually inspect the receiver operating characteristic (ROC) plot. The dashed bounding box has an area of 0.9. The AUC of the random forest’s ROC curve is supposed to be 0.91, suggesting that the curve is not presented correctly.
To be sure, Muchlinski et al. (Reference Muchlinski, Siroky, He and Kocher2016) have used cross validation to tune the parameters such as the number of variables to randomly sample as candidates for each split when constructing each tree. Once the parameters are selected, however, the authors trained the random forest model using the whole dataset. As the model is then used to predict samples that it has seen during the training process, it is no surprise that an AUC of 0.97 obtained this way is higher than 0.91 based on cross validation. The same error has affected the receiver operating characteristic (ROC) curves and the separation plots for all the classifiers.
3 Correct the Error
In this section, I redraw the ROC curves and the separation plots and revise accordingly some of the interpretations made in Muchlinski et al. (Reference Muchlinski, Siroky, He and Kocher2016). In Figure 2, I plot the ROC curves using the cross-validated models. To make the contrast clear, I use dark curves to mark the performances of the cross-validated models and gray curves, as in the original article, to mark the “predictive” performance of the models trained with all the samples. It can be observed that compared with the corresponding gray curves, all the dark curves have shifted toward the lower right corner.Footnote 2
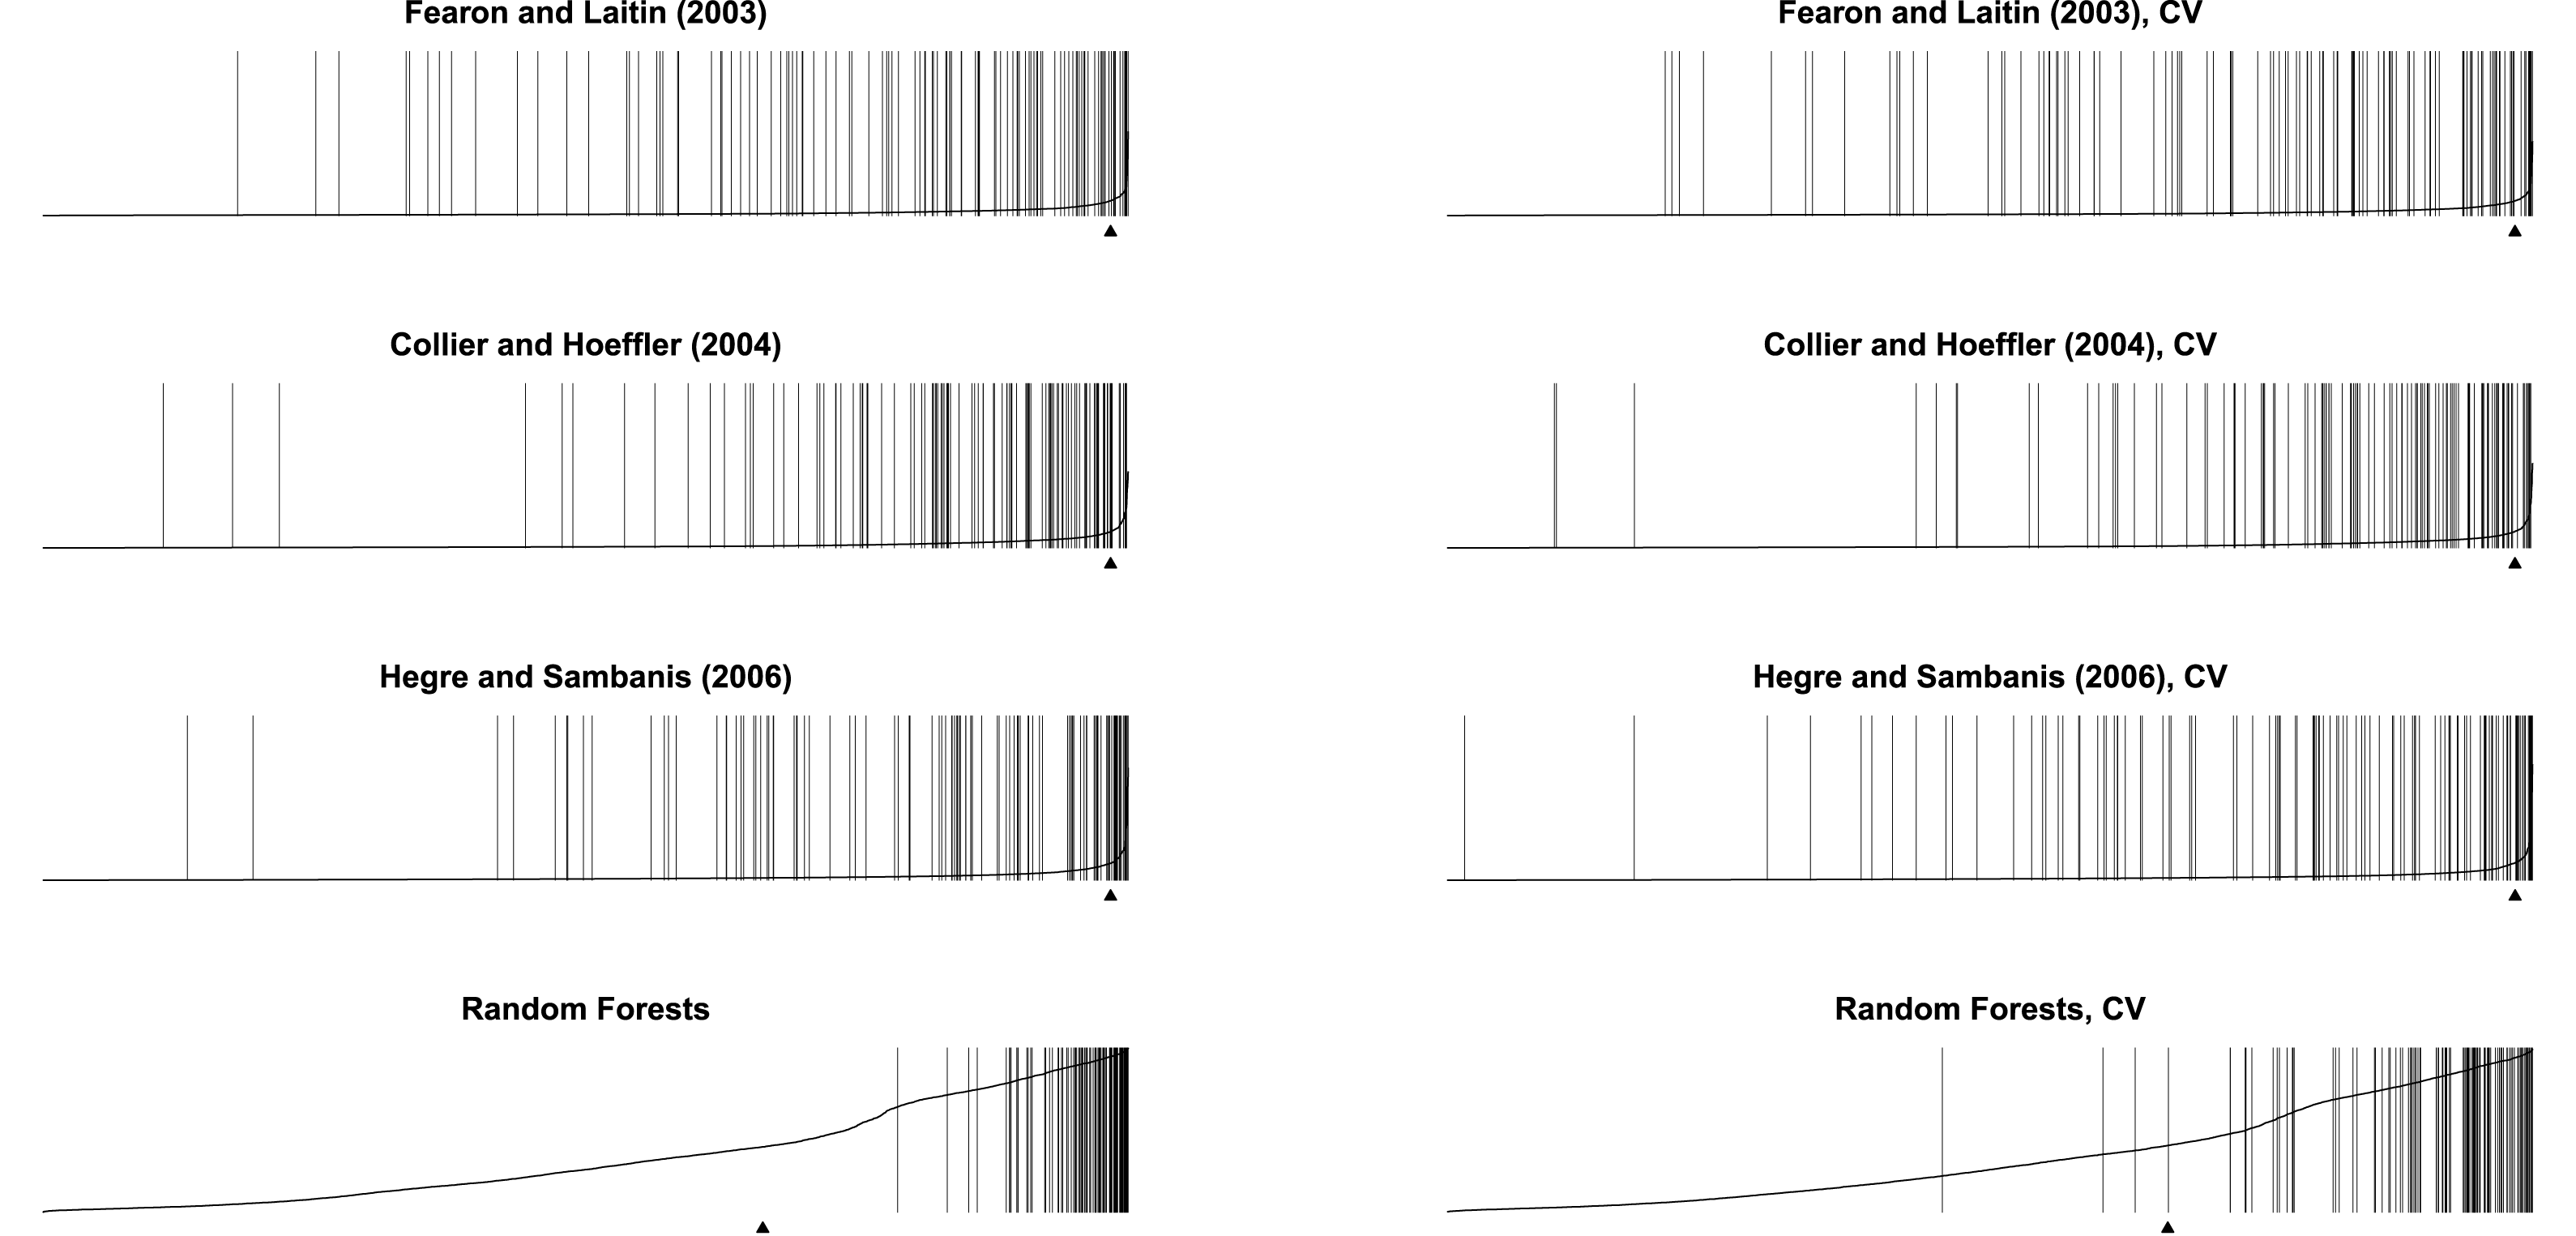
In a similar vein, I redraw the separation plots for all the classifiers using cross validation. In Figure 3, for each model, I pair the original result on the left with the cross-validated result on the right. It can be observed that compared with models trained with the entirety of the dataset, the cross-validated models tend to miss more conflicts. Muchlinski et al. (Reference Muchlinski, Siroky, He and Kocher2016) claim “there is only white on the left-hand side of the plot” and that “all gray” is “on the right-hand side of the plot, indicating that Random Forests accurately predicts nearly every onset of civil war in the data.” The cross-validated model suggests, however, random forest actually missed a substantial number of conflicts.

Figure 2. The dark curves are plotted using cross validation. The gray ones are from the original paper and are plotted using models trained with the entirety of the dataset.

Figure 3. When evaluated using cross validation rather than the entire dataset, all classifiers perform worse, but particularly so for the random forest model.
Note that the random forest model tends to predict a high probability of war. The dataset has 7,140 observations and 116 of these have civil war onsets. This means 1.6% of the observations have civil war onsets. However, the mean predicted probability of civil war onset by the random forest model with cross validation, marked by the small triangle in Figure 3 (Greenhill, Ward, and Sacks Reference Greenhill, Ward and Sacks2011), is 33.6%, which is substantially higher than what the dataset would suggest.Footnote 3
4 Better Predictions
Although the improvement from logistic models (AUC: 0.82) to random forest (AUC: 0.91) remains dramatic, I show that further improvement can be achieved by training AdaBoosted trees and gradient boosted trees (Hastie, Tibshirani, and Friedman Reference Hastie, Tibshirani and Friedman2013), which build trees adaptively in a sequential manner rather than averaging trees that are grown independently as in random forest. With 50 trees of maximum depth 2, AdaBoosted trees can achieve an AUC of 0.94. With 150 trees of maximum depth 1, gradient boosted trees achieve an AUC of 0.94 (Figure 4).Footnote 4

Figure 4. For almost all false positive rates, the AdaBoost model and the gradient boosted trees achieve a higher true positive rate than the random forest model.
5 Conclusion
Muchlinski et al. (Reference Muchlinski, Siroky, He and Kocher2016) have made a significant contribution to the study of modeling civil war onset by introducing and demonstrating the effectiveness of random forest in rare event modeling and by dramatically improving the prediction accuracy of civil war onset. This comment has made some revisions to their published results with respect to cross validation, in which I redrew the ROC curves and the separation plots and demonstrated that despite the superior performance of random forest, the model still makes several type II errors. This comment has also introduced AdaBoosted trees and gradient boosted trees, which outperform the current random forest model.
Supplementary materials
For supplementary materials accompanying this paper, please visit https://doi.org/10.1017/pan.2018.40.


