Hostname: page-component-7bb8b95d7b-w7rtg Total loading time: 0 Render date: 2024-10-01T08:45:05.979Z Has data issue: false hasContentIssue false

Evaluation of indigenous and exotic soybean accessions for yield, resistance to frog-eye leaf spot and yellow mosaic virus diseases

Published online by Cambridge University Press:  15 December 2023

Anuradha Bhartiya*
Affiliation:
ICAR-Vivekananda Parvatiya Krishi Anusandhan Sansthan, Almora, Uttarakhand, India
Vangala Rajesh
Affiliation:
ICAR-Indian Institute of Soybean Research, Indore, M.P., India
J. P. Aditya
Affiliation:
ICAR-Vivekananda Parvatiya Krishi Anusandhan Sansthan, Almora, Uttarakhand, India
Jeevan B.
Affiliation:
ICAR-Vivekananda Parvatiya Krishi Anusandhan Sansthan, Almora, Uttarakhand, India
Sanjay Gupta
Affiliation:
ICAR-Indian Institute of Soybean Research, Indore, M.P., India
Lakshmi Kant
Affiliation:
ICAR-Vivekananda Parvatiya Krishi Anusandhan Sansthan, Almora, Uttarakhand, India
Hemlata Joshi
Affiliation:
ICAR-Vivekananda Parvatiya Krishi Anusandhan Sansthan, Almora, Uttarakhand, India
S. P. Mehtre
Affiliation:
Vasantrao Naik Marathwada Agricultural University (VNMKV), Parbhani, Maharashtra, India
H. N. Devi
Affiliation:
Central Agricultural University (CAU), Imphal, Manipur, India
S. Jaybhay
Affiliation:
Agharkar Research Institute (ARI), Pune, Maharashtra, India
M. K. Karnwal
Affiliation:
G.B. Pant University of Agriculture and Technology (GBPUA&T), Pantnagar, U.S. Nagar, Uttarakhand, India
Vennampally Nataraj
Affiliation:
ICAR-Indian Institute of Soybean Research, Indore, M.P., India
Nita Khandekar
Affiliation:
ICAR-Indian Institute of Soybean Research, Indore, M.P., India
*
Corresponding author: Anuradha Bhartiya; Email: [email protected]; [email protected]
Rights & Permissions [Opens in a new window]

Abstract

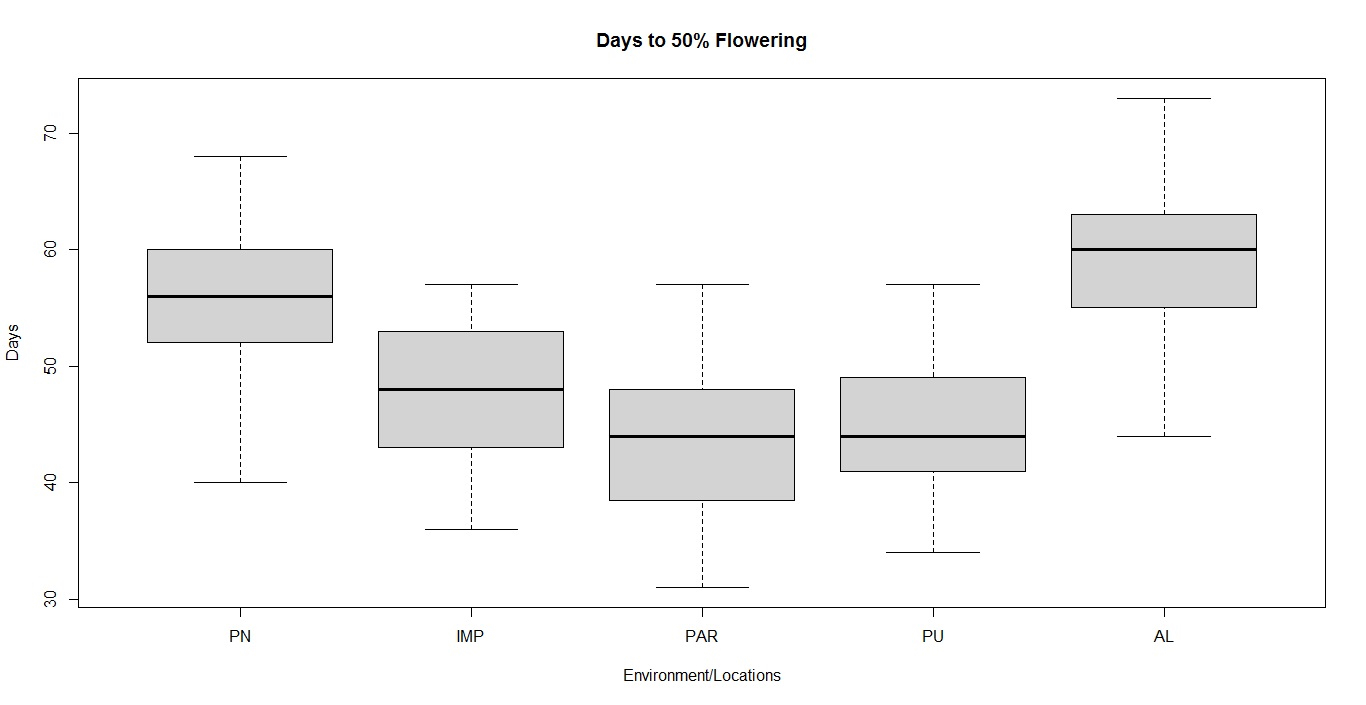
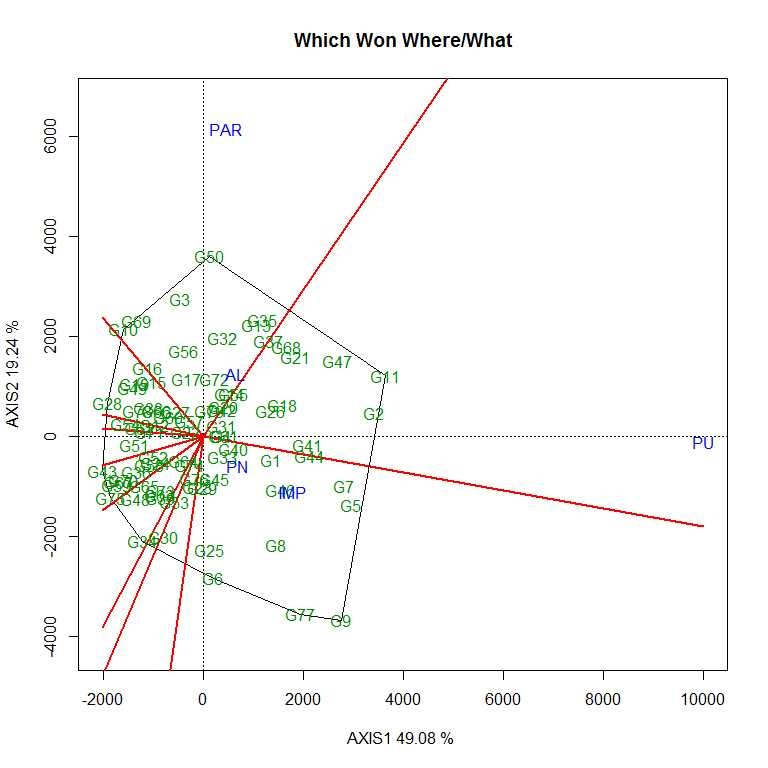
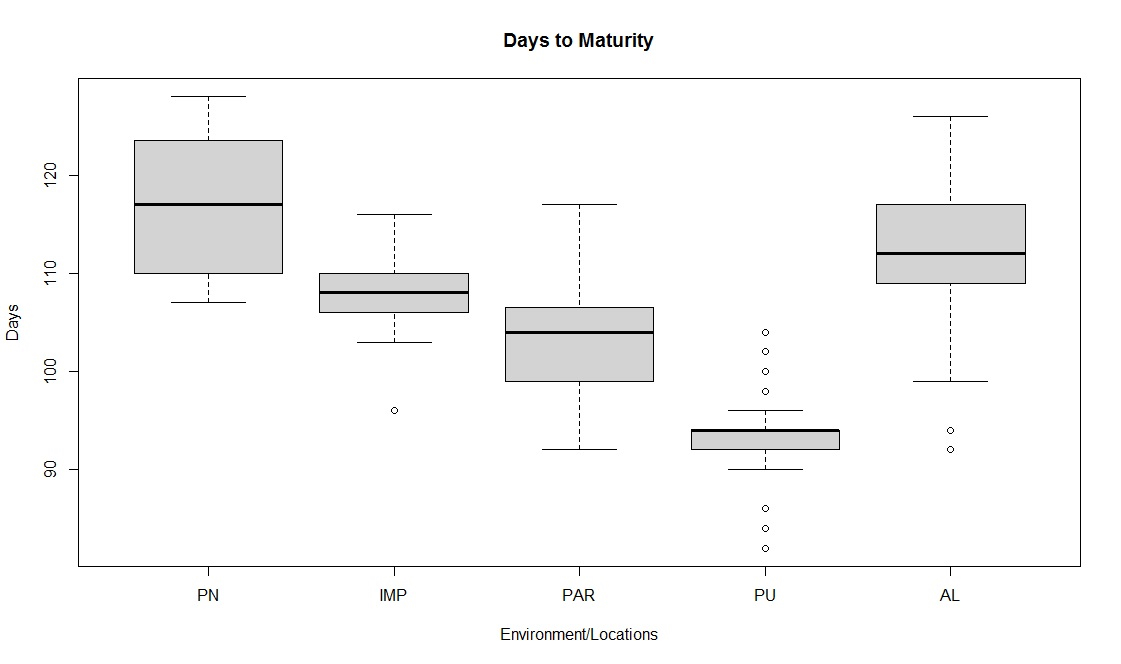
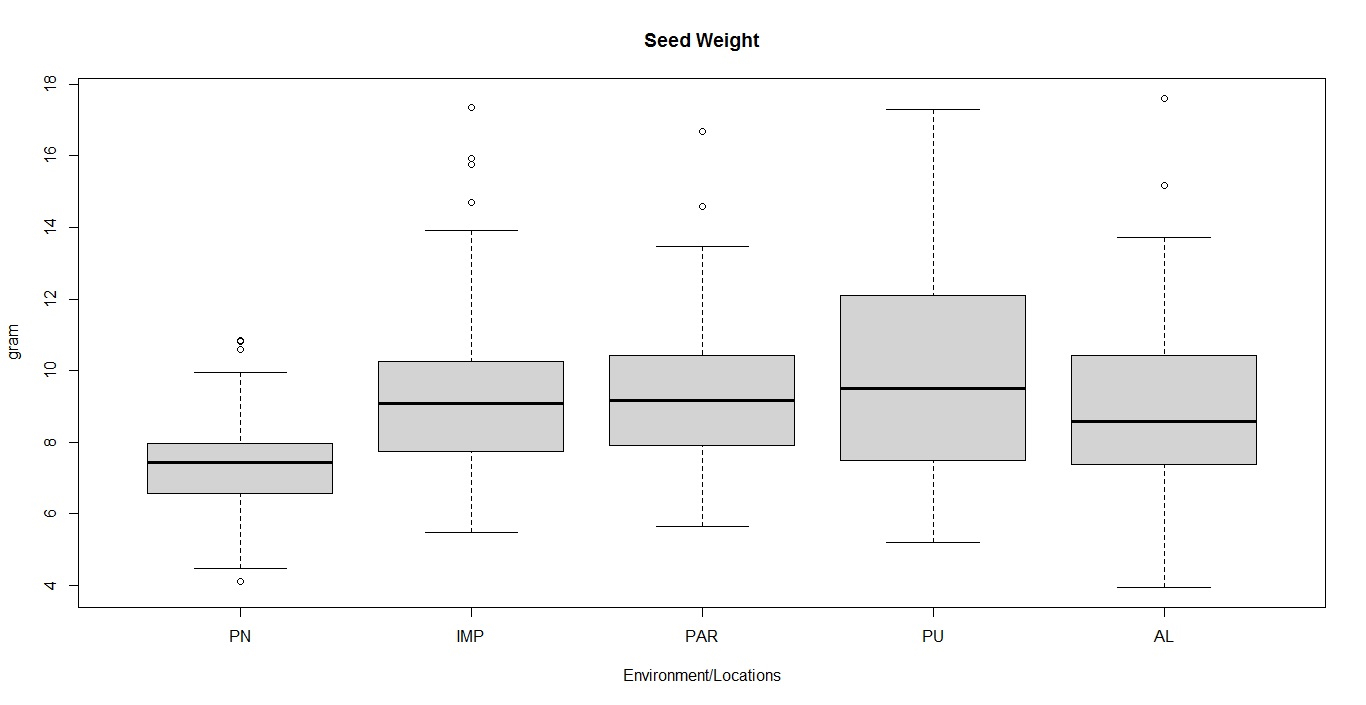
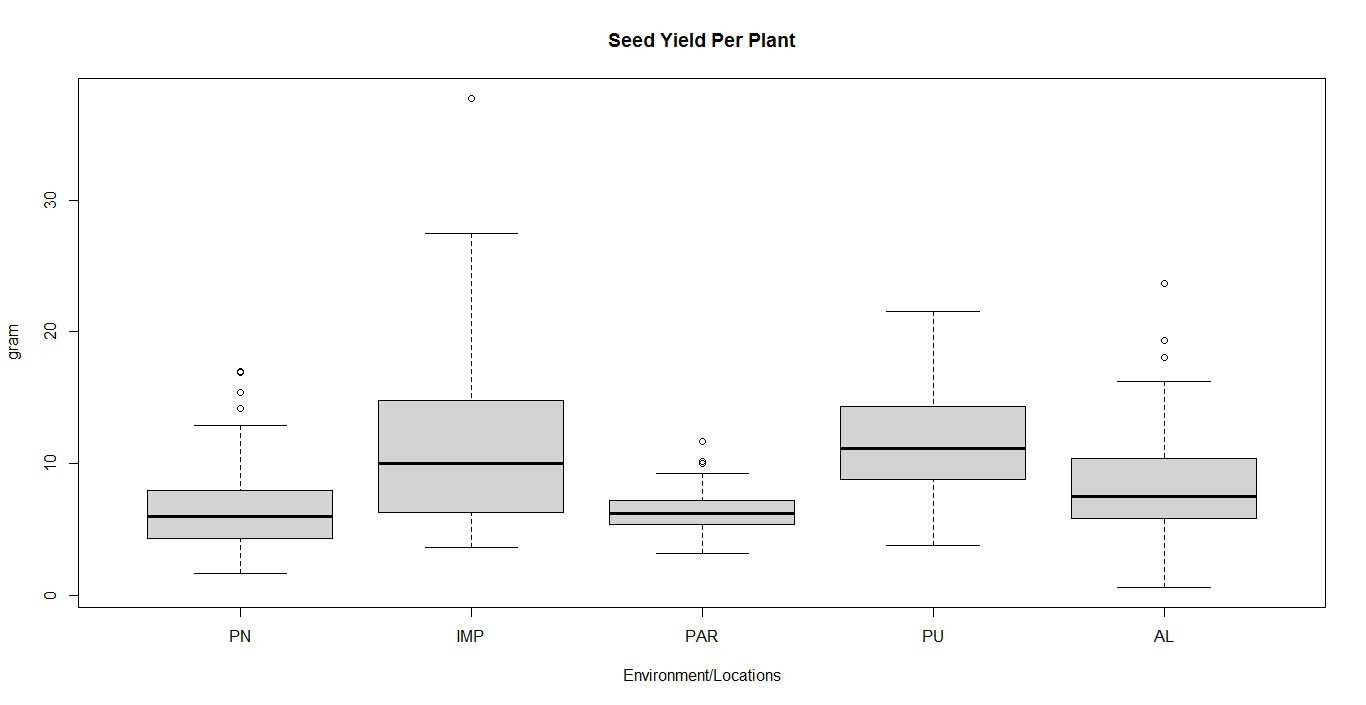
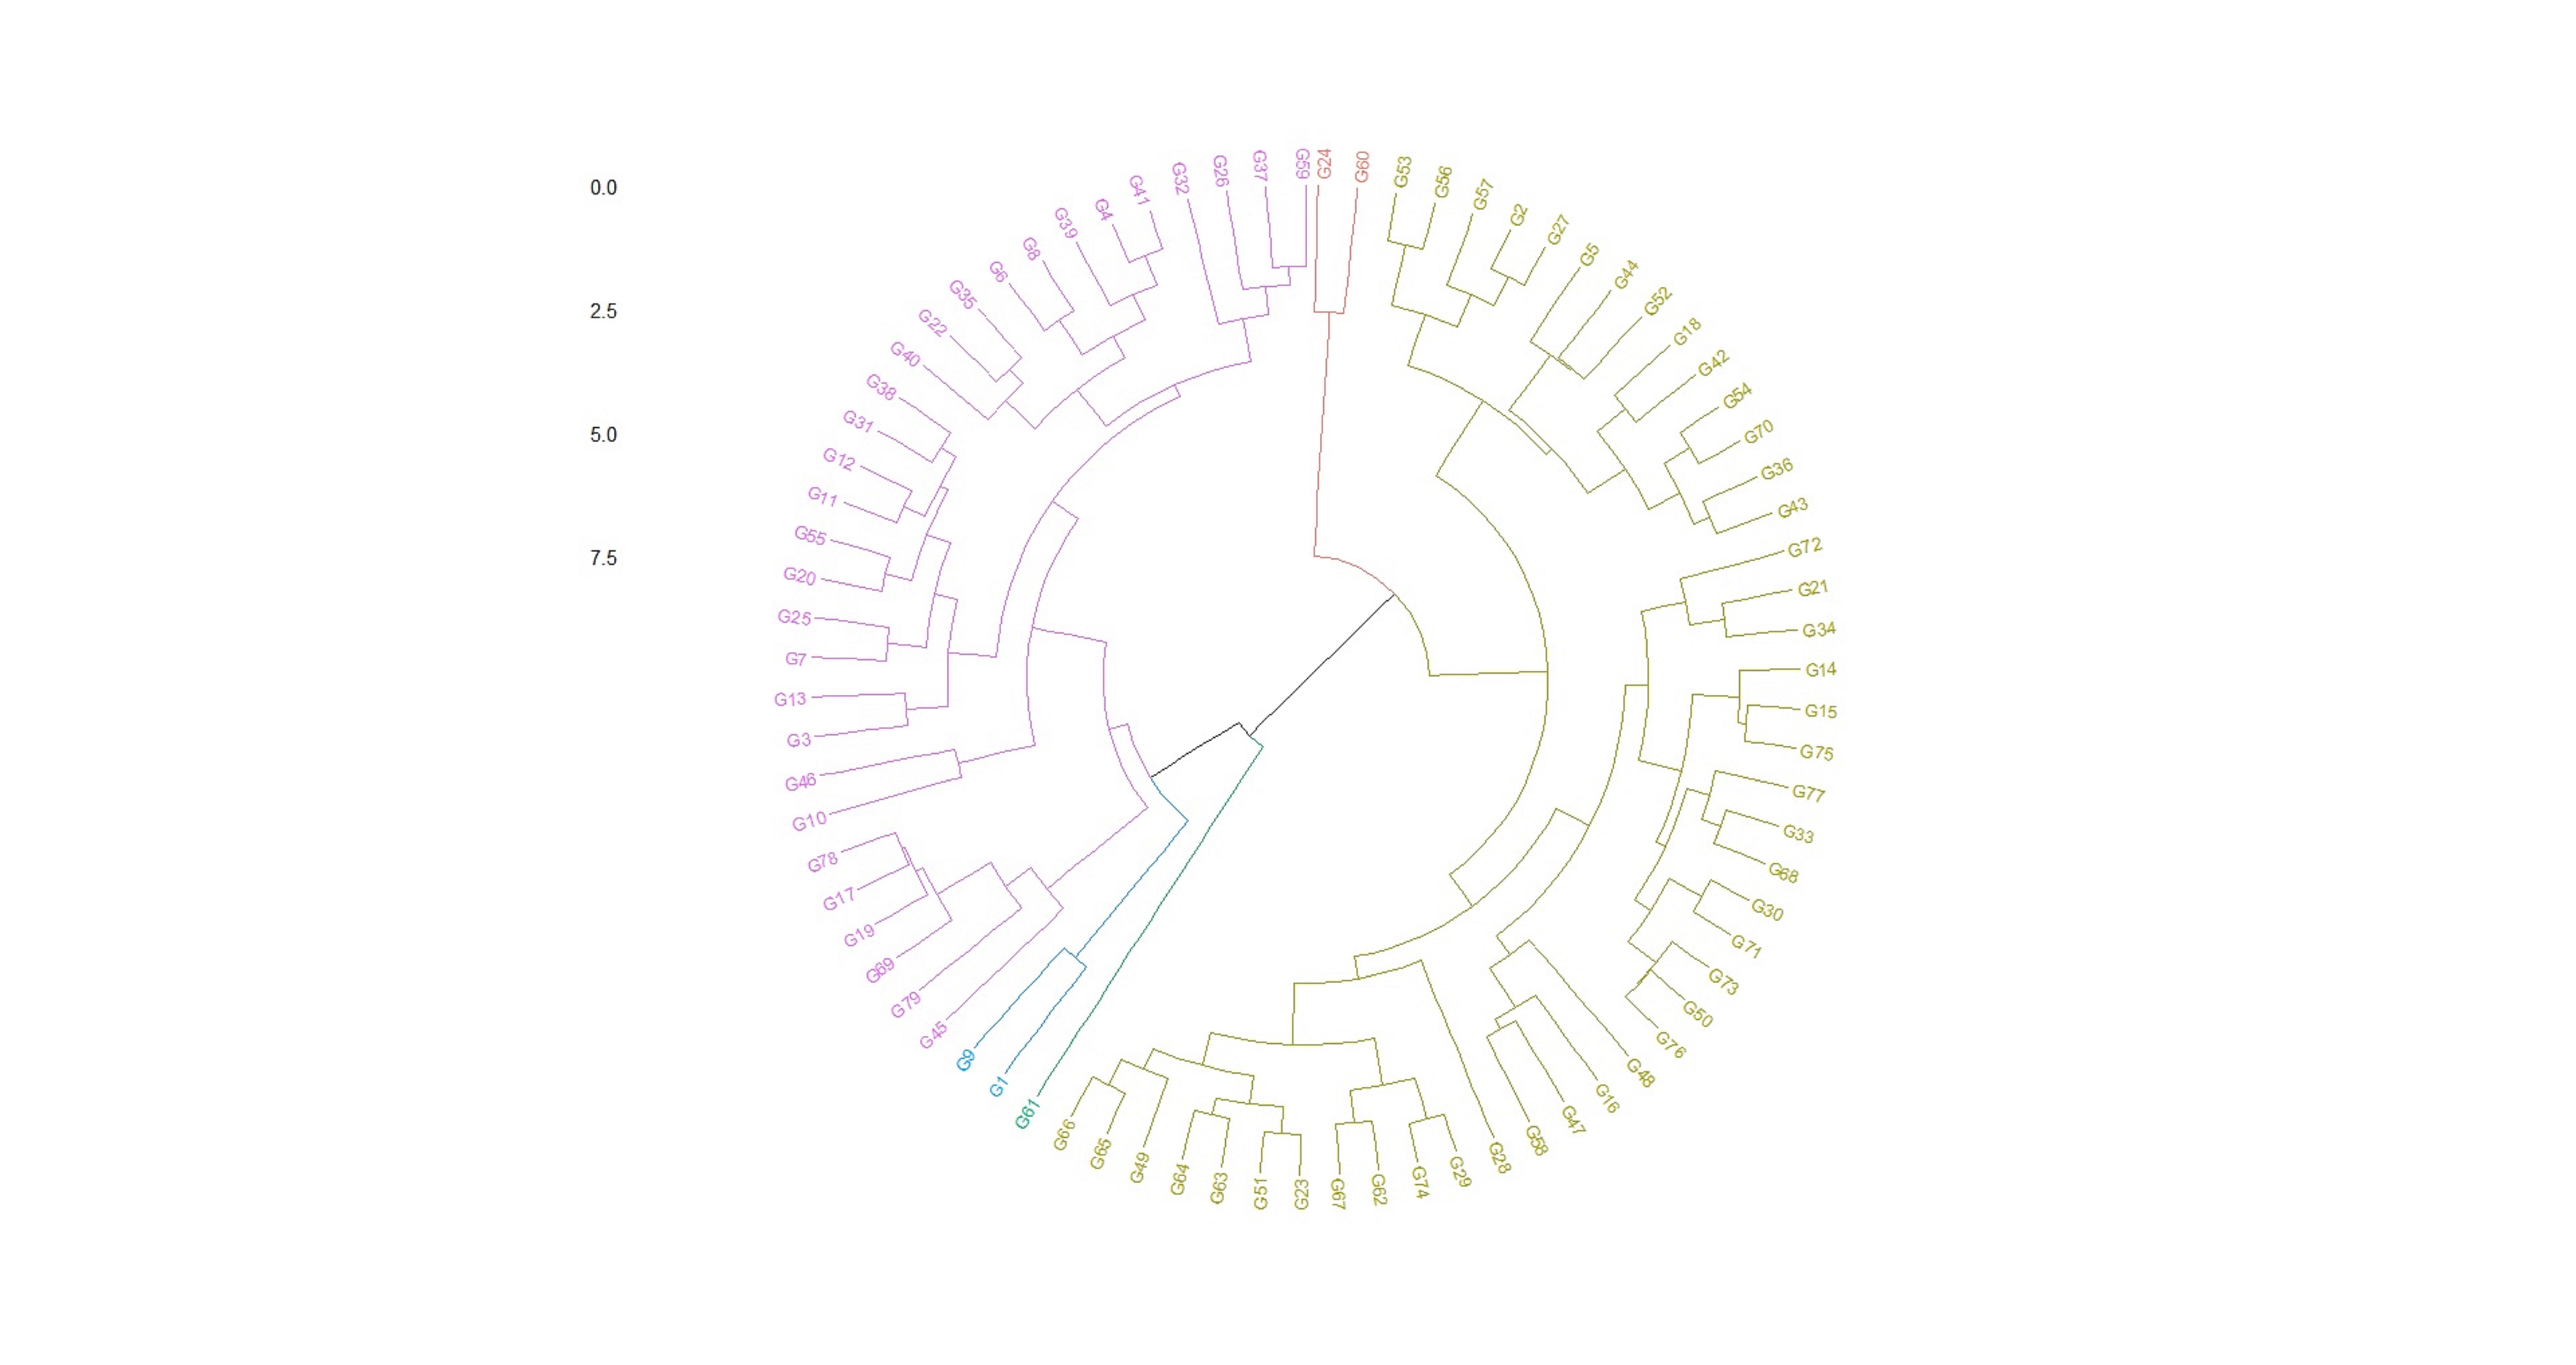
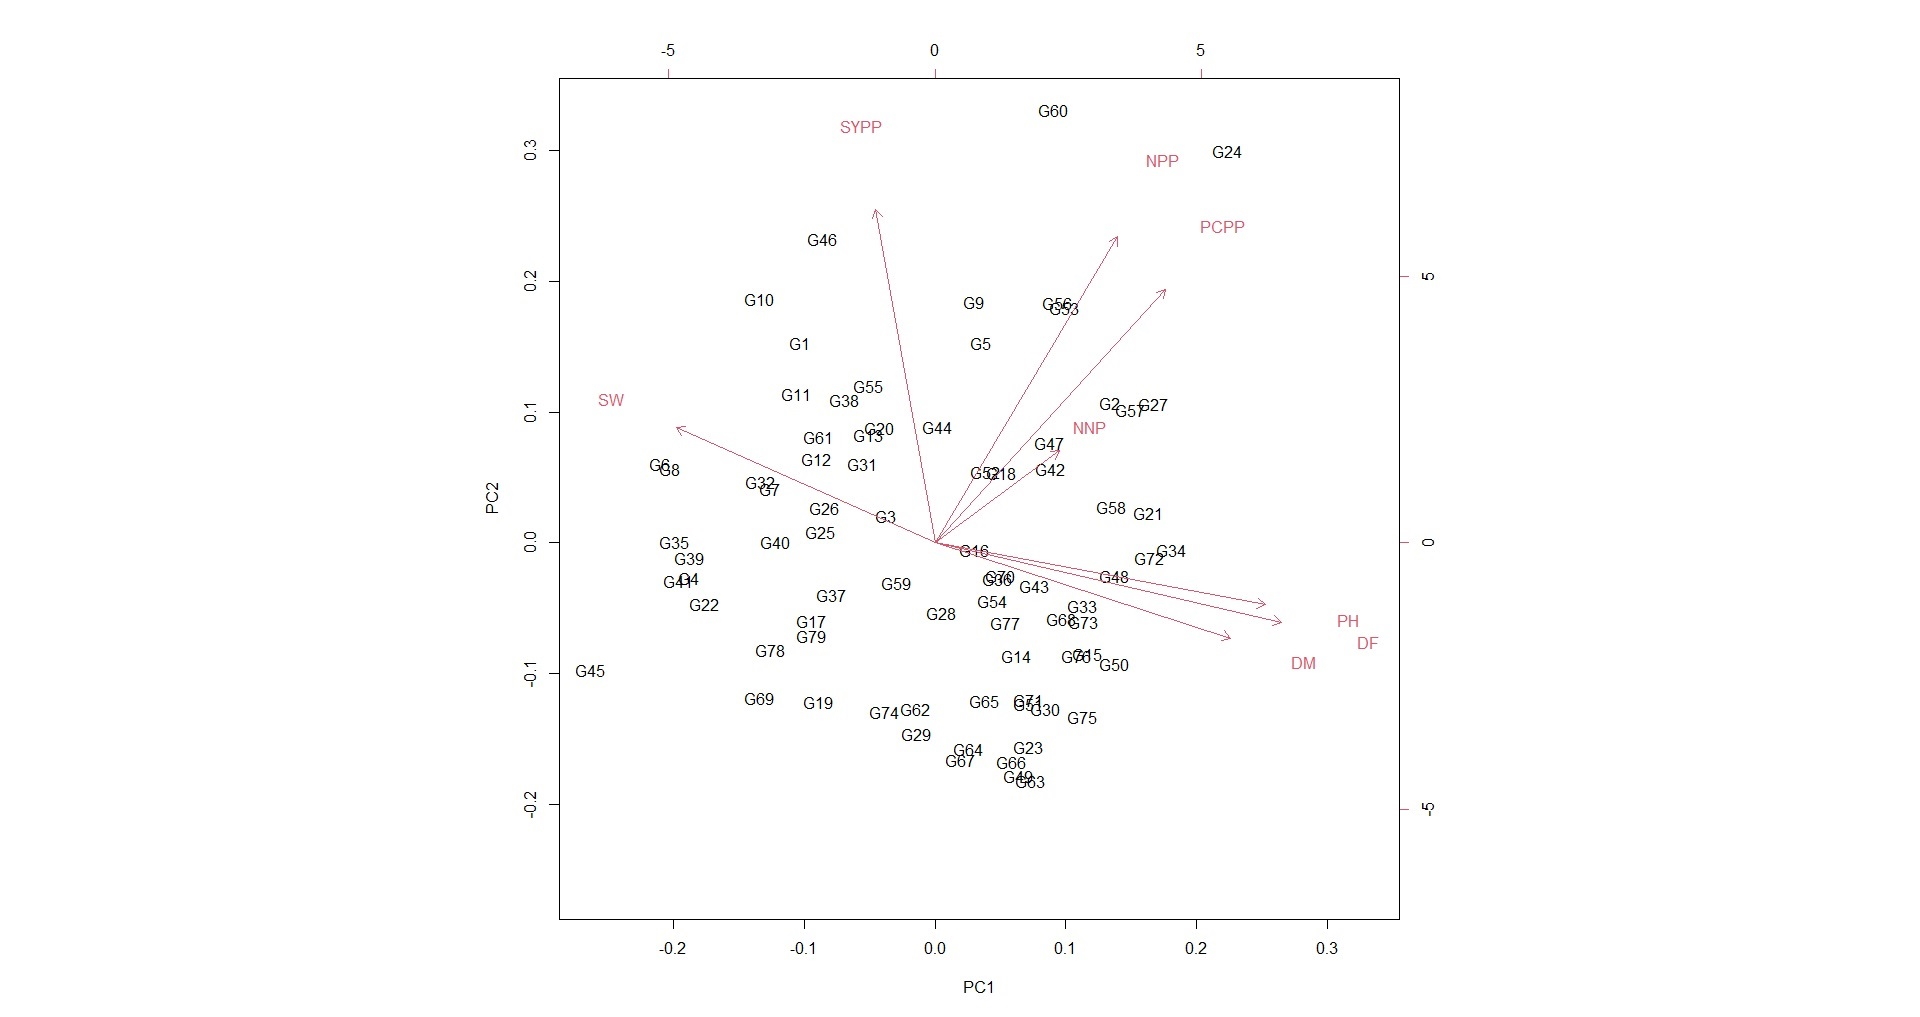
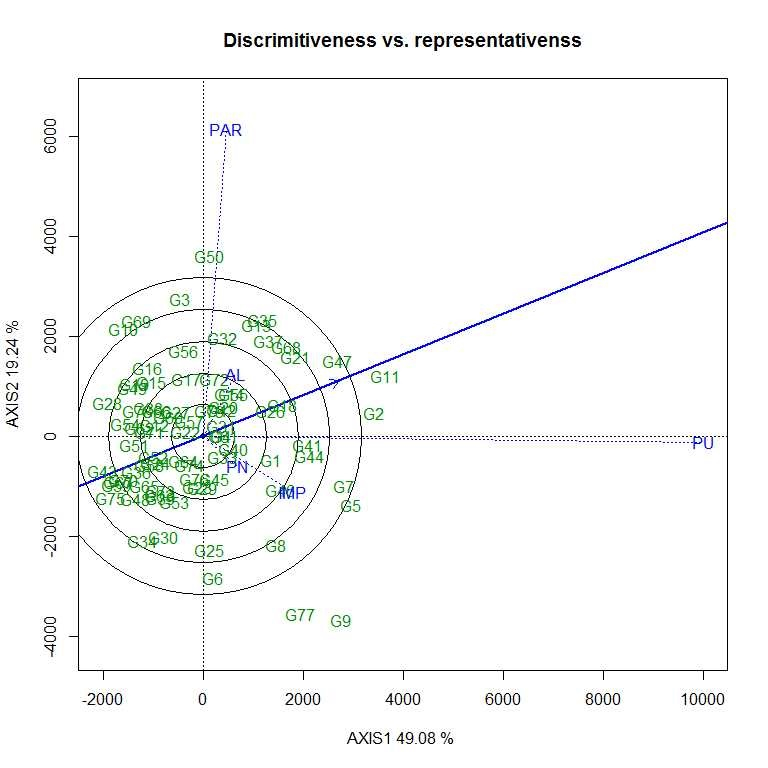
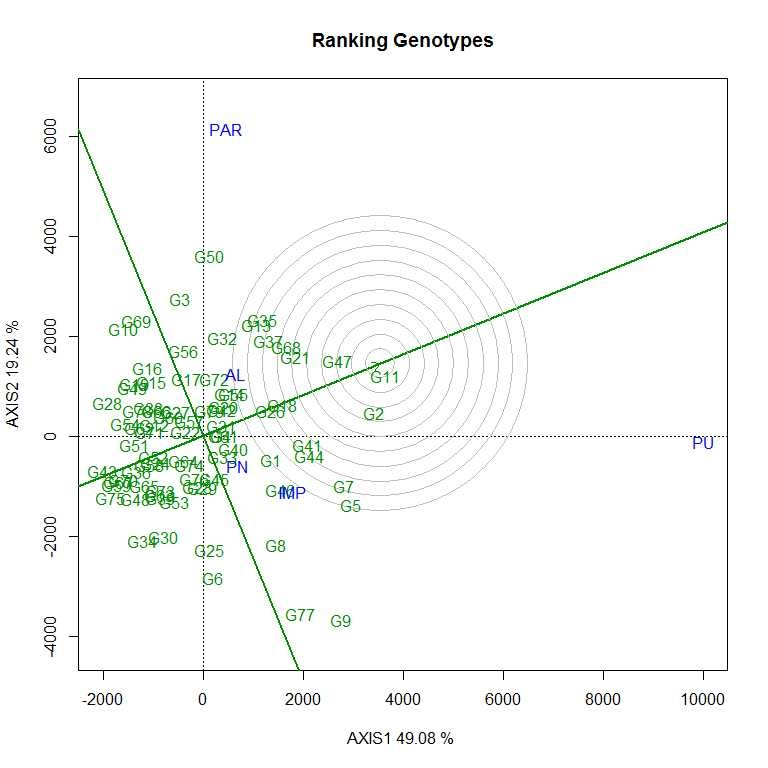
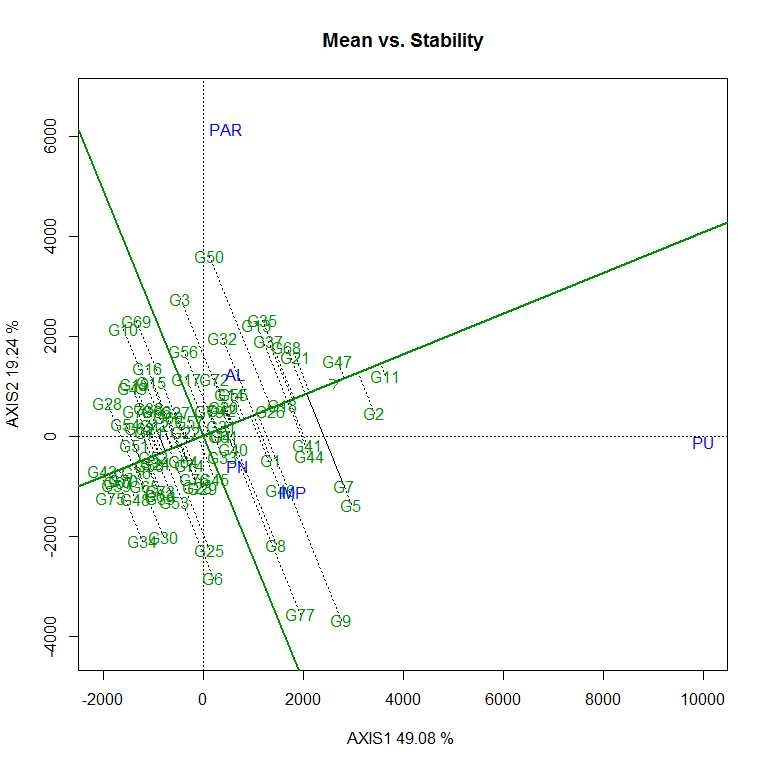
Soybean is a major source of vegetable oil and protein worldwide. Globally, India is among the top five producers where soybean is a major oilseed grown under diverse agro-climatic conditions by small and marginal farmers. The present study aims to identify soybean varieties with higher yield levels, resistance to pestdiseases and adaptability to climatic fluctuations. One hundred and twenty-five (125) indigenous and exotic soybean germplasm accessions and five checks were evaluated and characterized for eight agro-morphological traits at five testing locations and also screened for frog-eye leaf spot (FLS) and yellow mosaic virus (YMV) diseases under hot-spot locations during the rainy season. A wide range of variability was observed among accessions for days to 50% flowering (39–59), plant height (41–111 cm), number of nodes/plant (10–30), pod clusters/plant (14–39), number of pods/plant (40–102), days to maturity (96–115), grain yield/plant (4.89–16.54 g) and 100-seed weight (6.02–13.72 g). Among various traits, 100-seed weight (0.45), number of pods/plant (0.60) and number of pod clusters/plant (0.38) were found to be major yield-contributing traits as they exhibited highly significant correlation with grain yield/plant. Principal components PCI and PCII with eigen value >1 accounted for 42.66 and 27.08% of the total variation, respectively. Accessions G24 (EC 393222) from Taiwan and G40 (IMP-1) from the USA belonging to cluster IV were found promising for multiple yield traits and JS 20–38 from cluster III for earliness as per cluster analysis. GGE biplot average environment coordination (AEC) view revealed that the accessions viz., G11 (EC 333872), G2 (EC 251506) and G47 (TNAU-S-55) were the best performing stable genotypes in terms of grain yield/plant across locations. Twelve accessions had a high level of resistance against both FLS and YMV diseases under natural hot-spot conditions which can be utilized as promising donors in the soybean breeding programme.

Type
Research Article
Copyright
Copyright © The Author(s), 2023. Published by Cambridge University Press on behalf of National Institute of Agricultural Botany

Introduction

Soybean [Glycine max (L.) Merrill] is a major oilseed crop that provides cholesterol free oil and protein to meet the nutritional requirements of the global population. Soybean is grown worldwide under varying climatic conditions (Islam et al., Reference Islam, Muhyidiyn, Islam, Hasan, Hafeez, Hosen, Saneoka, Ueda, Liu, Naz, Barutçular, Lone, Raza, Chowdhury, Sabagh, Erman, Ohyama, Takahashi, Ohtake, Sato and Tanabata2022) and contributes 25% of the global vegetable oil production and about two-thirds of the world's protein concentrate for livestock feeding (Agarwal et al., Reference Agarwal, Billore, Sharma, Dupare and Srivastava2013). Also, soybean requires less nitrogen fertilizer which contributes to agricultural sustainability. India is the fifth largest producer of soybean in the world, contributing 9.60 and 3.16% in the global soybean acreage and production, respectively (FAOSTAT, 2020). After its introduction in India, the area increased rapidly from 30 to 12,918 thousand hectares over the period 1970–71 to 2020 resulting in an increased production from 10 to 12,610 thousand tonnes (DES, 2020). However, among top five soybean-producing countries (USA: 3.51 t/ha, Argentina: 3.02 t/ha, Brazil: 2.91 t/ha and China: 1.8 t/ha), India (1.22 t/ha) has the lowest yield levels (Terzic et al., Reference Terzic, Popovic, Tatic, Vasileva, Đekic, Ugrenovic, Popovic and Avdic2018). In India, soybean productivity levels are also very low across the major producing states: M.P. (639 kg/ha), Maharashtra (1460 kg/ha), Rajasthan (969 kg/ha) and Karnataka (1212 kg/ha) which are contributing 95.15% of the total soybean production in the country (DES, 2020). Thus, measures to increase the yield of soybean are urgently needed (Agarwal et al., Reference Agarwal, Billore, Sharma, Dupare and Srivastava2013). Under the current environment of continuing climate variations and fast evolving pests and pathogens (Kofsky et al., Reference Kofsky, Zhang and Song2018), a better understanding of genetic diversity is necessary for yield maximization and minimizing crop failures (Fu, Reference Fu2015).

At present, due to the extensive usage of only a limited number of parental lines in focused hybridization programmes, the genetic foundation of Indian soybean cultivars is extremely limited (Kumawat et al., Reference Kumawat, Singh, Gireesh, Shivakumar, Arya, Agarwal and Husain2015). Furthermore, indigenous cultivars and landraces are on the verge of extinction and the exotic germplasm with abiotic and biotic stress resistance genes has not been effectively employed in soybean breeding (Singh and Hymowitz, Reference Singh and Hymowitz1999). As a result, only about 45 varieties out of 139 released varieties exist in the seed chain and just four of them dominate the supply chain to provide over 95% of total soybean seed requirement and 98% of the seed availability in the country (Sharma et al., Reference Sharma, Dupare and Patel2016).

In India, frog-eye leaf spot (FLS) is the prominent disease of soybean in the hilly regions whereas, yellow mosaic virus (YMV) is the major threat to soybean production across the plain regions. Unfortunately, efforts to address both problems (FLS and YMV) together have not been made so far thus, none of the soybean cultivar released in India to date exhibit resistance to both of these diseases which restricts the wider adoption of high-yielding soybean varieties in the country. Therefore, to develop new cultivars with improved yield, the genetic potential of soybean needs to be evaluated for wide adaptability and multiple disease resistance (Chander et al., Reference Chander, Oliveira, Gedil, Shah, Otusanya, Asiedu and Chigeza2021). Among these, YMV, transmitted by white fly (Bemisia tabaci Genn.), is an economically important widespread disease of soybean in almost all soybean growing zones and causes up to 80% yield losses (Lal et al., Reference Lal, Rana, Sapra and Singh2005; Joshi et al., Reference Joshi, Singh, Adhikari and Rani2018; Naveesh et al., Reference Naveesh, Prameela, Basavaraj and Rangaswamy2020). Since YMV is insect-transmitted, controlling it through chemical or cultural practices is neither effective nor environment-friendly. Thus, deployment of genetic resistance is the best approach for the management of YMV. FLS, caused by Cercospora sojina Hara, is a very severe disease in the warm and humid tropical and subtropical regions that causes up to 60% yield losses as a result of reduced photosynthetic area, premature defoliation and reduced seed size (Mishra et al., Reference Mishra, Bhartiya and Kant2021). FLS can be managed with resistance genes Rcs1, Rcs2 and Rcs3, but there are few other sources of resistance known so far (Yang and Weaver, Reference Yang and Weaver2001; McDonald et al., Reference McDonald, Buck and Li2022). Moreover, FLS is known to be genetically variable and new races are capable of infecting previously resistant genotypes. Therefore, finding additional sources of resistance can reduce the impact of new virulent races (Yang and Weaver, Reference Yang and Weaver2001).

The present study was undertaken to evaluate yield parameters and resistance to YMV and FLS in diverse accessions. The work aims to identify soybean genotypes with higher yield levels, coupled with resistance to both prevalent diseases FLS–YMV and wider adaptability across the soybean-growing regions of India from multi-locational germplasm evaluation trials coordinated by All India Coordinated Research Project (AICRP) on soybean, ICAR-IISR, Indore (M.P.) for further use in national hybridization programmes. The results provide a basis for breeding soybean cultivars with improved yield and adaptability for Indian agriculture.

Materials and methods

Plant material and experimental sites

One hundred and twenty-five accessions of soybean and five location-specific checks were evaluated at five locations in India during the year 2020 rainy season. The testing locations included ICAR-VPKAS, Almora (NHZ) (29°36′N, 79°40′E and 1250 m amsl), GBPUA&T, Pantnagar (NPZ) (29°50′N, 79°30′E and 243.84 m amsl) in Uttarakhand; ARI, Pune (SZ) (18°14′N, 75°21′E and 548.6 m amsl), VNMKV, Parbhani (CZ) (19°24′N, 76°78′E and 454 m amsl) in Maharashtra and CAU, Imphal (24°76′N, 94°05′E and 813 m amsl) in Manipur (NEHZ) representing various soybean-growing agro-climatic zones in India (Table S1).

Conduction of experiment and data recording

The experiment was conducted in an augmented design where checks were repeated after every 25 accessions in each block. Each plot consisted of one row of 3 m. Row-to-row spacing was maintained at 45 cm, whereas, plant-to-plant spacing within rows was fixed at 8–10 cm at all of the locations. The inorganic fertilizer dose included basal application of 20 kg N: 80 kg P: 20 kg K. Standard agronomic practices were followed to raise a healthy crop. Data on eight quantitative traits viz., days to 50% flowering, days to maturity, plant height (cm), number of nodes/plant, number of pods/plant, number of pod cluster/plant, 100-seed weight (g) and grain yield/plant (g) were recorded using soybean descriptors (IBPGR, 1984) in the 79 accessions commonly germinated across the testing locations. Observations on days to heading and maturity were based on whole plot whereas observations on rest of the traits were from three randomly selected plants.

Disease screening under hot-spot conditions

Screening for major soybean diseases were carried out at hot-spot locations at Experimental Farm, Hawalbagh, ICAR-VPKAS, Almora for FLS and at Norman E. Borlaug Crop Research Center, GBPUA&T, Pantnagar, U.S. Nagar for YMV. For disease rating, 0–9 scale was followed for FLS and YMV. All the genotypes were critically observed for the entire crop period for the symptoms of FLS and YMV at the respective hot-spot locations. For FLS screening at Almora, highly susceptible lines (Bragg and Shivalik), whereas, at Pantnagar for YMV screening, highly susceptible line (JS 335) was planted around the experimental plot all along the borders and after every five entries as an infector row to provide sufficient inoculums for the spread of the disease. Point scale (0–9) divided into six categories [Fig. 1(a) and (b)] was adopted to classify the accessions into different categories as per the level of disease reaction of FLS (Mishra et al., Reference Mishra, Bhartiya and Kant2021) and YMV (Joshi et al., Reference Joshi, Singh, Adhikari and Rani2018) both manifested by the concerned genotypes as given below:

Figure 1. Disease reaction (0-9 scale) of (a) Frog-eye Leaf Spot (FLS) and (b) Yellow Mosaic virus (YMV).

Statistical analysis

Shannon–Weaver diversity indices (Shannon and Weaver, Reference Shannon and Weaver1949) were calculated for each trait with Microsoft Excel using the formula H′ = [∑(n/N) × {log2 (n/N) × (−1)}/log2k where, H′ = standardized Shannon–Weaver diversity index, k = number of phenotypic classes of the trait, n = frequency of a phenotypic class of that trait and N is the total number of observations for that trait. For the quantitative traits, accessions were divided into 10 phenotypic classes as <x  2sd, x  2sd, x  1.5sd, x  sd, x  0.5sd, x, x + 0.5sd, x + sd, x + 1.5sd, x + 2sd and >x + 2sd are as the margins of the classes, where x is representing mean and sd is standard deviation (Ghimire et al., Reference Ghimire, Joshi, Gurung and Sthapit2018). The descriptive statistics, clustering, principal component analysis (PCA) and correlation analysis have been performed using R software (version 4.0.4) and GGE biplot analysis using PB tools (version 1.4)

Results

Descriptive statistics and Shannon–Weaver diversity

Range and mean of traits as well as Shannon–Weaver diversity indices (H′) for different quantitative traits have been presented in Table 1. Flowering time ranged from 39 to 59 days and days to maturity from 96 to 115 was recorded with the mean of 50 and 107 days after sowing, respectively. Ranges for other traits measured were plant height (41–111 cm), number of nodes/plant (10–30), number of pods/plant (40–102), number of pod cluster/plant (14–39), 100-seed weight (6.02–13.72 g) and grain yield/plant (4.89–16.54 g) which were also observed in the pooled data of multi-locational germplasm evaluation trial. Shannon–Weaver diversity index (H′) considers both richness and evenness of the phenotypic classes of the traits. The highest diversity was observed in plant height (0.797) followed by days to 50% flowering (0.785), number of pod clusters/plant (0.780), days to maturity (0.773), 100-seed weight (0.773) and number of pods/plant (0.768). The H' for all quantitative traits ranged from 0.572 to 0.797 which confirmed that the soybean accessions were intermediate to highly diverse for the traits under study.

Table 1. Descriptive statistics and Shannon–Weaver diversity indices for different quantitative traits in soybean germplasm accessions

Box-plot and clustering observations

The box plots constructed on the basis of eight quantitative traits revealed a wide phenotypic variability in the soybean germplasm across locations. The higher median values for days to 50% flowering and maturity duration were found at Almora and Pantnagar location, respectively (Figs. S1 and S2), whereas, Pune and Imphal found to have higher median for 100-seed weight and grain yield levels (Figs. S3 and S4). Hierarchical agglomerative clustering divided soybean accessions into five clusters (Fig. S5). In cluster II, most of the accessions were indigenous, whereas, majority accessions from cluster III were of exotic origin. Cluster IV comprised only two accessions of exotic origin G24 (EC 393222) from Taiwan and G40 (IMP-1) from the USA which were found promising for grain yield/plant (16.37 g) and yield component traits like number of pods/plant (102) and number of pod clusters/plant (37), whereas, cluster V with indigenous accession G61 (JS20-41) was found promising for days to 50% flowering (42 days), maturity duration (102 days) and also for yield-contributing traits viz., number of nodes/plant (30) and 100-seed weight (11.23 g) than the rest of the clusters (Table 2). Promising accessions for different quantitative traits have been listed in Table 3.

Table 2. Cluster means of quantitative traits of indigenous and exotic soybean accessions

Table 3. Promising soybean accessions for eight quantitative traits

Principal component analysis

PCA with eigen vectors, eigen values and variances due to first four principal components (PCs) is presented in Table 4. Among the eight PCs, only two components were found having an eigen value >1 and exhibited overall variability of about 69.74% among the accessions for the total phenotypic variation, and thus, provides a good approximation of the variation present in the original dataset. Maximum variability of 42.66% was shown by PC1 followed by PC2 (27.08%), PC3 (12.22%) and PC4 (9.05%), respectively, which altogether accounted for 91.03% of the total phenotypic variance among accessions. In the first principal component (PCI), days to 50% flowering (−0.50), plant height (−0.47), days to maturity (−0.42) and number of pod clusters/plant (−0.33) with strong negative loading, whereas, grain yield with (0.37) highly significant positive loading were the most important traits. Similarly, traits such as 100-seed weight (−0.60), number of pods/plant (−0.55) and number of clusters/plant (−0.45) had highly significant negative loadings for second principal component PCII. For the third principal component PC III, highly significant positive loading was exhibited by days to maturity (0.35), whereas, strong negative loading by number of nodes/plant (−0.85); however, for PC IV, highly significant positive loading was shown by grain yield/plant (0.68) followed by days to maturity (0.41) and number of nodes/plant (0.38). The scatter diagram of the PCA (Fig. S6) between PCI and PCII revealed a considerable level of genetic diversity among the accessions and suggested that PCA was strongly in concurrence with the result of cluster analysis. In the biplot and loadings plot, it was revealed that the variables viz., days to 50% flowering, days to maturity and plant height were highly correlated with each other but exhibited negative correlation with grain yield/plant. Similarly, number of pods/plant and number of pod clusters/plant were highly associated and also found correlated with grain yield/plant. Hundred seed weight and grain yield/plant were observed as correlated traits in the biplot. The evaluation on the different agro-morphological traits indicated that the soybean accessions having short-to-medium plant height, more pods/plant, pod clusters/plant, 100-seed weight and crop growth periods adapted to target site may have higher yield. More number of pods/plant, pod clusters/plant and 100-seed weight can be used as direct selection criterion for yield increase and likewise the other traits such as plant height and growth periods indirectly affected yield by affecting the three traits above.

Table 4. Correlation coefficients between the first four principal components (PCI, PCII, PC III and PCIV) and eight quantitative traits of soybean germplasm accessions

*, **Significant at 5 and 1% probability levels, respectively.

Correlation analysis

As per the Pearson's correlation coefficient between quantitative traits (Table S2), there was highly significant positive correlation (0.85) between days to 50% flowering and days to maturity. Highly significant negative correlation was observed between 100-seed weight with days to 50% flowering (−0.61), plant height (−0.50) and days to maturity (−0.37), whereas, strong positive correlation was observed with grain yield/plant (0.45). The strong association between grain yield and 100-seed weight suggested that accessions with more grain weight can be selected as a high-yielding trait. Grain yield/plant exhibited highly significant correlation with number of pods/plant (0.60) and number of pod clusters/plant (0.38), whereas, negative association with days to 50% flowering (−0.24) and plant height (−0.25). It is suggesting that more number of pods/plant and pod clusters/plant can be considered as a high-yielding trait, whereas, short flowering duration and plant height may lead to poor yield levels. Pod cluster/plant which is an important yield-contributing trait was also found to have highly significant positive association with days to 50% flowering (0.37), plant height (0.40) and number of pods/plant (0.81).

General and specific genotypic adaptation of accessions

The first two PCs (PC1 and PC II) jointly explained 68.32% of the total variation for grain yield/plant. As per the average environment coordination (AEC) view of GGE biplot (Figs. S7–S10) G11 (EC 333872), G2 (EC 251506) and G 47 (TNAU-S-55) were the best performing stable genotypes in terms of grain yield/plant across locations (Almora, Pantnagar, Imphal, Parbhani and Pune), whereas, G43 (UPSL 470) and G75 (UPSL 415) were the poorest yielders. It may be observed that G9 (AGS 99) and G50 (UPSL 742) were least stable for grain yield/plant with higher projection from the AEC abscissa. In the ‘which–won–where biplot’, the environments were distributed by equality lines into 10 sectors for grain yield/plant with accessions, viz., G11, G50, G10, G28, G43, G75, G34, G30 and G9 at the vertices. Thus, genotype G11 (EC 333872) was found to be the winner at Pune location, whereas, G50 (UPSL 742) at Parbhani and Almora as these locations are sharing the same sector in the biplot. Similarly, G9 (AGS 99) was found to be the promising accession for Imphal and Pantnagar for their yield performance. Rest of the accessions located on the polygon vertices viz., G10, G28, G43, G75, G34 and G30 were not found winners for any of the location as none of the location appeared in its sector which indicate that they were the poorest accessions at all or some locations. All the environments were retained into three sectors (first sector comprised Parbhani and Almora, second sector has Pune and third sector with Pantnagar and Imphal locations) and this pattern is suggesting the possibility that the target environment may consist of three mega environments.

Phenotyping of FLS and YMD disease

Based on the screening scores against FLS, 22 accessions (27.84%) were found to be highly resistant, 46 entries (58.22%) were moderately resistant and 11 entries (13.92%) were moderately susceptible. For YMD, 48 entries (60.75%) were found to be highly resistant, 15 (18.98%) were moderately susceptible, 13 (16.45%) were susceptible and 3 (3.79%) were highly susceptible. Interestingly, 12 accessions (AGS 163B, AMS.MB 51-18, EC 251516, EC 383165, EC 457185, EC 456599, UPSL 470, JS 20-38, NRC 42, JS 89-24, RKS 52 and IMP 1) were found to be highly resistant to both FLS and YMD, respectively, under field conditions.

Discussion

The present study revealed considerable scope for diversifying the genetic base of soybean through selection and further utilization of suitable accessions for improving target traits. Range of flowering (39–59 days) and maturity (96–115) duration in the indigenous and exotic accessions under study were found within the range of the Indian soybean germplasm core collection (flowering of 24–94 days and maturity duration of 73–137 days) (Gireesh et al., Reference Gireesh, Husain, Shivakumar, Satpute, Kumawat, Arya, Agarwal and Bhatia2015). Diversity of flowering and maturity time is associated with the adaptation of soybean cultivars to diverse geographic regions and farming systems (Liu et al., Reference Liu, Song, Wang, Sun, Qi, Wu, Sun, Jiang, Wu, Hou, Ni and Han2020). Plant height ranged from 41 to 111 cm with an average of 80 cm which is quite taller than the Indian (50.01 cm) core collection (Gireesh et al., Reference Gireesh, Husain, Shivakumar, Satpute, Kumawat, Arya, Agarwal and Bhatia2015) and almost similar to USDA (85.5 cm) accessions (Oliveira et al., Reference Oliveira, Nelson, Geraldi, Cruz and de Toledo2010). Longer vegetative/juvenile phase at Almora and longer reproductive phase at Pantnagar caused the higher median values for phenological traits viz., days to 50% flowering and maturity duration. Soybean is highly sensitive to photoperiod which limits the geographical range for cultivating specific soybean varieties; therefore, reproductive phenology (i.e. the timing of flowering and maturity) is crucial for its adaptation and productivity in specific environments (Hou et al., Reference Hou, Liu, Kong, Hon-Lam and Li2022) and suitable cultivars can make full use of the growing season in the target region. Delayed flowering, i.e. longer juvenile phase can be useful for achieving higher yield levels owing to enough vegetative mass regardless of short photoperiods (Islam et al., Reference Islam, Fujita, Watanabe and Zheng2019).

The soybean accessions grouped into five clusters. In cluster II, most of the accessions were indigenous and in cluster III majority of the accessions were of exotic origin suggesting an association between genetic diversity and geographical distribution. Aside from geographic diversification, other mechanisms such as genetic drift, spontaneous variation, artificial selection, etc., could also contribute to genotype genetic diversity (Pandey and Bhatore, Reference Pandey and Bhatore2018). Cluster IV with only two exotic accessions viz., G24 (EC 393222) from Taiwan and G40 (IMP-1) from the USA had higher grain yield/plant, number of pods/plant and number of pod clusters/plant, whereas, cluster V with indigenous accession G61 (JS20-41) exhibited higher number of nodes/plant, earliness and 100-seed weight. Accessions from these two clusters having high mean values for yield traits can be utilized to get higher grain-yielding early transgressive segregants. The grain yield/plant was negatively correlated with viz., days to 50% flowering, days to maturity and also with plant height (Table S2). The short duration genotypes are generally short in height (Bhartiya et al., Reference Bhartiya, Aditya, Kumari, Kishore, Purwar, Agrawal and Kant2017) and produce grains with reduced size or less grains that finally leads to poor grain yield levels (Kuswantoro, Reference Kuswantoro2017). Similarly, number of pods/plant and number of pod clusters/plant were highly associated and also found correlated with grain yield/plant. Grain yield is often improved through selecting its attributing agronomic traits like 100 seed weight, as reported previously through direct positive selection for higher seed weight (Bhartiya and Aditya, Reference Bhartiya and Aditya2016; Vennampally et al., Reference Vennampally, Bhartiya, Singh, Devi, Deshmukh, Verghese, Singh, Mehtre, Kumari, Maranna, Kumawat, Ratnaparkhe, Satpute, Rajesh, Chandra, Ramteke, Khandekar and Gupta2021).

Therefore, yield performance and stability of accessions were visualized graphically through GGE biplot to identify better performing accessions across the testing sites. As per the AEC view of GGE biplot, G11 (EC 333872), G2 (EC 251506) and G47 (TNAUS 55) were the best performing stable accessions in terms of grain yield/plant across the locations, i.e. these accessions have general genotypic adaptation to produce a wide range of phenotypes compatible with a range of environments than remaining accessions.

The vertex genotype in each sector is the best genotype at environments whose markers fall into the respective sector (Yan, Reference Yan2002). Thus, genotype G11 (EC 333872) was found to be the winner (high mean yield and stable) at Pune location, whereas, G50 (UPSL 742) at Parbhani and Almora as these locations are sharing the same sector in the biplot. Similarly, G9 (AGS 99) was found to be the promising accession for Imphal and Pantnagar for their yield performance due to specific genotypic adaptation of the promising accession in the location as compared to other accessions. Therefore, different type of soybean cultivar needs to be deployed to realize the maximum yield potential in each mega environment (Bhartiya et al., Reference Bhartiya, Aditya, Kumari, Kishore, Purwar, Agrawal, Kant and Pattanayak2018). Twelve accessions were found to be resistant to both FLS and YMD and may be suitable for breeding resistance to these diseases in the future. These selected genotypes can be used as FLS–YMV resistant donors in soybean breeding programme after further evaluation.

Conclusion

The results of this study showed that this information will enable the selection of accessions for improving yield and disease resistance in soybean. Accessions with high yield coupled with YMV–FLS resistance will enable the development of widely adapted soybean genotypes that can be grown across varied soybean-growing localities where YMV and FLS are prevalent. The results contribute to the Indian national soybean hybridization programme that aims to develop promising high-yielding, disease-resistant varieties suitable to the diverse agro-climatic conditions of soybean-growing regions of India for profitable cultivation.

Supplementary material

The supplementary material for this article can be found at https://doi.org/10.1017/S1479262123000941.

Acknowledgements

The authors are highly thankful to Director, ICAR-IISR Indore (M.P.) for providing seed material under AICRP on soybean and valuable guidance for carrying out the present research work, Director, ICAR-VPKAS, Almora and Head, Crop Improvement Division for providing necessary facilities. The assistance of Shri Chandan Singh Kanwal, Technical officer in pulses and oilseeds improvement project at ICAR-VPKAS, Almora is also duly acknowledged.

Competing interest

None.

References

Agarwal, DK, Billore, SD, Sharma, AN, Dupare, BU and Srivastava, SK (2013) Soybean: introduction, improvement and utilization in India-problems and prospects. Agricultural Research 2, 293300.CrossRefGoogle Scholar
Bhartiya, A and Aditya, JP (2016) Genetic variability, character association and path analysis for yield and component traits in black seeded soybean lines under rainfed condition of Uttarakhand hills of India. Legume Research 39, 3134.Google Scholar
Bhartiya, A, Aditya, JP, Kumari, V, Kishore, N, Purwar, JP, Agrawal, A and Kant, L (2017) GGE biplot & AMMI analysis of yield stability in multi-environment trial of soybean [Glycine max (L.) Merrill] genotypes under rainfed condition of north western Himalayan hills. The Journal of Animal and Plant Sciences 27, 227238.Google Scholar
Bhartiya, A, Aditya, JP, Kumari, V, Kishore, N, Purwar, JP, Agrawal, A, Kant, L and Pattanayak, A (2018) Stability analysis of soybean [Glycine max (L.) Merrill] genotypes under multi-environments rainfed condition of North Western Himalayan hills. Indian Journal of Genetics and Plant Breeding 78, 342347.Google Scholar
Chander, S, Oliveira, ALG, Gedil, M, Shah, T, Otusanya, GO, Asiedu, R and Chigeza, G (2021) Genetic diversity and population structure of soybean lines adapted to sub-Saharan Africa using single nucleotide polymorphism (SNP) markers. Agronomy 11, 604.CrossRefGoogle Scholar
DES (2020) Directorate of Economics & Statistics, Ministry of Agriculture & Farmers Welfare, Government of India. Database. Available at https://eands.dacnet.nic.in/APY_96_To_06.htm (accessed 31 March 2023).Google Scholar
FAOSTAT (2020) Food and Agriculture Organization of the United Nations (FAO). FAOSTAT Database. Available at http://faostat.fao.org/site/291/default.aspx (accessed 31 March 2023).Google Scholar
Fu, Y-B (2015) Understanding crop genetic diversity under modern plant breeding. Theoretical and Applied Genetics 128, 21312142.CrossRefGoogle ScholarPubMed
Ghimire, KH, Joshi, BK, Gurung, R and Sthapit, BR (2018) Nepalese foxtail millet [Setaria italica (L.) P. Beauv.] genetic diversity revealed by morphological markers. Genetic Resources and Crop Evolution 65, 11471157.CrossRefGoogle Scholar
Gireesh, C, Husain, SM, Shivakumar, M, Satpute, GK, Kumawat, G, Arya, M, Agarwal, DK and Bhatia, VS (2015) Integrating principal component score strategy with power core method for development of core collection in Indian soybean germplasm. Plant Genetic Resources: Characterization and Utilization 15, 230238.CrossRefGoogle Scholar
Hou, Z, Liu, B and Kong, F (2022) Regulation of flowering and maturation in soybean. In Hon-Lam, M and Li, MW (eds), Advances in Botanical Research. London: Academic Press, pp. 4345.Google Scholar
IBPGR (1984) International Board for Plant Genetic Resources, Descriptors of Soybean. Rome: IBPGR Secretariat, IBPGR/84/183.Google Scholar
Islam, Md R, Fujita, D, Watanabe, S and Zheng, S (2019) Variation in photosensitivity of flowering in the world soybean mini-core collections (GmWMC). Plant Production Science 22, 220226.CrossRefGoogle Scholar
Islam, MS, Muhyidiyn, I, Islam, MR, Hasan, MK, Hafeez, ASMG, Hosen, MM, Saneoka, H, Ueda, A, Liu, L, Naz, M, Barutçular, C, Lone, J, Raza, MA, Chowdhury, MK, Sabagh, AE and Erman, M (2022) Soybean and sustainable agriculture for food security. In Ohyama, T, Takahashi, Y, Ohtake, N, Sato, T and Tanabata, S (eds), Soybean - Recent Advances in Research and Applications. London: Intech Open. http://dx.doi.org/10.5772/intechopen.104129Google Scholar
Joshi, D, Singh, PK, Adhikari, S and Rani, S (2018) Screening of soybean germplasm for important disease prevalent in North India. International Journal of Chemical Studies 6, 27312733.Google Scholar
Kofsky, J, Zhang, H and Song, BH (2018) The untapped genetic reservoir: the past, current, and future applications of the wild soybean (Glycine soja). Frontiers in Plant Science 9, 949.CrossRefGoogle ScholarPubMed
Kumawat, G, Singh, G, Gireesh, C, Shivakumar, M, Arya, M, Agarwal, DK and Husain, SM (2015) Molecular characterization and genetic diversity analysis of soybean (Glycine max (L.) Merr.) germplasm accessions in India. Physiology and Molecular Biology of Plants 21, 101107.CrossRefGoogle ScholarPubMed
Kuswantoro, (2017) Genetic variability and heritability of acid-adaptive soybean promising lines. Biodiversitas: Journal of Biological Diversity 18, 378382.CrossRefGoogle Scholar
Lal, SK, Rana, VKS, Sapra, RL and Singh, KP (2005) Screening and utilization of soybean germplasm for breeding resistances against Mungbean Yellow Mosaic Virus. Soybean Genetics Newsletter 32, 8083.Google Scholar
Liu, L, Song, W, Wang, L, Sun, X, Qi, Y, Wu, T, Sun, S, Jiang, B, Wu, C, Hou, W, Ni, Z and Han, T (2020) Allele combinations of maturity genes E1-E4 affect adaptation of soybean to diverse geographic regions and farming systems in China. PLoS ONE 15, e0235397.CrossRefGoogle ScholarPubMed
McDonald, SC, Buck, J and Li, Z (2022) Automated, image-based disease measurement for phenotyping resistance to soybean frogeye leaf spot. Plant Methods 18, 103. https://doi.org/10.1186/s13007-022-00934-7CrossRefGoogle ScholarPubMed
Mishra, KK, Bhartiya, A and Kant, L (2021) Identification of resistance sources against frogeye leaf spot (FLS) disease of soybean caused by Cercospora sojina under hot spot conditions of Uttarakhand hills. Indian Phytopathology 74, 11171121.CrossRefGoogle Scholar
Naveesh, YB, Prameela, HA, Basavaraj, S and Rangaswamy, KT (2020) Screening of soybean genotypes to soybean yellow mosaic virus disease. International Journal of Current Microbiology and Applied Sciences 9, 20702076.CrossRefGoogle Scholar
Oliveira, MF, Nelson, RL, Geraldi, IO, Cruz, CD and de Toledo, JFF (2010) Establishing a soybean germplasm core collection. Field Crops Research 119, 277289.CrossRefGoogle Scholar
Pandey, S and Bhatore, A (2018) Genetic diversity analysis for quantitative traits in indigenous germplasm of lentil in Madhya Pradesh. Journal of Pharmacognosy and Phytochemistry 7, 279283.Google Scholar
Shannon, C and Weaver, W (1949) The Mathematical Theory of Communication. Chicago: The University of Illinois, pp. 324.Google Scholar
Sharma, P, Dupare, BU and Patel, RM (2016) Soybean improvement through research in India and socio-economic changes. Legume Research 39, 935945.Google Scholar
Singh, RJ and Hymowitz, T (1999) Soybean genetic resources and crop improvement. Genome 42, 605616.CrossRefGoogle Scholar
Terzic, D, Popovic, V, Tatic, M, Vasileva, V, Đekic, V, Ugrenovic, V, Popovic, S and Avdic, P (2018) Soybean area, yield and production in world. XXII Eco-Conference, Ecological Movement of Novi Sad, Ministry of Education, Science and Technology Development of the Republic of Serbia.Google Scholar
Vennampally, N, Bhartiya, A, Singh, CP, Devi, HN, Deshmukh, MP, Verghese, P, Singh, K, Mehtre, SP, Kumari, V, Maranna, S, Kumawat, G, Ratnaparkhe, MB, Satpute, GK, Rajesh, V, Chandra, S, Ramteke, R, Khandekar, N and Gupta, S (2021) WAASB-based stability analysis and simultaneous selection for grain yield and early maturity in soybean. Agronomy Journal 4, 30893099.Google Scholar
Yan, W (2002) Singular value partitioning in biplot analysis of multi-environment trial data. Agronomy Journal 94, 990996.Google Scholar
Yang, W and Weaver, DB (2001) Resistance to frogeye leaf spot in maturity groups VI and VII of soybean germplasm. Crop Science 41, 549552.CrossRefGoogle Scholar
Figure 0

Figure 1. Disease reaction (0-9 scale) of (a) Frog-eye Leaf Spot (FLS) and (b) Yellow Mosaic virus (YMV).

Figure 1

Table 1. Descriptive statistics and Shannon–Weaver diversity indices for different quantitative traits in soybean germplasm accessions

Figure 2

Table 2. Cluster means of quantitative traits of indigenous and exotic soybean accessions

Figure 3

Table 3. Promising soybean accessions for eight quantitative traits

Figure 4

Table 4. Correlation coefficients between the first four principal components (PCI, PCII, PC III and PCIV) and eight quantitative traits of soybean germplasm accessions

Supplementary material: File

Bhartiya et al. supplementary material 1
Download undefined(File)
File 103.7 KB
Supplementary material: File

Bhartiya et al. supplementary material 2
Download undefined(File)
File 200.8 KB
Supplementary material: File

Bhartiya et al. supplementary material 3
Download undefined(File)
File 86.3 KB
Supplementary material: File

Bhartiya et al. supplementary material 4
Download undefined(File)
File 106 KB
Supplementary material: File

Bhartiya et al. supplementary material 5
Download undefined(File)
File 98.3 KB
Supplementary material: File

Bhartiya et al. supplementary material 6
Download undefined(File)
File 550.1 KB
Supplementary material: File

Bhartiya et al. supplementary material 7
Download undefined(File)
File 212.1 KB
Supplementary material: File

Bhartiya et al. supplementary material 8
Download undefined(File)
File 200.4 KB
Supplementary material: File

Bhartiya et al. supplementary material 9
Download undefined(File)
File 197.8 KB
Supplementary material: File

Bhartiya et al. supplementary material 10
Download undefined(File)
File 189.3 KB
Supplementary material: File

Bhartiya et al. supplementary material 11
Download undefined(File)
File 21.7 KB
Supplementary material: File

Bhartiya et al. supplementary material 12
Download undefined(File)
File 12.9 KB