Aside from the issue of (illegal) immigration, few policies received as much focused attention in the 2016 presidential campaign as the Affordable Care Act of 2010, with Donald J. Trump proclaiming he would eliminate “Obamacare” on the first day in office. Despite the advantages of one-party control of the presidency and both houses of Congress, swift repeal success eluded Republicans, as the Senate failed to craft a coalition to pass a new “repeal and replace” bill before heading home to celebrate Independence Day 2017. The failure to immediately pass a repeal bill after eight years of promises to do so was attributed to the economics of health insurance policy, ideological splits in the Republican party, the lack of Democratic cooperation, and, perhaps less so, the high level of constituency engagement (i.e., town halls, contacting) focused on the proposed repeal plans.
Indeed, the media images of angry constituent protests at district town hall meetings were consistent with the Democrats billing the repeal failure as a victory for democracy and the American people. The Republicans’ readiness to “move on” to tax reform and other legislative matters following these early stumbles raises a broader question about who will win in those legislative battles, and who will be represented in any policies that do emerge.Footnote 1
Only the hardiest of optimists today would suggest that representative democracy in the United States is strong: a gridlocked hyper-partisan Congress, the perennial advantages of the wealthy and organized (business) interests, and a polarized, critical, and disengaged public would seem to cripple popular governance. And few citizens are optimistic. In 2016, a national survey on Congressional performance reported that 14% of respondents viewed the Democratic Party as responsive to the rank-and-file, while 8% viewed the Republican Party as responsive.Footnote 2
Recent scholarly assessments of the linkages of electoral institutions and public opinion to policy outcomes provide little evidence to counter the public’s pessimistic views. Christopher Achen and Larry Bartels, for example, argue that decades of elections and voting behavior scholarship demonstrate that voters do not believe, think, or behave in the way that normative theories—even “folk theories”—of democracy require. As a result, elections cannot be understood as instruments for translating citizen policy preferences into public policy, or even as a means of indirectly controlling public policy.Footnote 3
Scholars of public opinion and policymaking mostly add to these negative assessments. Martin Gilens argues that elected officials respond to the opinions of the wealthy either exclusively or to a much stronger degree than to the opinions of the middle-class or poor.Footnote 4 In an innovative study of policymaking in the United States from 1981 through 2002, Martin Gilens and Benjamin Page conclude that the preferences of “average citizens” and mass public interest groups have little to no independent influence on policymaking.Footnote 5 Instead, the preferences of economic elites and organized business interests are clearly and consistently associated with changes in public policy.
These are somber, but also incomplete, assessments of democratic politics in the United States.Footnote 6 What is missing is systematic evidence on whether citizens can take action to have their voices heard—and reflected more clearly in public policy.Footnote 7 Citizens in advanced democracies participate in an increasingly wide range of political activities, ranging from the traditional to non-traditional, electoral to non-electoral, online to in-person, and partisan to consumer engagements—presumably intent on persuading elected officials to represent their views.Footnote 8 Yet only rarely have scholars tackled head on the question of whether the activities that citizens engage in have a substantive impact on public policy.Footnote 9 Despite well-established, rich literatures in American and comparative political behavior on the correlates, levels, and trends in political participation, those that link political action to specific policy outcomes are rare.Footnote 10
The 2010 Affordable Care Act (ACA) is a convenient illustration of our inattention to the efficacy of citizen engagement. How does one explain the historic passage of major health care reform intended to substantially increase the number of Americans with health insurance and access to health care, and how did it succeed in an era when the privileged positions of organized interests and economic elites are so well established?Footnote 11 Perhaps, one might argue, this was a partisan battle of wealthy elites or privileged interest groups, and supportive elites came out on top, producing an unusual and exceptional case of elite domination in the interests of the poor (or uninsured).Footnote 12 But explanations that focus solely on elites do not, and cannot, provide evidence as to whether the mass public had any role in such an important policy outcome.
Most accounts of the Affordable Care Act of 2010 have focused on elite politics and the legislative process, with little to no attention paid to the role of public opinion or citizen engagement.Footnote 13 Yet it is hard to imagine an explanation for this passage that does not require some attention to the nature of mass politics surrounding the legislation. As Martin Gilens and Benjamin Page suggest, even an elite-driven policy process might, for some particular issues or legislation, from time to time witness the “average citizen” playing more than a negligible role.Footnote 14
Knowing whether (or when) the “average citizen” or the “activist citizen” has an impact on policy decisions is an essential feature of democratic politics, but one that scholars of political institutions and policymaking have essentially ignored. Does citizen participation matter for public policy in the United States? Are citizen activists better represented in members of Congress’ roll call votes than those citizens who are not politically active? These are important questions that deserve our attention.
We begin by reviewing what scholars of elections, public opinion, and participation have concluded about who is represented in policies that are produced by elected officials, and whether citizens who participate are better represented than those who do not. We then use data from the 2012 Cooperative Congressional Election Study to test whether participants are better represented than non-participants on several specific issues on which members of Congress cast roll call votes.Footnote 15 We then estimate models of preference congruence between constituents and their representatives that include whether individuals participated, their partisanship, and income levels.Footnote 16
Our findings underscore the potential of both voting and other types of political activities to virtually eliminate the representational advantages of the wealthy—but our evidence suggests that this potential is realized only for highly-salient, highly-partisan issues. Although the optimism offered by this evidence is tempered by the reality that such enhanced representation is limited to highly-salient, highly-partisan issues, it nonetheless affirms that citizen engagement can be an effective linkage between citizens’ policy preferences and the actual policies produced by elected officials.
Who Is Represented?
The most visible recent research on legislative representation in the United States addresses the essential conflict between economic inequality and political equality that has long been an issue of public and academic concern.Footnote 17 Numerous studies substantiate the claim that the policy preferences of the rich are better represented than the poor.Footnote 18 Larry Bartels, for example, concludes that from 1989 through 2013, Senators and House members were disproportionately responsive to opinions of the wealthy, and that this disproportionate responsiveness was far greater for Republican representatives than for Democratic representatives.Footnote 19
Yet the claims of “differential responsiveness” made by Bartels, Gilens, and others have been challenged on both theoretical and methodological grounds. Bartels acknowledges that the observed responsiveness to high-income constituents may well simply reflect that these individuals share the attitudes of political and economic elites, rather than demonstrating that legislators actually respond more to these constituents.Footnote 20 Peter Enns argues that if the attitudes of the middle class are similar to those of the wealthy, then the middle class may also be “coincidentally” represented, and provides evidence on this point.Footnote 21 Branham, Soroka, and Wlezien also show that the wealthy and less wealthy often hold similar preferences—and even when their preferences differ, the preferred policies of the wealthy are not substantially more likely to be adopted.Footnote 22 Given the limited differences in opinion between the wealthy and less wealthy on most issues, then, the differential responsiveness thesis (as well as its policy implications) may be more tentative than initially thought.
The traditional studies of legislative representation upon which much of this scholarship relies examine roll call voting decisions of legislators as reflecting their ideological and partisan preferences, in addition to various aspects of the electoral context. Warren Miller and Donald Stokes’ innovative study matched constituents’ stated preferences on specific policy issues with how their elected representatives voted, advancing the study of representation in Congress beyond inferring constituent preferences from demographic characteristics. Footnote 23 Subsequent research following in this tradition highlights the critical role of (full district) constituency preferences and co-partisan preferences, both (i.e., independently) affirming the “electoral connection” as a fundamental aspect of legislative representation.Footnote 24 Co-partisan preferences, it is argued, matter more than general district opinion, as co-partisans are key to members’ re-election prospects.Footnote 25
A few studies have also suggested that legislators are more responsive to citizens who are politically active than to those who are not. Michael Barber, for example, finds that contributors to Senatorial elections are better represented than voters and co-partisans in Senatorial elections.Footnote 26 The most extensive evidence that participation is associated with policy outcomes, however, is the case of voter turnout. John Griffin and Brian Newman have shown that when voters differ from nonvoters in their policy preferences, voters’ preferences are weighted more heavily in Senators’ roll call votes.Footnote 27
This finding is consistent with research that shows that elected officials reward those who vote with policy benefits: members of Congress reward high turnout precincts with higher allocations of federal grant rewards; districts where participation is higher have more influence over their members of Congress on roll call votes than those who reside in districts where participation is lower; and (state) policy benefits are greater for those groups (e.g., public school teachers, the poor) whose turnout is higher.Footnote 28 Others have provided evidence of the policy consequences of voter turnout for industrialized democracies more generally.Footnote 29
Griffin and Newman identify two mechanisms that likely account for voters’ preferences being privileged over those of non-voters: electoral incentives, i.e., the election/selection hypothesis, and the superior communication of voter preferences to elected officials through voters’ engagement in other information-rich types of participation beyond voting (i.e., the communication hypothesis).Footnote 30 Their aggregate, state-wide analysis of Senatorial roll call voting from 1974–2002—the most direct evidence we have on the consequences of non-electoral participation on representation—provides tentative evidence in support of both hypotheses. Yet Bartels finds no support for turnout as the mechanism linking Senators’ roll call voting with the preferences of wealthy, middle income, or poor constituents, and only suggestive evidence regarding non-voting activities in linking legislator and constituent preferences.Footnote 31 Evidence on whether citizens who vote, or those who engage in political activities other than voting, are better represented than non-participants, then, is relatively thin, outdated, and indirect, surely falling short of the importance of this question to democratic politics in the United States today.
Preference Congruence on Roll Call Votes, CCES 2012: Four Issues
Our empirical evidence is drawn from the 2012 Cooperative Congressional Election Study (CCES), which includes questions about constituents’ political engagement, including (validated) voting in the general election, making political donations, and other political activities (attending a political meeting, engaging in campaign activity, or displaying signs).Footnote 32 We examine voting and donating separately, given their potentially distinctive implications for the study of political representation, but combine the other activities into an indicator of non-voting participation. The CCES also includes questions about individuals’ opinions on a number of political issues as well as (matched) roll call votes cast by members of Congress on those issues.Footnote 33
Our analytical strategy is distinctive in two important respects. First, we assess preference congruence separately by issue rather than combining respondents’ positions on multiple issues into one measure of policy preference and matching that to legislators’ roll call votes. As Miller and Stokes argue, it is likely that the representational linkages across issues will vary based on factors such as electoral context or the substance and salience of the issue at hand.Footnote 34 This argument has been advanced recently by Jeffrey Lax and Justin Phillips in their studies of representation in the US states.Footnote 35 An issue-specific approach allows us to examine variations based on the nature of the policy issue rather than assuming that representation is the same across an entire set of (substantively distinctive) issues or assuming citizens’ policy preferences are fully reflected in a unidimensional scale of policy preferences.Footnote 36
Second, we estimate preference congruence models for those issues on which participants and non-participants in a district support opposite policy positions. This strategy of focusing on “conflict districts”—those in which salient groups hold opposing policy positions—is analytically necessary in order to reach persuasive conclusions on whether participation makes a difference for the congruence between constituent opinion and members’ roll call votes.Footnote 37
We analyze four policies for which we have matched the roll call vote of each respondent’s representative with the CCES respondent’s reported policy preference, and for which we have sufficient variation among respondents and representatives to allow for analyzing dyadic representation: the repeal of the Affordable Care Act, the Keystone XL Pipeline, the repeal of “Don’t Ask, Don’t Tell” (DADT), and the Korean Free Trade Agreement.Footnote 38 For simplicity, in subsequent text we refer to the two bills that are repeals simply by the name of the policy issue (i.e., ACA and DADT), as our focus on congruence between respondent and representative renders unimportant whether the bill is proposed in support or repeal of an issue.
We derive our hypotheses regarding political participation and preference congruence from Kim Hill, Soren Jordan, and Patricia Hurley’s 2015 theory of dyadic representation, which consists of five models that vary as to the expected existence and causal direction(s) of preference congruence for different types of issues.Footnote 39 For our purposes, the key theoretical expectations are that the Instructed Delegate, Responsible Party, and Belief Sharing models anticipate preference congruence while the Trustee and Party-Elite Led models anticipate little to no such correspondence.
We assign specific issues to each model, as did Hill, Jordan, and Hurley, based on three criteria: issue easiness, partisan polarization, and how long the issue has been on the political agenda. For each issue assignment, we rely on the roll call vote record and substantive legislative details regarding the content and strategic aspects of the vote as reported in media coverage of the bills at the time.
We expect three issues will follow a Responsible Party model: the ACA, the Keystone XL, and DADT. Theoretically, issues associated with a Responsible Party model are those that are established, simple, and party-defining. We argue that government provision of health care for those in need, environmental protection, and gay rights had, by 2012, been on the political agenda (and salient) for a substantial amount of time, and were generally viewed by both the public and elected officials as distinctively partisan. Hence, we expect congruence on these three issues to be greater for participants and for co-partisans.
We identified the Korean Free Trade Agreement, in contrast, as reflective of the Trustee model. Theoretically, issues associated with a Trustee model are those that are complicated and cross-cutting (i.e., not party-defining). Our assessment that the issue was complicated is based on Hill, Jordan, and Hurley’s observation that many foreign policy issues are appropriately viewed as complicated in their initial phases, as well as more general arguments about citizens’ limited knowledge and understanding of foreign affairs issues.Footnote 40 As Kim Hill and Patricia Hurley have shown, legislators tend to have more freedom to deviate from party and constituency opinion when constituents have more limited information or interest in the issue.Footnote 41
The second criterion associated with the Trustee model is whether the issue was cross-cutting, one where “sizable portions of both parties might take the same position.”Footnote 42 This categorization reflects the opposite end of a continuum ranging from “party-defining” to “cross-cutting.” On this criterion, we observe, first, that the roll call vote on the Korean Free Trade Agreement was not nearly as partisan as the other issues that we study (all of which had single-digit levels of support by one party or the other; see appendix for details). And, second, we note that the roll call vote was supported by President Obama and the majority of Republicans, with media coverage describing the vote as a “rare moment of bipartisan accord.”Footnote 43
In assigning the Korean Free Trade issue to the Trustee model, then, we do not expect to observe greater preference congruence for participants or for co-partisans, as we do in the case of the Responsible Party model. Testing for the absence of constituency influence is appropriate as we have specific theoretical reasons to expect null results, and any such evidence provides some perspective on any “positive” effects identified in the analyses of Responsible Party issues.
Our dependent variables are measures of preference congruence between constituents and their representatives on each policy. If a respondent’s policy preference is the same as the roll call vote of their elected representative, they are congruent (coded “1”) on a policy issue. Conversely, if a respondent’s policy preference differs from the vote of their representative, they are non-congruent (coded “0”) on that policy issue.
As shown in table 1, participant congruence scores are generally higher than non-participants’ scores (with statistically significant differences), especially for Responsible Party issues. For example, preference congruence is higher for voters for the ACA and Keystone XL issues, and for the ACA, congruence is also higher for those active in additional activities. For none of the Responsible Party issues is preference congruence higher for those who donate compared to those who do not donate.
Table 1 Preference congruence of participants versus non-participants

Note: p-values are for tests of differences in proportions.
Somewhat weaker patterns emerge for DADT and for Korean Free Trade. Preference congruence of voters on DADT is not significantly higher than for non-voters suggesting that the “electoral connection” mechanism may not account for congruence on this issue. Preference congruence on Korean Free Trade is not significantly different for voters and non-voters—as we expected on a Trustee issue—but are significant for donors and for activists (at p = .07). This initial evidence provides some support for participation being relevant to preference congruence, but also suggests that the linkages are not necessarily simple or direct.Footnote 44 Nonetheless, we turn next to examine whether participation in activities other than voting enhances the preference congruence between elected officials and citizens, and whether preference congruence reflects the partisan linkages predicted by the Responsible Party model.
When Participation Matters: Responsible Party Issues
We expect that voters and co-partisans will enjoy greater preference congruence on Responsible Party issues, but not on Trustee issues. We estimate two models to identify the independent contributions of voting and of co-partisanship in testing the selection/re-election hypothesis. The first model of preference congruence consists only of voting, while the second model includes whether the individual identifies with the same party as their elected representative, whether they voted (validated), and an interaction term consisting of co-partisanship and voting.Footnote 45
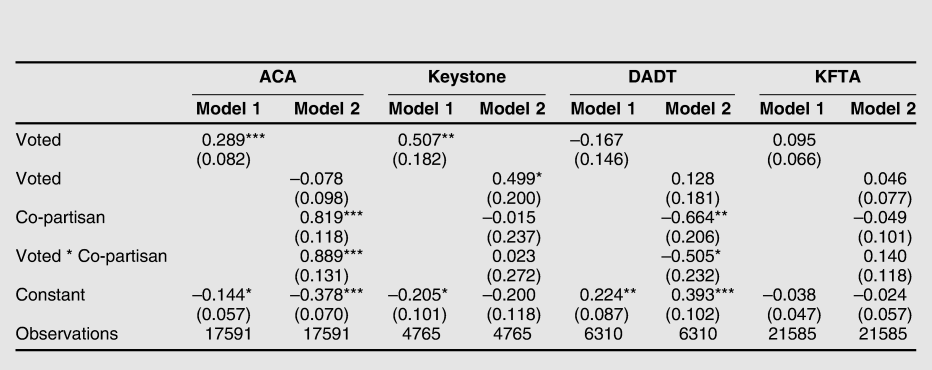
As shown in table 2, model 1, on two out of three of the Responsible Party issues—the ACA repeal and Keystone XL—the act of voting is associated with enhanced preference congruence. As reported in the second model for each issue, on only one issue do co-partisans enjoy greater preference congruence than non-co-partisans: the ACA. The difference in preference congruence for co-partisan, compared to non-co-partisan, voters, on the ACA repeal (graphed in the predicted margins plot in figure 1) is striking, and underscores the importance of representatives’ re-election constituencies in their roll call vote on the ACA.
Table 2 Simple models of preference congruence: The election/selection linkage
Standard errors in parentheses
* p < 0.05, ** p < 0.01, *** p < 0.001
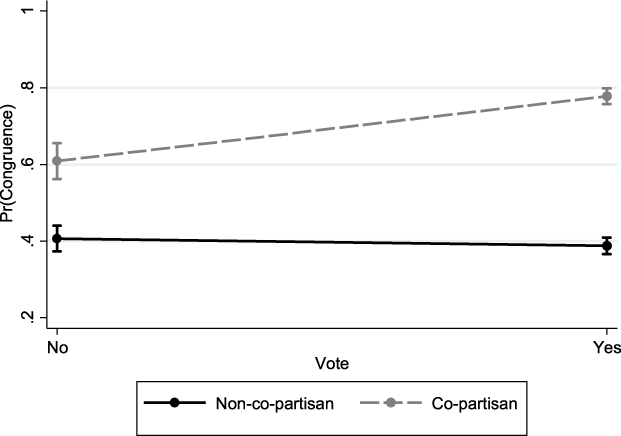
Figure 1 ACA preference congruence and co-partisanship: Marginal effects of voting
Note: Marginal effects plotted are based on the estimates reported in table 2, ACA model 2.
Less consistent evidence regarding co-partisanship is shown for Keystone XL and DADT, as reported for each issue in table 2, model 2. For Keystone XL, preference congruence is not enhanced for co-partisans, although voting remains a correlate of preference congruence. For “Don’t Ask, Don’t Tell,” neither voting, nor being co-partisans, enhances constituents’ preference congruence. Thus, our simple dyadic representation models suggest that voting enhances preference congruence for the ACA and Keystone, but not DADT, while heightened representation of co-partisans is evidenced only for the ACA.Footnote 46
Shifting to the Trustee issue, Korean Free Trade, table 2 shows, as expected, that the act of voting is not associated with greater preference congruence (table 2, model1). Also consistent with our expectations for Korean Free Trade, we find no association between co-partisanship and preference congruence. Thus, the evidence on our one Trustee model issue is consistent with our expectation of null findings.
Next, we test the communication hypothesis, which asserts that engaging in additional types of activity beyond voting accounts for the superior representation of voters. We begin by asking whether those who donate money or those who participate in non-electoral activities enjoy greater preference congruence.Footnote 47 To answer this question we estimate the same models reported in table 2, substituting donating and non-voting political activities as the participation of interest. We present these models only for the two issues for which the election/selection hypothesis was confirmed: the ACA and Keystone XL.
If the communication hypothesis is correct, and it is participating in ways other than voting that enhances voters’ preference congruence, then testing whether there is an association between these alternative types of participation and preference congruence should also yield significant estimates. And if the conventional wisdom that contributors receive more policy benefits (i.e., greater preference congruence) than non-contributors is correct for these issues, then we should observe significant and positive coefficients on donating. If we cannot document that participants in non-voting participation enjoy greater preference congruence than non-participants, then the logic of the communication hypothesis fails.
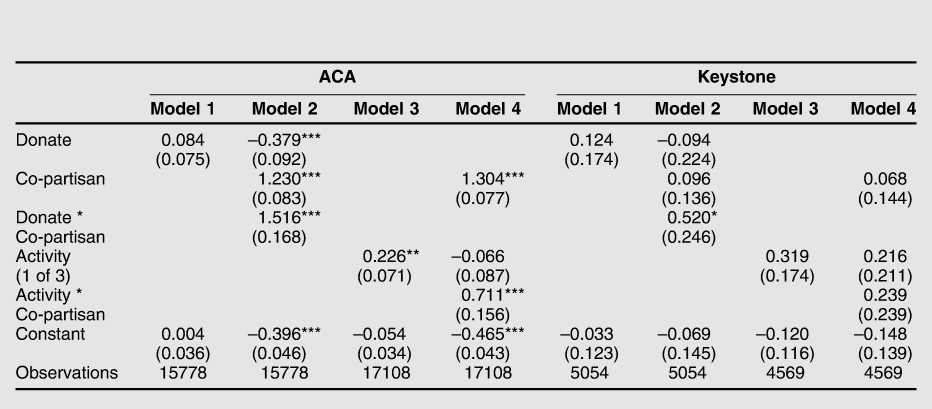
As shown in table 3, we once again see distinctive results for the two issues. For the ACA, both donating and participating in other activities enhances the preference congruence of co-partisans. The predicted margins of each type of participation plotted in figure 2 and 3 illustrate the importance of these activities for enhancing preference congruence. They also underscore the critical importance of partisanship for the association between participation and preference congruence: co-partisans who participate are significantly more congruent with their members than are co-partisans who do not. For non-co-partisans, participatory acts fail to provide the enhanced congruence implied by the communications hypothesis.
Table 3 ACA and Keystone: The plausibility of the communication linkage
Standard errors in parentheses
* p < 0.05, ** p < 0.01, *** p < 0.001
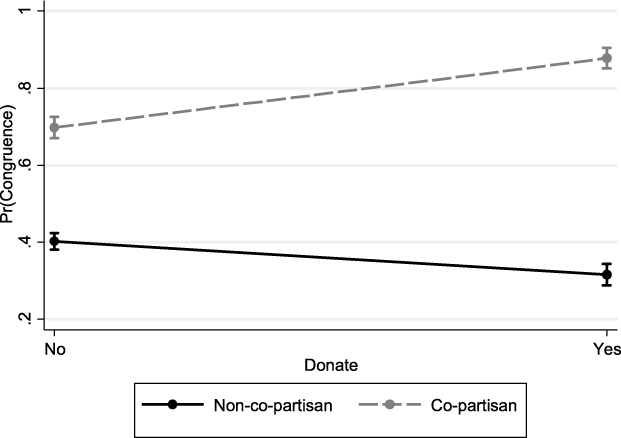
Figure 2 ACA preference congruence and co-partisanship: Marginal effects of donating
Note: Marginal effects plotted are based on the estimates reported in table 3, ACA model 2.
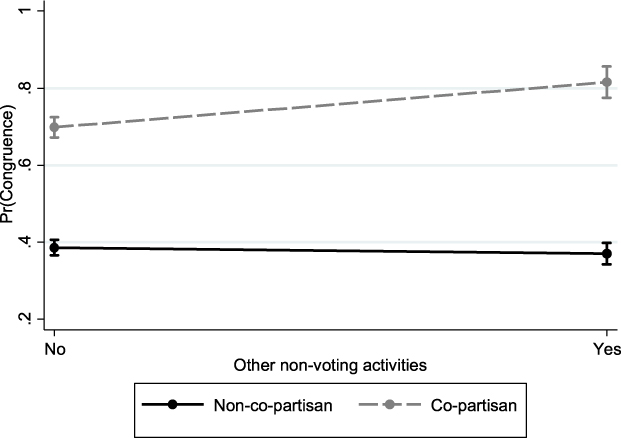
Figure 3 ACA preference congruence and co-partisanship: Marginal effects of other non-voting activities
Note: Marginal effects plotted are based on the estimates reported in table 3, ACA model 4. “Other non-voting activities” refers to whether the respondent reports having attended a political meeting, done campaign work, or displayed a political sign in the past year.
The evidence for preference congruence on Keystone XL presented in table 3 differs from that on the ACA. Specifically, while co-partisan donations are associated with enhanced preference congruence, engaging in other activities is not. As a result, we have mixed evidence, at best, that alternative forms of participation account for voters’ greater preference congruence on Keystone XL.Footnote 48 Thus, only for the ACA do participants experience greater preference congruence than non-participants. This indicates that only for the ACA does the basic assumption of the communication hypothesis hold. Footnote 49
Participation, Communication and the Privileged Representation of the Wealthy
Documenting the superior preference congruence of voters, activists, and co-partisans in the case of the ACA begs the question of whether “the wealthy” were also privileged in their representation on this Responsible Party issue. Indeed, they were. Table 4 reports the mean preference congruence on the ACA by income thirds of the CCES sample, and shows that the poorest third of individuals enjoyed significantly less preference congruence than the middle third and highest third of respondents (with the difference between the middle and highest thirds being statistically indistinguishable).
Table 4 ACA preference congruence by income
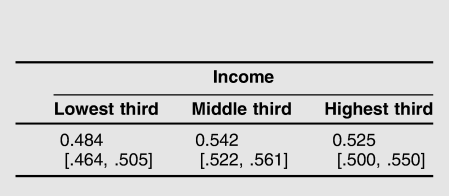
Note: 95% Confidence intervals in brackets. Observations=17,921
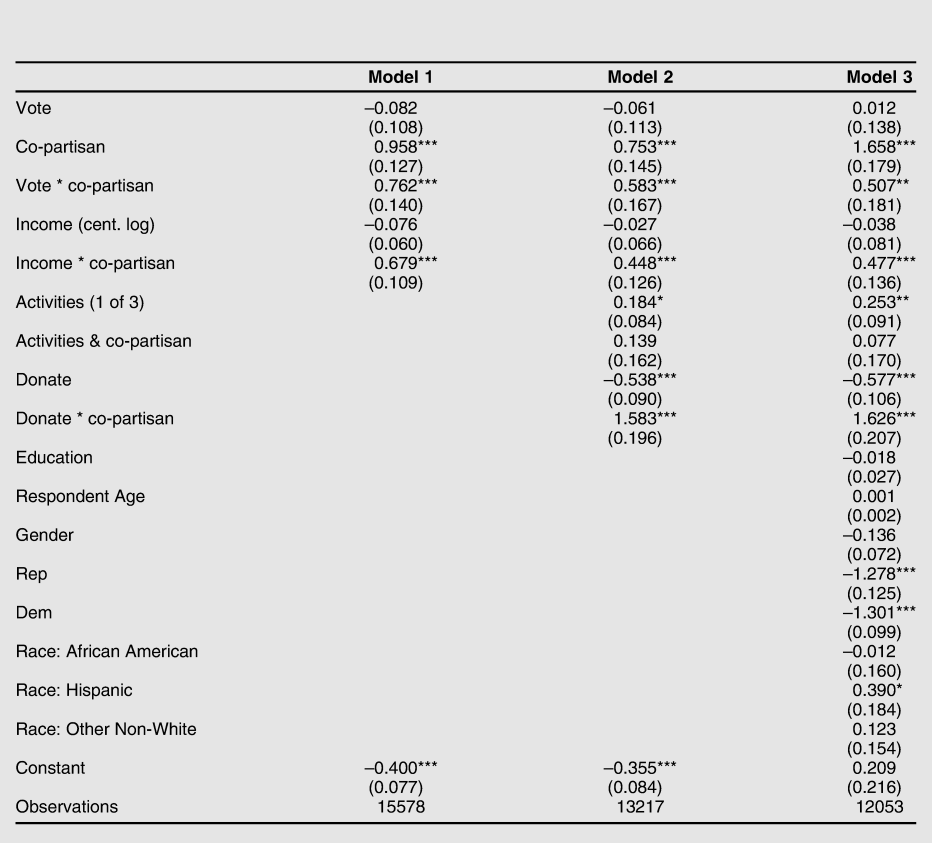
But might voting and political activism help to counter the over-representation of the wealthy in the case of the ACA? To answer this question, we return to the simple model consisting of voting and co-partisanship (as estimated for the ACA in table 2) and add to that model individuals’ (family) income and an interaction term consisting of income and co-partisanship as two additional correlates of preference congruence.
The estimates for this model for the ACA are shown in table 5, model 1, and confirm that co-partisan voters enjoy a greater level of preference congruence than non-co-partisan voters. The estimates also suggest that wealthier co-partisans enjoy greater preference congruence than poorer non-co-partisans. The importance of co-partisanship to the greater representation of the wealthy is illustrated in the predicted marginal effects plot in figure 4. Wealth enhances preference congruence on the ACA, but only for co-partisans. The preference congruence of wealthier non-co-partisans is essentially the same as that for poorer non-co-partisans. That the privileged representation of the wealthy is contingent on co-partisanship reflects the critical importance of partisanship, as we expected on this Responsible Party issue.
Table 5 ACA preference congruence by participation acts, co-partisanship, and income
Standard errors in parentheses
* p < 0.05, ** p < 0.01, *** p < 0.001
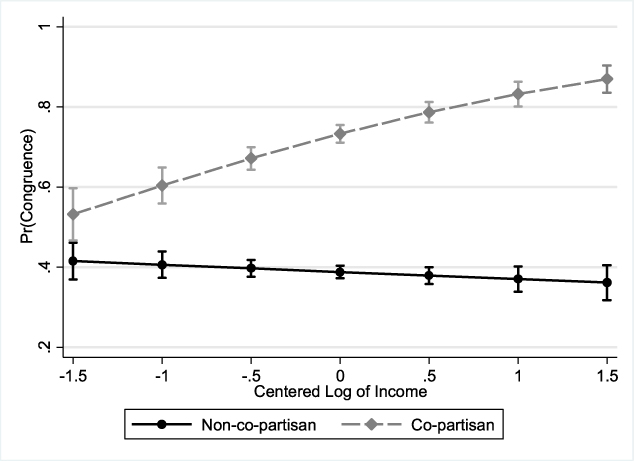
Figure 4 ACA preference congruence, co-partisanship and income: Marginal effects of voting
Note: Marginal effects plotted are based on the estimates reported in table 5, model 1.
Next, we provide an additional test of the communication hypothesis by estimating a model of preference congruence on the ACA that includes each type of participation, as well as income, and interactions with co-partisanship. To the extent that participation other than voting is associated with enhanced preference congruence, we should see significant effects of participation other than voting as correlates of preference congruence, and a weaker association between voting and preference congruence. We might also expect to see a weaker association between co-partisan wealth and preference congruence.
As shown in table 5, model 2, the interaction estimate for activism and co-partisanship is not significant, whereas the estimates for donating are: Preference congruence is enhanced for individuals who make political contributions, but co-partisans enjoy this advantage more than non-co-partisans. Thus, on the ACA, among individuals who vote, and among those who donate, co-partisans are more preference congruent than are non-co-partisans. The association between political activity and preference congruence, however, is not conditioned on co-partisanship.
For a more demanding test of our hypotheses, we added demographic characteristics in the final model reported in table 5. The estimates of this model are broadly consistent with those reported for model 2, underscoring the critical role of co-partisanship in understanding how voting and other types of political participation enhance preference congruence. They also confirm that wealthier individuals are privileged in their preference congruence with elected officials, independent of other demographic characteristics of either participants or partisans.
The complexity of this model of preference congruence makes simple assessments of substantively important associations difficult. To highlight perhaps the most important substantive implication of the model 3 estimates, we show in figure 5 the predicted margins for the interactive effect of income on congruence for those who “only” vote (the “no alternative behaviors” plot) in comparison to those who vote and are also active in additional ways (“all alternative behaviors” plot).
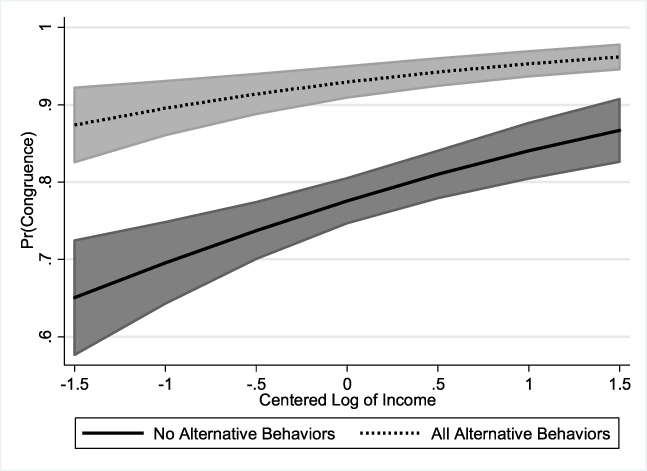
Figure 5 ACA preference congruence, co-partisanship and income: Marginal effects of participation beyond voting
Note: Marginal effects plotted are based on the estimates reported in table 5, model 3. “No Alternative Behaviors” refers to respondents who vote, but do not engage in additional political activities. “Alternative Behaviors” refers to respondents who vote, and also engage in the two types of additional political acts investigated in this study, “Donating,” and “Non-voting Participation Activities” (attended a political meeting, done campaign work, or displayed a political sign in the past year).
As shown in figure 5, engaging in participation beyond voting increases constituents’ congruence with their representatives at all levels of income—but those at the lower end of the income scale get the greatest boost in congruence due to political activity beyond voting. That is, among voters, the difference in estimated preference congruence for those who participate in other ways and those who do not participate in other ways is greatest for the poorest individuals. The importance of this substantial difference is highlighted by the fact that poor voters who participate in multiple activities experience a level of preference congruence similar to that of the wealthiest voters who do not participate in other ways. At a time when income inequality and its impact on policy has become increasingly salient, this finding for the ACA points to one policy issue for which additional political activity makes a difference for preference congruence, even, and especially, among the less affluent.
To further illustrate the potential power of citizen engagement to overcome the representational advantages of the wealthy, we also estimate several models of preference congruence using an index measuring the number of activities that constituents undertake. These results are reported in table 6, where the first model includes the participation index only; the next includes co-partisanship; the next income; and the final model includes a series of interaction terms between co-partisanship, income, and participation.
Table 6 ACA policy congruence by participation index, income, and co-partisanship
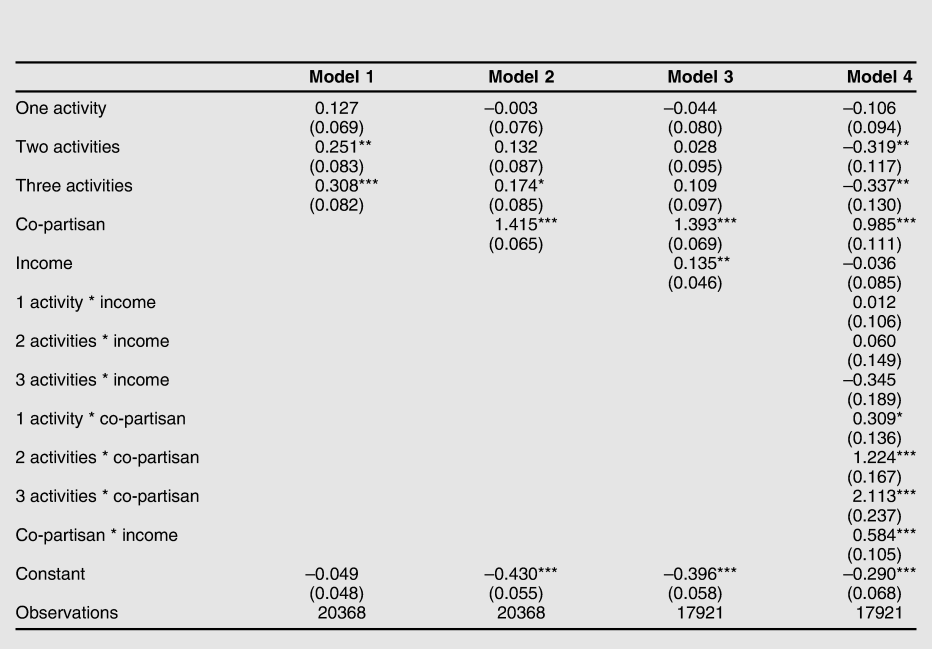
Notes: The participation index ranges from 0 to 3. It is constructed by adding the three behaviors analyzed separately in prior models: “Vote,” a validated voting in the general election; “Donate,” whether respondent reports having made a political contribution in the past year; and “Non-Voting Participation Activities,” including whether the respondent reports having attended a political meeting, done campaign work, or displayed a political sign in the past year.
Standard errors in parentheses. * p < 0.05, ** p < 0.01, *** p < 0.001
Each of these sets of estimates is consistent with our previous findings using other models and measures. In the final model, we see that co-partisanship moderates the effects of participation on ACA preference congruence. Once co-partisanship is included in the model, we see no enhanced effect of income save for that which is conveyed through legislators responding to higher income co-partisans.
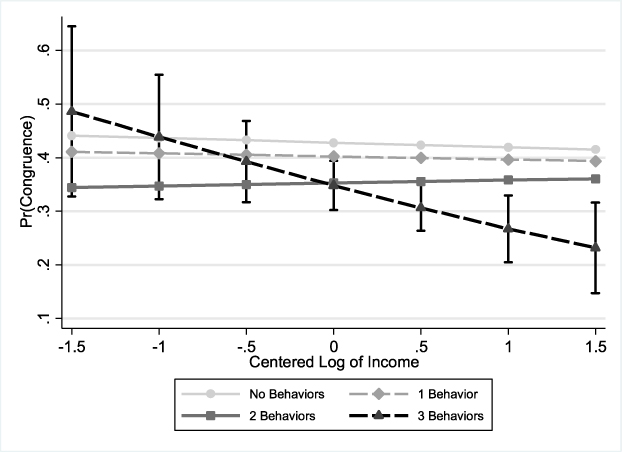
To underscore the importance of this finding, we provide graphs of the predicted probabilities of income on preference congruence, estimated separately for co-partisans (in figure 6) and non-co-partisans (in figure 7). As shown in figure 6, for co-partisans, responsiveness is greater for wealthier voters at all levels of citizen engagement—except for those who participate at the highest levels. For these fully active citizens, increasing levels of income do not enhance preference congruence with their elected officials. For those who are least active, preference congruence increases substantially as income increases, with relatively small differences between activists and non-activists at the highest levels of income.
In contrast, as shown in figure 7, for non-co-partisans, the probability of congruence is relatively flat across levels of income, except for individuals who engage in all three activities, where congruence actually decreases across income levels. That is, the wealthiest, active non-co-partisans are actually less well represented by their legislators’ roll call votes than the poorest of those non-co-partisans. This highlights once again the critical role of partisanship to understanding preference congruence on highly salient, partisan issues.
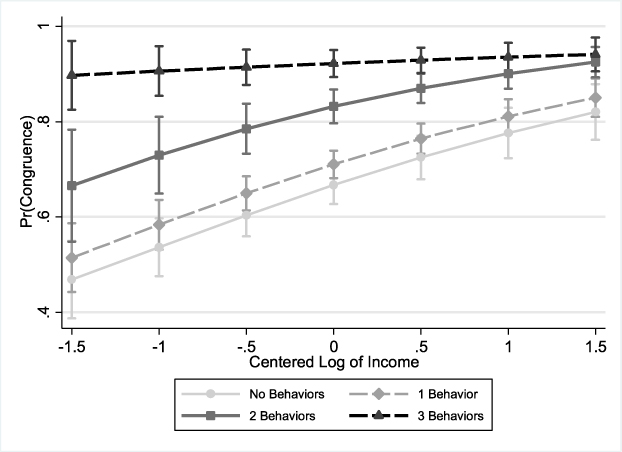
Figure 6 ACA preference congruence and income: Marginal effects of overall participation (co-partisans)
Notes: Marginal effects plotted are based on the estimates reported in table 6, model 4. The participation index ranges from 0 to 3. It is constructed by adding the three behaviors analyzed separately in prior models: “Vote,” a validated voting in the general election; “Donate,” having made a political contribution in the past year; and “Non-Voting Participation Activities,” attending a political meeting, doing campaign work, or displaying a political sign in the past year.
Participation, Representation, and Partisanship
Does citizen participation influence public policy? Our answer to that question is framed from the perspective of traditional studies of the linkages between citizens’ policy preferences and legislators’ roll call votes. Our primary interest was not in untangling the likely reciprocal relationship between the two, but instead in examining how citizens’ political engagement might enhance the linkage between citizens and legislators. We also investigated whether wealthier citizens enjoy greater preference congruence with their elected representatives than do the poor, and how activism on the part of citizens might counter this differential responsiveness.
Our theoretical expectations anticipated that the answers to these questions would vary depending on the issue at hand—whether simple or complex, new or old, party polarized or not. This approach to move studies of dyadic representation beyond aggregate measures of preference congruence provides a more nuanced understanding of preference congruence and how it varies across types of issues. Despite the complexity of issue-specific analyses, our results are fairly consistent with our theoretical expectations.
Generally, the findings affirm the positive associations between voters’ and co-partisans’ preferences with legislators’ roll call votes, but only for those issues where we expect a traditional Responsible Party model of representation. Greater representation for non-voting participants is observed only for a single policy issue (the ACA repeal), where both voting and additional political activity enhance the congruence between individuals’ preferences and legislators’ roll call votes.
Our evidence thus points to the importance of both voting and additional acts of political participation (whether controlling for individuals’ demographic characteristics or not) on this one issue—not on all issues, and not even on all Responsible Party model issues. For the ACA, then, we find support for the plausibility of the “communication” hypothesis: political activity in addition to voting is associated with increased preference congruence, which may help explain the reason why voting enhances policy representation for this policy issue. That this linkage is observed only for the most highly visible, highly contested partisan issue of the Obama administration underscores the importance of attention to policy issue type in efforts to investigate the linkages between citizen participation and policy outcomes.
For Keystone XL, our evidence suggests that elected officials indeed respond to voters more than non-voters. On this issue, then, we affirm the selection/election hypothesis, a defining expectation central to studies of representation for decades, and offer suggestive evidence that co-partisan donors, but not activists, enjoying greater congruence on this issue. For the Korean Free Trade issue—where we anticipated a Trustee model of representation—neither voting, co-partisanship, nor additional types of participation enhance preference congruence. Constituent opinions are simply of little import to members’ roll call votes on this issue, as is the case for constituent political activities. This conclusion is consistent with Miller and Stokes’ original (1963) argument, and further underscores the importance of issue-specific analyses in studies of representation. The use of aggregate policy indices that is common in representation studies today is not without its limitations.
Additional evidence is required, however, to demonstrate the extent to which these findings—based on only a handful of issues in one election year—might be replicated on new issues, ones that might mobilize more or fewer citizens in different ways, in future sessions of Congress. Theoretically, extending the Hill, Jordan, and Hurley framework for representation models to make the assignment of issues to model types more precise could be valuable. Such extensions might help to sort out whether unexpected null findings on “Don’t Ask, Don’t Tell” and the weak findings on Keystone XL reflect limitations of issue assignment or, instead, fundamental limitations to the theoretical argument. Understanding the extent to which the limited responsiveness to constituent preferences on these two issues reflects elite-level strategies, institutional factors, or constituent issue awareness and information levels surely requires further theoretical and analytical attention. Indeed, at a time of seeming hyper-partisanship, it is all the more important to know how representation on Responsible Party issues actually works (or does not).
Our findings point in several ways to the relevance of wealth to democratic politics in the United States. Our empirical evidence on whether affluence matters for preference congruence focuses on the one issue for which we had clear, consistent evidence that voters, activists, and co-partisans enjoy greater preference congruence than nonvoters, non-activists, and non-co-partisans. We show that the wealthy—but especially the wealthy who are politically active and co-partisan—do indeed enjoy greater preference congruence. More work needs to be done to assess whether such findings would emerge for other highly salient Responsible Party issues.
In addition, future research might consider more fully whether differences in political preferences across income groups limit the impact of participation on preference congruence. Studying participatory activities across a set of highly-partisan, highly-salient issues in terms of both policy support and preference congruence across income groups would be a useful extension of what we have demonstrated using data from 2012. Perhaps the new presidential administration and Congress will offer us the opportunity to study these types of issues.
We have also provided new and unique evidence that engaging in political activity other than voting allows less-wealthy individuals to enjoy greater preference congruence. For an issue like the ACA, political participation can provide an important boost in representation, and especially for co-partisans, that can nearly level the playing field for the least wealthy if they are also politically active.
Participating beyond voting seems to be an important mechanism linking citizens to their elected representatives for particular types of policy issues, and strategic action that takes advantage of this insight might help to counter the general representational advantages of the wealthy in American democracy. Perhaps the media clips showing high levels of conflict at Republican town hall meetings over the course of the “repeal and replace Obamacare” deliberations were more than just drama—and truly allowed constituent voices to be heard more clearly.
This slight ray of optimism in the future of democratic politics in the United States may not, of course, counter the post-2016 election cloud of highly-polarized elites in Congress and seemingly energized and committed (partisan) voter bases. Indeed, highly-responsive political parties in Congress, with highly-partisan voter support, were precisely what the American Political Science Association’s “Toward a More Responsible Two-Party System” report called for.Footnote 50 Our empirical evidence suggests that members of Congress are especially—and perhaps almost exclusively—responsive to the opinions of their re-election constituency. Whether collective representation—beyond the dyadic linkages we studied—is sufficient to counter the potential de-mobilizing effects of the seeming intransigence of partisanship today is yet to be seen.
Supplementary Materials
1. Replication do-file
2. Online Appendix
A. Participation Measures
B. Issue Inclusion and Assignment to Theoretical Models
C. Win Ratio Analyses

