


Non-technical Summary
Planktonic foraminifera are single-celled marine protists, roughly the size of a grain of sand. They have an extremely detailed fossil record: a teaspoonful of seafloor sediment contains more than 1000 fossil shells. Some species have unusually ornamental shapes, but it is not clear why or how these shapes evolved. Here, we study the developmental changes that led to the speciation of one particularly ornate species: Globigerinoidesella fistulosa. We find that changes in the developmental timing of adult life stages likely account for the complex morphology. This study highlights the complex morphological and developmental changes required to produce unusual shell shapes and highlights the importance of developmental changes in evolutionary origination.
Introduction
Trait variation among individuals provides the constituents for evolution through natural selection. Since the seminal works of Gould (Reference Gould1977) and Alberch et al. (Reference Alberch, Gould, Oster and Wake1979), the importance of heterochrony in facilitating trait variation, and the resultant link between ontogeny and phylogeny, has become increasingly appreciated in the field of evolutionary developmental (paleo)biology (Keyte and Smith Reference Keyte and Smith2014; Dobreva et al. Reference Dobreva, Camacho and Abzhanov2022). Heterochrony may be broadly defined as a “change to the timing or rate of developmental events, relative to the same events in the ancestor” (McNamara Reference McNamara2012: p. 205; see comparable definitions in Gould [Reference Gould1977]; Alberch et al. [Reference Alberch, Gould, Oster and Wake1979]; McNamara [Reference McNamara1986]; McKinney and McNamara [Reference McKinney and McNamara1991]) and is widely regarded as having a central role in morphological evolution following the formalizations of Gould (Reference Gould1977) and Alberch et al. (Reference Alberch, Gould, Oster and Wake1979).
There are two expressions of heterochrony, termed paedomorphosis and peramorphosis (Alberch et al. Reference Alberch, Gould, Oster and Wake1979; McNamara Reference McNamara1986). These are not processes, as is often erroneously assumed (see discussion in McNamara [Reference McNamara1986]), but resultant expressions of trait morphology. Paedomorphosis results from a descendant morphospecies passing through fewer ontogenetic stages than its ancestor so that the descendant exhibits adult characters that were juvenile characters in the ancestor (Alberch et al. Reference Alberch, Gould, Oster and Wake1979; McNamara Reference McNamara1986). Conversely, peramorphosis results from the descendant passing through more ontogenetic stages than its ancestor, with the descendant exhibiting adult characters beyond that of the ancestor (Alberch et al. Reference Alberch, Gould, Oster and Wake1979; McNamara Reference McNamara1986).
Peramorphosis and paedomorphosis each result from three different (and opposing) heterochronic expressions. Peramorphosis includes hypermorphosis (continued development past the ancestor stage; Fig. 1A), pre-displacement (earlier onset of trait development in the descendant; Fig. 1B), and acceleration (faster development in the same amount of ontogenetic time as the ancestor; Fig. 1C). Paedomorphosis can result from hypomorphosis (reduced duration of development; Fig. 1D), post-displacement (later onset of trait development; Fig. 1E), or deceleration (slower trait development in the same amount of ontogenetic time as the ancestor; Fig. 1F). Note that following Reilly et al. (Reference Reilly, Wiley and Meinhardt1997), two of the terms, hypomorphosis and deceleration, have been chosen to replace progenesis and neoteny of Alberch et al. (Reference Alberch, Gould, Oster and Wake1979).

Figure 1. Schematic representations of trait development for the six types of heterochrony: A, hypermorphosis, wherein traits develop for longer in the descendant than the ancestor, while the rate and onset of trait development remain the same; B, pre-displacement, wherein the onset of descendant trait development starts earlier, while the rate of development remains the same; C, acceleration, wherein the rate of trait development is higher in the descendant species, while the onset of development is the same as the ancestor; D, hypomorphosis, wherein traits stop developing earlier in the descendant than the ancestor; E, post-displacement, wherein the onset of descendant trait development starts later than in the ancestor; and F, deceleration, wherein the rate of trait development is slower in the descendant than the ancestor.
The fossil record is integral in studies assessing the role of heterochrony in the evolution of novel forms, as the traits of interest are often morphological. However, a long-acknowledged problem for paleontologists is determining the ontogenetic age of fossils. Although it is possible to infer age in some groups, such as fossil bivalves (Jones and Gould Reference Jones and Gould1999), trilobites (Whittington Reference Whittington1957), fish (Trueman et al. Reference Trueman, Chung and Shores2016), trees (Falcon-Lang Reference Falcon-Lang2015), and dinosaurs (Sander and Klein Reference Sander and Klein2005; Sanchez et al. Reference Sanchez, de Ricqlès, Schoch and Steyer2010), age is a poorly constrained parameter in most fossil organisms. To this end, size is often used as a proxy for age, and assessments of heterochrony are often identified under the framework of “allometric heterochrony” (McKinney Reference McKinney1986; McKinney and McNamara Reference McKinney and McNamara1991; Wei Reference Wei1994). Allometry describes trait covariation with body size according to a power relationship (Huxley Reference Huxley1932) and is therefore ideally suited to studies of heterochrony in the fossil record.
Planktonic foraminifera are a perfect target group for investigations into heterochrony. They have one of the best and most complete fossil records of any group (e.g., Norris Reference Norris2000; Lazarus Reference Lazarus, McGowan and Smith2011), phylogenetic relationships between taxa are well resolved (Kennett and Srinivasan Reference Kennett and Srinivasan1983; Olsson et al. Reference Olsson, Hemleben, Berggren and Huber1999; Pearson et al. Reference Pearson, Olsson, Huber, Hemleben and Berggren2006a; Aze et al. Reference Aze, Ezard, Purvis, Coxall, Stewart, Wade and Pearson2011; Wade et al. Reference Wade, Olsson, Pearson, Huber and Berggren2018), and every chamber from the first (proloculus) to the last is retained through growth. Brummer et al. (Reference Brummer, Hemleben and Spindler1986, Reference Brummer, Hemleben and Spindler1987) proposed five ontogenetic stages (prolocular, juvenile, neanic, adult, and terminal stages) in most morphospecies of planktonic foraminifera. Transitions from one ontogenetic stage to the next are determined by a size threshold, rather than chamber number (Brummer et al. Reference Brummer, Hemleben and Spindler1986, Reference Brummer, Hemleben and Spindler1987; Wei et al. Reference Wei, Zhang and Wray1992; Schmidt et al. Reference Schmidt, Rayfield, Cocking and Marone2013; Caromel et al. Reference Caromel, Schmidt, Fletcher and Rayfield2016, Reference Caromel, Schmidt and Rayfield2017), so size is a good approximation for ontogenetic age in planktonic foraminifera. The concept of heterochrony could potentially explain the apparent lack of functional morphology in some foraminiferal traits. The evolution of traits without known functions could occur if a particular ontogenetic stage, rather than morphology, is selected for. Therefore, heterochrony presents an additional framework to study planktonic foraminifera evolution.
Here we investigate whether heterochrony took place during the origination of the planktonic foraminifer Globigerinoidesella fistulosa, a species characterized by an unusually ornate, digitate morphology with numerous protuberances on its final chamber(s) (Fig. 2). G. fistulosa evolved from the Trilobatus sacculifer plexus when a small subset of the T. sacculifer population (which includes morphospecies Trilobatus trilobus, Trilobatus immaturus, and Trilobatus quadrilobatus; see Poole and Wade [Reference Poole and Wade2019] for taxonomic discussion) increased in size, developed more extreme protuberances, and gradually diverged into G. fistulosa (Parker Reference Parker1967; Chaisson and Leckie Reference Chaisson and Leckie1993; Poole and Wade Reference Poole and Wade2019; Fig. 2). The complex shell shape of G. fistulosa stands out among planktonic foraminifera (see Chen et al. Reference Chen, Kang, Kimoto, Song, Yin, Swisher, Lu, Kuo, Huang and Lo2023), which are typically limited in morphological variation to the same basic shapes (Norris Reference Norris1991). To understand the drivers of morphological innovation in foraminifera, we quantify test size and shape in T. sacculifer and G. fistulosa before and after the origination of G. fistulosa. We compare our results to previously published cases of heterochrony in planktonic foraminifera to assess whether developmental expressions can be rewired to overcome developmental constraints.

Figure 2. A, Trilobatus sacculifer (re-illustrated from Poole and Wade Reference Poole and Wade2019: fig. 9D); B, an intermediate form between T. sacculifer and Globigerinoidesella fistulosa (re-illustrated from Poole and Wade Reference Poole and Wade2019: fig. 11L); C, G. fistulosa (re-illustrated from Poole and Wade Reference Poole and Wade2019: fig. 13J). All specimens from Ocean Drilling Program (ODP) Site 1115. Scale bars, 100 μm.
Materials and Methods
Study Species
Globigerinoidesella fistulosa is a short-ranging morphospecies with a distinct stratigraphic range. Both its origination and extinction have been used as markers in Neogene planktonic foraminiferal biostratigraphy (Wade et al. Reference Wade, Pearson, Berggren and Pälike2011). Globigerinoidesella fistulosa evolved from the Trilobatus sacculifer plexus in the late Pliocene (King et al. Reference King, Wade, Liska and Miller2020; Raffi et al. Reference Raffi, Wade, Pälike, Gradstein, Ogg, Schmitz and Ogg2020) and went extinct in the early Pleistocene, marking the base of Subzone PT1a (Raffi et al. Reference Raffi, Wade, Pälike, Gradstein, Ogg, Schmitz and Ogg2020). It is assigned to the genus Globigerinoidesella (El-Naggar Reference El-Naggar1971), as the radially elongated protuberances on the final chambers are considered a genus-level characteristic (Spezzaferri et al. Reference Spezzaferri, Kucera, Pearson, Wade, Rappo, Poole, Morard and Stalder2015). The phylogenetic relationships are well constrained, and the morphospecies T. sacculifer and G. fistulosa are morphologically disparate (Poole and Wade Reference Poole and Wade2019), but intermediate specimens bridge the morphological evolution (Fig. 2) and remain as common as G. fistulosa sensu stricto (s.s.) throughout the stratigraphic range of G. fistulosa (Poole and Wade Reference Poole and Wade2019). Trilobatus sacculifer has a much longer stratigraphic range. It evolved in the early Miocene (Kennett and Srinivasan Reference Kennett and Srinivasan1983) and persists throughout the stratigraphic range of G. fistulosa. It is still alive today, occupying the mixed layer (Rebotim et al. Reference Rebotim, Voelker, Jonkers, Waniek, Meggers, Schiebel, Fraile, Schulz and Kucera2017) in warm tropical oceans and harboring some of the highest concentrations of algal photosymbionts in modern planktonic foraminifera (Kucera Reference Kucera and De Vernal2007; Takagi et al. Reference Takagi, Kimoto, Fujiki, Saito, Schmidt, Kucera and Moriya2019). Geochemical data indicate that G. fistulosa had the same habitat as members of the T. sacculifer plexus (Poole Reference Poole2017).
Materials
Ocean Drilling Program (ODP) Site 1115 is located in the western Woodlark Basin, western Pacific (9°11.382′S, 151°34.437′E) at a water depth of 1149 m; Shipboard Scientific Party 1999; Fig. 3). Hole 1115B was chosen primarily because the G. fistulosa specimens are abundant and well developed. The lowest occurrence of G. fistulosa is difficult to establish at Hole 1115B. The ancestor T. sacculifer occasionally grows incipient protuberances, which gradually gave rise to G. fistulosa. We follow Poole and Wade (Reference Poole and Wade2019) and limit G. fistulosa s.s. to specimens typically possessing four broad, flattened final chambers that increase rapidly in size, with one or more finger-like protuberances, multiple supplementary apertures, and a distinct lip on the primary aperture. Therefore, our lowest occurrence of G. fistulosa s.s. is higher than indicated for Hole 1115B by Shipboard Scientific Party (1999), who used an older, less-restricted taxonomic concept. Our sampling method was to examine end-members, that is, near the first occurrence of G. fistulosa s.s., and samples toward the end of the G. fistulosa range. To ensure maximum morphological differentiation with its ancestor, we analyzed 11 pre-speciation late Pliocene samples containing solely T. sacculifer plexus specimens (Trilobatus trilobus, Trilobatus immaturus, Trilobatus sacculifer, and Trilobatus quadrilobatus) from 24X (216.82–224.02 m below seafloor [m bsf]), and one time slice close to the top of the stratigraphic range of G. fistulosa, containing both G. fistulosa and contemporary specimens of the T. sacculifer plexus. Three closely spaced samples were analyzed from core 10H (mean depth: 88 m bsf), where T. sacculifer, G. fistulosa, and intermediate specimens are all present in each sample. Samples from 10H were pooled to increase the sample size and statistical power. Samples were dry sieved at the 250 μm size fraction to avoid inclusion of juvenile specimens. Adult specimens of both study species are much larger than 250 μm across, and there was no abrupt cutoff in the size data (see “Results” section and figures cited therein), so there was minimal risk of missing smaller adult specimens. All samples were picked for all T. sacculifer plexus and G. fistulosa tests, resulting in more than 900 specimens. Specimens were positioned in umbilical view and imaged using a camera mounted on a light microscope. Images were analyzed using the Image Pro Premier software v. 9.3.

Figure 3. Location of Ocean Drilling Program (ODP) Site 1115 in the western Woodlark Basin, equatorial Pacific.
Stratigraphy
Chuang et al. (Reference Chuang, Lo, Zeeden, Chou, Wei, Shen, Mii, Chang and Tung2018) provide an integrated stratigraphy for Site 1115, incorporating paleomagnetic reversal events with planktonic foraminifer and calcareous nannofossil bioevents and high-resolution oxygen isotope analysis tied to the benthic foraminifer oxygen isotope reference curve (LR04 stack; Lisiecki and Raymo Reference Lisiecki and Raymo2005). Unfortunately, the Chuang et al. (Reference Chuang, Lo, Zeeden, Chou, Wei, Shen, Mii, Chang and Tung2018) integrated stratigraphy ends slightly younger than the oldest part of our studied interval. We used biostratigraphy (Poole Reference Poole2017; Chuang et al. Reference Chuang, Lo, Zeeden, Chou, Wei, Shen, Mii, Chang and Tung2018) and magnetostratigraphy (Takahashi et al. Reference Takahashi, Cortese, Frost, Gerbaudo, Goodliffe, Ishikawa, Lackschewitz, Huchon, Taylor and Klaus2001) to determine the age of the samples studied, extrapolating back in time from the tuned record of Chuang et al. (Reference Chuang, Lo, Zeeden, Chou, Wei, Shen, Mii, Chang and Tung2018) (Fig. 4, Table 1). Chuang et al. (Reference Chuang, Lo, Zeeden, Chou, Wei, Shen, Mii, Chang and Tung2018) used the magnetochronology of Cande and Kent (Reference Cande and Kent1995), and we have refrained from updating the Site 1115 record to more recently published magnetochronologies to keep our timescales consistent. Note, the biochronology of the bottom of the Pulleniatina L5 coiling shift in Chuang et al. (Reference Chuang, Lo, Zeeden, Chou, Wei, Shen, Mii, Chang and Tung2018) is significantly older (~127 kyr) than calibrations from other Indo-Pacific sites (Pearson et al. Reference Pearson, Young, King and Wade2023), thus we have not included this event in Figure 4. However, the astronomical calibration for top of the Pulleniatina L5 coiling shift at 1.777 ± 0.003 Ma is extremely consistent with the global calibration of 1.78 ± 0.01 Ma from multiple Indo-Pacific sites (Pearson et al. Reference Pearson, Young, King and Wade2023). We find the highest occurrence of G. fistulosa between samples 10H-3 104–106 cm and 10H-3 95–97 cm (87.25 and 87.16 m bsf, respectively), giving a mean depth of 87.21 m bsf, which is a slightly higher level than in the Shipboard Scientific Party (1999) and Chuang et al. (Reference Chuang, Lo, Zeeden, Chou, Wei, Shen, Mii, Chang and Tung2018), due to our higher-resolution sampling.

Figure 4. Magneto- and biostratigraphy at Ocean Drilling Program (ODP) Hole 1115B. Gray shaded boxes indicate intervals examined in this study for morphometric analysis. Paleomagnetic chrons and bioevents from Chuang et al. (Reference Chuang, Lo, Zeeden, Chou, Wei, Shen, Mii, Chang and Tung2018), supplemented by calcareous nannofossil (right-aligned in gray) and planktonic foraminifera (left-aligned in black) biostratigraphy in Poole (Reference Poole2017).
Table 1. Sample ID, depth, and number of analyzed specimens (n) per sample. The pooled sample contains specimens from three pooled, closely spaced samples of 1115B-10H with an average depth of 88 m below seafloor (m bsf).

Analysis
All specimens were analyzed for total test area and curvature as measured from two-dimensional images (Fig. 5). Test curvature is calculated as follows:

Here P is test perimeter (μm) and A is test area (μm2). The equation divides specimen perimeter length by surface area, as measured from the umbilical side. Lengthier perimeters score higher curvature values, and thus specimens that are lobate with high numbers of protuberances, such as G. fistulosa s.s., will have higher curvature values than specimens with a more rounded test periphery, such as T. sacculifer s.s.

Figure 5. Biometric and morphometric parameters measured on Trilobatus sacculifer and Globigerinoidesella fistulosa.
We study allometric relationships between test size and curvature to detect the presence of heterochrony during speciation. Allometry can be expressed in the classic power-law equation of Huxley (Reference Huxley1932):

Here, α and b are constants (α is the scaling exponent coefficient), x is area, and y is curvature. When expressed in logarithmic-transformed notation, the scaling relationship becomes linear:

Here, α is the slope of the relationship and log(b) is the intercept. Both determine the type of heterochrony quantitatively: unchanged slopes and intercepts indicate hyper- or hypomorphosis (Fig. 1A,D), whereas a change in intercept points to pre-/post-displacement (Fig. 1B,E) and a change in slope shows acceleration or deceleration (Fig. 1C,F).
Differences in slopes and intercepts among species and time slices were quantified with linear mixed-effect models using the R package nlme (v. 3.1.152; Pinheiro et al. Reference Pinheiro, Bates, DebRoy and Sarkar2021; R Core Team 2021). The models looks for linear trends among subsets of the data (here: species or time slices) by comparing support for four different scenarios:
1. no overall trend between curvature and area with a consistent slope across species;
2. no overall trend between curvature and area, but varying species-specific slopes;
3. a relationship between curvature and area with a consistent slope across species; or
4. a relationship between curvature and area with species-specific slopes.
Variance differences among species or time slices were assessed using the varIdent function in nlme (Pinheiro and Bates Reference Pinheiro and Bates2000). The model with the lowest Akaike information criterion (AIC) value (a measure for model parsimony) and the highest Akaike weight (a measure for relative model likelihood) has the most statistical support among those models fit.
Results
In the oldest studied samples, preceding the appearance of Globigerinoidesella fistulosa, Trilobatus sacculifer alternates between intervals of low and high curvature, whereas average size remains unchanged (Fig. 6), resulting in parallel allometric slopes with different intercepts. The linear mixed-effect models confirm that the size–curvature slopes remain parallel throughout the pre-speciation interval (Table 2). After speciation, the intermediate specimens also show curves comparable to that of T. sacculifer, but with intermediate specimens showing both larger size and higher curvature than the ancestral forms (Fig. 7). Globigerinoidesella fistulosa is larger than both T. sacculifer and intermediate forms, although it should be noted that maximum size varies very little among species. Rather, the range in size of both G. fistulosa and intermediate specimens is narrower and concentrated at the larger end of the size range of T. sacculifer (Fig. 7). In contrast, the range of curvature values for G. fistulosa is much higher than for ancestral forms and increases strongly with size, resulting in an allometric slope significantly different from its ancestors (Fig. 7, Table 3). A visual inspection of the residuals shows that they are approximately normally distributed, satisfying the model prerequisites (see Figs. S1 and S2 available at https://doi.org/10.5281/zenodo.14525398).

Figure 6. Trilobatus sacculifer size and shape allometry in five time intervals from oldest (A) to youngest (E) preceding the origination of Globigerinoidesella fistulosa. Black dots represent data from each panel's time interval, whereas gray dots show older data. Blue and red arrows indicate pre- and post-displacement, respectively. Most stages include several samples: stage (A) contains all samples from cores 24X-06 and 24X-05, stage (B) contains all samples from core 24X-04, stage (C) contains all samples from core 24X-03, stage (D) contains all samples from core 24X-02, and stage (E) contains all samples from core 24X-01. See Table 1 for full sample IDs.
Table 2. Log likelihood, Akaike information criterion (AIC), and Akaike weights for all four analyzed models of Trilobatus sacculifer area and curvature preceding origination of Globigerinoidesella fistulosa. ΔAIC represents the difference between AIC and the set's minimum AIC. The best-performing model based on AIC and Akaike weight is indicated in bold.
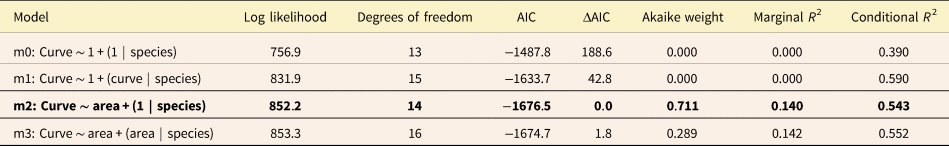

Figure 7. Log size and curvature for Trilobatus sacculifer, intermediate, and Globigerinoidesella fistulosa specimens. Straight lines show linear regressions for each species (T. sacculifer: R 2 = 0.17, p < 0.001; intermediate: R 2 = 0.014, p < 0.001; G. fistulosa: R 2 = 0.29, p < 0.001).
Table 3. Log likelihood, Akaike information criterion (AIC), and Akaike weights for all four analyzed models comparing Trilobatus sacculifer, Globigerinoidesella fistulosa, and intermediate specimens’ area and curvature. ΔAIC represents the difference between AIC and the set's minimum AIC. The best-performing model based on AIC and Akaike weight is indicated in bold.

Discussion
We study allometric relationships between test size and curvature to detect the presence of heterochrony during speciation. The allometric slopes in Trilobatus sacculifer immediately before the origination of Globigerinoidesella fistulosa show shifts between high and low curvature (Fig. 6). The parallel slopes, and similar size throughout the pre-speciation interval suggest a pattern of alternating pre- and post-displacement (Fig. 1B,E). Changes in T. sacculifer outline shape are primarily driven by variation in the shape of the saclike final chamber (Poole and Wade Reference Poole and Wade2019), suggesting that in the pre-speciation interval, the T. sacculifer plexus alternated between more and less “fistulosa-like” final chambers. These phases could be a plastic response to local environmental change.
Our morphometric analyses reveal an alternating pattern of low and intermediate curvature in the T. sacculifer plexus (Fig. 6). This indicates that even before the origination of G. fistulosa, some of the morphological variation necessary to produce the new species was already present in the ancestor. However, pre-displacement was not enough to result in the unusual final morphology of G. fistulosa. The increase in average size of intermediate specimens compared with T. sacculifer (Fig. 7) points to hypermorphosis (Fig. 1A) on top of continued pre-displacement through higher curvature at similar sizes in intermediate specimens. The final transition from intermediate specimens to G. fistulosa is marked by a steeper allometric slope than those of both T. sacculifer and intermediate specimens (Fig. 7). Additionally, G. fistulosa often develops protuberances on multiple chambers in the final whorl (Poole and Wade Reference Poole and Wade2019), which points to further pre-displacement by earlier onset of protuberances and likely contributes to the observed high curvature values. These results indicate that the origination of G. fistulosa involved a combination of two peramorphic expressions: pre-displacement through earlier onset of more pronounced protuberances and acceleration through a steeper allometric slope than its ancestor.
The steep allometric slope in G. fistulosa is likely directly related to the high number of protuberances in the species. The area of the protuberances is very small compared with the total test area, whereas a single protuberance can increase shell perimeter by as much as 50%. The underfitting of the slope at the highest curvature values is likely the result of a handful of specimens with multiple long protuberances that disproportionally affect the curvature values.
There are numerous described cases of heterochrony in the Cenozoic fossil record of planktonic foraminifera, and both paedomorphic and peramorphic expressions have been observed in quantitative and qualitative studies. For example, studies of the Paleocene–Eocene Globanomalina chapmani–Globanomalina luxorensis–Pseudohastigerina wilcoxensis lineage found evidence of hypermorphosis or acceleration (Berggren et al. Reference Berggren, Olsson and Reyment1967) and pre-displacement (Speijer and Samir Reference Speijer and Samir1997). The Eocene transition from Globanomalina australiformis to Turborotalia frontosa is interpreted as resulting from hypermorphosis (Olsson and Hemleben Reference Olsson, Hemleben, Pearson, Olsson, Huber, Hemleben and Berggren2006; Pearson et al. Reference Pearson, Premec-Fucek, Premoli Silva, Pearson, Olsson, Huber, Hemleben and Berggren2006b). Interestingly, the subsequent Turborotalia lineage demonstrates a regressive paedomorphic trend that effectively reversed the former hypermorphosis expression (Pearson et al. Reference Pearson, Premec-Fucek, Premoli Silva, Pearson, Olsson, Huber, Hemleben and Berggren2006b). Wei (Reference Wei1994) conducted a comprehensive study to calculate allometric “trajectories” for assessing heterochronic modes over time in morphological evolution within species of the Globoconella puncticulata-Globoconella inflata plexus. Following the divergence of G. puncticulata and G. inflata, both morphospecies underwent different modes of heterochrony (Wei Reference Wei1994). In G. puncticulata, the change in allometric trajectories suggested acceleration, with later forms developing higher peripheral roundness in comparison to same-sized ancestral forms (Wei Reference Wei1994). In G. inflata, the initial post-displacement trend is interpreted as a delay in the onset of the neanic ontogenetic stage and a probable cause of divergence between the morphospecies (Wei Reference Wei1994). Interestingly, this is followed by a reversing trend of pre-displacement (Wei Reference Wei1994). Finally, Morard et al. (Reference Morard, Füllberg, Brummer, Greco, Jonkers, Wizemann and Weiner2019) combined genetics and morphological measurements in modern species of the Globigerinoides genus to explain the apparent mismatch between morphological disparity and a high degree of genetic kinship. They found that relatively large morphological differences between closely related species can be attained by small changes in the developmental sequence, highlighting the importance of considering heterochronic expressions when studying planktonic foraminifera evolution.
The peramorphic expressions of both pre-displacement and acceleration in the origination of G. fistulosa bears close resemblance to the evolution of Eocene Hantkenina. Hantkeninids are bizarre-looking planktonic foraminifera characterized by tubulospines. The tubulospines first developed on the final, adult chambers, before earlier trait onset in later hantkeninid species (Pearson and Coxall Reference Pearson and Coxall2014). Such a shift to earlier trait (tubulospine) development in later morphospecies, such as Hantkenina mexicana, may therefore indicate pre-displacement, although the later morphospecies are generally also larger than the transitional forms, pointing to hypermorphosis (Pearson and Coxall Reference Pearson and Coxall2014). To our knowledge, the hantkeninids and G. fistulosa are the only species of planktonic foraminifera whose origination included multiple expressions of heterochrony. Possibly, their extreme shapes could only be formed through multiple developmental shifts, which might explain why unusual shapes such as protuberances and tubulospines are so rare in planktonic foraminifera.
In terms of mechanisms, although the aforementioned heterochronic changes explain how G. fistulosa managed to reach a more extreme shape than most other planktonic foraminifera, the drivers of these morphological adaptations are harder to interpret. Schmidt et al. (Reference Schmidt, Caromel, Seki, Rae and Renaud2016) showed that T. sacculifer size and shape are partly controlled by temperature. The G. fistulosa stratigraphic range includes the onset of the Northern Hemisphere glaciation (~3.5 to 2.5 Ma) (Bailey et al. Reference Bailey, Hole, Foster, Wilson, Storey, Trueman and Raymo2013; Westerhold et al. Reference Westerhold, Marwan, Drury, Liebrand, Agnini, Anagnostou and Barnet2020). During this interval, Earth transitioned from a unipolar glacial state, with large ice sheets only on Antarctica, to one that was sufficiently cool by ~2.7 Ma to induce growth of large ice sheets in the Northern Hemisphere and associated rafting of icebergs across the subpolar North Atlantic Ocean (Shackleton et al. Reference Shackleton, Backman, Zimmerman, Kent, Hall, Roberts and Schnitker1984). The high-resolution oxygen isotope record of T. sacculifer at Site 1115 does not indicate any dramatic change associated with the extinction of G. fistulosa (Chuang et al. Reference Chuang, Lo, Zeeden, Chou, Wei, Shen, Mii, Chang and Tung2018). Furthermore, G. fistulosa was restricted to the tropical oceans, and its exposure to environmental change originating in the high northern latitudes was therefore likely limited.
Both the T. sacculifer plexus and G. fistulosa are spinose, occupy the mixed layer, and harbor algal photosymbionts. It has been shown that the acquisition of symbionts is necessary for T. sacculifer to achieve maximum sizes (Bé et al. Reference Bé, Spero and Anderson1982). The large size of G. fistulosa compared with T. sacculifer would have required even more symbionts than T. sacculifer, but the surface area to volume ratio in globular chambers of planktonic foraminifera, and thus space for symbionts, decreases with increasing volume. The protuberances in G. fistulosa potentially counteract this trend by increasing surface area to host more symbionts. Modern species with shells that have a high surface area to volume ratio often show a greater rise in photosymbionts with increasing size than more spherical ones (Takagi et al. Reference Takagi, Kimoto, Fujiki, Saito, Schmidt, Kucera and Moriya2019), suggesting that irregular shapes are beneficial to symbiont activity. This hypothesis could be tested in future studies by comparing stable carbon isotope trends between G. fistulosa and T. sacculifer to test for differences in symbiont activity. The protuberances themselves are spinose (Poole and Wade Reference Poole and Wade2019), further increasing effective test size. Other digitate species such as the hantkeninids have been argued to evolve elongated chambers to increase effective test size and food-gathering efficiency (Coxall et al. Reference Coxall, Wilson, Pearson and Sexton2007), a mechanism that possibly further helped G. fistulosa to reach and maintain a large body size. Finally, it should be noted that there might not be any clear evolutionary advantage of the protuberances. Much of the functional morphology of foraminiferal shell shape remains unclear (Renaud and Schmidt Reference Renaud and Schmidt2003; Caromel et al. Reference Caromel, Schmidt, Phillips and Rayfield2014), and the development of some morphological features may not have a specific functional response. An evolutionary advantage or fulfillment of a particular function does not need to be assumed by the development of a trait, such as protuberances in G. fistulosa.
Conclusions
The origination of the unusual test size and shape of Globigerinoidesella fistulosa was the result of a combination of pre-displacement and acceleration of ancestral traits found in Trilobatus sacculifer. These results imply that shifts in multiple developmental expressions are required for the origination of unusual morphologies. As both ancestor and descendant species continued to thrive following the origination of G. fistulosa, the drivers of morphological change are unlikely to be environmental variations that favored one species over the other. Our work provides a case study of the complex developmental changes required to produce ornate shell shapes and highlights the importance of development in the origination of unusual forms.
Acknowledgments
We are grateful to R. Morard, M. R. Petrizzo, and an anonymous reviewer whose comments significantly improved the article. Thanks to Z. Tian, N. Staikidou, and D. King for assistance with figures. This study was funded through a UK Natural Environment Research Council (NERC) studentship to C.R.P. and NERC grant NE/P019013/1 to B.S.W. A.B. and T.H.G.E. were funded through NERC grant NE/P019269/1. Samples were provided by the International Ocean Discovery Program (IODP), which is sponsored by the U.S. National Science Foundation and participating countries.
Competing Interest
The authors declare no competing interests.
Data Availability Statement
Data are available from the Dryad repository: https://doi.org/10.5061/dryad.3bk3j9kqh.


 Open access