


1. Introduction
In this paper, we investigate attitudes towards two types of language use that does not conform to the norm: (1) non-standard varieties, i.e. regional or ‘vernacular’ language use that deviates from the standard language, and (2) foreign accents, i.e. phonological features that cause the speech of non-native speakers to deviate from the speech of native (or L1) speakers. We will do so by means of a speaker evaluation experiment (SEE) conducted in Flanders, the northern, officially Dutch-speaking part of Belgium, and set in the context of higher education. Our investigation is guided by the following research question: How do students evaluate non-conforming speech in a higher educational context? More specifically, the goal of this paper is threefold: it aims to investigate the influence of name (Flemish vs. foreign), accent (Flemish vs. foreign) and linguistic variety (standard vs. non-standard) on students’ evaluations of university instructors.
Before we describe the SEE in detail, we will review the literature on attitudes towards non-conforming speech in Section 2 and zoom in on the research context in Section 3.
2. Previous attitudinal research on non-standard varieties and foreign accents
A longstanding tradition of language attitudinal research has demonstrated that non-standard varieties and foreign accents are typically evaluated differently, and often more negatively, than norm-conforming speech. Standard language use is typically associated with ‘Superiority’ (also often called ‘Competence’), scoring high on features such as intelligence, status and prestige, whereas non-standard varieties are mostly downgraded on such traits (Zahn & Hopper Reference Zahn and Hopper1985, Garrett Reference Garrett2010). In addition, foreign accents are mostly judged more negatively than native accents: while native speakers of non-standard varieties often do score well on ‘Solidarity’ (or ‘Social attractiveness’), characterised by features such as warmth or likeability, foreign-accented speech is often downgraded on both Superiority and Solidarity (Gluszek & Dovidio Reference Gluszek and Dovidio2010, Fuertes et al. Reference Fuertes, Gottdiener, Martin, Gilbert and Giles2012, Dragojevic et al. Reference Dragojevic, Giles, Beck and Tatum2017).
These associations have mostly been laid bare in so-called speaker evaluation experiments (SEEs), which often make use of the classic matched-guise paradigm (Lambert et al. Reference Lambert, Hodgson, Gardner and Fillenbaum1960), in which listener-judges evaluate audio clips of different varieties or accents on a number of features pertaining to the personality of the speaker. The term ‘matched guise’ refers to the fact that the different speech fragments (or ‘guises’) are produced by a single (bilingual or bidialectal) speaker, ensuring that no other features (such as voice quality) influence the ratings. Additionally, the features on which the speakers are rated are selected to evaluate their personality and not their speech, in order to keep respondents ignorant of the experimental goal. While most SEEs typically present the participants with decontextualised speech fragments, the matched-guise design (or variants of it, such as the ‘verbal guise’ design, in which more than one speaker produces the speech clips) has also been deployed successfully in more contextualised experimental designs, in order to pinpoint potentially adverse consequences of a negative bias vis-à-vis non-conforming varieties or accents in specific settings. SEEs evoking recruitment contexts, for instance, have demonstrated that job candidates with regional and foreign accents are generally considered less hireable than standard and native-accented candidates (Spence et al. Reference Spence, Hornsey, Stephenson and Imuta2024).
Apart from employment or housing (Heylen & Van den Broeck Reference Heylen and Van den Broeck2016, Ghekiere et al. Reference Ghekiere, Martiniello and Verhaeghe2023), education stands out as another context in which negative attitudes towards linguistic varieties or accents may have palpable consequences for their speakers. A substantial body of research conducted on higher education in the United States has revealed an aversion of students to foreign-accented university instructors. Rubin & Smith (Reference Rubin and Smith1990) conducted a matched-guise experiment in which US undergraduates rated one version of a lecture on a humanities or science topic, delivered by a speaker with either a moderate or strong Chinese accent. These speech clips were paired with photographs of either a white or an Asian woman. Rubin & Smith found that level of accent did not affect perceived accentedness, nor did it affect comprehension of the lecture or the perception of the instructor’s teaching ability. The latter, however, was predicted by the degree to which students believed the speech samples were accented: the higher the level of perceived accentedness, the poorer the judgements of teaching ability. In a further exploration of non-language factors affecting undergraduates’ judgements of non-native English-speaking instructors, Rubin (Reference Rubin1992) had students rate speech clips produced in Standard American English by a native speaker, accompanied by images of either a white or an Asian instructor. Interestingly, Rubin found that the mere visual cue of an Asian ethnicity led to perceptions of the accent as foreign (while it was in fact native), and to diminished listening comprehension.
These findings indicate that negative perceptions of an instructor’s language proficiency and teaching ability can be influenced not only by a foreign accent, but also by ethnic stereotypes triggered by cues unrelated to language. Studies deploying other than experimental methods, such as corpus linguistic and discourse analytical methodologies, are generally in line with the experimental findings mentioned earlier. In a mixed-methods investigation, Subtirelu (Reference Subtirelu2015) compared students’ scores and comments of mathematics instructors with US and Chinese or Korean last names on RateMyProfessors.com (RMP). He found that instructors with Chinese or Korean last names were rated significantly lower on clarity and helpfulness. RMP users moreover frequently commented on the language proficiency of the Asian instructors, but made no comments on the language of instructors with US names, and only gave extremely positive evaluations to instructors with US names. Even though Subtirelu’s analysis of the comments also highlighted the recurring use of formulae that countered the presupposition that a foreign accent is a problem (e.g. ‘Even though X has a foreign accent …’), he nevertheless interpreted his findings as indicative of the dominance of an ‘ideology of nativeness’ (Shuck Reference Shuck2006). This ideology naturalises native speech, categorises non-native speakers as national and racial outsiders, and forges iconic associations between race, language, and incomprehensibility. This interpretation contrasts with Bresnahan et al.’s (Reference Bresnahan, Ohashi, Nebashi, Ying Liu and Morinaga Shearman2002) findings, who in their SEE compared students’ evaluations of ‘intelligible’ and ‘unintelligible’ foreign accents with those of native accents. The results revealed that when intelligibility was high, foreign-accented teaching assistants were judged to be as attractive and competent as teaching assistants who were native speakers of American English.
The research tradition on language attitudes sketched above has predominantly focused on anglophone contexts, particularly the United States. For languages other than English, attitudes towards non-standard varieties and non-native accents are generally less well-researched when it comes to specific contexts. The available studies on accent bias in employment, for instance, focus solely on English and (to a much lesser extent) on German (Spence et al. Reference Spence, Hornsey, Stephenson and Imuta2024). This scarcity of contextualised experimental attitude research is also evident for Flanders, where the data for the present study were collected. While a considerable number of experimental studies have been conducted on attitudes towards standard vs. non-standard Dutch in Flanders (Impe & Speelman Reference Impe and Speelman2007, Ghyselen & De Vogelaer Reference Ghyselen, De Vogelaer, Kristiansen and Grondelaers2013, Grondelaers & Speelman Reference Grondelaers, Speelman, Kristiansen and Grondelaers2013, Rosseel et al. Reference Rosseel, Speelman and Geeraerts2019b), most of these studies have focused on decontextualised speech, with only a few exceptions (e.g. Vandekerckhove & Cuvelier Reference Vandekerckhove, Cuvelier, Pol Cuvelier, Meeuwis and Teck2007, who used speakers set in shopping contexts and in a movie theatre, and Zenner et al. Reference Zenner, Grondelaers, Rosseel, Speelman, Esselinckx and Rombouts2021, who investigate the context of speech therapy). Experimental studies on attitudes vis-à-vis foreign-accented Dutch in Flanders, and especially contextualised ones, are even scarcer (but see Rosseel Reference Rosseel2021, Van Puyvelde et al. Reference Van Puyvelde, Sarah Van Hoof and Plevoets2023).
Higher education is a context that particularly calls for attention, given the increasing internationalisation of academic institutions in Flanders. Flemish universities actively aim to recruit foreign staff, and currently 30.4% of all Flemish university staff (i.e. professors, teaching assistants, PhD students, and postdoctoral researchers) have neither Belgian nor Dutch nationality, which implies that for most of them Dutch is presumably not their native language. Foreign professors are required to master Dutch at CEFR level B2 within five years after obtaining their position at a Flemish university. Moreover, all teaching staff are subjected to end-of-term evaluations by their students, which may comprise questions about the instructor’s language use, and which may impact their career. It is therefore highly relevant to investigate Flemish students’ attitudes towards non-conforming Dutch produced by university instructors. Before we do so, we will further describe the sociolinguistic context in which our research is set in the next section.
3. Context: language attitudes in Flanders
The official linguistic norm in Flanders is Belgian Standard Dutch, the strictest form of which is devoid of any regional accent and can almost exclusively be heard on radio and television, and more particularly in the news and current affairs shows. Linguists therefore often refer to this variety with the synonyms ‘VRT Dutch’ (VRT being the abbreviated name of the Flemish public broadcasting corporation; Grondelaers et al. Reference Grondelaers, van Hout and van Gent2016) or ‘Newscast Dutch’ (Plevoets Reference Plevoets2008). In the postwar decades, VRT Dutch was vigorously propagated as the unequivocal linguistic standard for oral communication within the Flanders region, as a result of which it has been argued that Flanders is today still characterised by a powerful standard language ideology (Jaspers & Van Hoof Reference Jaspers and Van Hoof2013). The perceived superiority of VRT Dutch has been confirmed by speaker evaluation experiments, which have laid bare fairly consistent associations of its speakers with competence, intelligence, and professionalism (Impe & Speelman Reference Impe and Speelman2007, Vandekerckhove & Cuvelier Reference Vandekerckhove, Cuvelier, Pol Cuvelier, Meeuwis and Teck2007, Ghyselen Reference Ghyselen2009). Even though this variety is ideologically powerful and considered the norm not only in broadcasting but also in education, linguists have also characterised it as ‘virtual’, since it is rarely spoken outside broadcast contexts. Grondelaers & van Hout (Reference Grondelaers and van Hout2011) have argued that the closest non-virtual variety to the VRT norm is one exemplified by teachers, which they have therefore dubbed ‘Teacher Dutch’ (see also Delarue & Ghyselen Reference Delarue and Ghyselen2016). Indeed, teachers’ speech is usually (though certainly not always: see below) fairly standard when it comes to its grammatical features, but it typically deviates from the strict VRT norm through the presence of an easily identifiable regional accent.
In general, hybrid colloquial styles are far more common in oral communication than Standard Dutch. These colloquial styles encompass a range of linguistic practices often subsumed under the term tussentaal (literally ‘in-between-language’) or ‘Colloquial Belgian Dutch’. This variety is readily distinguishable from Belgian Standard Dutch, not only because of the presence of stronger regional accents, but also due to morphological and syntactic deviations from the prescribed standard. Colloquial Dutch is widely used, mainly in informal, private, and unofficial domains, but is also often observed to permeate in more formal, public, and mediatised domains, such as education (Delarue Reference Delarue2016, Van Lancker Reference Van Lancker2017) and entertainment genres on radio and television (Van Hoof Reference Van Hoof2018). In public discourse Colloquial Dutch often faces disapproval, its perceived ‘omnipresence’ causing regular outcry about the poor quality of Flemish language use. Nevertheless, SEEs have demonstrated that Colloquial Dutch carries associations of Solidarity and Dynamism: its speakers are perceived as likeable, cool, entertaining, and trendy (Impe & Speelman Reference Impe and Speelman2007, Grondelaers & Speelman Reference Grondelaers, Speelman, Kristiansen and Grondelaers2013, Rosseel Reference Rosseel2017).
Whereas associations of Standard Dutch with Superiority and Colloquial Dutch with Solidarity and Dynamism traits have been demonstrated repeatedly by experimental studies that used fairly decontextualised stimuli, it remains an open question whether the same associations can be found in more contextualised experimental settings. Indications that these associations may indeed be different are provided by Zenner et al. (Reference Zenner, Grondelaers, Rosseel, Speelman, Esselinckx and Rombouts2021), who conducted an SEE in which speech therapy students and a control group evaluated a speech therapist producing both therapeutic discourse and more relational, informal discourse in either Standard Dutch or Colloquial Dutch. Whereas the authors had expected an upgrading of Standard Dutch in the therapeutic context and an upgrading of Colloquial Dutch in the relational context, they found that in both groups of participants, the standard guise did not elicit significantly higher scores than the colloquial guise, and the standard-speaking speech therapist was downgraded in the relational context on what the authors termed ‘modern competence’ (comprising features such as ‘enthusiastic’ and ‘funny’). The authors interpreted these results as revealing ‘some ideological relaxation’ of the standard language expectation that the speech therapy session is generally assumed to entail (Zenner et al. Reference Zenner, Grondelaers, Rosseel, Speelman, Esselinckx and Rombouts2021: 13).
For the context of education, one might hypothesise that, in line with the prevailing standard language ideology and similar to the speech therapy context, students will expect their instructors to use Standard Dutch and will penalise non-conforming speech. However, a recent study that deployed a contextualised speaker evaluation design, aiming to enhance the ecological validity of the experimental data, failed to confirm this expectation. Lybaert et al. (Reference Lybaert, Van Hoof and Deygers2022) investigated the influence of language variety (Standard vs. Colloquial Dutch), ethnicity (Flemish vs. Moroccan name), and religious affiliation (wearing a hijab vs. not wearing one) on students’ evaluation of a female university instructor, by means of a between-subjects SEE, in which students evaluated one of six guises on several evaluative dimensions. The guises consisted of a clip of a lecture produced by a native speaker (either in the standard or the colloquial version), combined with a photograph of a woman (with or without hijab) and a name (Flemish or Moroccan). Whereas the standard guises were mostly (but not consistently) rated higher on comprehensibility than the colloquial guises, Standard Dutch was not consistently rated more positively on professionalism (i.e. features such as having a successful career, intelligence, credibility, and reliability) than Colloquial Dutch. Moreover, language variety did not have any impact on the instructor’s perceived authority, or on social attractiveness. These findings challenge the assumption that the use of Standard Dutch is an absolute prerequisite for university instructors in the higher education context. They suggest that, while decontextualised experiments may readily elicit stereotypes in line with a standard language ideology, such beliefs may have a more limited impact on judgements of an instructor’s professional competences in a contextualised experimental design. As for the impact of ethnicity, no general downgrading of the minority identities was observed. Instead, the veiled standard-speaking Maghrebi instructor was rated more positively on professionalism and received the highest scores for the perceived standardness of her speech. The authors hypothesised that the ‘bonus’ for the veiled standard speaker may have been the result of a positive breach of participants’ low expectations about this stigmatised minority identity. Finally, the study failed to replicate Rubin’s (Reference Rubin1992) finding that ethnic cues may lead to the perception of a foreign accent: the participants of Lybaert et al. (Reference Lybaert, Van Hoof and Deygers2022) did not indicate hearing a foreign accent in any of the guises.
Neither a non-conforming ethnic and religious identity nor the use of a non-conforming language variety thus had a negative impact on the evaluation of an instructor’s teaching ability in Lybaert et al. (Reference Lybaert, Van Hoof and Deygers2022). However, it remains an open question whether and how a foreign accent influences the perception of such a speaker. The present research therefore partly replicates the methodology employed by Lybaert et al. (Reference Lybaert, Van Hoof and Deygers2022), but incorporates accent as an independent variable, in addition to language variety and name, as a cue to ethnic identity.
4. Methodology
This study is a contextualised SEE aiming to examine the combined effect of language variety, accent and name on students’ evaluation of university instructors. The experiment followed a 2 (Variety: standard vs. colloquial) × 2 (Accent: Flemish vs. Eastern European) × 2 (Name: Flemish vs. Eastern European) between-subjects design in which eight groups of students and recent graduates each evaluated a single lecture delivered by a lecturer presented to them in different guises. This section describes the verbal and visual input (Section 4.1), procedure and measurements (Section 4.2), participants (Section 4.3) and analysis (Section 4.4).
4.1 Materials
4.1.1 Auditory input
For the auditory input, we constructed an excerpt of a lecture on Pavlov’s dog and the principles of classical conditioning. We deliberately opted for a topic that we believed would be comprehensible to students with diverse educational backgrounds and varied interests. The script for the lecture was derived from an authentic class delivered to first-year medical students at a Flemish university. We created four versions of the script:
-
(1) Standard Dutch with a Flemish accent
-
(2) Colloquial Dutch with a Flemish accent
-
(3) Standard Dutch with an Eastern European accent
-
(4) Colloquial Dutch with an Eastern European accent
These four versions were syntactically identical, some small differences caused by the spontaneous rendering of the text left aside. All the speech samples consisted of approximately 420 words and had a duration of approximately 2 minutes and 30 seconds. They were rendered by a female actress who is a bilingual speaker of Dutch and Russian. Originally from Uzbekistan, she relocated to Antwerp, Belgium at the age of 14. We selected a Russian speaker because Russian is one of the most widely spoken languages in Europe, and Russians are in the top 15 of non-Belgians with European citizenship in Belgium.Footnote 1 Additionally, there has been an increase in the population of Eastern European migrants in Flanders, a trend largely influenced by the ongoing war in Ukraine.Footnote 2
The difference between the standard and colloquial versions lay in the rendering of a number of morphological and phonological variables: in the Standard Dutch versions the speaker consistently used the Standard Dutch variants of those variables; in the colloquial versions she systematically used non-standard variants, which are commonly associated with Colloquial Dutch (we refer to the online supplementary materials for a transcript of the scripts and an overview of the variants included in the stimuli; see Geeraerts & Van de Velde Reference Geeraerts, Van de Velde, Hinskens and Taeldeman2013 for a discussion of Colloquial Dutch variants). The speaker delivered the Flemish accented versions with a mild regional accent from the central, Brabant–Antwerp region. The decision to incorporate a regional accent aligns with prior research findings indicating that Flemish teachers often have accents that disclose their regional backgrounds, rather than conforming strictly to the accent norms commonly displayed by television and radio news presenters (Grondelaers & van Hout Reference Grondelaers and van Hout2011). The foreign-accented versions were delivered in the speaker’s native Russian accent. We will refer to this accent as ‘Eastern European’ in the remainder of this paper, because this is how most participants perceived it (see Section 4.2).
4.1.2 Visual input
Names were used to operationalise instructor ethnicity. To represent a Flemish identity, we selected the first name ‘An’, which is a very common first name given to women in Flanders, and combined it with the surname ‘Mertens’, which ranks as the fifth most prevalent surname. For the Eastern European identity, we used the Eastern European equivalent ‘Anna’ as the first name, and chose the surname ‘Mirzayeva’ from a list of common Uzbek last names.Footnote 3
To gauge the likelihood of participants associating these names with either Flemish or Eastern European origins, we conducted a pretest: 38 participants indicated on a scale from 1 to 7 how likely it was to them that people with these names have Eastern European or Flemish parents. The analysis of the results revealed a strong association between the name ‘An Mertens’ and Flemish ethnicity (M = 6.4, Md = 7), and a considerably lower likelihood of the name being perceived as indicative of Eastern European heritage (M = 2.3; Md = 2). Conversely, the name ‘Anna Mirzayeva’ was primarily associated with an Eastern European background (M = 5.7; Md = 6), rather than being considered of Flemish parentage (M = 2.8; Md = 3). We combined the two names with a photograph of a female lecturer. From the website Shutterstock we selected a photo of a woman who could plausibly be associated with both a Flemish and an Eastern European background. We used the same photograph in all scenarios to eliminate any potential influence of factors such as attractiveness, charisma, or age (Riniolo et al. Reference Riniolo, Johnson, Sherman and Misso2006, Baert & Decuypere Reference Baert and Decuypere2014). A pretest with the same pool of participants as those who rated the names revealed that the woman in the picture was considered about equally likely to have Eastern European (M = 4; Md = 4) or Flemish parents (M = 4.2; Md = 4).
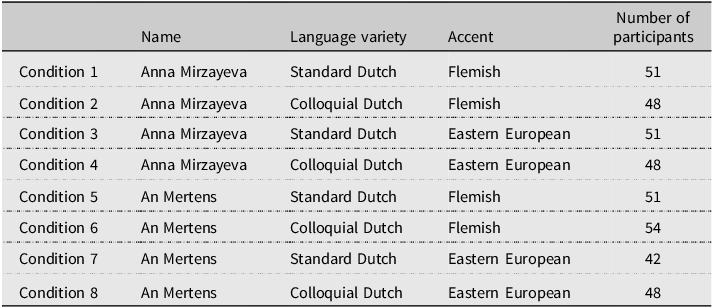
We thus created two fictional female university instructors representing the tested identities (depicted in Figure 1). These two identities were combined with the four audio recordings in a total of eight conditions.

Figure 1. Identities tested.
4.2 Procedure and measurements
The experiment was conducted using the online survey platform Qualtrics. The participants were randomly assigned to one of the eight conditions. In the introductory section of the online survey, we informed the participants that the survey was part of a study focusing on teaching quality. The speaker was introduced as an instructor (‘docent’) who gave a lecture to undergraduate students in medicine, and participants were told that the accompanying PowerPoint presentation she used during her lecture would also be displayed. The participants were instructed to pay careful attention as they would subsequently be presented with questions concerning the instructor and the lecture. Prior to listening to the speech sample, participants were also required to provide their informed consent. Throughout the lecture, a photograph of the instructor, accompanied by her name, was projected on the left side of the screen, while the PowerPoint presentation, displaying the key points of the lecture, was shown on the right side (see Figure 2).

Figure 2. Projection of photograph, name, and PowerPoint presentation (Condition 1).
Immediately after seeing the recorded lecture, the participants were directed to the questionnaire. Participants had to respond to 23 Likert statements on a 7-point scale ranging from ‘completely disagree’ to ‘completely agree’ (see Table 5 for an overview of all the statements, and the online supplementary materials for the original Dutch statements). The Likert statements included were retrieved from Lybaert et al. (Reference Lybaert, Van Hoof and Deygers2022), with some modifications. In the latter study, the statements represented the evaluative dimensions Social attractiveness, Professionalism, Comprehensibility, Authority, Physical attractiveness, and Standardness. Since none of the statements explicitly addressed the language variety of the instructor, most of them can be regarded as indirect measures of language attitudes. Some statements assessing comprehensibility (i.e. ‘I think this instructor speaks clearly’, ‘I have understood the explanation well’, ‘I think this instructor explains the matter clearly’) can be considered semi-direct measures, as they could be interpreted as reflecting the instructor’s speech style. We also included a control question to make sure that participants were actively engaging with the statements during their responses. In the control question, participants were instructed to indicate the response option ‘rather agree’.
On the following web page, we verified awareness of the research purpose by means of an open question asking what the study was about. The subsequent page included 12 Likert items focusing on the instructor’s language and appearance (see Table 5) and another control question. The items related to language use can be categorised as direct measures of language attitudes. Additionally, participants were prompted to indicate their perception of the instructor’s country of birth (either ‘Belgium’ or ‘other’). If they believed the instructor was born outside Belgium, they were asked to specify the country. Furthermore, participants were requested to identify the instructor’s native language and indicate the Flemish province where they believed she resided. Afterwards, we included a second open question on the purpose of our study and a manipulation check to verify if our participants remembered the name of the lecturer correctly.
Finally, the questionnaire included a section gathering demographic information about the participants, i.e. gender, place of origin, nationality, and home language(s). The questionnaire was presented to the participants across consecutive web pages, and once they advanced to a new page, they were unable to revisit the previous page.
4.3 Participants
The participants consisted of students and recent graduates who had completed their studies in 2018 or more recently at Flemish universities or university colleges. They were recruited by marketing agency Bilendi. A total of 393 participants successfully completed the survey (see Table 1). These participants were paid for their participation. Additionally, 562 participants started the survey but were excluded because they graduated prior to 2018 (43%) or because they answered incorrectly to one of the control questions (23%). Participants who failed to complete the entire questionnaire (34%) were also excluded from the dataset.
Table 1. Eight conditions
The geographical distribution of our participants spanned the whole of Flanders, with 19% residing in West Flanders, 23% in East Flanders, 28% in Antwerp, 12% in Limburg, and 19% in Flemish Brabant. 37% of the participants identified as ‘female’, 63% as ‘male’, 0.3% indicated ‘other’, and 0.3% chose not to disclose their gender identity. 93% held Belgian citizenship; 4.3% had a dual nationality, which included Belgian citizenship, while 2.5% did not have Belgian nationality. 86% exclusively spoke Dutch at home, 11% used both Dutch and another language in their home environment, and 3% had a different primary home language.
4.4 Analysis
The analysis conducted in this study consisted of Factor Analysis followed by Analysis of Variance (ANOVA). First, the ratings on the 35 personality traits were subjected to a Factor Analysis. The standard Principal Axis Factoring method with Varimax rotation was employed to reduce the dimensionality of the data and to identify the most important factors (see Section 4.3). Second, the scores on each of these factors were analysed as the dependent variable of an ANOVA. Our study extends prior research by investigating the influence of accent, alongside name and language variety, on perceptions of an instructor in a Flemish context. Given the scarcity of literature on accent effects in this context, we examined all possible interactions among name, language variety, and accent. The independent variables of each ANOVA consisted of the eight possible combinations of Variety (Standard Dutch vs. Colloquial Dutch), Accent (Flemish vs. Eastern European), and Name (Flemish vs. Eastern European), as well as four control variables to account for potential confounding effects:
-
Gender: male, female, other, prefer not to say
-
Region: West Flanders, East Flanders, Antwerp, Flemish Brabant, Limburg (i.e. the five provinces)
-
Nationality: Belgian vs. double nationality (including Belgian) vs. non-Belgian nationality
-
Home language: Dutch vs. Dutch + other language vs. other language
All statistical analyses were conducted using the R statistical software (R Core Team 2022). Factor Analysis was performed with the R package psych (Revelle Reference Revelle2021) and ANOVA was done with the base R function lm(). The results of each ANOVA were subsequently visualised with the R package effects (Fox Reference Fox2003).
5. Results
In this section we will elaborate on the results of the debriefing check (Section 5.1), the questions about the lecturer’s background (Section 5.2), the outcome of the Factor Analysis (Section 5.3), and the ANOVA analyses (Section 5.4).
5.1 Debriefing check
We asked our participants twice what they believed our study was about, once after the indirect and semi-direct Likert statements (Q1) and once after the direct Likert statements on the instructor’s language and appearance (Q2). The results of these debriefing checks are presented in Table 2, which cross-tabulates the eight conditions with a categorisation of the participants’ answers to the two questions about the study’s intent. We worked with a three-way categorisation: (1) answers not showing any awareness of the research purpose; (2) answers including a general comment about language, voice, or appearance; (3) answers including a more specific comment on accent, dialect, ethnicity, or discrimination.
Table 2. Debriefing check
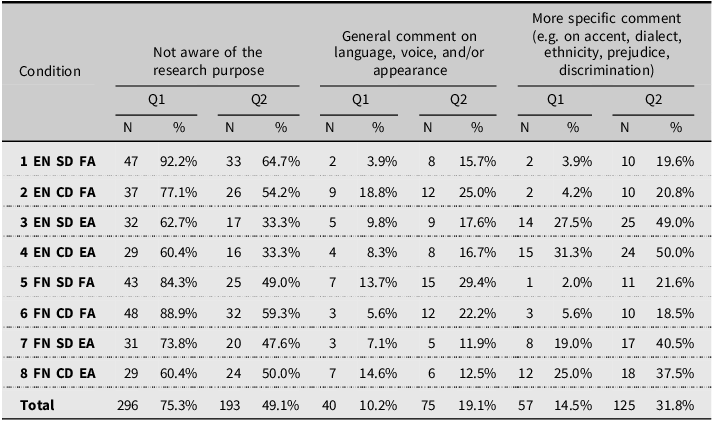
EN = Eastern European name, FN = Flemish name; SD = Standard Dutch, CD = Colloquial Dutch; FA = Flemish accent, EA = Eastern European accent.
In general, more participants in the conditions with the Eastern European accent (EA) were aware of the research purpose than those in the conditions with the Flemish accent (FA). Furthermore, in the conditions with the Eastern European accent, more participants (between 19% and 31.3%) offered specific comments on accent, dialect, ethnicity, prejudice, or discrimination than in the conditions with a Flemish accent (2% to 5.6%) in reply to the first question (Q1). If anything, the higher awareness of these issues that these more detailed comments indicate may have led to more socially desirable responses in the conditions with the Eastern European accent.
5.2 The lecturers’ presumed native language, country of birth and place of residence
The participants were asked to identify the native language of the instructor (see Table 3).
Table 3. Perceived native language of the instructor
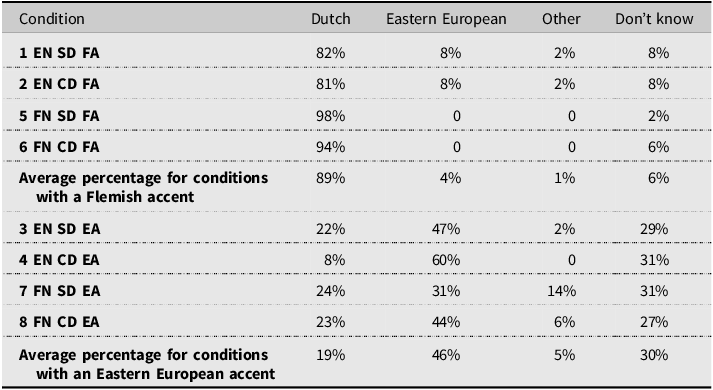
EN = Eastern European name, FN = Flemish name; SD = Standard Dutch, CD = Colloquial Dutch; FA = Flemish accent, EA = Eastern European accent.
In the four conditions with a Flemish accent, a substantial majority of the participants (89%) thought the lecturer’s native language was Dutch. A minority of participants (4%) associated the lecturer with an Eastern European native language, while 1% associated it with a different native language altogether and 6% were unable to identify the instructor’s native language. Notably, the Flemish accent was only associated with an Eastern European native language in conditions 1 and 2, where the Flemish accent was also accompanied by an Eastern European name. In the conditions with an Eastern European accent, on average 46% of the participants identified the native language as Eastern European, and 19% thought it was Dutch. A significant proportion (30%) exhibited uncertainty regarding the native language, while 5% linked the accent to a different native language.
We also asked our participants to indicate the presumed country of birth for the instructor (see Table 4).
Table 4. Perceived country of birth of the instructor
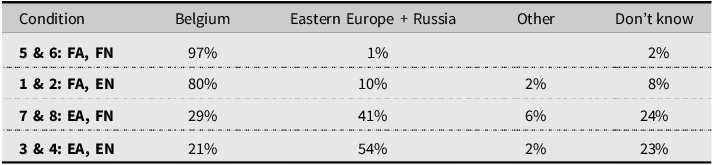
EN = Eastern European name, FN = Flemish name; FA = Flemish accent, EA = Eastern European accent.
In the conditions involving a Flemish accent and a Flemish name, the large majority of participants (97%) believed the instructor’s country of birth was Belgium. When the Flemish accent was combined with an Eastern European name, the responses varied more, but 80% of participants still identified the country of birth as Belgium. In the conditions with an Eastern European accent, most participants thought the instructor’s country of origin was Russia or located elsewhere in Eastern Europe: 41% in the condition with the Flemish name and 54% in the condition with the Eastern European name. In those conditions, more participants indicated not knowing where the instructor was presumably born, compared to the conditions with the Flemish accent. Overall, it is clear that accent was the main factor determining the attributions of the speaker’s country of birth.
As far as current place of residence is concerned, the instructor was located mostly in Antwerp (32%), followed by the provinces of East Flanders (16%) and Flemish Brabant (16%). The most pronounced association with Antwerp emerged in scenarios with Colloquial Dutch and a Flemish accent, with an average of 57% of participants identifying Antwerp as the instructor’s place of residence.
5.3 Factor Analysis
As mentioned in Section 4.2, 35 Likert scale items – the indirect and semi-direct items on the one hand and the direct items on language and appearance on the other hand – were included in the same analysis. Given that most scales exhibited a consistent directionality (from negative to positive), they could be incorporated into the analysis without any adjustments. Two scales were reverse-coded, viz. ‘The instructor has a foreign accent’ and ‘The instructor has a regional accent’, before inclusion in the analysis. Based on the eigenvalues (>1) and a visual examination of the scree plot, a six-factor solution was chosen. Jointly, these six factors explain 62.80% of the variance. Table 5 shows the component matrix of these six factors. The direct items (in bold in the table) yielded distinct factor loadings in comparison to the indirect and semi-direct items. The item ‘The instructor has a regional accent’ loaded high (> 0.4) on none of the factors and was therefore excluded from further analyses.
Table 5. Factor Analysis with Varimax rotation (loadings < 0.4 omitted for readability purposes)
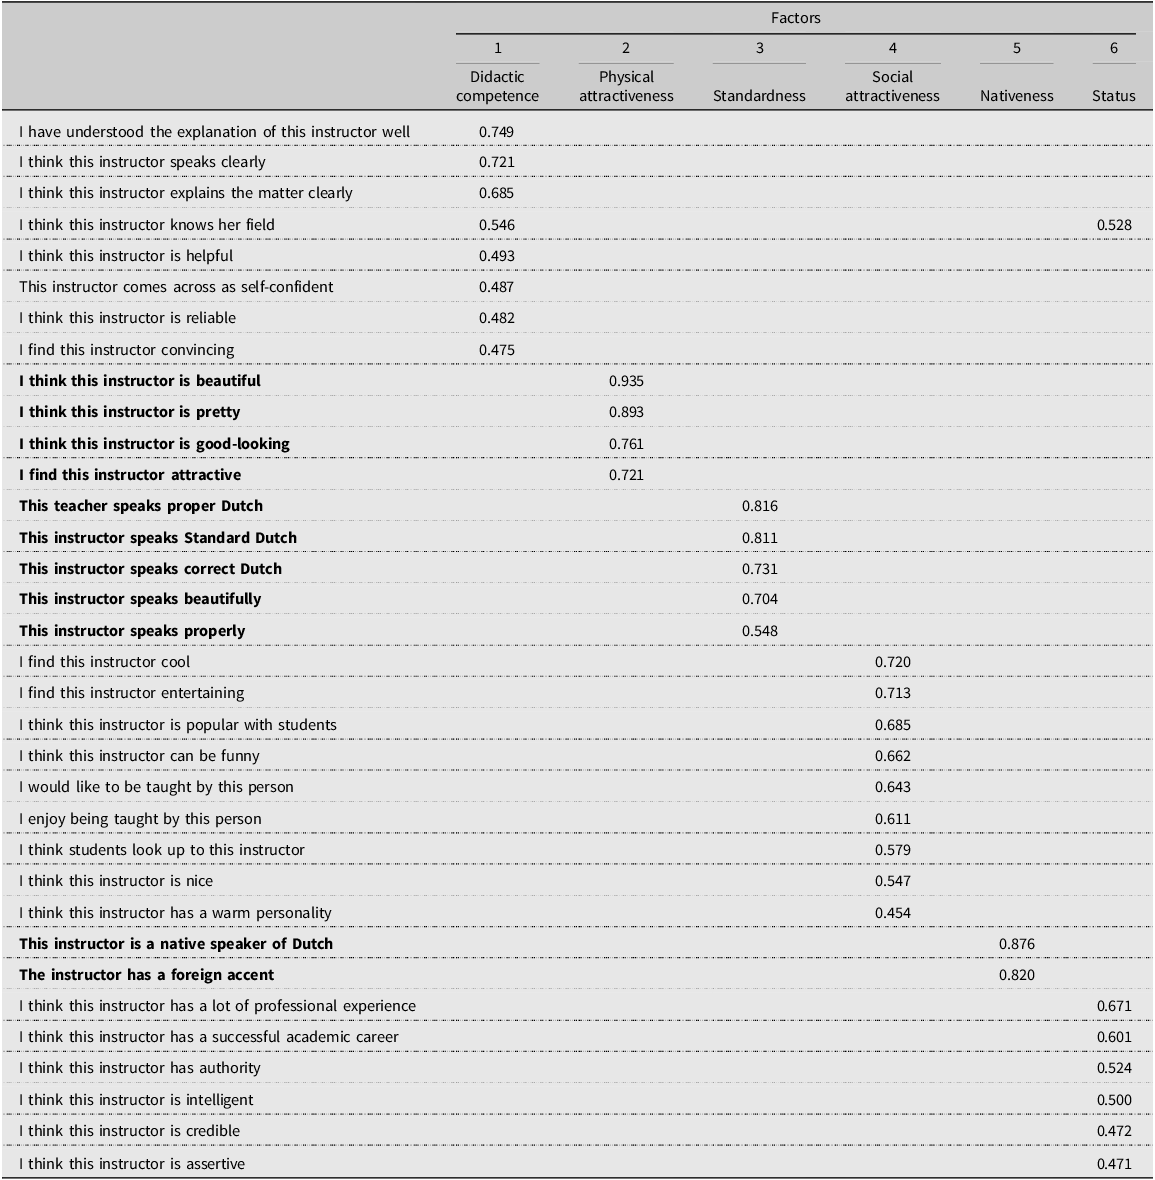
As for the labels assigned to the factors, we first checked if the items loaded on the same factors as they did in Lybaert et al. (Reference Lybaert, Van Hoof and Deygers2022), since this study employed the same set of items.Footnote 4 When consistency was observed, we adopted the same labels. This was the case for Factor 2, ‘Physical attractiveness’ and Factor 3, ‘Standardness’. All items in Factor 4 loaded similarly to the ones subsumed under ‘Social attractiveness’ in Lybaert et al. (Reference Lybaert, Van Hoof and Deygers2022), with the exception of the item ‘I think this instructor is helpful’, which in the present study loaded on Factor 1, rather than Factor 4.
The items in Factors 1, 5, and 6 clustered differently in Lybaert et al. (Reference Lybaert, Van Hoof and Deygers2022); therefore different labels were used in the present study. Factor 1 and Factor 6 together seem to involve two complementary aspects of a teacher’s professional competence. Factor 1 comprises features related to the teacher’s ability to explain matters clearly, their expertise, reliability and helpfulness, and was termed ‘Didactic competence’. Factor 6 comprised features related to professionalism, authority, credibility, experience, and success, and was labelled ‘Status’. Finally, the two items in Factor 5, referring to whether the speaker is a native speaker or has a foreign accent, can straightforwardly be captured by the label ‘Nativeness’.
5.4 Analyses of Variance
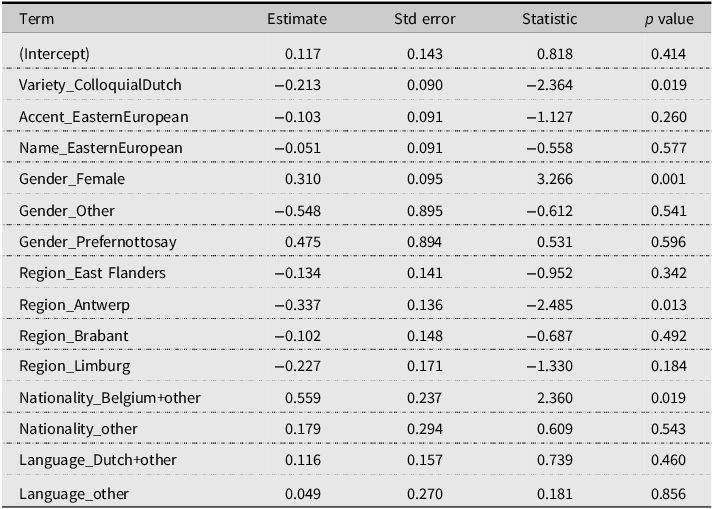
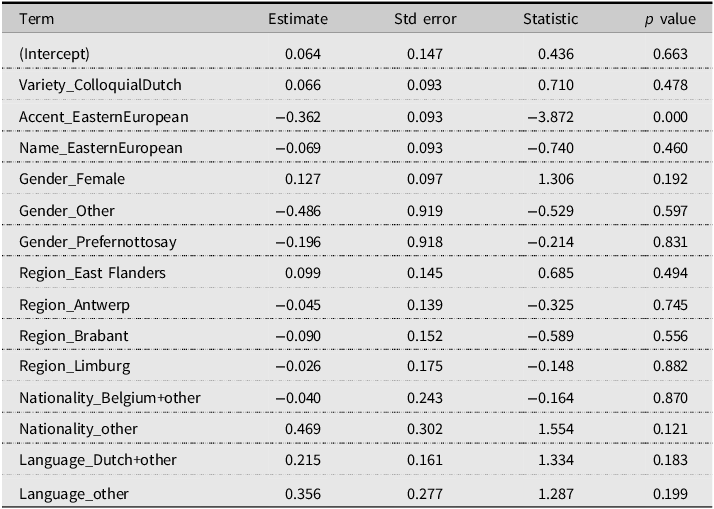
For the ANOVA, we focused primarily on the impact of the three key variables Variety (standard vs. colloquial), Name (Flemish vs. Eastern European), and Accent (Flemish vs. Eastern European) on the six factors: Didactic competence, Standardness, Social Attractiveness, Nativeness, Physical attractiveness, and Status (see the Appendix for the estimated coefficients). We conducted an examination of model assumptions as part of our analyses. This assessment of residuals only revealed the presence of two outlier observations in the construct of Physical attractiveness, but redoing the analysis without them did not significantly change the results, indicating that the outliers did not exert a significant impact on the overall findings.
No statistically significant effects were observed for the factors Physical attractiveness and Status: no main effects were detected, and the control variables gender, region, nationality, and home language did not exert any significant influence on the results. We did observe significant effects for the factors Didactic competence, Standardness, Social attractiveness, and Nativeness.
For Didactic competence, we did not find a significant effect of any of our three independent variables Variety, Accent, or Name. We did find a significant effect for the control variable Gender (Figure 3): female participants judged the speaker as more competent than male participants.
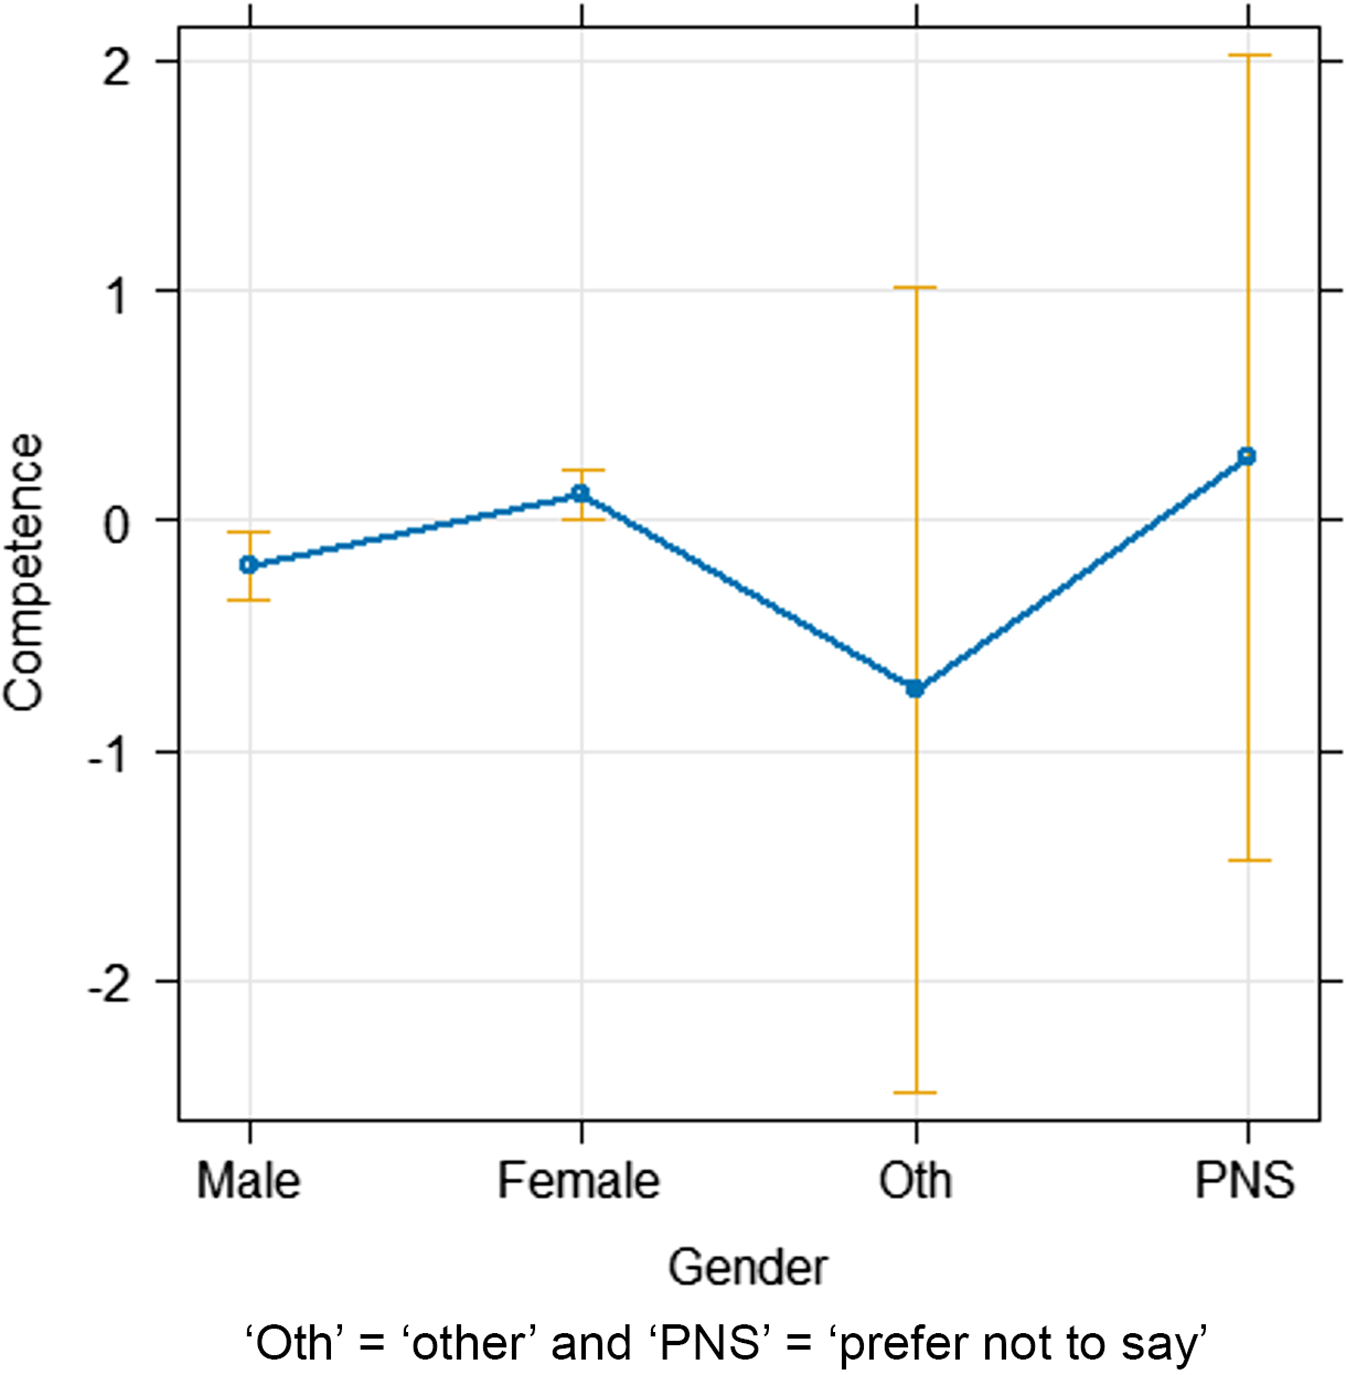
Figure 3. Estimated marginal means for Competence.
For Standardness, we did not observe any significant effect of Name. Our analysis did reveal a significant two-way interaction effect between Variety and Accent, visualised in Figure 4. Generally, the speaker is assessed as more standard when using the standard variety as opposed to a colloquial one. However, this effect is more pronounced when the speaker has a Flemish accent, compared to when she has an Eastern European accent. The lower score of the Standard Dutch guise with the Eastern European accent vis-à-vis its Flemish-accented counterpart indicates that foreign accent negatively impacts evaluations of Standardness.
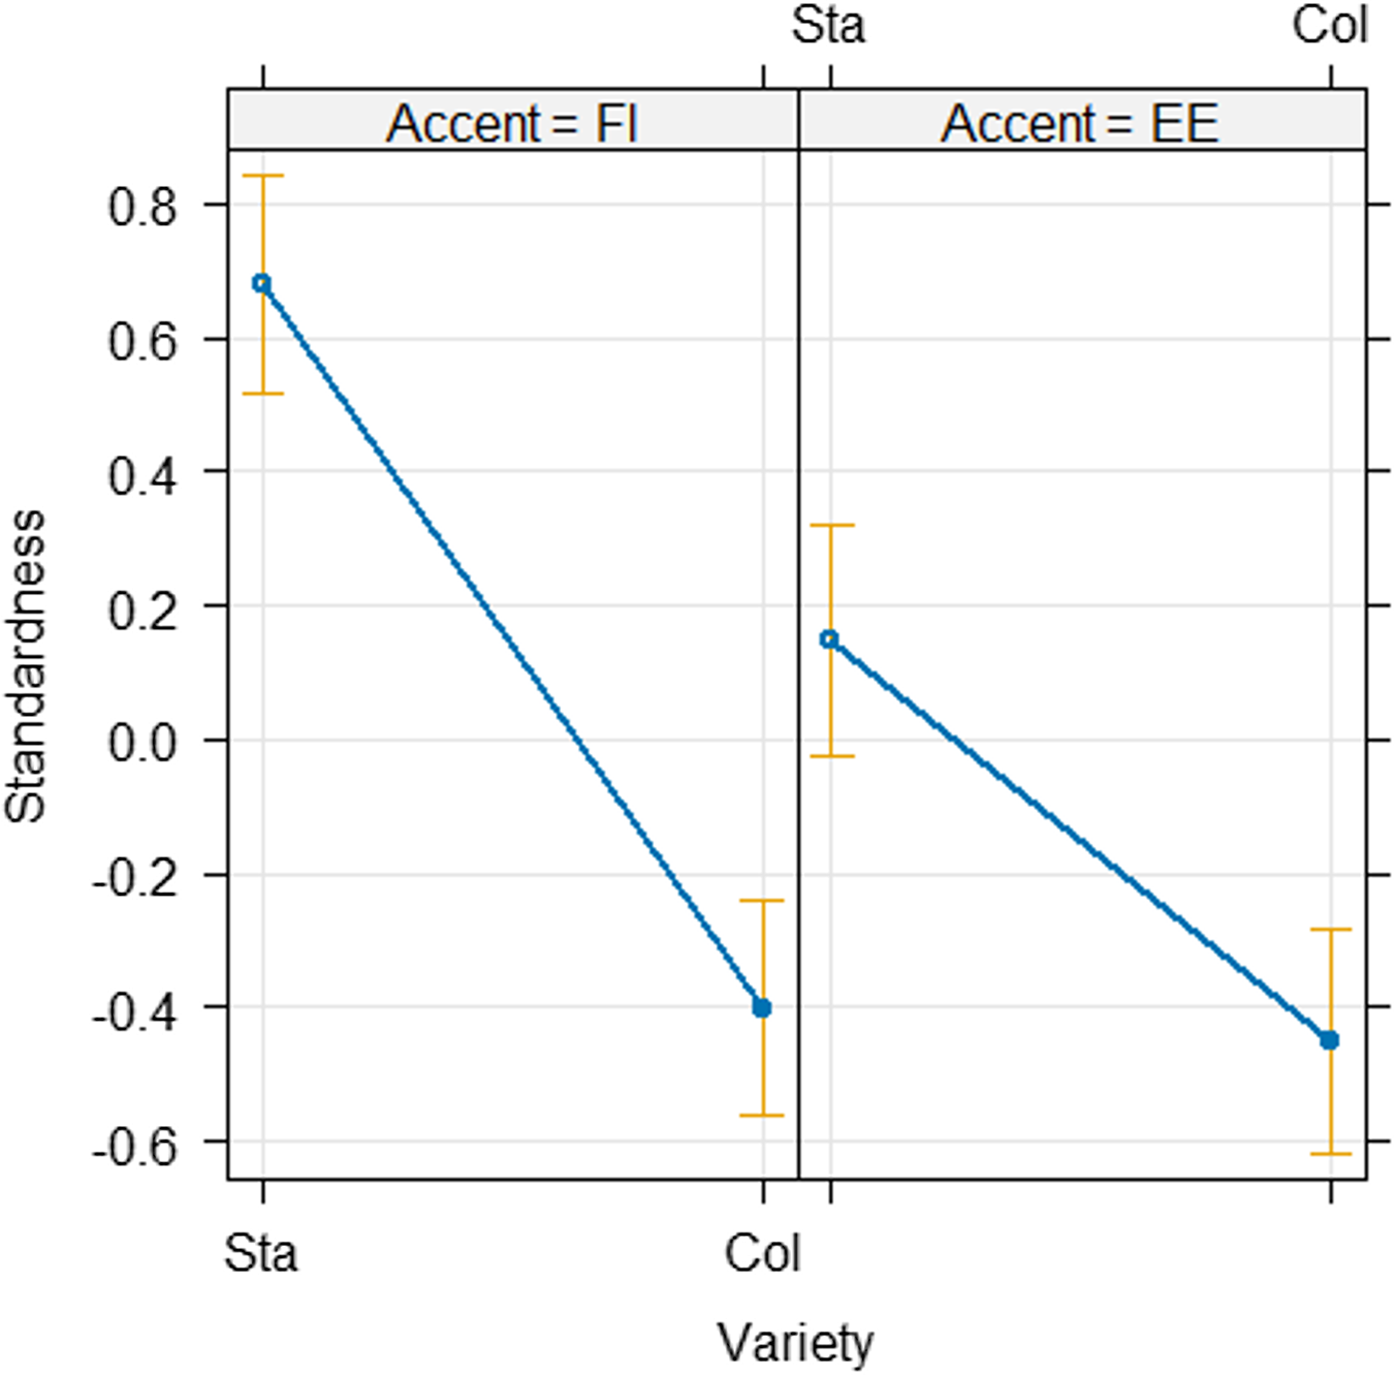
Figure 4. Estimated marginal means for Standardness.
For Social attractiveness, only the main effect of Accent was statistically significant (Figure 5). An Eastern European accent has a negative influence on the perception of Social Attractiveness compared to a Flemish accent. We did not observe any significant effects associated with Name or Variety for this factor.
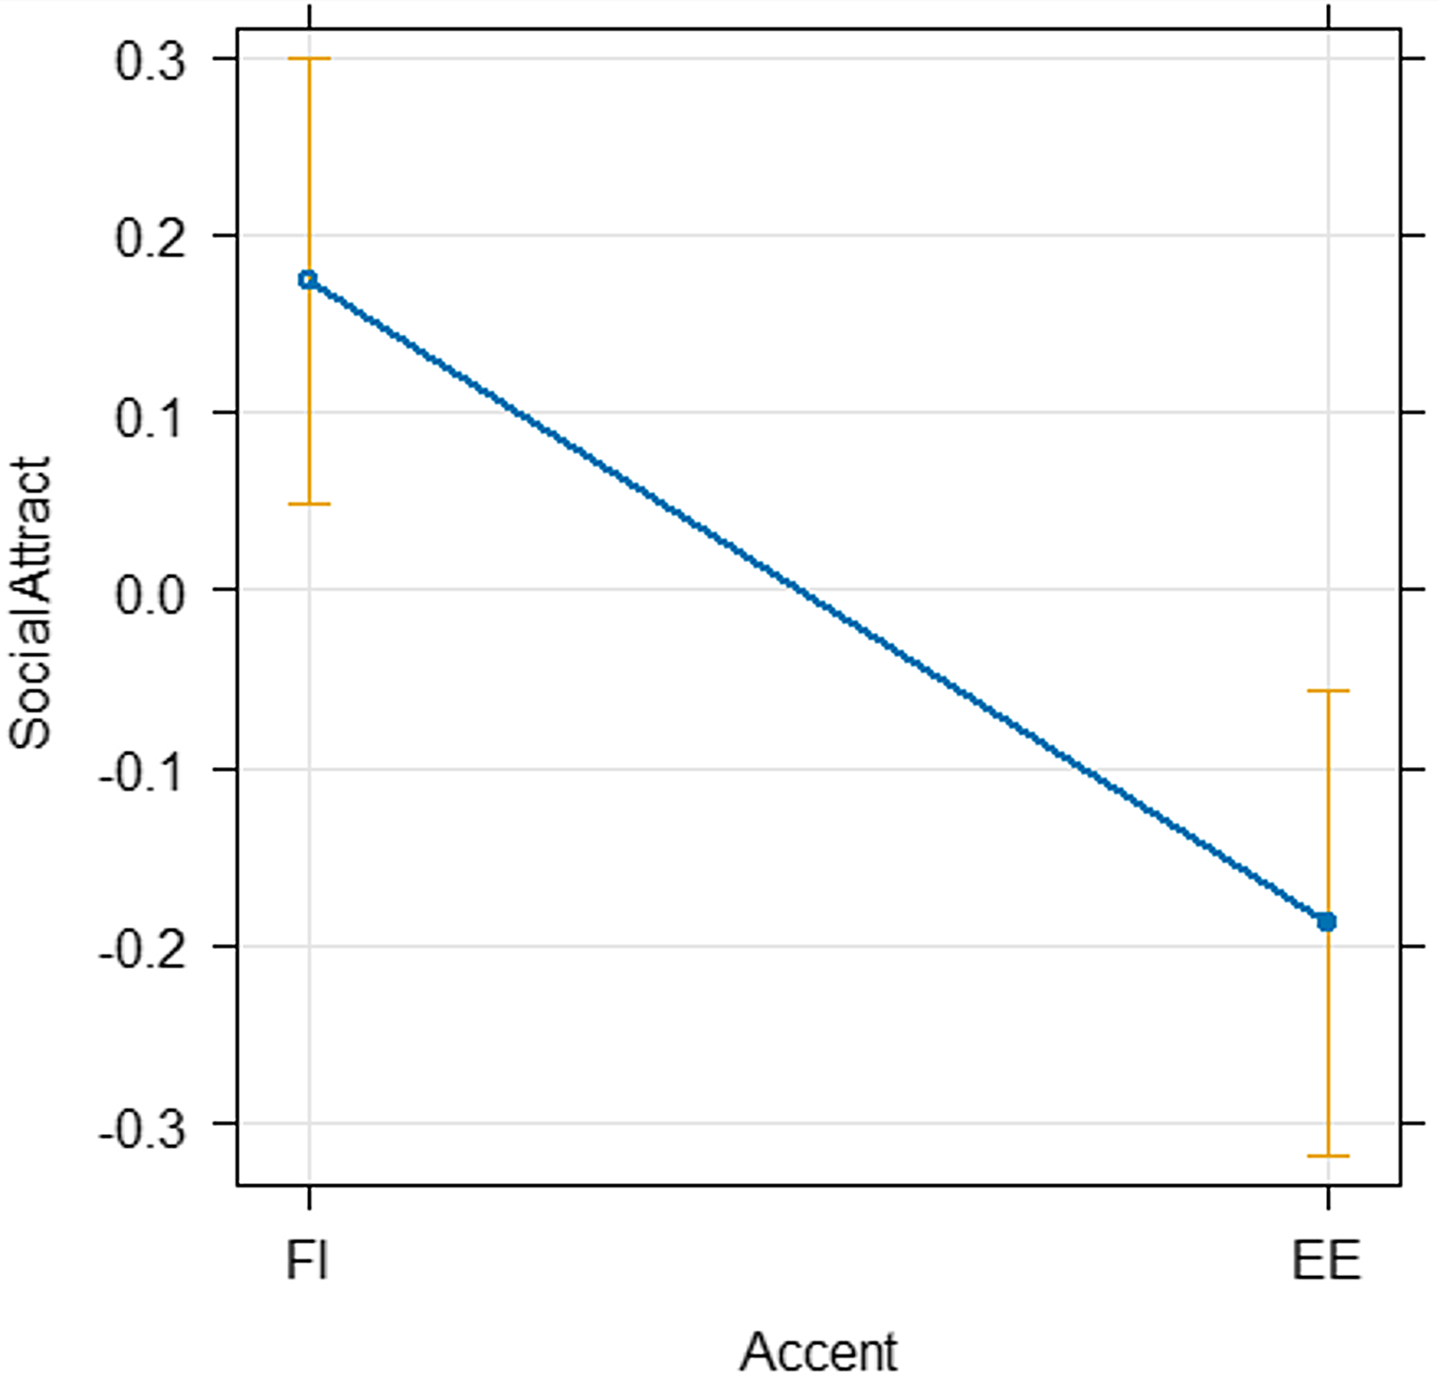
Figure 5. Estimated marginal means for Social attractiveness.
For Nativeness, we found a significant two-way interaction effect between Accent and Name, shown in Figure 6. As expected, the Flemish accent is perceived as more native than the Eastern European accent. However, this effect is accentuated when the speaker also has a Flemish name: combined with a Flemish name, the Flemish accent scores higher on Nativeness than when it is paired with an Eastern European name. This suggests that a foreign name has a negative impact on perceptions of nativeness. We did not observe any significant effect of Variety on this factor.
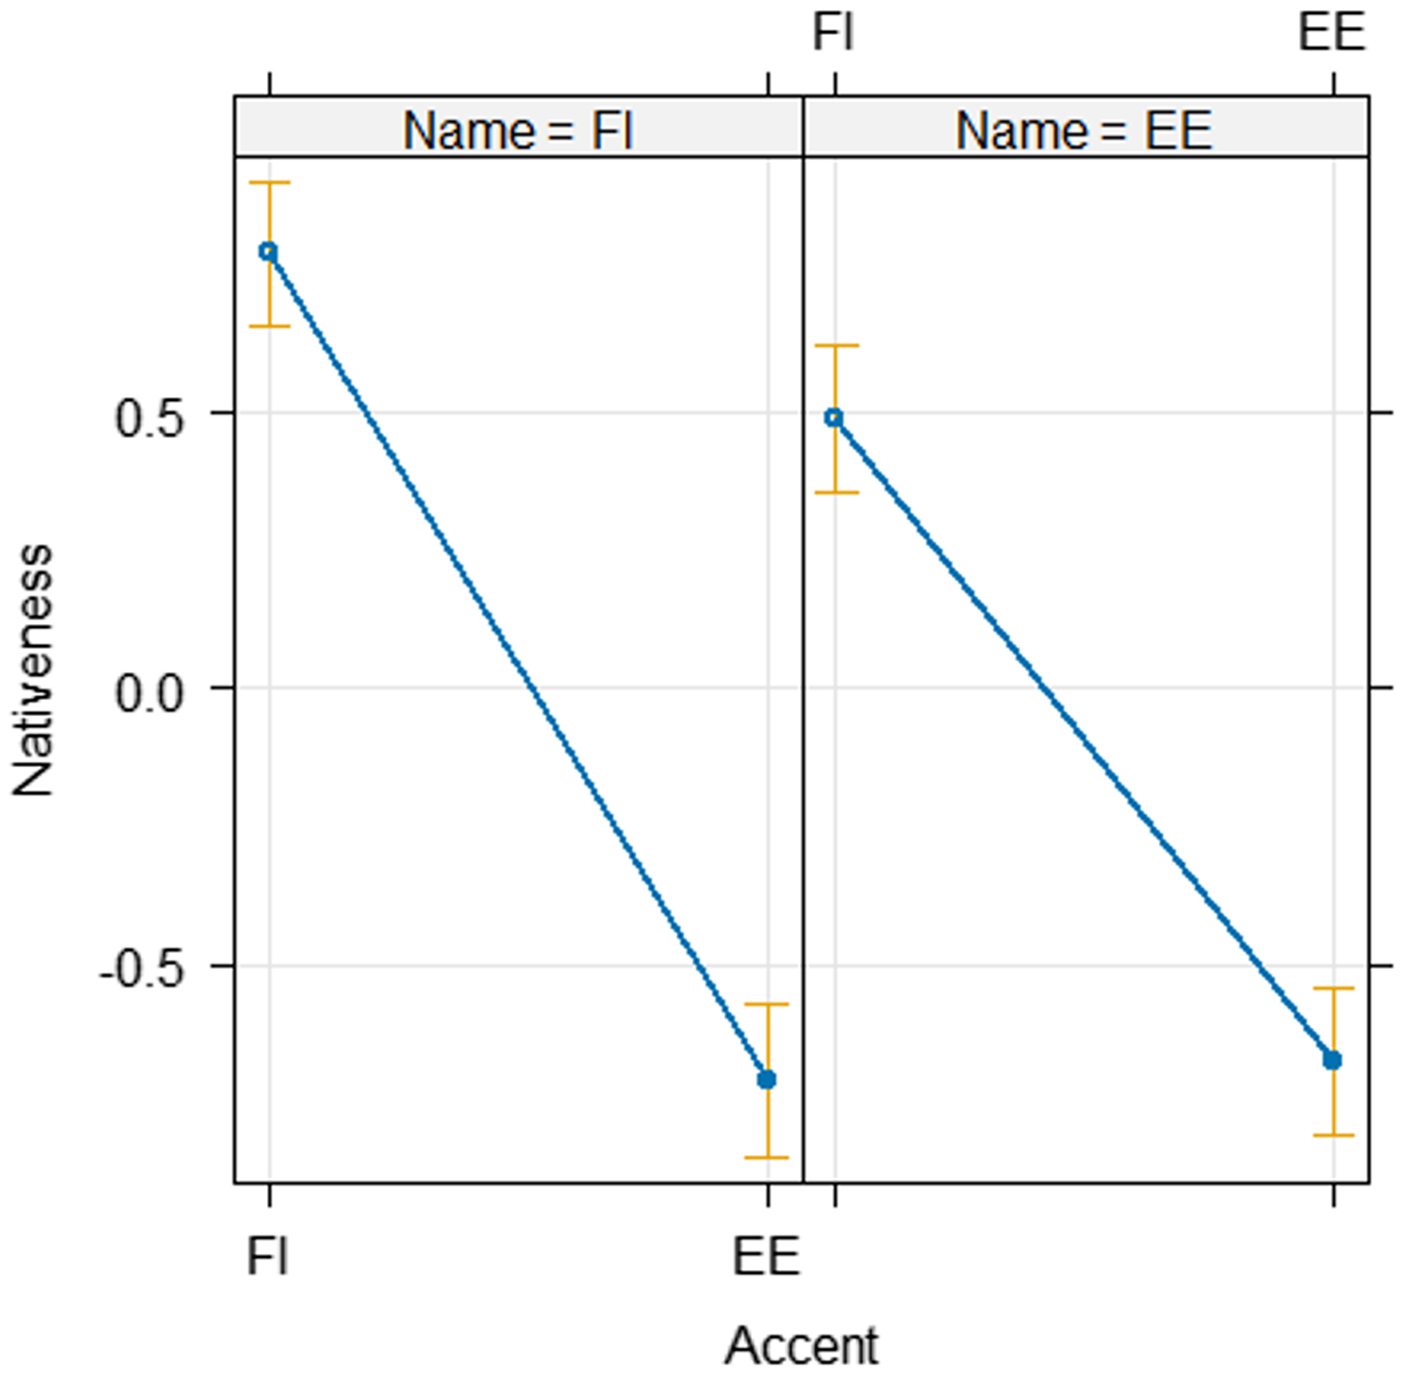
Figure 6. Estimated marginal means for Nativeness.
6. Discussion and conclusion
In this study we tried to gauge the effect of language variety, accent and name on students’ perceptions of a female university instructor. In this section we will discuss our interpretation of the results for these three variables.
As for the effect of variety, most previous speaker evaluation experiments have demonstrated an upgrading of Standard Dutch vis-à-vis Colloquial Dutch on superiority and status-related traits (Impe & Speelman Reference Impe and Speelman2007, Vandekerckhove & Cuvelier Reference Vandekerckhove, Cuvelier, Pol Cuvelier, Meeuwis and Teck2007, Ghyselen Reference Ghyselen2009, Grondelaers & Speelman Reference Grondelaers, Speelman, Kristiansen and Grondelaers2013), results which have generally been interpreted as indicative for the vitality of a standard language ideology in Flanders. In the present study, the scores for Standardness indicate that the participants were able to distinguish between Standard and Colloquial Dutch, and that they judged Standard Dutch to be more ‘correct’, ‘proper’, and ‘beautiful’ than Colloquial Dutch. However, the higher score of Standard Dutch on Standardness did not lead to a more positive judgement of the standard-speaking teacher on any of the evaluative dimensions Status, Didactic competence or Social attractiveness. This is somewhat surprising, given the high symbolic value attached to Standard Dutch in public discourse, and especially in the context of education (see Section 3). The absence of any pattern of downgrading for the non-conforming variety in this study aligns with the findings of our previous speaker evaluation experiment in the higher educational context (Lybaert et al. Reference Lybaert, Van Hoof and Deygers2022), where no general downgrading of Colloquial Dutch was observed on Professionalism and Authority either, and with those of Zenner et al. (Reference Zenner, Grondelaers, Rosseel, Speelman, Esselinckx and Rombouts2021), who found no downgrading of Colloquial Dutch in the professional context of speech therapy. Our results suggest that Standard Dutch is still connected to values such as beauty and correctness when elicited directly (as previously also observed by Lybaert Reference Lybaert2017, Grondelaers et al. Reference Grondelaers, Speelman, Lybaert and van Gent2020, and Lybaert et al. Reference Lybaert, Van Hoof and Deygers2022), but that these stereotypical values have a more limited impact when speakers are judged indirectly and in a specific setting. Just as in Lybaert et al. (Reference Lybaert, Van Hoof and Deygers2022), the absence of any preference for the Standard Dutch speaking instructor moreover casts doubt on the assumption that students consider the use of standard speech a conditio sine qua non for instructors in higher education to come across as professionally competent.
If we look at the effect of accent, the scores for Nativeness indicate that the participants clearly recognised the Flemish accent as native and the Eastern European accent as non-native. Moreover, slightly less than half of the participants correctly localised the foreign accent in Eastern Europe. Interestingly, the presence of a foreign name steered the perception of accent: the Flemish accent was perceived as less native when combined with an Eastern European name than when combined with a Flemish name. This result bears resemblance to Rubin (Reference Rubin1992)’s finding: in his study, North American undergraduates evaluated the same tape-recorded speech sample spoken in Standard American English as more foreign when combined with a photograph of an Asian woman compared to a white woman. Similarly to the effect of the visual cue in Rubin (Reference Rubin1992), in our study, the presence of a foreign name increased the perception of a foreign accent. Furthermore, it is worth noting that the Eastern European accent had a negative impact on perceptions of the Standardness of the instructor’s speech (comprising the features beauty, properness, and correctness) as well.
Similar to our observations for the effect of variety, the negative effects of the Eastern European accent on the direct measures Nativeness and Standardness did not translate into a general downgrading of this accent on the indirect attitudinal measures. Contrary to what we might expect on the basis of the literature reviewed in Section 2, we found no evidence of downgrading of the Eastern European accent compared to the Flemish accent on Didactic competence, nor on Status. However, the Flemish accent did score significantly higher on Social attractiveness than the Eastern European accent. Hence, indications of an accent bias vis-à-vis teachers with an Eastern European accent were present for social attractiveness, but were absent for the other dimensions.
Finally, as for the effect of name, we did not detect any evidence of a name bias. These results align with the findings of Lybaert et al. (Reference Lybaert, Van Hoof and Deygers2022) and Van Puyvelde et al. (Reference Van Puyvelde, Sarah Van Hoof and Plevoets2023), where a bias against foreign names (Arabic in Lybaert et al. Reference Lybaert, Van Hoof and Deygers2022, Turkish in Van Puyvelde et al. Reference Van Puyvelde, Sarah Van Hoof and Plevoets2023) was not observed either.
All in all, our results show that while respondents do recognise non-conforming speech (i.e. non-standard and foreign-accented) as such, this recognition does not significantly seem to disadvantage the instructor in terms of her perceived professional competence. Apart from the more negative evaluations of the Eastern European accent on social attractiveness, our findings seem to suggest that Flemish students in higher education are fairly tolerant towards the non-conforming speech and non-conforming speakers we used in our study.
A few caveats are in order here. First, the results we obtained for an Eastern European accent in this study cannot be generalised to other accents. Further research incorporating different accents from other cultural backgrounds is needed in order to assess whether the relative tolerance we observed also extends to other foreign accents. Second, we cannot exclude the effects of a social desirability bias. As noted in Section 5.1, the participants in the conditions with the Eastern European accent demonstrated a higher awareness of issues related to the research goal (accent, dialect, ethnicity, prejudice, discrimination) in the more detailed comments in the debriefing check. This awareness may have led to more socially desirable responses in the conditions with the Eastern European accent. Furthermore, name-based discrimination, especially on the labour and the housing market, had received quite a lot of attention in the Flemish public debate in recent years, and both local and regional governments have taken measures to trace discrimination against ethnic minorities in housing and recruitment. This heightened public awareness of name-based discrimination may have caused our participants to underreport negative attitudes vis-à-vis the foreign name in this study. Put differently, the absence of evidence of any discernible adverse effects of the Eastern European accent and name on the attitudinal measures we included does not prove the absence of such an effect altogether.
To conclude this paper, we would like to highlight the methodological challenges that attempts to trace biases against non-conforming speech and speakers are faced with. It goes without saying that an experimental setting necessarily remains artificial, and the judgements participants provide in a lab setting can never be entirely equivalent to the way they would judge instructors in real-life settings. Despite these shortcomings, we do hope we have demonstrated the value of contextualised experimental studies of language attitudes for gauging the impact of stereotypical beliefs on judgements of speakers in specific settings, rather than in abstracto. As for future experimental research, the rapid development of AI, and more specifically, of accent generators, may provide opportunities for creating realistic audiovisual stimuli in which a single speaker produces different accents. Furthermore, in order to diminish potential effects of a social desirability bias, it is also worth further exploring more indirect techniques for measuring biases than the matched-guise technique. Although several studies have demonstrated the value of techniques such as the Implicit Association Test (IAT), incorporating context in such techniques remains particularly challenging (Rosseel et al. Reference Rosseel, Speelman and Geeraerts2019a). Finally, increasing the linguistic and cultural diversity of the settings in which bias is investigated is warranted, in order to counterbalance the current predominance of anglophone studies.
Supplementary material
To view supplementary material for this article, please visit https://doi.org/10.1017/S033258652400009X
Acknowledgements
We are grateful for the financial support we received from the Department of Translation, Interpreting & Communication (Ghent University). Thanks are due to Sam Delmotte for his assistance with the speech stimuli, and to two anonymous reviewers for their insightful comments on an earlier version of this paper.
Competing interests
The authors declare none.
Appendix: Estimated coefficients
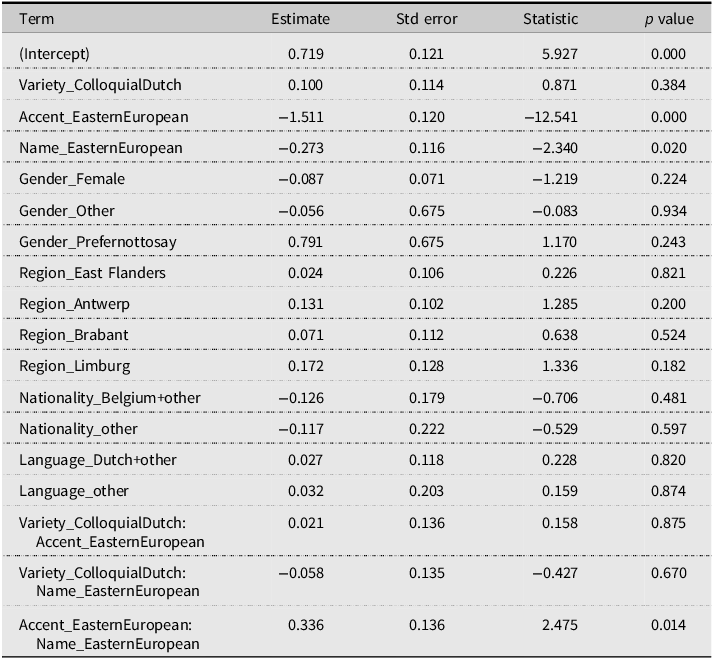
A1. Factor 1: Didactic competence
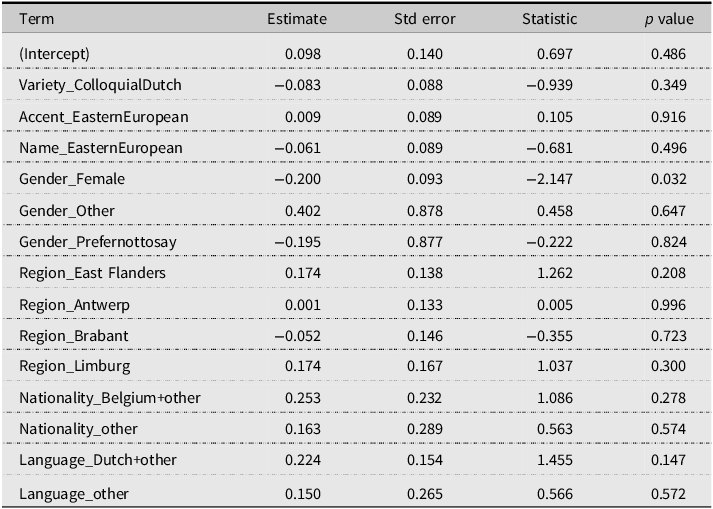
A2. Factor 2: Physical attractiveness

A3. Factor 3: Standardness

A4. Factor 4: Social attractiveness
A5. Factor 5: Nativeness
A6. Factor 6: Status


 Open access