UK Biobank is a prospective cohort of half a million men and women from across the UK. Information on a broad range of exposures, including diet, was collected from the participants at an assessment centre, and linkage to cancer and death registries, as well as other medical records, enables many hypotheses to be examined( Reference Sudlow, Gallacher and Allen 1 ). The UK Biobank dataset is an open access resource; any bona fide researcher can apply to use the data for health-related research that is in the public interest( Reference Sudlow, Gallacher and Allen 1 ).
At recruitment, the touchscreen questionnaire used in UK Biobank asked twenty-nine questions about diet, most of which gathered information about the average frequency of consumption of main foods and food groups over the past year. Prior to using the data from the touchscreen questionnaire in diet–disease analyses, it is important to examine the reproducibility of the dietary questions. Future studies in UK Biobank may rank participants according to dietary intake from the touchscreen questionnaire and assess relative risk of disease across categories of intakes; misclassification in the ranking of participants according to dietary intakes will be expected to underestimate associations between diet and disease risk( Reference Clarke, Shipley and Lewington 2 ). Using a subsample of approximately 20 000 participants who completed a repeat of the assessment centre visit( 3 ), about 4 years after recruitment, enables an examination of the combination of the variation in response to the questionnaire as well as true changes in intake over time, both of which contribute to misclassification of long-term dietary intakes( Reference Willett 4 ).
The agreement between the touchscreen questionnaire, which asked about frequency of consumption, and a more detailed dietary assessment method which gathers information on actual amounts of food consumed, can be used to further evaluate the touchscreen dietary data. A web-based 24-h dietary assessment tool( Reference Liu, Young and Crowe 5 ) was also used in UK Biobank to gather additional information on dietary intakes; over 200 000 participants completed at least one 24-h dietary assessment, and the mean intakes from the 24-h dietary assessments can be used for this purpose.
The objectives of the present paper are to describe the reproducibility of the touchscreen questions, using the subsample of participants who repeated the assessment centre visit, and to examine the agreement between the dietary touchscreen variables and the group mean intakes from the web-based 24-h dietary assessments conducted on a large subsample of participants.
Methods
UK Biobank
UK Biobank is a prospective cohort of half a million middle-aged men and women recruited from the UK in 2006 (pilot phase) and 2007–2010 (main phase). People aged 40–69 years who lived within reasonable travelling distance (25 km) of one of the twenty-two assessment centres in England, Scotland and Wales were identified from National Health Service patient registers and invited to attend an assessment centre. Permission for access to patient records for recruitment was approved by the Patient Information Advisory Group (subsequently replaced by the National Information Governance Board for Health and Social Care) in England and Wales, and the Community Health Index Advisory Group in Scotland. At the UK Biobank assessment centres, a touchscreen questionnaire was used to collect information on sociodemographic characteristics, diet and other lifestyle exposures, general health, and medical history. Physical measurements were also taken and participants provided blood and urine samples. Participants are followed up via linkage to cancer and death registries, as well as other health records( Reference Sudlow, Gallacher and Allen 1 ).
This study was conducted according to the guidelines laid down in the Declaration of Helsinki and all procedures involving human subjects/patients were approved by the North West Multi-centre Research Ethics Committee. At the touchscreen station, all participants gave informed consent to participate in UK Biobank and be followed up, using a signature capture device. The UK Biobank protocol is available online (http://www.ukbiobank.ac.uk/wp-content/uploads/2011/11/UK-Biobank-Protocol.pdf). The touchscreen questionnaire and other resources are available on the UK Biobank website (http://www.ukbiobank.ac.uk/resources/).
Dietary assessment
Touchscreen questionnaire
The touchscreen questionnaire used in the main study contained twenty-nine questions about diet and eighteen questions about alcohol. The touchscreen questionnaire asked about the frequency of consumption over the past year of the following food groups: cooked vegetables, salad/raw vegetables, fresh fruit, dried fruit, oily fish, other fish, processed meats, poultry, beef, lamb, pork, cheese, salt added to food, tea, water, as well as questions on the type of milk most commonly consumed, type of spread most commonly consumed, number of slices and type of bread most commonly consumed, number of bowls and type of breakfast cereal most commonly consumed, cups of coffee and type most commonly consumed, as well as questions on the avoidance of specific foods and food groups (eggs, dairy products, wheat, sugar), age last ate meat (for participants who reported never consuming processed meats, poultry, beef, lamb or pork), temperature preference of hot drinks, changes in diet in the past 5 years, and variation in diet. Four of the dietary questions used in the pilot study were altered slightly for the main phase: these were the questions on avoiding specific foods and food groups; spread type; bread type; and variation in diet. A total of 3776 participants completed only the pilot version of the touchscreen; for analyses on these questions the participants answering only the pilot version were excluded. Details of the possible answers for each dietary touchscreen question are given in the Supplementary Methods( 6 , Reference Finglas, Roe and Pinchen 7 ). We also generated a partial fibre score from the touchscreen questionnaire using the questions on fresh fruit, dried fruit, raw vegetables, cooked vegetables, bread type and bread intake, and breakfast cereal type and breakfast cereal intake. Further detail on how we generated the partial score is given in the Supplementary Methods and Supplementary Table S1.
Web-based 24-h dietary assessments
In early 2009, the main study protocol was modified to include a number of enhancements to the assessment centre visit( 8 ). These enhancements included the Oxford WebQ, a web-based 24-h dietary assessment tool, which asks about the consumption of up to 206 types of foods and thirty-two types of drinks during the previous 24 h. The mean daily intakes of nutrients were calculated by multiplying the frequency of consumption of each food or drink by a standard portion size and the nutrient composition of that particular item. The web-based 24-h dietary assessment has been compared with an interviewer-administered 24-h recall completed on the same day, with Spearman's correlation coefficients for the majority of nutrients calculated from the WebQ ranging between 0·5 and 0·9 (mean of 0·6)( Reference Liu, Young and Crowe 5 ). Participants who were recruited between April 2009 and September 2010 completed the 24-h dietary assessment at the assessment centre. In addition, after the recruitment period closed, an email was also sent out every 3–4 months a total of four times between February 2011 and June 2012 (online cycle 1, February 2011 to April 2011; online cycle 2, June 2011 to September 2011; online cycle 3, October 2011 to December 2011; online cycle 4, April 2012 to June 2012) to participants who had provided an email address at recruitment, inviting them to complete the Oxford WebQ online using their own computer. The email invitations were sent on variable days of the week, and participants were given 3 d to complete it for cycles 1 and 2, and this was extended to 14 d for cycles 3 and 4, after which the link expired. For all analyses, we excluded 24-h dietary assessments where the energy intakes were greater than 20 000 kJ for men (1758 records from a total of 203 955 (0·86 %)), and 18 000 kJ for women (1736 records from a total of 254 798 (0·68 %)). In a sensitivity analysis, we also excluded 24-h dietary assessments where participants specified that their diet for that day was not typical because of fasting or illness; this did not have a large effect on the results, so all results are reported with these participants included.
Repeatability of the touchscreen questionnaire
Approximately 20 000 participants who resided in the area surrounding UK Biobank's coordinating centre in Stockport undertook a full repeat of the assessment centre visit, between August 2012 and June 2013, approximately 4 years after recruitment( 3 ).
To assess the long-term repeatability of the dietary questions on the touchscreen questionnaire, as well as the new partial fibre score, we used the subsample of participants who had completed the repeat assessment centre visit and examined the agreement between participants’ responses to the dietary questions on the touchscreen questionnaire completed at baseline and the repeat visit. For this analysis, questions where the possible responses were categorical, i.e. questions on fish, meat, cheese, types of milk, spread, bread, cereal, salt added to food, temperature of hot drinks, major changes to diet, and variation in diet, we cross-tabulated the answers as recorded. For questions that used direct entry responses, we truncated or collapsed answers into categories to enable cross-tabulation as follows: for servings of fruit and vegetables we used 0, 1, 2, 3, 4, ≥5; for the derived partial fibre score we categorised participants into fifths based on the whole cohort. For age last ate meat we used 0–10, 11–20, 21–30, 31–40, 41–50, 51–60, ≥61 years; for slices of bread we used 1–5, 6–10, 11–15, 10–20, 21–25, 26–30, ≥31; for bowls of breakfast cereal we used 0, 1, 2, 3, 4, 5, 6, 7, ≥8, for cups of tea and coffee and glasses of water we used 0, 1, 2, 3, 4, 5, ≥6. For all questions, participants selecting ‘do not know’, ‘prefer not to answer’ or ‘less than one’ were assigned to separate categories, except for number of bread slices where ‘less than one’ was combined with ‘0’ because of very low numbers for both of these groups. For the question on foods avoided we created binary variables for each food item, e.g. consumers/non-consumers of dairy products.
After excluding participants who answered ‘do not know’ or ‘prefer not to answer’ at either baseline or the repeat visit, we also assessed agreement using the κ coefficient. Bootstrapping with 10 000 replications was used to calculate CI around the κ coefficient. In a separate analysis, we also further excluded participants who reported, at the repeat visit, making a major change to their diet in the past 5 years. We also examined κ coefficients by sex, age (<55 years, ≥55 years) and BMI (<25 kg/m2, ≥25 kg/m2). For most of the dietary touchscreen questions, the categories of responses to the dietary questions were ordinal, ranging from least frequently eaten to most frequently eaten; therefore for these questions the κ coefficient with quadratic weighting was used, which is equivalent to the intra-class correlation coefficient and allows for the fact that a change from category 1 to category 2 reflects closer agreement over time than, for example, a change from category 1 to category 4( Reference Fleiss and Cohen 9 ). κ Values >0·80 indicate excellent agreement, values between 0·61–0·80 substantial agreement, 0·41–0·60 moderate agreement, 0·21–0·40 fair agreement, and ≤0·20 poor agreement( Reference Altman 10 ). For questions where the responses were not ordinal, e.g. bread or spread type mainly used, only the percentage in the same category is given, κ values were not calculated.
Agreement between the intakes of foods and food groups and the partial fibre score from the touchscreen dietary questions and group mean intakes from the 24-h dietary assessment
We created new variables for the weight (in g) from the 24-h dietary assessments of the food groups that were included in the touchscreen questionnaire: total vegetables; total fresh fruit; total dried fruit; oily fish; other fish; processed meat; poultry; beef; lamb; pork; cheese; tea; caffeinated coffee; decaffeinated coffee; water; white sliced bread; granary brown or mixed flours sliced bread; wholemeal sliced bread; bran cereal; wholewheat cereals; porridge; muesli; and plain cereals, sweetened oat crunch-type cereals, other sweetened cereals, and other cereals. This was done by using the steering file of the Oxford WebQ which contains the serving size of each food item listed in the 24-h dietary assessment, in g (data not shown). To estimate daily intake, the serving size in g was multiplied by the frequency reported in the 24-h dietary assessment. The top frequency category was open ended and differed by food group; these were coded so that 3+ = 3, 4+ = 4, 5+ = 5, 6+ = 6. Less than one was coded as 0·5. Dietary variables from the 24-h dietary assessments were chosen to match the touchscreen food groups as closely as possible; details of the individual dietary variables from the 24-h dietary assessment that formed each food group are given in Supplementary Table S2.
For the purposes of comparing the touchscreen dietary variables with the 24-h dietary assessments, we grouped participants into categories for each food group based on the touchscreen questionnaire (for the main food groups of meat, fruit and vegetables we typically used four categories per food group), and these were compared with the 24-h dietary assessments in two ways. Firstly, within each category we calculated the mean intake (in g) of the same food group from participants who completed the 24-h dietary assessment tool at the assessment centre; this first analysis shows how well the touchscreen and 24-h dietary assessment tool agree when they are completed on the same day. Secondly, in each category we calculated the group mean intake of the corresponding food group from 24-h dietary assessments from participants who had completed one or more online 24-h dietary assessments. For participants who completed more than one online 24-h dietary assessments, we first averaged the values from all of their completed online dietary assessments. In this second analysis, we excluded the 24-h dietary assessments that were completed at the assessment centre on the same day as the touchscreen questionnaire; we used only the online 24-h dietary assessments because the aim was to take into account both change over time and variation in day-to day intakes, and therefore we wanted a lag time of at least a few months between the touchscreen questionnaire and the 24-h dietary assessment. To rank the participants by weekly red meat consumption based on the touchscreen, we summed the frequencies for beef, pork and lamb/mutton, using the following coding: ‘never’ = 0, ‘less than once per week’ = 0·5, ‘once per week’ = 1, ‘2–4 times per week’ = 3, ‘5–6 times per week’ = 5·5, ‘once or more daily’ = 7. The same approach was used for total meat consumption based on the touchscreen, which was the sum of processed meat, poultry, beef, pork and lamb/mutton.
Results
The initial dataset for the present study consisted of 502 640 participants who completed the touchscreen questionnaire at the recruitment visit. Of the participants, 20 348 repeated the touchscreen questions at the repeated assessment centre visit; the median time between administrations was 4·4 (25th–75th percentile 3·7–5·0) years. In total, 210 128 participants completed at least one 24-h dietary assessment with plausible energy intakes and 126 096 completed at least two 24-h dietary assessments; 70 046 participants completed a 24-h dietary assessment at the recruitment centre, and about half of these participants (n 35 322) also completed one or more online 24-h dietary assessments (Fig. 1 and Table 1). Basic participant characteristics are shown for the whole cohort, the subsample that completed a repeat assessment centre visit, and the subsample that completed at least one 24-h dietary assessment in Table 2. Participants who completed the repeat assessment centre visit or at least one 24-h dietary assessment were more likely to have a university degree or vocational qualification and slightly less likely to smoke, compared with the full cohort.
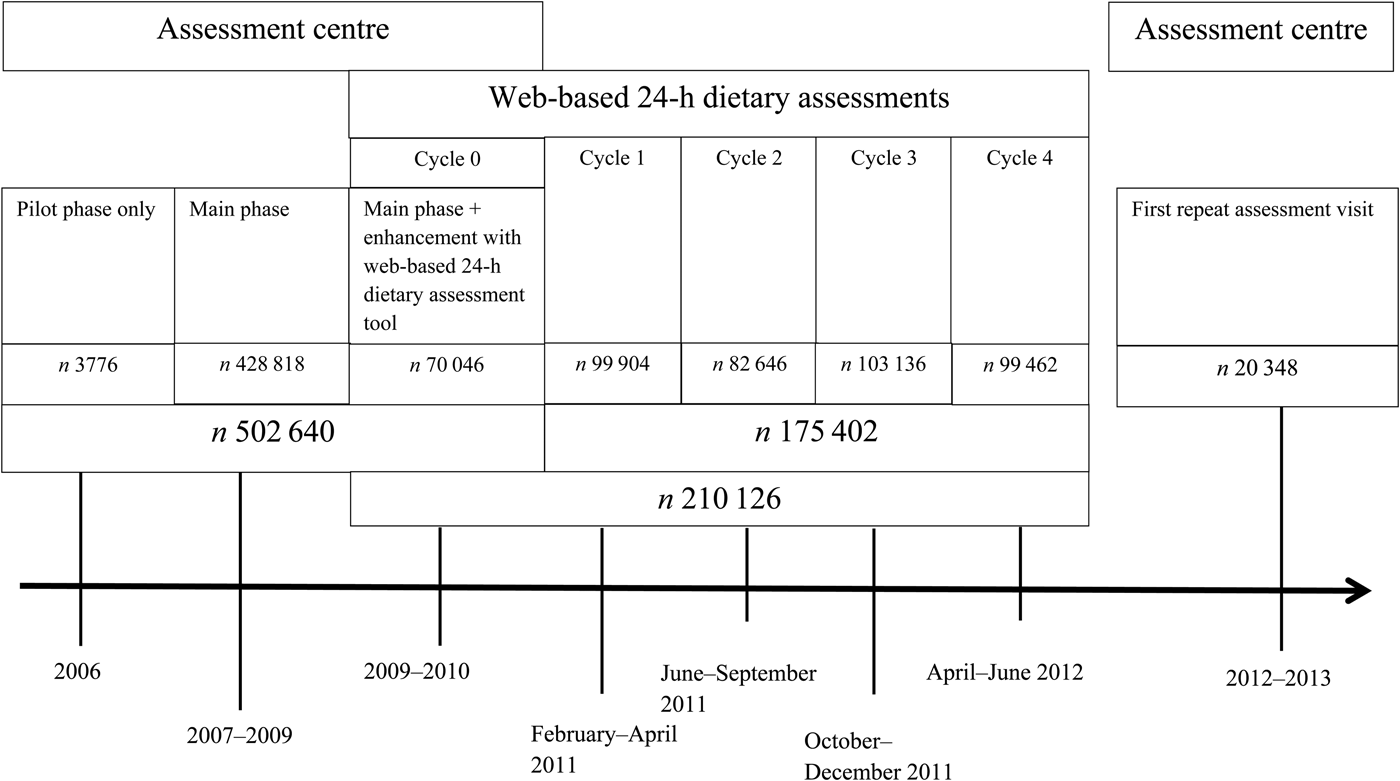
Fig. 1. UK Biobank participant flow showing numbers of people who participated in the assessment centre visit at recruitment, the web-based 24-h dietary assessments, and the repeat assessment centre visit.
Table 1. Number of participants who completed the web-based 24-h dietary assessment

* These are the participants who completed a 24-h dietary assessment at the assessment centre at recruitment. Some participants also completed online 24-h dietary assessments.
† These are the participants who did not complete a 24-h dietary assessment at the assessment centre at recruitment. They completed one or more online 24-h dietary assessments.
Table 2. Participant characteristics in the full UK Biobank cohort and in the subsamples who completed the repeat assessment and the 24-h dietary assessments
(Numbers of subjects and percentages; mean values and standard deviations)
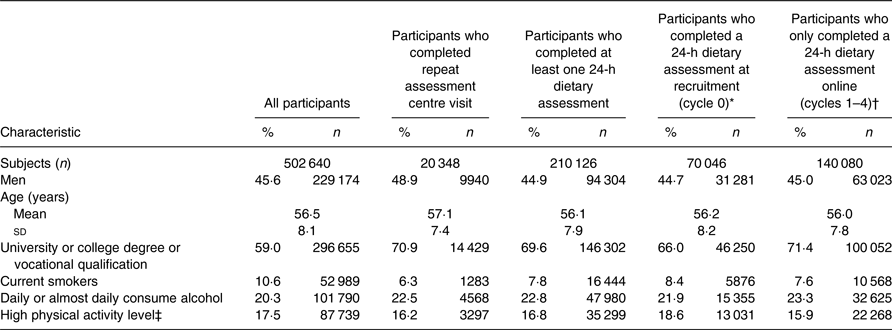
* Participants completed cycle 0 of the 24-h dietary assessment and may also have completed any of cycles 1–4.
† Participants completed at least one of cycle 1–4 of the 24-h dietary assessment, but did not complete cycle 0.
‡ High physical activity level is defined as >50 excess metabolic-equivalent hours per week.
Repeatability of the touchscreen questionnaire
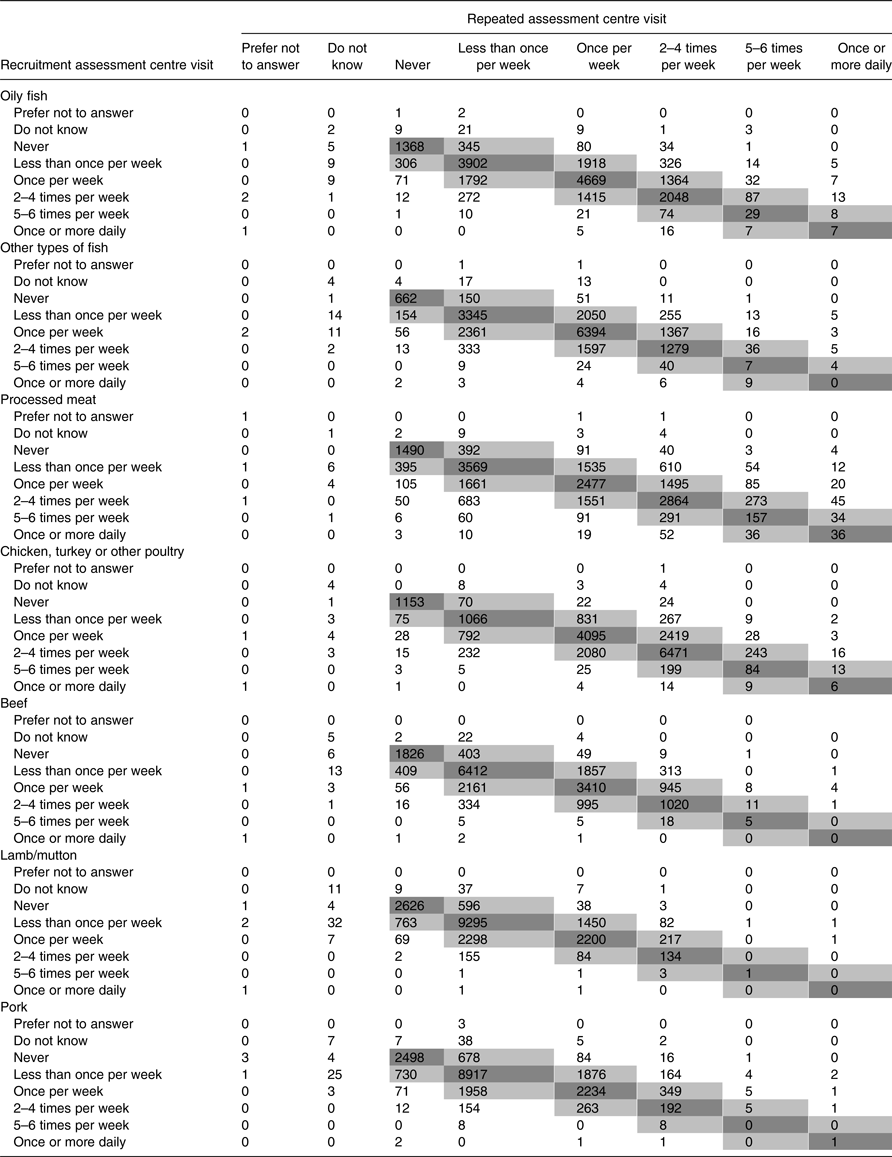
Table 3 shows the responses to the fruit and vegetable questions and the categorisation of participants into fifths based on the new partial fibre score, from the touchscreen questionnaire completed at baseline and at the repeat visit, for the subsample of participants who completed a repeat visit. Table 4 shows the results for the meat and fish questions. Table 5 shows the agreement and κ coefficient with quadratric weighting (κweighted) for these questions. Generally there was good agreement between reported consumption at recruitment and at the repeat assessment centre visit, approximately 4 years later. After excluding participants who selected ‘prefer not to answer’ or ‘do not know’ at either the recruitment or repeat assessment centre visit, the percentage of participants who were classified into the same or adjacent categories (same category only, total number of categories) was 82 % (42 %, seven categories) for cooked vegetables, 72 % (37 %, seven categories) for raw vegetables, 82 % (43 %, seven categories) for fresh fruit, 72 % (51 %, seven categories) for dried fruit, and above 95 % (above 55 %, six categories for each item) for all fish and meat items, except for processed meat which was 90 % (52 %, six categories). The weighted κ coefficient showed substantial agreement for fresh fruit, oily fish, processed meat, poultry, beef, and lamb, and moderate agreement for cooked vegetables, raw/salad vegetables, dried fruit, partial fibre score, other types of fish (non-oily) and pork. After excluding participants who reported that they made a major change to their diet in the past 5 years at the repeat visit, the weighted κ coefficient increased slightly for all items, and fibre and pork now showed substantial agreement. The κ coefficients were similar for men and women, and younger and older participants. Participants with a BMI < 25 kg/m2 had higher κ coefficients than participants with BMI ≥ 25 kg/m2 (Supplementary Table S3). The agreement for the other touchscreen dietary variables is shown in Supplementary Table S4.
Table 3. Reported daily consumption of fruit and vegetables among 20 348 participants who answered the dietary touchscreen questionnaire about 4 years apart*
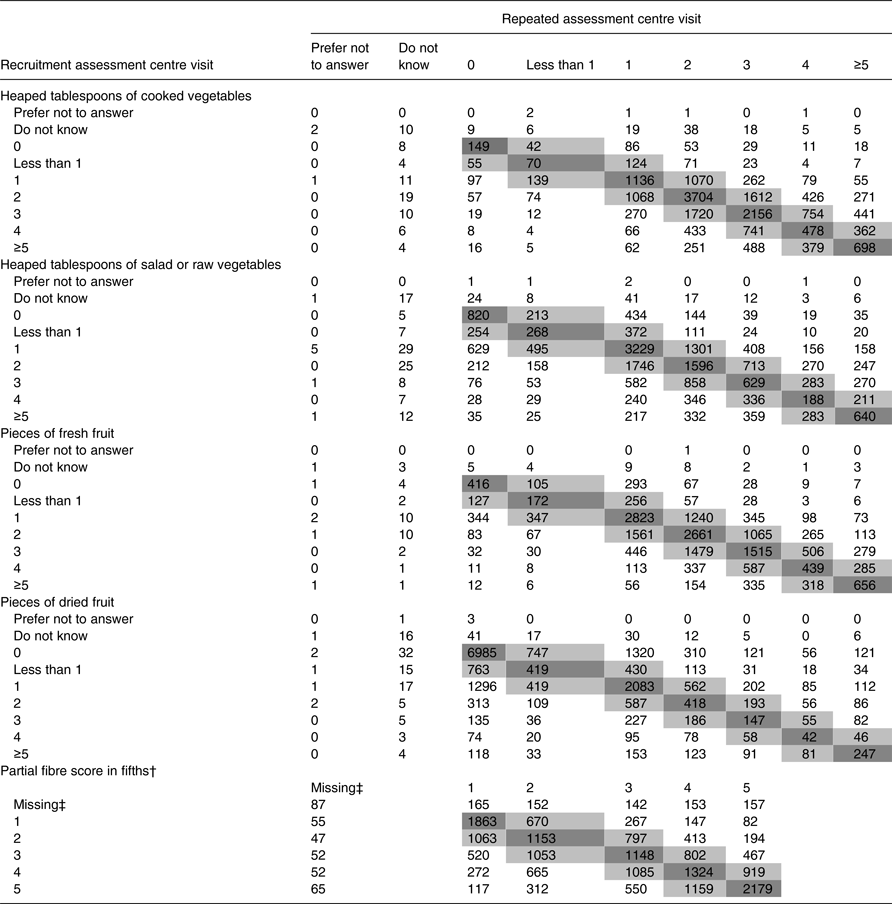
* Shaded cells depict participants categorised into the same (dark shading) or adjacent (light shading) category at recruitment and at the repeat assessment visit.
† Generated from UK Biobank touchscreen question on fruit, vegetables, bread and breakfast cereals.
‡ Participants who answered ‘prefer not to answer’ of ‘do not know’ to one or more of the components of the fibre score (fruit, vegetables, bread, or breakfast cereals) were assigned to missing.
Table 4. Reported consumption of fish and meat among 20 348 participants who answered the dietary touchscreen questionnaire about 4 years apart*
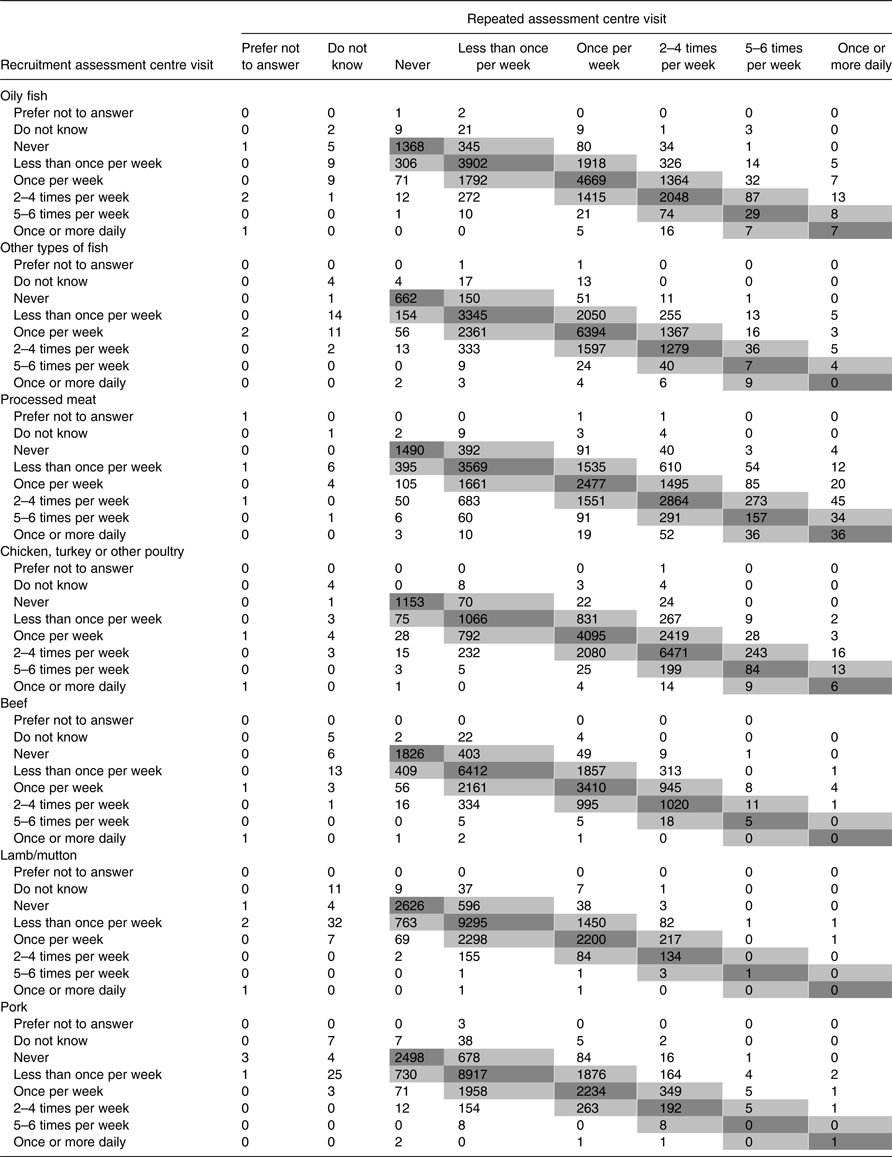
* Shaded cells depict participants categorised into the same (dark shading) or adjacent (light shading) category at recruitment and at the repeat assessment visit.
Table 5. Agreement of responses to dietary touchscreen questions at the baseline and repeat assessment centre visit
(κ Coefficients with quadratic weighting and 95 % confidence intervals)
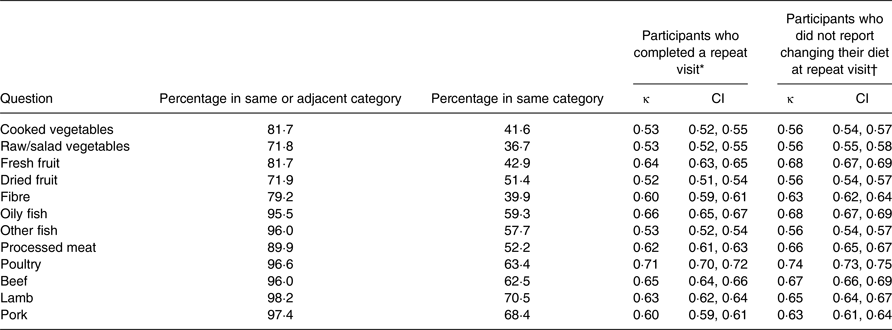
* For each item, people who answered ‘do not know’ or ‘prefer not to answer’ at either baseline or repeat visit were excluded. The sample size for each question is as follows: cooked vegetables, n 20 155; raw/salad vegetables, n 20 101; fresh fruit, n 20 263; dried fruit, n 20 116; fibre, n 19 221; oily fish, n 20 259; other fish, n 20 265; processed meat, n 20 300; poultry, n 20 302; beef, n 20 277; lamb, n 20 223; pork, n 20 237.
† People who, at the repeat visit, reported that they made a major change to their diet in the past 5 years, or who responded with ‘prefer not to answer’ to this question were excluded. For each item, people who answered ‘do not know’ or ‘prefer not to answer’ at either baseline or repeat visit were also excluded. The sample size for each question is as follows: cooked vegetables, n 13 213; raw/salad vegetables, n 13 181; fresh fruit, n 13 282; dried fruit, n 13 191; fibre, n 12 603; oily fish, n 13 280; other fish, n 13 280; processed meat, n 13 306; poultry, n 13 306; beef, n 13 291; lamb, n 13 264; pork, n 13 278.
Agreement between the intakes of food groups and partial fibre score estimated from the touchscreen dietary questions and group mean intakes from the 24-h dietary assessment
After averaging the values from all 24-h dietary assessments from participants who completed more than one 24-h dietary assessment, the mean daily intakes were 217 g for vegetables, 202 g for fresh fruit, 16·3 g for fibre, 11 g for oily fish, 16 g for white fish, 31 g for poultry, 58 g for red and processed meat, and 92 g for total meat. For women the mean intakes were 237 g for vegetables, 213 g for fresh fruit, 16·1 g for fibre, 12 g for oily fish, 15 g for other fish, 31 g for poultry, 50 g for red and processed meat, and 84 g for total meat. For men they were 191 g for vegetables, 189 g for fresh fruit, 16·6 g for fibre, 11 g for oily fish, 16 g for white fish, 31 g for poultry, 67 g for red and processed meat, and 102 g for total meat. For all foods and food groups, the comparisons with the 24-h dietary assessments that were completed at the assessment centre showed good agreement, with slight regression to the mean (i.e. a narrower range of intakes from the low to high categories). The comparison with the online 24-h dietary assessments showed greater regression to the mean (Table 6 and Supplementary Table S5).
Table 6. Comparison of the touchscreen estimate of food group intakes and partial fibre score with the group mean intakes from the 24-h dietary assessments
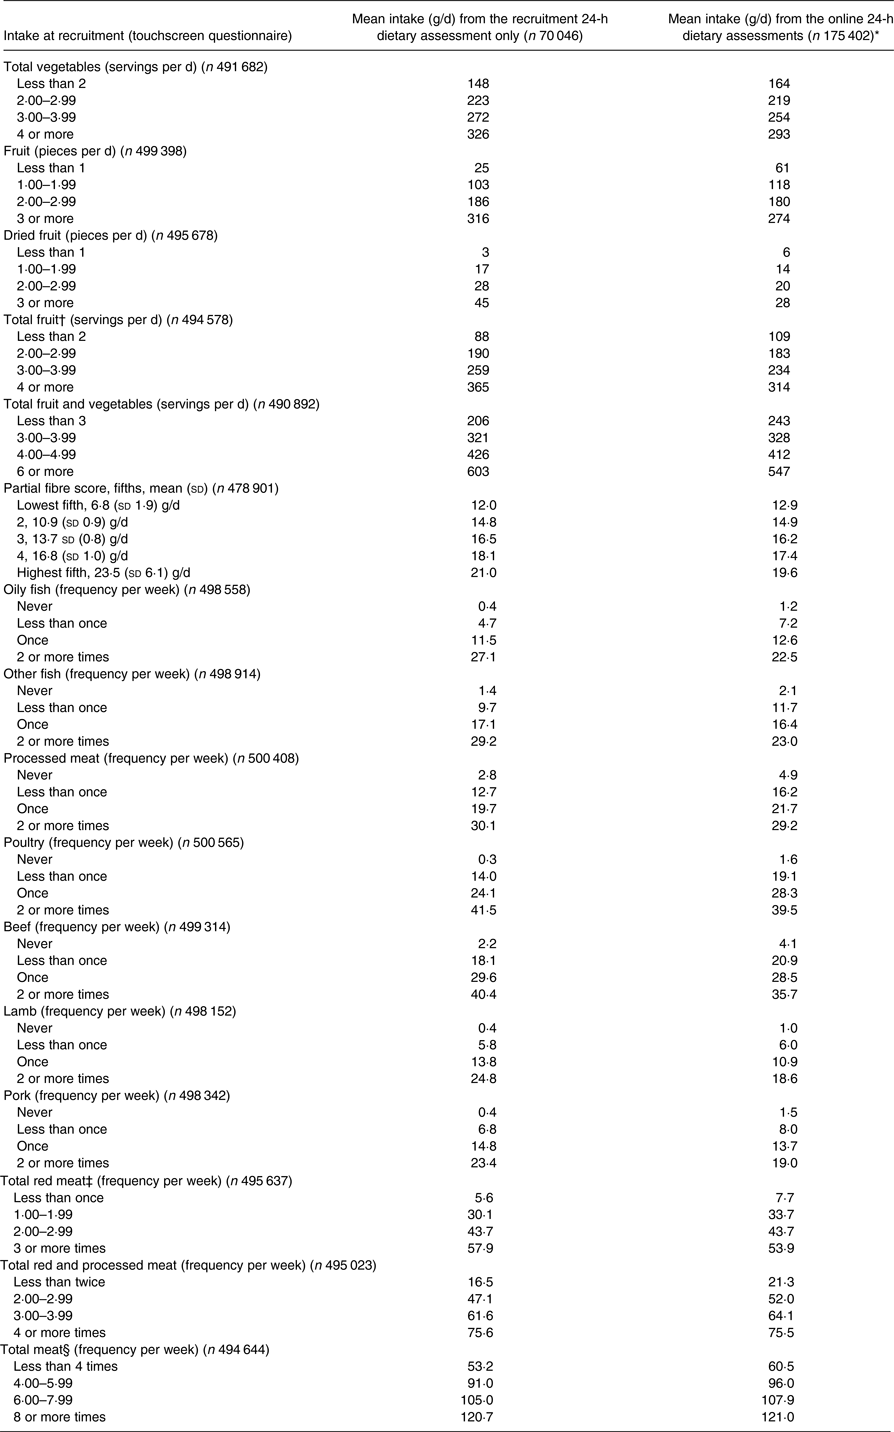
* Group mean intakes from the 24-h dietary assessments completed online.
† One piece of fresh fruit is equal to one serving of fruit, and two pieces of dried fruit are equal to one serving of fruit.
‡ Total red meat is the sum of beef, lamb and pork from the touchscreen questions.
§ Total meat is the sum of processed meat, poultry, beef, lamb and pork from the touchscreen questions.
Discussion
In the present paper, we describe the reproducibility of the touchscreen questionnaire in the subsample of approximately 20 000 participants who completed it about 4 years apart. For the main food groups, fruit, vegetables, fish, meat, as well as the new partial fibre score, there was moderate to substantial agreement between the responses to the dietary touchscreen questions at baseline and the repeat visit. We also compared the touchscreen questionnaire, which typically asked about the frequency of consumption of the main food groups, with the data from the 24-h dietary assessment, which gives an estimate of actual intakes of foods and nutrients and was completed at least once by about 210 000 participants, by categorising participants based on the answers to the touchscreen questionnaire and calculating the group mean intake from the 24-h dietary assessments within each category. For all foods and food groups, as well as for the partial fibre score, the comparison with the group mean intakes from the 24-h dietary assessment data showed that the touchscreen questionnaire categorisation reliably ranked participants by the estimated average intake.
We have confirmed for the major food groups that participants stay relatively stable in terms of the assessment of dietary exposures during 4 years of follow-up. The questions on the consumption of meat and oily fish from the touchscreen questionnaire, particularly, showed substantial agreement with the repeat measure approximately 4 years later. The questions on the consumption of fresh fruit showed substantial agreement while the question for dried fruit showed moderate agreement. In our cohort, a high proportion of participants reported consuming dried fruit less than once daily (61 %), whereas only a small proportion (9 %) reported consuming fresh fruit less than daily; foods eaten infrequently tend to have relatively lower reproducibility than foods eaten more frequently( Reference Feskanich, Rimm and Giovannucci 11 , Reference Colditz, Willett and Stampfer 12 ). We found similar reproducibility of the dietary touchscreen questionnaire by sex and age. However, we observed systematically better agreement in the dietary touchscreen questionnaires for participants who had a BMI < 25 kg/m2, compared with those with a BMI > 25 kg/m2. Other studies have found some differences in the reproducibility of an FFQ between normal-weight and overweight participants for foods( Reference Colditz, Willett and Stampfer 12 ) and nutrients( Reference Bountziouka, Bathrellou and Giotopoulou 13 ), but the differences were inconsistent and the reproducibility was not systematically worse among overweight participants. The poorer reproducibility of the dietary touchscreen questions among overweight participants should be considered in future UK Biobank studies. A 4-year period between administrations of the touchscreen questionnaire allows us to examine the long-term reproducibility of the questionnaire – any changes will be due to a combination of variability in response to the questions and true dietary changes over time, both of which contribute to misclassification of long-term dietary intakes( 3 ). Examining this longer-term reproducibility is vital for future prospective work from UK Biobank on diet and disease development and we have shown that over 4 years of follow-up that the vast majority (>70 %) of participants report the same or adjacent category of consumption for the main food groups of fruit, vegetables, meat and fish, as well as our derived estimated partial fibre score (in fifths).
The mean daily intakes of the main food groups from all 24-h dietary assessments in UK Biobank were similar to or slightly higher than those of the same food groups from the UK National Diet and Nutrition Survey (NDNS) for adults aged 19 years or older, which is not unexpected given the known under-reporting of energy intakes in NDNS, by a magnitude of approximately 30 %( Reference Bates, Lennox and Prentice 14 ), and the non-representativeness of the UK Biobank cohort( Reference Hutchings, Ayres and Cullinan 15 ). In addition, the age categories in NDNS (19–64 years, and 65 years or older) are wider than the age range of participants in UK Biobank (40–69 years). The mean intake of vegetables from the 24-h dietary assessments in UK Biobank was 217 g compared with 183–186 g for adults aged 19 years or older in NDNS, for fresh fruit it was 202 g in UK Biobank and 96–127 g for fresh/canned fruit in NDNS, for oily fish it was 11 g compared with 8–12 g, for white fish it was 16 g compared with 12–16 g, for poultry it was 31 g compared with 23–38 g, for red and processed meat it was 58 g compared with 63–71 g, and for total meat it was 92 g compared with 86–109 g( Reference Bates, Lennox and Prentice 14 ).
The comparison of the touchscreen dietary variables with the group mean intakes from the 24-h dietary assessments showed that the touchscreen dietary questions discriminate between low and high intakes of main food groups. The comparison also showed classic regression to the mean. This occurs because participants will randomly over- and under- report on the touchscreen questionnaire; when participants are categorised based on the answers to the touchscreen questions the lowest category will include a disproportionate number of people who reported an intake lower than their true intake, and the top category will include a disproportionate number of people who reported an intake higher than their true intake, thus the mean intakes from the 24-h dietary assessment re-measurement for each category will be closer together( Reference MacMahon, Peto and Cutler 16 ). For the comparison with the group mean intakes from the 24-h dietary assessment completed at the recruitment centre, as expected, there is less regression to the mean because the two measures were completed on the same day. The new variables that we generated, of food groups in weight amounts from the 24-h dietary assessments, can be used to correct for regression dilution bias in diet–disease analyses. This can be done using the approach we have shown in this paper, by grouping participants according to baseline intakes reported at the touchscreen and calculating the mean intakes from the 24-h dietary assessments within each group. The relative risk of disease can be reported for each category of intake, and the data from the 24-h dietary assessments can be used to generate the trends in risk per increment (in g/d) in dietary intake.
The touchscreen questionnaire included questions on fruit, vegetables, bread and breakfast cereals, and from this we were able to estimate a partial fibre score for the whole cohort. According to the NDNS, the food groups in the touchscreen questionnaire that were used to estimate the fibre score contribute 54–60 % of the total fibre intakes for this age group. The other categories in NDNS that were major sources of fibre but were not asked about in the touchscreen were: potatoes; pasta, rice, pizza and other miscellaneous cereals; and biscuits; buns, cakes, pastries and fruit pies; which together contributed another 22–25 % to fibre intakes for adults aged 19 years and over( Reference Bates, Lennox and Prentice 14 ). Therefore, our estimated partial fibre score from the touchscreen is not a complete estimate of fibre intake. For epidemiological studies that investigate the associations between dietary intakes and health outcomes it is not necessary to determine food and nutrient intakes with absolute accuracy, but it is important to demonstrate that the questionnaire can discriminate between people with low and high intakes; the comparison of the touchscreen partial fibre score with the group mean intakes from the 24-h dietary assessments confirmed that the touchscreen partial fibre score that we derived does separate UK Biobank participants with low and high intakes of dietary fibre. This variable will be returned to UK Biobank, and there will now be an estimated partial fibre score for the whole cohort, which can be used to assess the relationships between fibre and disease. The partial fibre score should not be regarded as a measure of absolute fibre intake and therefore it should not be used for direct comparison with recommended intakes or intakes in other populations.
This work has shown that the main dietary touchscreen variables, including the new partial fibre score, show moderate to substantial reproducibility over a 4-year period, and comparison with the mean intakes from the 24-h dietary assessments showed that the touchscreen variables reliably rank participants according to the intake of main foods and food groups. This work underlies future research examining diet–disease associations in UK Biobank.
Supplementary material
The supplementary material for this article can be found at https://doi.org/10.1017/jns.2017.66
Acknowledgements
This research has been conducted using the UK Biobank Resource under application number 3037.
This work was supported by the Girdlers’ New Zealand Health Research Council Fellowship (K. E. B.); Cancer Research UK (T. J. K., C8221/A19170; and T. J. K. and H. J. Y., 570/A16491); the UK Medical Research Council (T. J. K.; MR/M012190/1); UK Biobank (H. J. Y.); and the Clarendon Fund and US-UK Fulbright Commission (W. G.). The funders did not influence the conduct of the study, analysis or interpretation of the data, the writing of this report, or the decision to publish. The authors had full access to all the data in the study, can take responsibility for the integrity of the data, and the accuracy of the data analysis.
All authors participated in formulating the research questions and the design of the study. K. E. B. performed the statistical analysis and drafted the manuscript. All authors helped to draft the manuscript and read and approved the final version.
UK Biobank is an open access resource. Bona fide researchers can apply to use the UK Biobank data by registering and applying (http://www.ukbiobank.ac.uk/register-apply/).
There are no conflicts of interest.


