

Introduction
In the past two decades, the increasing use of child well-being indicators globally has sought to operationalise children’s lives and living conditions ‘beyond poverty’ to assess the achievement of children’s rights and/or living standards both cross-nationally and nationally, together with the effects of related policies. Often covering measures of what children have or do not have (material well-being), what they do or do not know, how healthy they are, or their relationships or behaviours, these indicators focus on child well-being in the present rather than the future, on life outcomes rather than inputs or outputs, and represent a holistic understanding of well-being and rights achievement through multidimensional indices (e.g., Bradshaw et al, Reference Bradshaw, Hoelscher and Richardson2007; UNICEF Innocenti, 2007, 2020; OECD, 2009; Korean National Statistical Office, 2022). Such indices, reported annually or at longer time intervals, often represent the only means by which a country can review the broad range of conditions impacting the lives of the children, their rights achievement, and child development, population-wide.
In the 4 years since the onset of the COVID-19 pandemic, evidence abounds on the negative effects this global health and economic shock has had on children worldwide (UNICEF Innocenti, 2024). Moreover, for those working with and for children – including child researchers and survey coordinators – it was not ‘business-as-usual’. New priorities for child well-being came to the fore – such as mental health, physical safety, immunizations, and the use and misuse of digital technologies – regular surveys were postponed, and methodologies and modalities of collection were adapted. In short, COVID-19 risked making the existing child well-being measures and indices – previously reliant on equal weighting of child outcomes and business as traditional collection methods – obsolete, invalid, or unreliable.
Since COVID-19 many countries across the world, and not least in Europe, have suffered from a cost-of-living crisis. This crisis has been exacerbated by the war in Ukraine, which has further driven up food and fuel bills due to supply chain constraints and sanctions in Ukraine and the Russian Federation, respectively (Richardson, Reference Richardson, Otchere and Musatti2022, Reference Richardson2023). Poverty risks are driven by falls in purchasing power – and not only in disposable income terms – which risks making pre-existing child poverty measures invalid, since they rely solely on the measurement of the amount of disposable income, and not the purchasing power of that income.
With these concerns about how reliable indicators for recording levels of children’s well-being are during crisesFootnote 1, this article reviews the UNICEF Innocenti Report Card 16 on child well-being and the Korean Child Well-being Index (as two influential examples of an international and a national child well-being index) to explore two gaps in the knowledge base, specifically: (1) how shock-proof comparative and national indices of child well-being are; and (2) what the robust trends in child well-being can tell us about the effects of COVID-19 and similar future crises on children, and the suitability of child and family policy efforts made in response.
This article is structured as follows. First, we review recent literature and data to make the case for shock-responsive indicators of child well-being and propose some key attributes of such measures. Second, we compare the UNICEF study of child well-being in high-income countries (The UNICEF Innocenti Report Card 16) with the Korean Child Well-being Index to highlight how differences in the design and purpose of a national and cross-national index of child well-being can help understand what it means for such efforts to be shock proof. In both cases, these indices represent the recent versions of long-standing series, cross-nationally and nationally, with similar multi-dimensional frameworks, as such represent established approaches with a history of academic reflection and development. Third, we present a method for assessing the suitability of the key outcome indicators and child poverty for measuring and monitoring child well-being during crises. Fourth, we apply this method to assess how shock-proof the UNICEF Innocenti Report Card 16 and the Korean Child well-being indices are, before reviewing in more detail how shock-proof the standard child income poverty measurements in Korea and Europe were during the COVID-19 and the cost-of-living crises. Finally, we conclude the article by presenting lessons for policymakers and researchers working with child well-being indices nationally and cross-nationally during and post-crisis.
Why do we need shock-responsive indicators of child well-being?
Going back to some of the earliest child well-being comparisons (Bradshaw et al, Reference Bradshaw, Hoelscher and Richardson2007; Richardson et al., 2008), the purpose of these studies was to set higher ambitions in understanding the outcomes children experience in their day-to-day lives. Indeed, the work of Bradshaw and colleagues was in direct response to the proposal to expand the Laeken indicators set in Europe to include more indicators for children by including literacy measures from the PISA (Programme for International Student Assessment) study only. That work uncovered more than 400 separate data series for children, from surveys like PISA, HBSC (the Health Behaviour in School-aged Children) Study, and series data from OECD, WHO, EUROSTAT, and more, and questioned whether this regular (but unconnected and arguably incomplete) monitoring was getting into the hands of policymakers.
Despite the timing of those early studies, they were not able to predict the Global Financial Crisis (GFC) of 2008 – which pushed millions of families into poverty (UNICEF Innocenti, 2014), and millions of youths out of work (Scarpetta et al., Reference Scarpetta, Sonnet and Manfredi2010) – nor did they attempt to understand whether or which indicators were or would be suitable for keeping track of changes in well-being directly influenced by the economic shock of the GFC itself. Some 15-plus years later, and following two further major global shocks in the form of COVID-19 and the cost-of-living crisis (and the ongoing climate emergency), the literature on the shock responsiveness of the indicators themselves has still not caught up.
Since 2005, theoretical papers have introduced justifications for child indicator developments that focus more directly on the child’s life outcomes during childhood (well-being) rather than adulthood (well-becoming) (Ben-Arieh, Reference Ben-Arieh2008). Major international comparisons of child well-being all include a careful justification of the indicators selected for inclusion (alignment to child rights for instance, e.g., UNICEF, 2007; OECD, 2009), and reviews of data and surveys for children have undertaken meta-research to test for biases or consistencies in the data and surveys underlying these studies (Richardson, Reference Richardson and Ben Arieh2013; Richardson and Ali, Reference Richardson and Ali2014; Kim et al., Reference Kim, Richardson and Mizunoya2020). Nevertheless, not one of these studies discusses the suitability of indicators for tracking child well-being outcomes across covariate health or economic shocks.
Two rapid searches in May 2024 for post-2008 literature on ‘shock proof indicators of well-being; and; shock proof indicators of child well-being’ using Google Scholar (title and abstract checks of the first 100 hits) found several references to idiosyncratic or personal or individual shocks (COVID-19, trauma, violence in the home, experiences of poverty or debt, mental health, childhood stress, and parental stress) and well-being or child well-being, as well as covariate or shocks affecting large proportions of a population (worsening community conditions, social trust, climate, COVID-19, and inequality), as well as studies and literature reviews on studies of the impact of COVID-19 on well-being, but nothing on shock proof indicators.
Only one study that reviewed methods to assess adverse childhood experiences (Bethell et al., Reference Bethell, Carle, Hudziak, Narangerel, Powers, Wade and Braveman2017) was suited for providing insights into measurement that could capture idiosyncratic shocks during childhood and their links to poorer child-health outcomes. The authors conclude that the use of cumulative risk scoring for adverse childhood experiences was robust across different scales and that their use had educational value for ‘engaging and educating families and children’ on family functioning, stress, and resilience. Given the nature of covariate shocks, for some households and children, such shocks will compound the experiences of risks, and increase the potential for further idiosyncratic shocks in some instances. There is clearly more work to be done to understand, in an ecological sense, the interplay between covariate and idiosyncratic shocks on child well-being.
Addressing the gaps in the research on, and collection of, shock-proof indicators for child well-being measurement is necessary for several reasons. First, it is important to represent children’s lives as accurately as possible. Child well-being indices that are inelastic to covariate shocks, are too widely spaced to capture short-term changes in trends, or simply do not include the relevant measures or proxies by topic or phenomena, and are therefore a disservice to children at a time of increased stress and risks to their living conditions, well-being, and rights.
Second, representativeness and biases introduced in existing modalities of data collection must be addressed. Many child well-being surveys are undertaken in schools or with children in specific age groups, and therefore collections can be affected by crises that inhibit school-going for all or some children, or represent certain ages when shocks are covariate (Richardson and Ali, Reference Richardson and Ali2014). Shocks of all kinds may further increase the likelihood of schools having only limited access to data collection even when they remain open, particularly if there are health concerns, or if children are already under stress. Shockproof indicators should account for modalities of collection, and biases such shocks can introduce (e.g., limited age coverage, or coverage of mainstream school-going children only).
Third, it is crucial to understand the effects of data points and/or trends on specific indicators within a group of indicators or indexes. These can be used to disentangle the determinants of trend changes in the index at a composite level, when using these aggregates for general monitoring or evaluation.
Fourth, identifying breaks in trends and series in longer trends related to individual child-well-being measures is important for monitoring and evaluation (e.g., for use in natural policy experiments, difference-in-difference studies, and more).
Fifth, designing more robust measures of child well-being in the future is imperative. There are many flaws with existing indices of child well-being, including comprehensiveness in coverage (by age, and biases introduced by sampling in school (Kim et al., Reference Kim, Richardson and Mizunoya2020). Researchers and policymakers should strive to improve indices by replacing indicators that do not fully represent the relevant child populations. Meta-research on topics such as the shock responsiveness of child well-being indicators – ahead of such developments – is necessary to ensure future adaptations are more sustainable choices.
Finally, preparing for future shocks, and the climate emergency will enhance research and knowledge of shock-proof measures of child well-being. This will allow for new analysis to be undertaken on the attributes and elasticities of existing series and survey data, when subjected to covariate shocks such as COVID-19 or the cost-of-living crisis. How well-being outcomes respond to previous crises can be used to inform immediate policy responses in future crises (as was attempted, without full reflection on the attributes of shockproof measures, in Damoah et al., Reference Damoah, Otchere and Richardson2021; Richardson et al., Reference Richardson, Carraro, Cebotari, Gromada and Rees2020a, Reference Richardson, Cebotari, Carraro and Damoah2020b, Richardson et al., Reference Richardson, Otchere and Musatti2022, Richardson et al., Reference Richardson2023).
Comparing the Korean Child Well-being Index with Report Card 16: a review of the indicators
In order to assess the shockproof nature of child well-being indices, we have chosen to compare the UNICEF Innocenti Report Card 16 (RC16) “Worlds of Influence: Understanding what shapes child well-being in rich countries” and the Korean Child Well-being Index (2022 version). These indices have been selected because, they are both multidimensional and provide a comprehensive view of child well-being, directly linked to policy decisions that inform child welfare strategies. Furthermore, they offer a comparison of two layers of influence in the social economy. Both indices include comparable information from other sources regarding the effects of crises, making them suitable for this study. This analysis is particularly significant as it is part of a special issue focusing on Korea.
The UNICEF Innocenti Report Card 16 (RC16) “Worlds of Influence: Understanding what shapes child well-being in rich countries” was published in 2020, with the aim of putting measures of child well-being outcomes at the centre of a set of economic and social conditions or “influences” – or within a multilevel framework of child well-being. The conceptual frame for RC16 was inspired by Bronfenbrenner’s socio-ecological frameworks for human development (Bronfenbrenner, Reference Bronfenbrenner1977). The purpose of this study is to compare child well-being outcomes in relation to the social and economic opportunities and constraints experienced in different countries to assess what is possible when promoting children’s well-being in the high-income world. RC16 compared six outcome indicators under the dimensions of mental well-being, physical health, and skills, and then presented additional indicators of contextual conditions under three levels: the world of the child (relationships and activities); the world around the child (resources and networks); and the world at large (context and policies). In this article, for reasons of simplicity, we separate these into outcomes and conditions. Not all measures reported in the RC16 are used in the index itself – those that are used are reported in Table 1.
Table 1. A comparison of indicators in Innocenti Report Card 16 and the Korean Index of Child Well-being
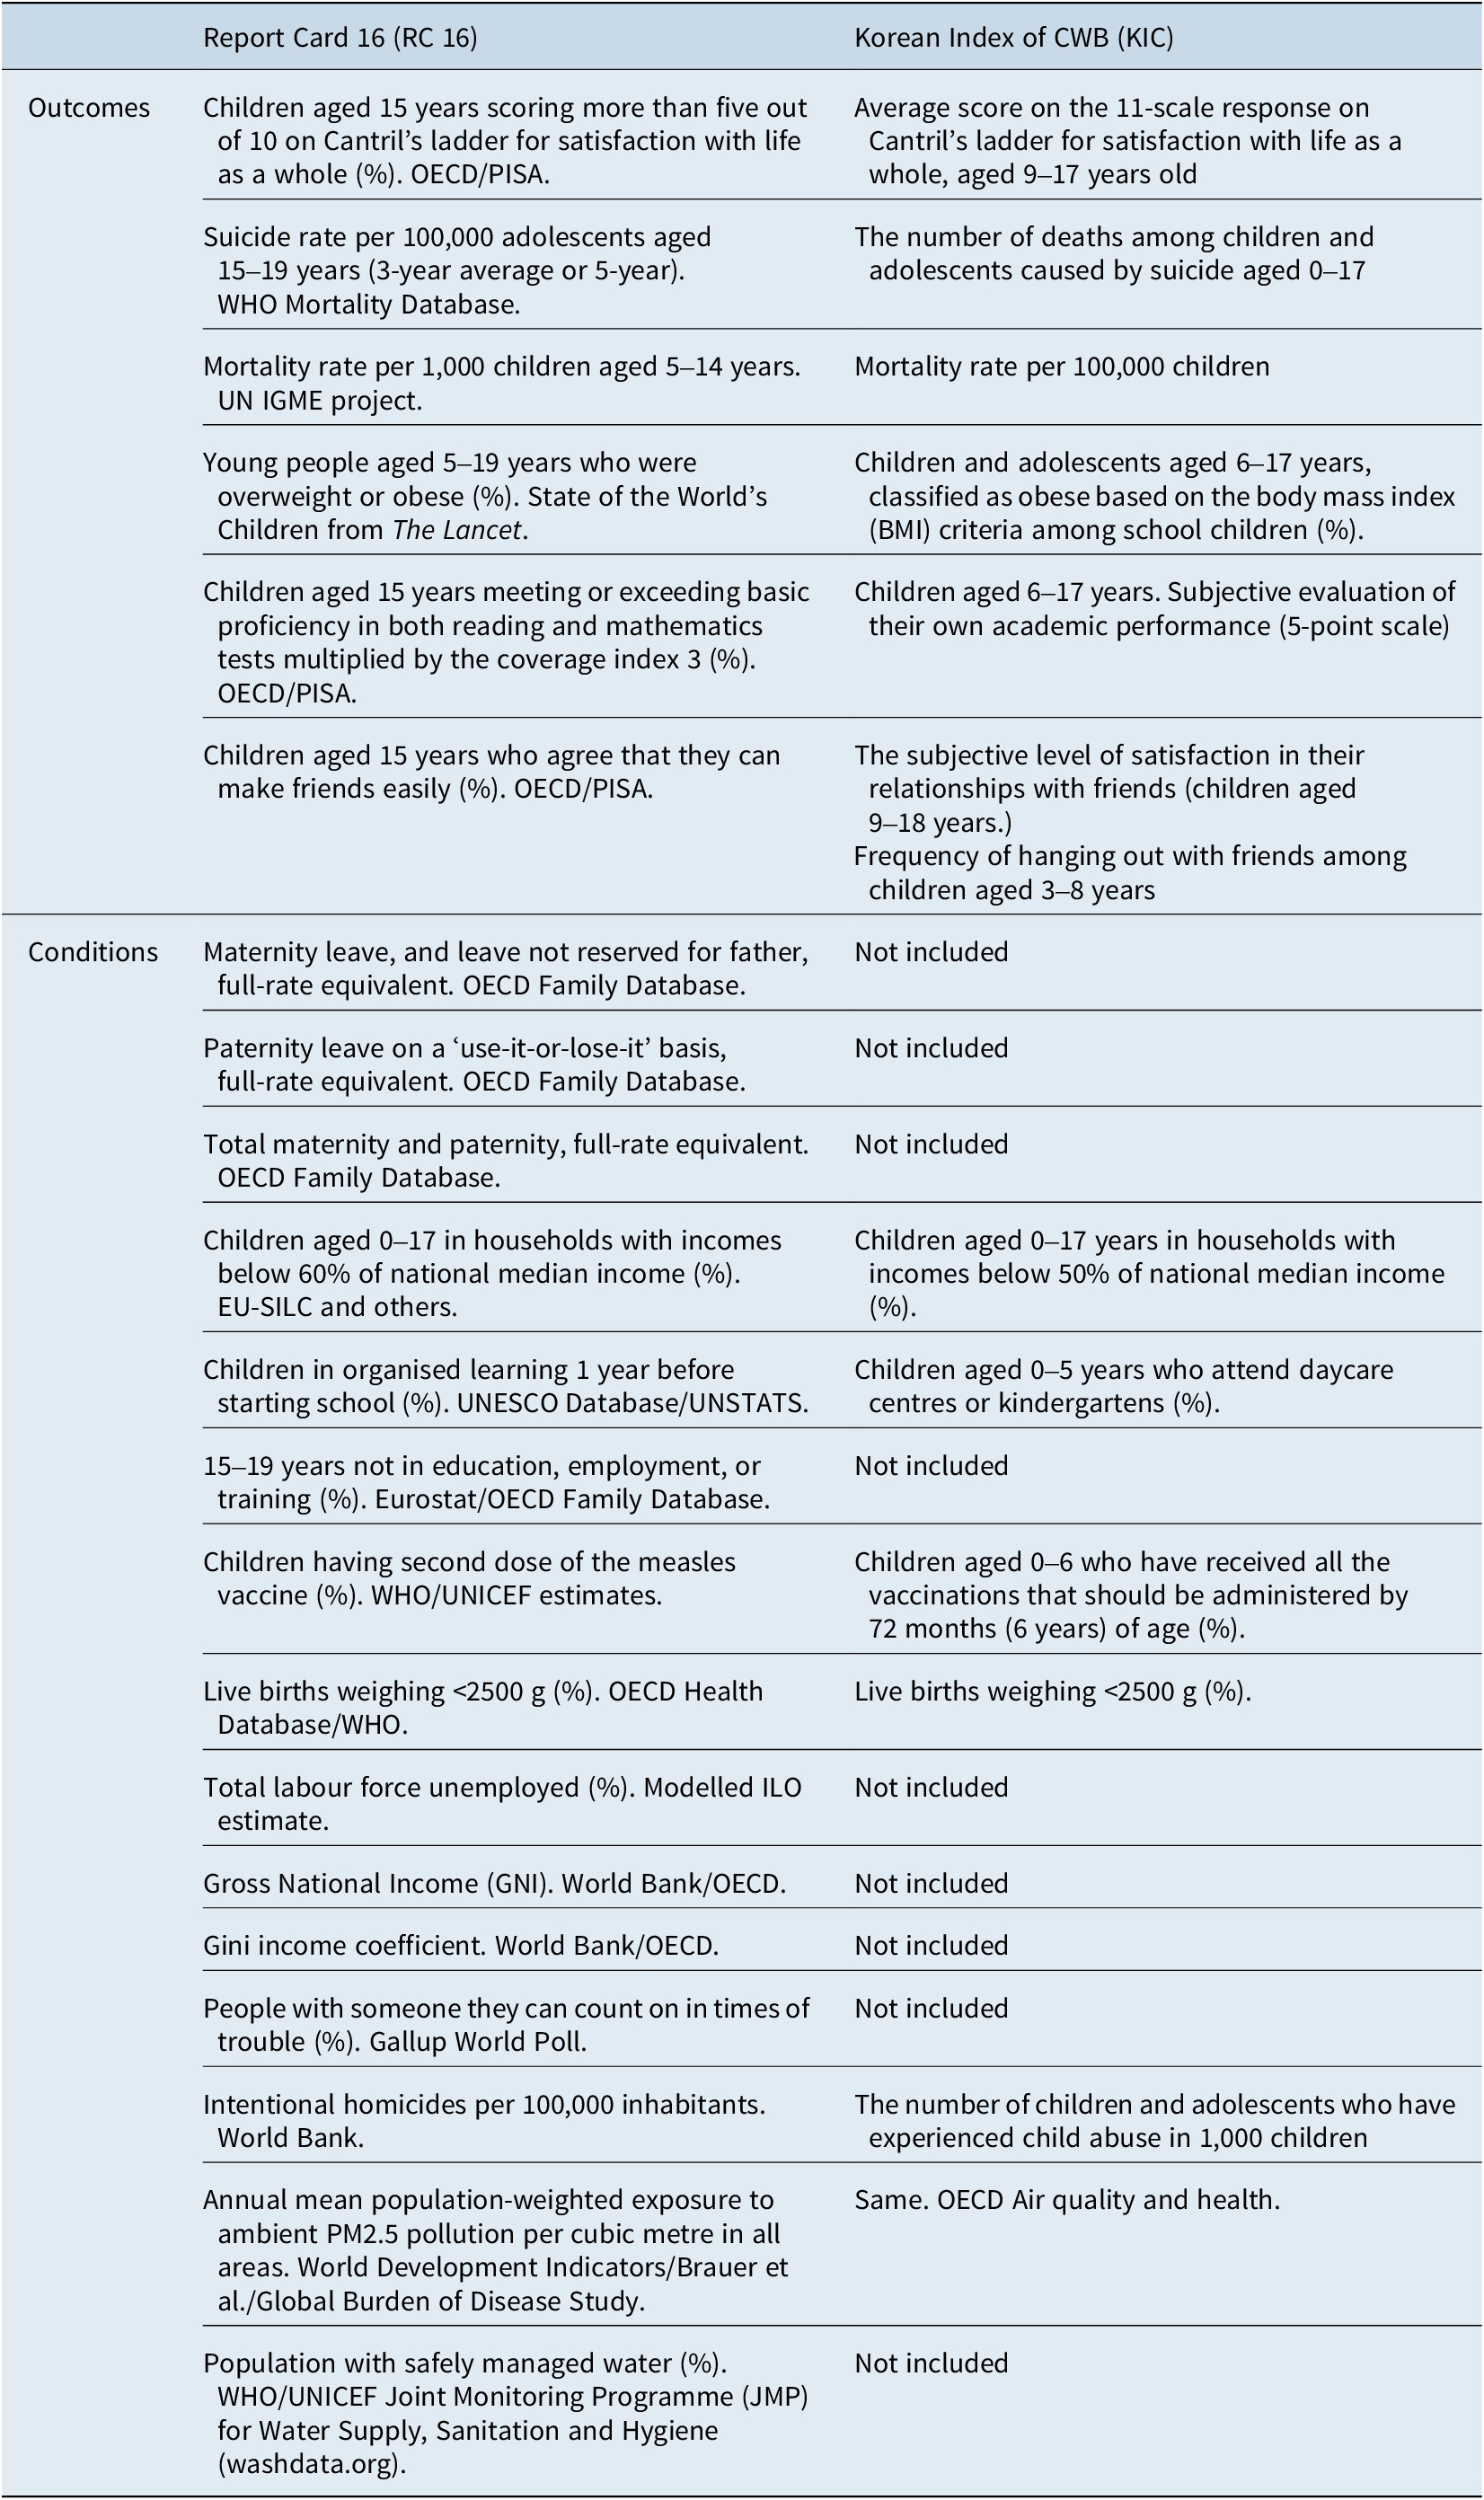
The Korean Child Well-being Report, “Child and Youth Well-being 2022” was published in 2022 and allows for comprehensive monitoring of the quality of life for children and youth at the national level. The report was the first national indicator report that provides a summary of the overall quality of life for children and youth in different stages of the life cycle in Korea. The index consists of 60 indicators across the eight domains of health, learning and competencies, leisure and activity, relationships, safety and behaviour, subjective well-being, material situation, and social background. The target population for this report is limited to children which is defined based on the age range of 0–17 years, with some inclusion of individuals up to 18 years of age. Details of the indicators included in Korean Child well-being index are also reported in Table 1 alongside those of RC16 by child outcomes and conditions.
Notably, across all of the indicators, only low birth weights and air pollution are measured in the same way in both indices. The outcomes across life satisfaction, suicide, mortality rates, obesity, and socialisation compare well in terms of conceptual alignment, with the main differences being in the age ranges covered by the data, and modality of reporting (for instance, the use of PISA internationally, and self-reported measures of academic achievement in Korea). When comparing data on the conditions in which children live (not all of the Korean data is included here – see Appendix Table 1) again the indexes are conceptually aligned and differ only in terms of metrics (age ranges, poverty threshold).
Comparative versus national focus
The differences that exist between the RC16 indicators and the KIC indicators can be explained in part by data availability as well as the scope and purpose of the index. The RC16 indicators serve the purpose of comparing child and youth well-being across different countries on an international scale. This index is used to gauge the well-being of children and adolescents in a comparative context, allowing for cross-country comparisons and analysis. On the other hand, KIC is a national index of child well-being that primarily focuses on measuring the well-being of children and youth within Korea. The index was designed to assess the well-being of children and youth at a national level across time, enabling the regular monitoring of their overall quality of life.
These differences in purpose and scope are also linked to the differences in the characteristics of the indicators that constitute each index. RC16, as an internationally comparative index, encompasses a broader range of indicators related to policy environment and infrastructure at the national level. In contrast, the KIC, as a country-specific index of child well-being, includes a relatively narrower inclusion of macro-level environmental and infrastructure-related indicators, while featuring a richer set of indicators of child outcomes, some of which are not shown in Table 1. Specifically, within the KIC framework, the indicators related to child outcomes encompass the child deprivation index, children living in minimum housing standard, self-perceived stress, average sleeping hours on smartphones, level of physical activity, smartphone dependency, etc. (see Annex Table 1 for a full list of indicators in the KIC framework).
Difference in life-course focus
Between the two indices, there are also differences in life course focus. The KIC incorporates indicators that are more likely to encompass a broader age range of children under 18 years. This is attributed to the methodological advantages of the KIC as a national index, enhancing its ability to provide a more comprehensive assessment of child well-being at the national level. In contrast, comparative indicators at the international level are more likely to be data-driven, and constrained by comparability needs, and so provide information restricted to specific age groups, such as the PISA assessment focusing on 15-year-olds.
Methods for assessing how shockproof child well-being indicators are
To understand whether a child’s well-being indicator, or index, is sensitive to shocks, a minimum of three steps can be taken to assess their functionality in the face of the observable characteristics of shocks. The first step is a conceptual assessment, the second, a methodological assessment, and the third, a statistical assessment.
Conceptual assessment
The concepts in any given index need to be meaningful and fully operationalised to the phenomena experienced by children during a crisis. During COVID-19, isolation, domestic violence, mental health issues, and issues related to the sedentary behaviour of children who experienced lockdown under difficult circumstances, needed to be covered. For most existing indices in high-income countries, there are more indicators that proxy or operationalise phenomena related to economic crises, such as income poverty, deprivation, and subjective perceptions of material well-being. Historically, mental health and violence measures have been poorly operationalised in comparative child well-being studies in high-income countries (either these are not measured, or are indirectly measured through mortality statistics, or covering limited age groups).
For both COVID-19 and the cost-of-living crises, all of the outcomes mentioned above might also be considered first-order outcomes – or those directly affected by a change in circumstances driven by the crisis – and so secondary (or indirect) effects of poor mental health, sedentary behaviours, or income poverty and material deprivation would also need to be tracked and better understood in the cases of a temporal covariate shock, as these would likely impact on longer terms trends of a broader range of child well-being indicators. First- and second-order impacts of crises therefore need to be covered in indices of child well-being that do not wish to cover solely ‘baseline’ considerations (or ‘normal’ standards for child well-being in the long term), and in doing so monitor the relevant temporal effects of the crises and provide information for and about elasticity to shocks and trends in the recovery from crises by indicator.
Methodological assessment
Methodological decisions on the modality and regularity of the collection of data used in child well-being indices necessarily impact on the suitability of indices to measure certain phenomena associated with child well-being during shocks.
For instance, the regularity of collection of key surveys used to measure child well-being, particularly from international school-based surveys of children – a crowded field – limits the suitability of these indicators (not in terms of conceptual suitability or operationalisation, but rather how up to date they can be) for measuring the effect of the crisis on children. PISA collects most often, every 3 years, with TIMSS, PIRLS, and HBSC all collecting in 4 year cycles (Richardson and Ali, Reference Richardson and Ali2014). Comparing this to recovery from COVID-19 in material terms in Europe, and the up-and-down trajectory at the global level, suggests the space between collection windows is insufficient for capturing changes to some phenomena (EUROSTAT, 2022; and The World Economic Forum, 2022). Timeliness is key.
Moreover, the suitability of using school-based survey collections when the majority of children are under lockdown rules and schools are closed is another obvious limitation, requiring adaptation to collection methods or postponement (IEA, 2022). Although none of the major school-based surveys of children in high-income countries had fieldwork planned for 2020, a few were planned for 2021 (PISA and PIRLS, HBSC). Of these, PIRLS collected in 2021, but publication of the findings was delayed, and PISA was postponed by one year to 2022. HBSC collections were undertaken within the planned window, with multiple studies reporting worsening or mixed results in mental health in the years immediately after the onset of the pandemic (HBSC, n.d.).
A wealth of evidence on differences in subgroups responses based on the modality or collection, or differential item functioning, only adds more complexity to the issue (Kim et al., Reference Kim, Richardson and Mizunoya2020). The evidence that migrant populations, for instance, provide more responses when asked to answer items through digital means (Ibid) would suggest, at the very least, that any changes in child well-being trends assumed to be the result of real changes in lived experiences during a shock, may actually be due to the representativity or response bias for various subgroups in the population, and may need to be subjected to specific tests for validity and generalisability.
Statistical assessment
Finally, the statistical properties of indicators in the existing child well-being frameworks matter. For instance, whether an indicator of child well-being is more or less sensitive to shocks is an issue to consider (or indeed an index – depending on the number of shock-responsive indicators, and the formulation of composite measures when used).
The elasticity of child well-being indicators to economic shocks has been studied using data collected around the time of the GFC in high-income and low-income countries (Richardson et al, Reference Richardson, Carraro, Cebotari, Gromada and Rees2020a, Reference Richardson, Cebotari, Carraro and Damoah2020b, and Damoah et al 2022). In these studies, evidence suggests that economic downturns drive up poverty, and either independently – or through poverty experienced by children themselves – these downturns differentially effect measures such as suicide, mortality risks, learning outcomes, and youth NEET (not in education, employment, or training) rates over the same period of time (Ibid). This means when interpreting the effect of a crisis on children through present index work, the attributes of measures and their weights in indexes will need to be disentangled, and separately analysed. More granular analysis is likely to be needed to fully understand how accurately existing indices represent the impact of a shock on children, and through which route, in order not to ‘wash-out’ or aggregate away more immediate (or first order) effects with slower moving (or in some cases second order effects), and vice versa.
Moreover, some indicators are proxies for experiences or are extreme proxies used to capture or indicate issues that are more prevalent in society that may or may not result in severe outcomes (domestic violence, general safety and the indicators of child mortality, or mental health, suicide ideation, and suicide rates). These are sometimes called ‘iceberg’ indicators as a small statistically visible set of outcomes indicate unobserved conditions for these outcomes in a larger proportion of the population.
Again, what is possible in this area of statistical suitability, will be determined by the decisions made by survey coordinators on conceptual coverage and regularity and modality of collections.
Findings: comparing how shockproof child outcome indicators are in RC16 and the Korean Index of Child Well-being
When comparing the child outcomes of Report Card 16 and the Korean index of child well-being, nine measures are closely aligned. Table 2 reports these and provides short notes for each index.
Table 2. Indicators used in both indices and considerations for shock responsiveness
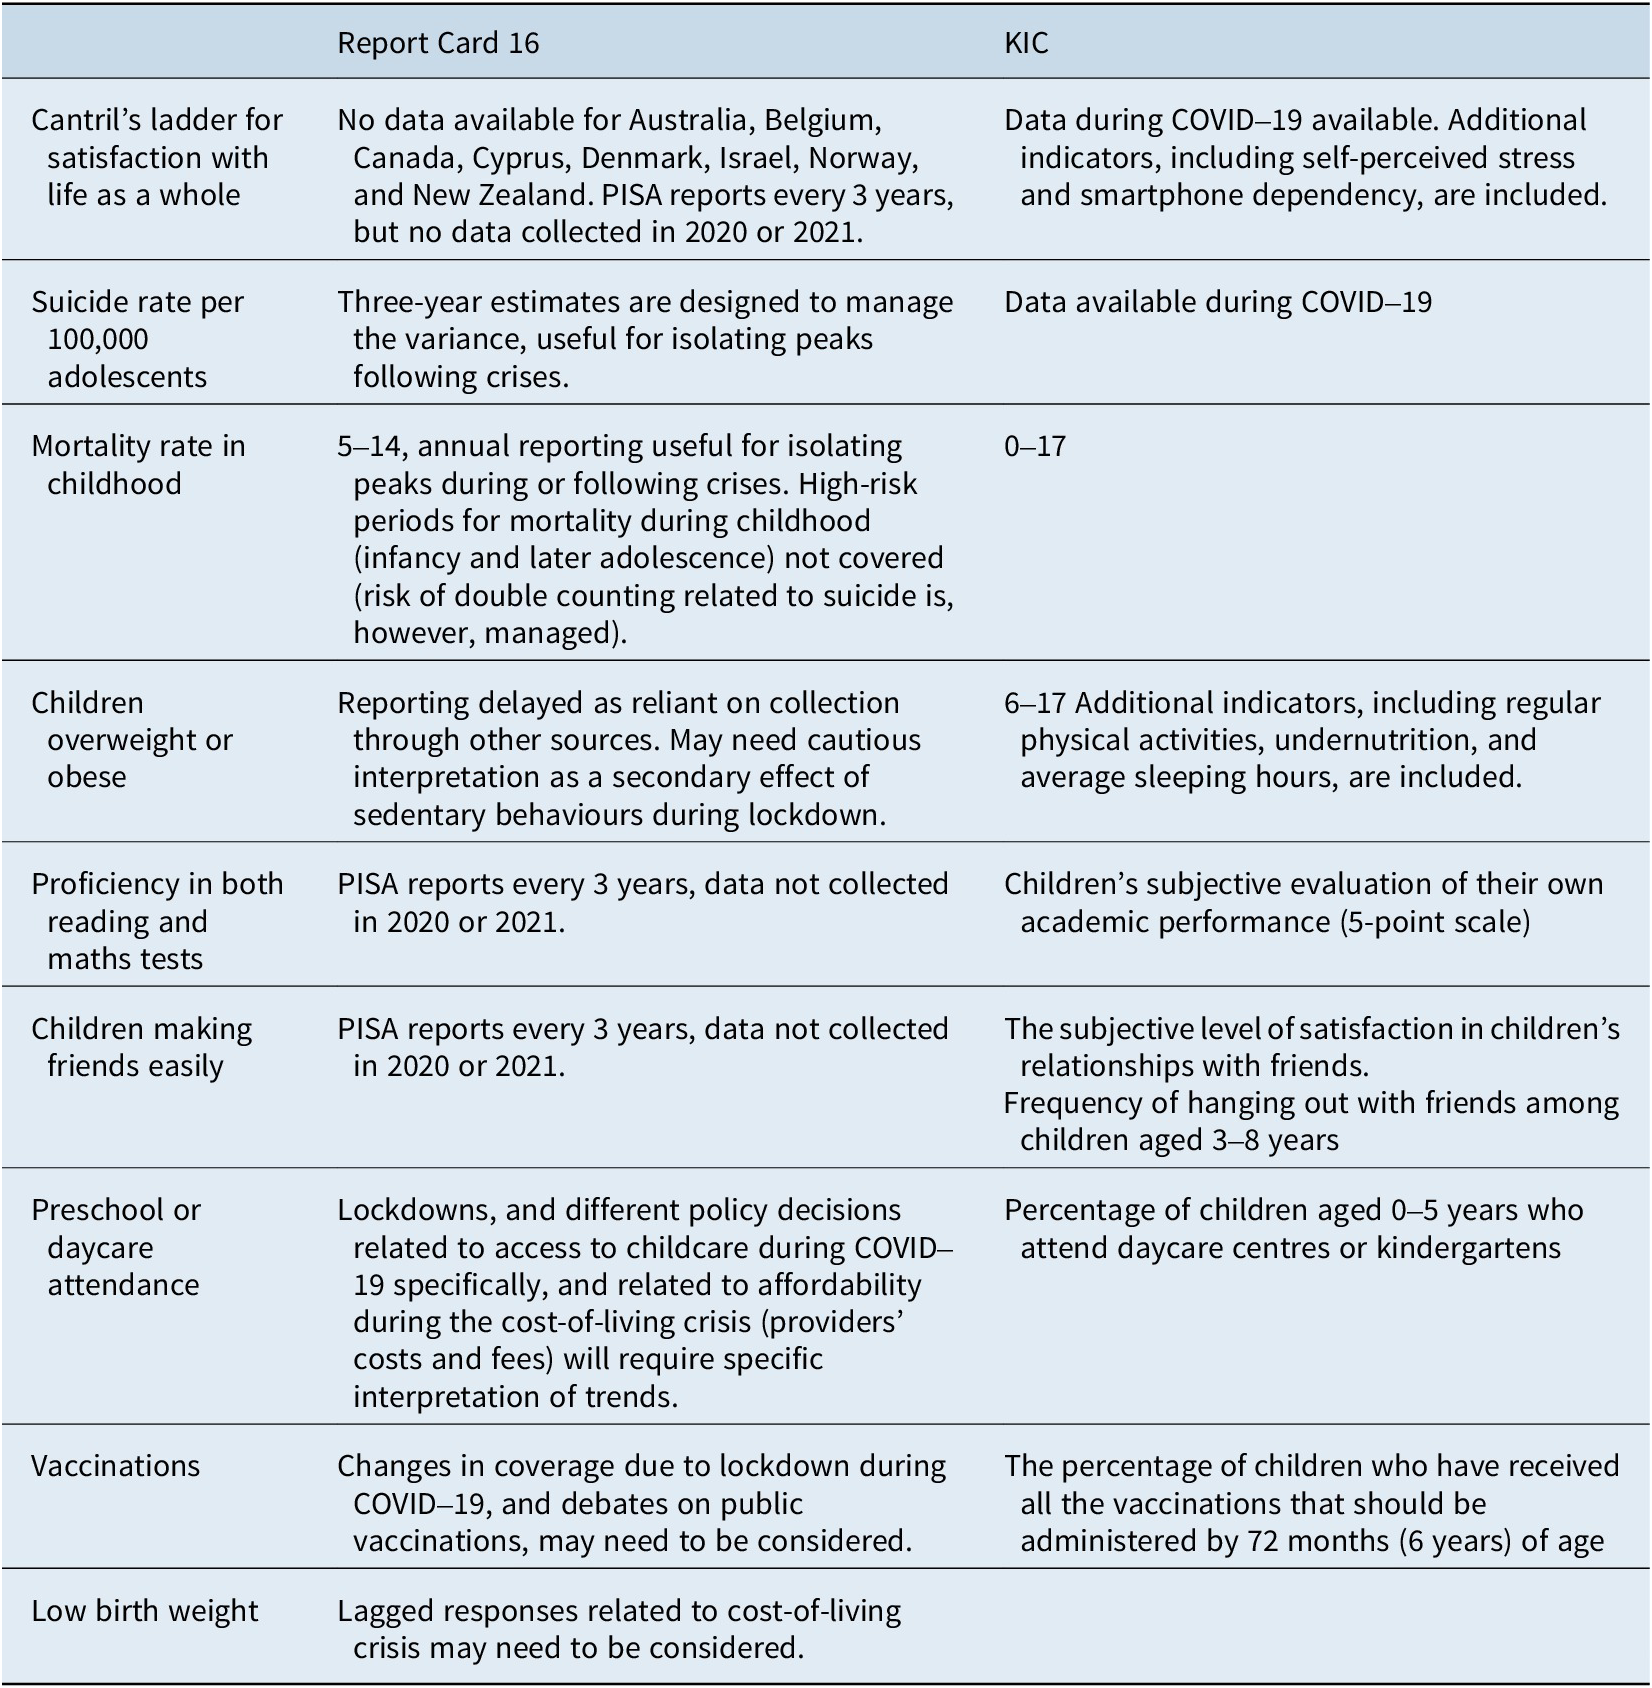
Note: Only indicators covered by both indices are included.
Conceptually, although both indices include indicators that are likely to change under pressure of economic or health crisis, the routes to impact may differ, or be less likely in some instances. The KIC includes more specific indicators to measure the direct effects of shocks pertaining to school closure and sedentary lifestyle, such as ‘average hours of sleep’, ‘undernutrition’, and ‘level of regular physical activities’.
Second, although important proxies such as life satisfaction, suicide risk, and ability to make friends easily/be with friends, or be satisfied with friendships are included, there remains a lack of direct measures specifically targeting children’s mental health. Increased evidence shows how shocks can affect children deeply, increasing worry and mental ill health (e.g., HBSC, 2023 and Viola et al., Reference Viola, Centrone and Rees2021). Compared to RC16, the KIC is more likely to capture the impacts of crises on children’s mental health by including two indicators related to mental health: self-perceived stress and smartphone dependency, the latter being linked in the international literature to problematic social media use (see Inchley et al., Reference Inchley, Currie, Budisavljevic, Torsheim, Jåstad and Cosma2020).
Third, the RC16 indicators do not fully capture the increased risk of violence or include child-specific material deprivation or evidence on service quality (beyond access) that may be expected on the basis of short income shocks, or staff restrictions or supply chain issues related to health crises or lockdowns. The KIC developed during the COVID-19 pandemic has more specific indicators concerning children’s material deprivation and risk of violence. The Korean index measures children’s material deprivation across three indicators including ‘the child deprivation index’ and ‘the child’s concerns about household financial difficulty; and ‘children living in minimum housing standards’.
Violence against children is also assessed as an indicator in the KIC, including the incidence rate of child abuse, the rate of children being unsupervised after school, and the prevalence of peer violence.
Methodologically, the reliance on PISA in RC16 suggests that certainly for a single data point, the ability of the indicator to timely capture (or fully capture) the shock as it evolves is limited. Three of the nine RC16 indicators utilise PISA data, a further three (indicators 4, 7, and 8) require direct collection or interaction with children (which could be inhibited by lockdowns), one measure (indicator 2) is calculated using multiple-year averages thereby washing out the spikes in trends that might otherwise be associated with a short-term (<1-year) shocks, with immediate and direct consequences. In each case, these will require cautious interpretation, recalculation, or new sources.
In comparison, most of the indicators in the KIC could better capture the direct effects of the shock not only for a single data point but also across years. The core indicators were measured during COVID-19 and the direct impacts of shocks were monitored in terms of a sedentary lifestyle and physical health, and mental health. Most of child outcome indicators using administrative data (indicators 2, 3, 7, 8, and 9) will be accumulated to assess the long-term effects over time. For some indicators that use survey data conducted at regular intervals, there is a need to adjust the periodicity of data collection to adequately track the long-term effects of shocks over time.
Some potential statistical limitations include the elasticity of some indicators to shocks. Those related to immediate social conditions and subjective perceptions are likely to be more elastic to those shocks, and thus indicators 1 and 6 are likely to be important for understanding the effects of crises on children (notwithstanding the conceptual and methodological limitations). Services with immediate effects, but longer reporting times, may be useful in the subsequent years (such as vaccination rates, and preschool attendance), as might some of the more severe outcomes – or iceberg indicators – such as indicators 2 and 3 or indicators with expected lags (second order) such as indicators 4 or 9. Furthermore, effects on infant health, child physical health, and literacy, stand out as indicators that may have a long developmental or ‘response to shock’ trajectory, and indeed may also be secondary effects of mental health issues or lower access to services, or poverty.
This mixed bag of indicators with different statistical attributes underlines the need for easy disaggregation, or guidance for utilisation and or interpretation of the indices from survey coordinators and index authors when assessing child well-being during or through health or economic shocks.
The case of child income poverty and responsiveness to COVID-19 and the cost-of-living crisis
Child income poverty has commonly been used as a measure to compare child well-being across countries. It is measured in terms of the proportion of children living in households with incomes below a particular threshold. In Europe, child income poverty is measured using a threshold of 60% of the median disposable income in the population. In comparison, child income poverty in Korea is defined using a poverty threshold below 50% of the median disposable income. In Europe, the levels of disposable income in each household are equivalised based on the number and ages of children under the age of 14, and the number of adults in the household (using the modified OECD equivalisation scale – EUROSTAT, 2024). Hereafter, a comparison is made of the effects of two different crises at the national and international level, to test for different effects of crises on the same well-being measure by context. This allows for a conclusion to be drawn as to whether an indicator may be more or less shock-proof depending on the context or crisis type. It is important to note however, that disposable income is not subject to modification on the basis of purchasing power, which may result in limited sensitivity to changes in prices, inflation, and exchange rates over time and across countries.
COVID-19 and child income poverty in Korea
Before and during the COVID-19 pandemic, the child income poverty rate in Korea had been falling, with the child income poverty rate reaching 16.1% in 2020, the lowest recorded (Figure 1). In contrast, however, the results from the National Survey “COVID-19 and Child Well-being in Korea” (2020) have revealed significant disparities between parents’ perceptions of economic and living conditions and the actual child poverty rate. Among the participating parents, 60.4% reported that their economic situation remained similar despite falls in relative child income poverty, while 38.9% stated that their economic and living conditions had worsened following the COVID-19 outbreak. Only 0.7% of respondents reported an improvement in their situation.
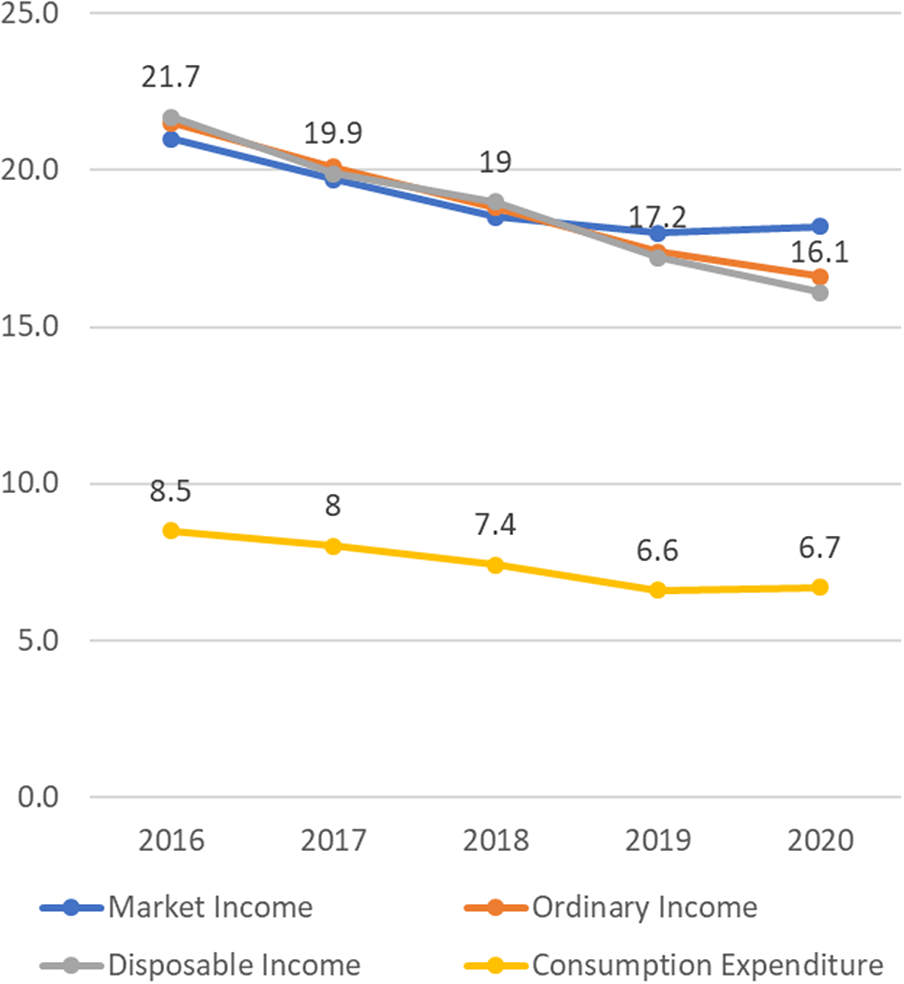
Figure 1. Child poverty trends in Korea (2016–2020).
Note: Y-axis refers to the child income poverty rate at 60% of the median equivalised income in the population.
Source: Korea Institute for Health and Social Affairs. (2022). Poverty Statistical Yearbook.
The main factors contributing to the deteriorating economic conditions according to respondents in Korea included increased living expenses, unemployment, temporary leave or reduced working hours, and worsened business conditions. Increased expenses can explain both falls in self-reported living conditions and no change, or even falls in income, at a household level.
The contrasting trends in Korea are likely to be due to the ‘absolute’ nature of the economic conditions recorded in the COVID-19 survey when compared to the relative nature of the income poverty rate. Indeed, if living conditions decline, but decline equally across the population (or living conditions decline but become more equal across the population as they fall) relative income poverty can improve whilst other objective living condition measures deteriorate. This finding highlights the need to assess the suitability of measures for capturing changes in different social phenomena, and more specifically, the suitability of using relative measures for capturing the effects of covariate health shocks.
The cost-of-living crisis and child income poverty in Europe
The onset of the cost-of-living crisis in Europe preceded, and was exacerbated by, the Ukraine War. In particular outlay for households on fuel and food increased at a sharper rate in 2022 due to supply chain issues related to the war and sanctions (Richardson et al., Reference Richardson, Otchere and Musatti2022; Reference Richardson2023). In Europe, this crisis increased prices faster than wage inflation but did not affect real disposable incomes as wage inflation remained positive, and employment was not substantively affected (Richardson et al., Reference Richardson2023). In short, real incomes did not change, but the value of those incomes did.
Figure 2 presents the estimate of effective child income poverty in 2022, starting at a baseline (reported figure without accounting for falls in purchasing powers) and the effective poverty rates following falls in real incomes and subsidies provided by European governments to manage the cost of living. The evidence shows that almost 3 million European children were living in conditions equivalent to income poverty due to falls in purchasing power. Because reported income levels are unchanged, but less can be bought with the same amount of money, these children’s experience of effective income poverty due to the cost-of-living crisis will not be visible in officially reported child income poverty statistics.
Figure 2. Falls in purchasing power estimated to increase effective child poverty in Europe by 3 million.
Note: data do not include Hungary, and government subsidies include only direct-to-family subsidies, and subsidies to businesses are captured in consumer price inflation rates.
Source: Richardson et al., Reference Richardson2023.
Similar to the Korean case, the main finding here is that the relative child income poverty measures, as agreed in the Laeken indicators set 23 years ago, and the main indicator for children’s living standards in Europe, is not shock-proof in the case of high or hyper-inflation conditions, and so is unsuitable for measuring conditions through a cost-of-living crisis.
What is yet to be clarified in Europe, is how relative income poverty performed as a measure of children’s living conditions and well-being during COVID-19 (an analysis similar to that done for Korea is needed). To add further complexity, for some families the impacts of the two crises will be combined.
Conclusions
What are the considerations for research and policymakers who wish to measure and respond to children’s well-being during and after severe, time-limited, covariate shocks to health and economic systems? The following two subsections provide some priority considerations for research and policy, based on the findings here.
Reflections for researchers collecting and analysis child well-being data in crises
Based on this initial review and assessment of the shockproof nature of child well-being indicators, some immediate reflections for researchers are relevant.
First, existing indices of child well-being both national and international contain a mix of indicators - some of which are suitable and others are not - for analysing trends across crises, for various reasons (conceptual, methodological, and statistical). Changes are needed (including more regular data collection, as noted for KIC). This finding further underlines the need for a bespoke collection of longitudinal data on child well-being, drawing on nationally representative, and preferably accelerated, birth cohort studies.
Second, data collected in national indices are likely to be more easily adapted to measuring child well-being during and following shocks, as they are less reliant on secondary data and the introduction of shorter wave cycles for collection, and new items and instruments, is a relatively simpler task both logistically and politically.
Third, analysis of trends of existing child well-being outcomes needs to be undertaken at the indicator level, after analysts are satisfied that conceptual, methodological, and statistical standards have been met, and cautious interpretation has been applied (particularly in the case of secondary effects, or limited coverage by children’s ages). Concerns about the reliability and validity of population estimates derived from child or household surveys during crises can be addressed to a certain degree by weighting adjustments in cases where collection methods result in changes to non-response rates for key demographics (Richardson and Ali, Reference Richardson and Ali2014).
Fourth, researchers can at least utilise existing studies of well-being post-COVID and post cost-of-living to develop new specifically ‘shock-responsive’ measures to complement baseline trends. Moreover, researchers can learn from innovative efforts to collect data during the COVID-19 crisis in particular (online collections, telephone surveys, and more), and any existing collections with inherent shock-proof features, to develop modalities of collections that are more robust to future crises. For instance, new data collections should strive to build in measures that are specifically designed to be ‘auto-reactive’, or predictably elastic to health and economic crises, and indeed, climate shocks. These indicators do not necessarily need to be incorporated into aggregate indices covering ‘baseline’ trends, but can be. For collections, some survey modules representing key crisis indicators (not whole surveys) may be moved online, out of schools, and collected across larger age groups. Subsamples of online results can be harmonised with in-person collections to maintain series, as necessary.
Fifth, to facilitate the utilisation of future indices by other stakeholders including policymakers, and other researchers (including those building international indices!), survey coordinators could highlight the hypothesised routes to the impact on each indicator in the case of economic and health or climate shocks. This would allow data users and readers to determine how and when different shocks might impact children across all measures.
Finally, more research can be done to expand on the initial reflections undertaken in this article, to build on seminal conceptual papers in child indicators research (e.g., Ben-Arieh, Reference Ben-Arieh2008). Updating the conceptual guidance on good measurement of child well-being could also involve reflection on other lessons from, and demands put on, these indices in the past two decades (see OECD, 2009 or, 2015, or Bradshaw et al., Reference Bradshaw, Hoelscher and Richardson2006). Calls for understanding the interplay between indicators of child well-being, to highlight priority in action and response (Richardson and Ali, Reference Richardson and Ali2014) remain valid here. This can now be expanded to include the need to understand the interplay of covariate and idiosyncratic shocks on child well-being. More research on how covariate shocks compound the impact of, or increase the likelihood of, idiosyncratic shocks for some children, increasing vulnerabilities and inequalities in outcomes, is particularly important. For this type of study, better data is needed.
Implications for policymakers
As in the case of researchers, some immediate reflections are relevant for policymakers too. Notably, that governments are often data collectors, and the reflections for researchers may be taken into consideration in national statistical efforts to measure child well-being during and between covariate shocks.
Most indices of child well-being are still highly data-driven and designed for reflecting on conditions under normal circumstances. There is a role for policymakers in creating demand for, and providing financial support for unique and adaptable collections of child well-being data at the national level (see suggestion for the accelerated birth cohort). Limitations to collections will continue if research is dependent on insecure funding, and the issue of ‘how to’ respond to a crisis is not treated as a priority of equal importance as the response itself.
Responses to crises need to be informed by crisis-proof data. The three steps for assessing the suitability of an indicator to map crisis conditions for children can also be applied prior to using indicators for policy decisions or monitoring or evaluating policy effects. Research from independent sources should include an equivalent assessment of the suitability of indicators before using them to inform policy decisions.
When utilising existing indices, it should be noted that aggregation will ‘wash out’ the observable effects on crisis-sensitive indicators. Prior to using existing indices to inform policy decisions, these indices need to be deconstructed and the indicators utilised individually (once considered crisis-proof data).
Similarly, research that provides recommendations for policy needs to be based on reliable trend changes in key child well-being indicators in high-income countries, and so also needs to be assessed conceptual coherence, correct methodology, and statistical suitability (elastic, reliable, and valid), with an indication of whether this is a first or second order effect (to help prioritise first order effects if time allows).
During and following the recovery from a crisis, time, and resources for effective evaluation of policy responses, utilising quality assured crisis-proof indicators of child well-being, should be fully planned and budgeted for. This will strengthen future responses to crises, and ultimately improve the lives of children today, and future generations of children.
Competing interest
The authors of this article have no competing interests to declare.
Appendix Table 1. Full list of KICs indicators


 Open access