Introduction
When warm raindrops encounter an obstacle in their path, ice may accrete on the object (if the atmospheric temperature is sufficiently low). Numerical models which are based on differential forms of the conservation of momentum, energy and mass equations have been used to predict the accretion shape. These models are called continuous, since they are based on the assumption of continuous changes of all the physical parameters. Two main categories of such models can be distinguished: time-independent and time-dependent. In time-independent models (e.g. Reference Lozowski, Stallabrass and HeartyLozowski and others, 1983), the ice-shape calculations are based on the assumption that the initial growth rate remains unchanged during the simulation. The time-dependent models try to take into account, to varying degrees, the fact that the growing accretion changes the fluid flow around the object, the trajectories of the incoming droplets and the heat-transfer conditions (e.g. Reference MakkonenMakkonen, 1984; Reference Baker, Poots and RodgersBaker and others, 1986; Reference Szilder, Lozowski and GatesSzilder and others, 1987; Reference Poots and SkeltonPoots and Skelton, 1990).
In spite of significant progress in their development, continuous models seem to provide reasonable results only when the initial shape does not undergo substantial alterations. The most demanding cases occur when the accretion is very wet and has a complex geometry which changes with time. In this paper, instead of using a continuous approach, a random-walk model is developed to simulate the formation of an ice accretion, including cases when liquid moves along the surface of the ice accretion before freezing.
Monte Carlo models have been used in ice-accretion research as an alternative to continuous models. In this method, the motion of each drop or of drop ensembles is examined discretely. This approach has been applied successfully to predict accretion under riming conditions when impinging small droplets freeze on impact. Reference Gates, Liu and LozowskiGates and others (1988) examined accretion on a fixed cylinder and Reference Personne, Duroure and HPersonne and others (1990) on a rotating cylinder. A certain mobility of the droplets after impact was proposed by Reference Lozowski, Brett, Tait and SmyLozowski and others (1991) in the simulation of hailstone growth. Reference SzilderSzilder (1993) introduced the random-walk method into ice-accretion research, allowing simulation of wet cases when liquid water flows along the surface of an ice accretion before freezing. The random-walk model allows the efficient representation of water flow along an accretion surface, since the fluid elements can move considerably away from the location of their initial impact. The random-walk model also adds some stochastic variability to accretion shapes in keeping with experimental observations.
Most of the cases of ice accretion investigated in the literature are for droplet temperature below the freezing point. This is a reasonable assumption when the droplets are falling through cold air for a sufficient period of time. However, in some instances, there may not be enough time for the droplets to reach thermal equilibrium with the cold air. Two examples are sea spray and freezing rain. When drops freeze on impact, the maximum accretion thickness is usually located in the vicinity of the stagnation point unless droplets of small size are considered. On the other hand, for wet cases and warm drops, freezing may not occur at all at the forward stagnation point. The amount of heat provided by the warm droplets could be large enough to prevent freezing. At some distance from the stagnation point, where fewer drops impinge, the temperature of the liquid flowing along the cylinder surface may reach the freezing point due to heat loss to the cold air and the freezing process begins. A relation for the distribution of water-film temperature along the cylinder surface will be derived in this paper.
During wet icing conditions, when there is a lot of available water, a pendant-ice formation may also be found below the cylinder. Due to the limitations of continuous models, the formation of such large accretions above and below a cylinder has not so far been simulated successfully. However, continuous models of icicle formation have been developed. Reference MakkonenMakkonen (1988), for example, has presented a model for fresh-water icicles and Reference Chung and LozowskiChung and Lozowski (1990) a model of marine-icicle growth.
The objective of this paper is to develop a model which will predict the shape and mass of ice accretions on an insulated cylinder due to freezing rain as a function of atmospheric conditions. The first part of the model consists of an analytical relation used to establish the point where water freezing begins. The second part of the model consists of a random-walk algorithm used to predict the accretion shape in the region whose boundaries have been established by the first part of the model.
Analytical Model to Predict the Location of Initial Freezing
A horizontal cylinder, of zero heat capacity and thermal conductivity, is exposed to vertically falling raindrops. The air temperature is below freezing and the droplet temperature is above freezing. If the air or drop temperature is sufficiently high, the freezing process may not begin at the upper stagnation line of the cylinder. The resulting film of water flowing down around the cylinder surface will gradually cool as a result of convective heat loss to the air, and at some location ice may begin to form. In this section of the paper, the region where the liquid film cools without freezing is examined. Due to the influence of impinging drops on the upper half of the cylinder, the mass-and heat-balance equations for the upper and lower halves of the cylinder are considered separately.
Let us consider the mass-balance equation written for the upper half of the cylinder (Fig. 1). We assume that the droplets fall vertically following parallel straight lines and that, once they hit the cylinder without splashing, they flow along its surface. The rate of change of the mass flux of water flowing along the cylinder surface is therefore determined by the local vertical flux of the rain:

where m is mass flux of water flowing along the cylinder (kg m−1s−1); s is distance along the surface, ds = RdΘ (m); R is cylinder radius (m); Θ is the angle measured from the upper stagnation point (rad); W is rainfall rate (kg m−2s−1). Integration of the above relation gives
We will assume in this section that all of the water which reaches Θ = π/2 flows along the lower half of the cylinder and, if unfrozen, is shed only at the lower stagnation point.
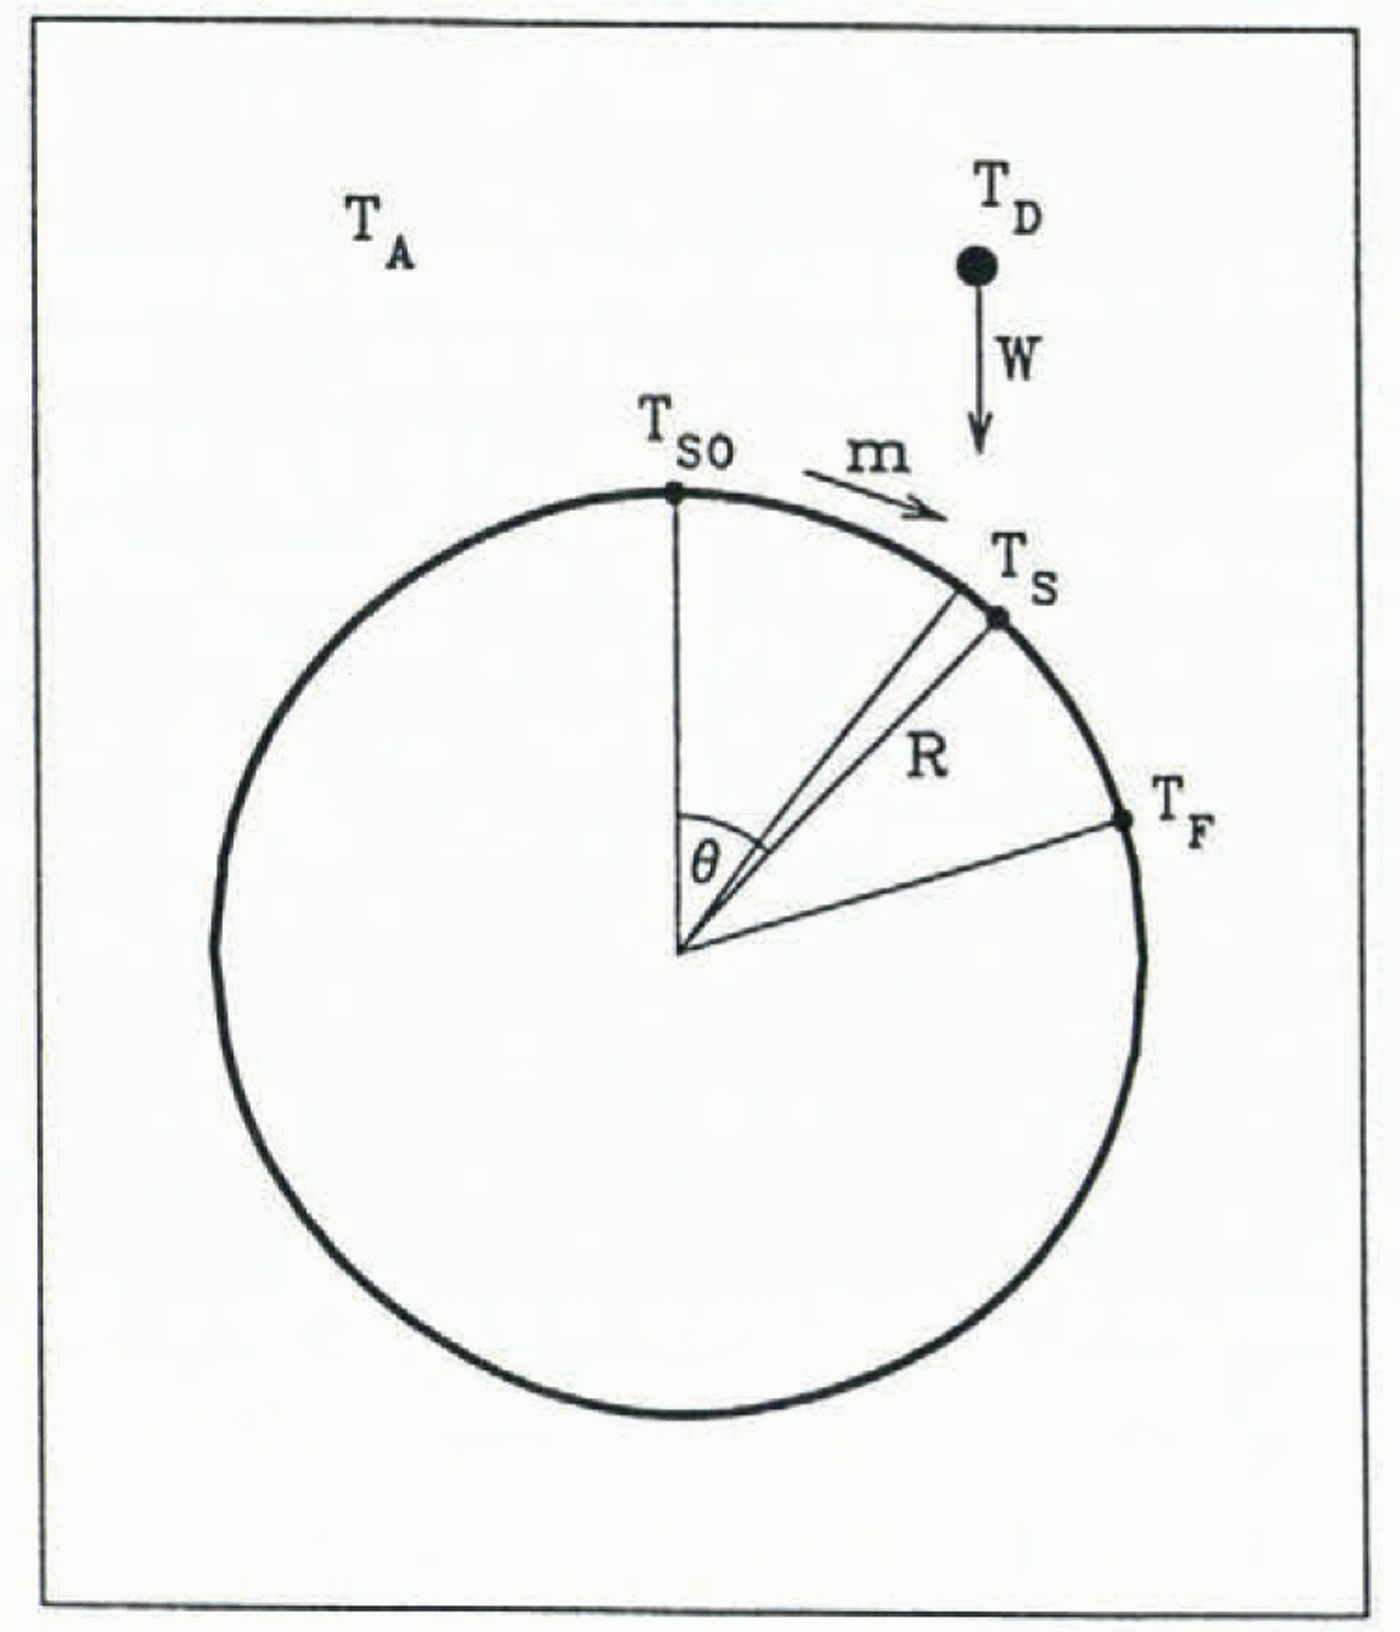
Fig. 1. A cylinder exposed to vertically falling freezing rain.
If we assume that there is no radial temperature gradient inside the water film, the heat-balance equation for water flowing along the upper half of the cylinder may be written simply. It states that the rate of change of the water’s internal energy is due to the sensible heat of warm droplet impingement and to the convective heat loss to the cold air:

where cw is specific heat capacity of water (J kg−1 K−1); Ts is local surface temperature (°C); h is droplet temperature (°C); h is the heat-transfer coefficient which includes the combined effects of convection, evaporation and radiation (W m−2K−1). For simplicity, it is assumed that all heat exchange between the cylinder’s surface and the surrounding air may be combined into a single linear term which is proportional to the temperature difference between the surface and the air (Reference Poots and SkeltonPoots and Skelton, 1992). It is also assumed that the heat-transfer coefficient is not a function of location. These approximations allow for ease of solution. They could be relaxed in future provided sufficient experimental information on heat transfer under these two-phase flow conditions is available.
In order to non-dimensionalize the model, the heat-balance equation is first written for the upper stagnation point:

where T so is the surface temperature at the upper stagnation point (°C). Using Equations (2) and (4), one may write Equation (3) in the following dimensionless form:

where

The solution of Equation (5) provides the distribution of film temperature over the upper half of the cylinder. Equation (5) has an analytical solution for integer values of the parameter A:

If freezing does not begin by Θ = π/2, it is necessary to consider the heat exchange beyond this point. Because of the absence of heat flux due to impinging drops, the heat-balance equation for the lower half of the cylinder may be written using a simplified form of Equation (3):

Integration of Equation (8) gives an exponential decrease of the film temperature with angular position:

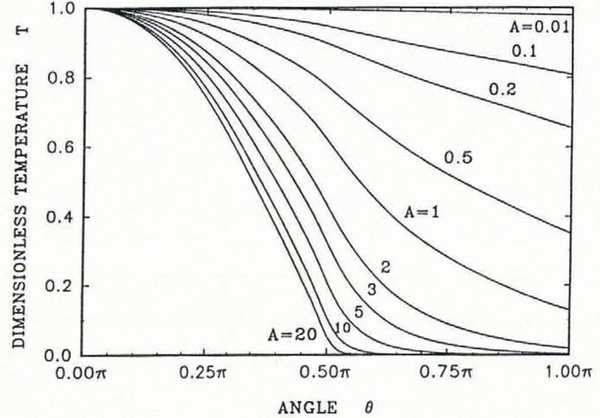
Equations (5) and (9) determine the distribution of the dimensionless surface temperature around the cylinder (Fig. 2). An increase of the parameter A leads to a more rapid decrease of the dimensionless water-film temperature with distance along the cylinder surface. High values of A correspond to rapid heat exchange with the cold air stream or to a small mass flux of impinging raindrops. It should be stressed that this temperature distribution is only valid in the region where the surface temperature remains above the freezing point.
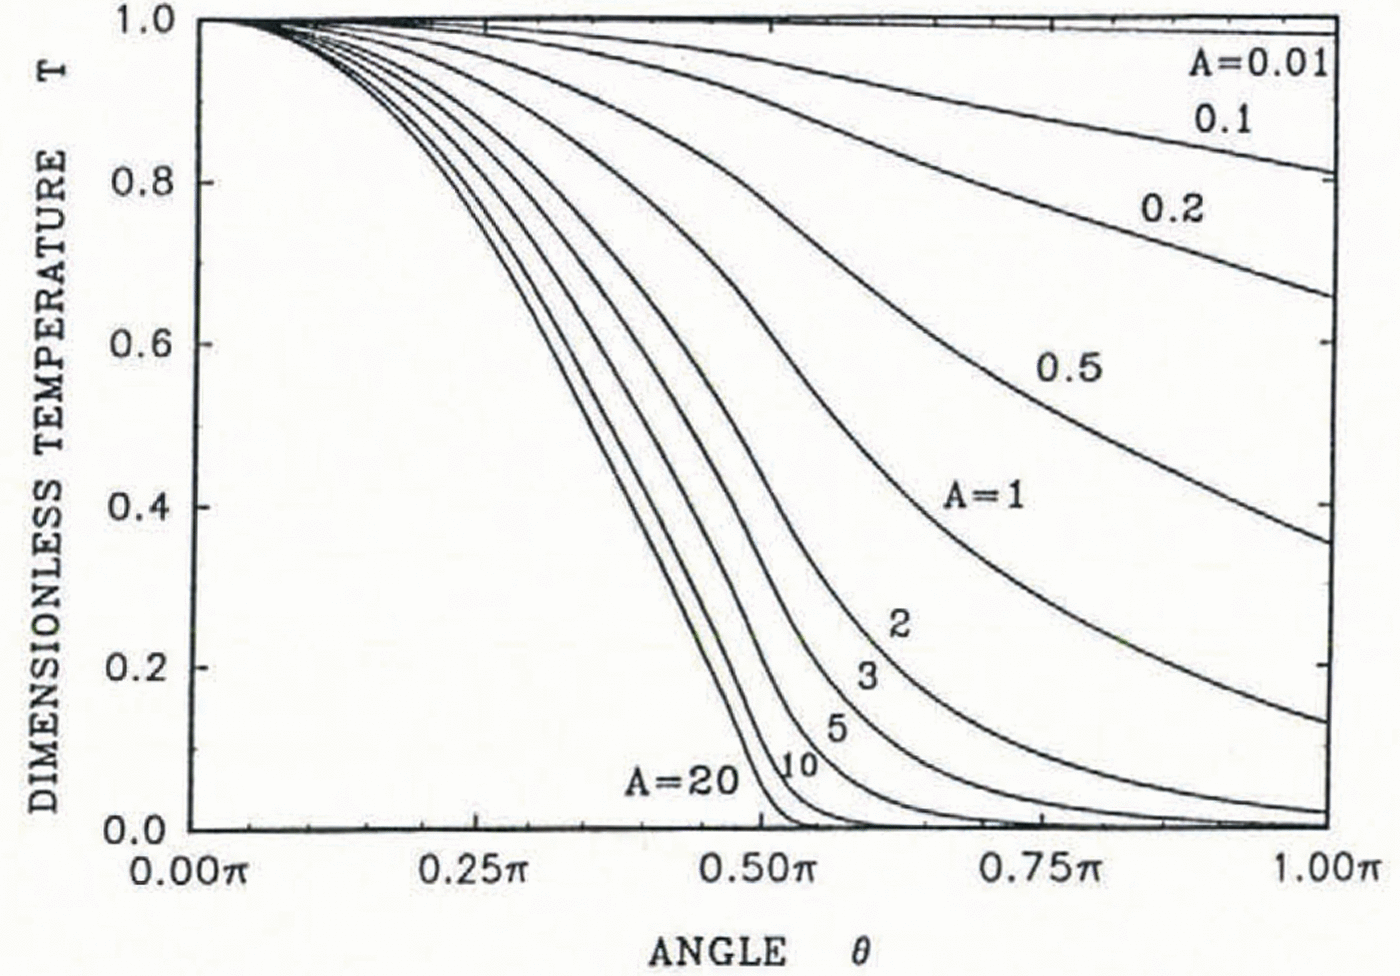
Fig. 2. The dimensionless surface temperature of the water film on a cylinder (Equation (6)), as a function of location.
To calculate the location where the film temperature reaches the freezing point and the freezing process begins, more information than the distribution of the dimensionless surface temperature is needed. Consider first the limiting case when the sensible heat of the run-back water is neglected. The freezing process then begins at Θ = π C, where the heat loss to the air is in balance with the sensible-heat flux provided by the impinging warm droplets:
In this case, the location on the cylinder where freezing begins is given by the critical freezing angle:

If the heat-ratio parameter α is greater than unity, the freezing begins at the upper stagnation point (Fig. 3). In this case, the heat loss to the cold air exceeds the maximum sensible-heat flux of the warm drops. On the other hand, when α is very small, the location of the initial freezing point approaches π/2.

Fig. 3. The freezing angle as a function of the two parameters a (Equation (11)) and A (Equation (6)). The solution of Equation (11) is also shown.
Since the water flowing along the cylinder surface has a non-zero heat capacity, the ice will begin to form further downstream than the location predicted by Equation (11). This location may be determined as follows. Consider the dimensionless freezing temperature:

It can be easily shown that

Knowing A and α, one can calculate T*F using Equation (13) and then the location where this temperature is reached using Figure 2. Consequently, the freezing angle can be expressed as a function of the two parameters A and α (Fig. 3). Due to the heat capacity of the run-back water, the location of the freezing point is moved downstream in comparison with the simplified case of zero heat capacity (Equation (11)). This location difference is less pronounced for large values of the parameter A. For small values of both α and A, freezing may not occur on the cylinder at all.
The algorithm described above predicts the distribution of the water-film temperature on the cylinder and the location where ice begins to form. Downstream from this location, the film temperature remains at the freezing point and freezing occurs. This freezing process is simulated by the random-walk model, described in the next section.
Random-Walk Model to Predict the Shape of the Ice Accretion
The model which is used to predict the shape of the ice accretion is a combination of a ballistic trajectory and a random-walk model. The ballistic model determines the location of impact of fluid elements and the random-walk model predicts their motion along the surface of the ice already formed on the cylinder. These fluid elements may be imagined as consisting of a single raindrop or as part of a raindrop. However, they maintain their identity as they flow along the surface and freeze. The details of this model have been described by Reference SzilderSzilder (1993) and Reference Szilder, Lozowski, Nixon, Sodhi, Sinha and AyorindeSzilder and Lozowski (1993). However, for completeness, the highlights of the model are given below.
To simplify the calculations, the accretion domain is defined by a two-dimensional lattice. Fluid elements are fired along straight vertical lines from a random position along a horizontal line on the upper edge of the lattice. An element impinges directly on to the existing ice accretion when it reaches a lattice location just above or to the immediate right or left of a lattice box which is already occupied by an ice element. A fluid element could also hit part of the cylinder where freezing does not occur according to the analytical model. If this happens, the element is moved along the cylinder surface to the location of the initial freezing angle. From there, the element begins its random walk.
At each time step during random walk, there are four possibilities for a fluid element: it may move one cell to the right, left or down, or it may freeze. Probabilities of occurrence of those four events are introduced. In the next section, the freezing probability will be expressed as a function of atmospheric conditions using a simple analytical approach. To simplify the dynamics, the probabilities of motion in the three allowed directions are assumed to be the same. Since the sum of all four probabilities is unity, the probability of motion in any of three permitted directions is therefore one-third of the difference between unity and the freezing probability.
A fluid element’s random walk may end in one of two ways. The first is by freezing. If this happens, a “cradle” location is sought for the element in the neighbourhood of its present location. The size of this area is determined by the freezing-range parameter, n. The neighbourhood is a square centred on the initially determined freezing point with side length (in cells) equal to 2n + 1. The freezing particle is moved to the empty cell within this area where it will have the maximum number of occupied neighbours. If there is more than one such location, the final site is chosen randomly from among them. In the following calculations, the freezing-range parameter is assumed to be 4. This value gives good correspondence between observed and measured porosity of the ice accretion (Reference SzilderSzilder, 1993).
A second possibility for terminating the fluid element’s motion occurs if it is shed from the ice structure. This may occur in the model only if the element reaches the lowest level of the accretion. If the element remains at the lowest level without freezing for more time steps than a critical value called the shedding parameter, it then drips from the structure. Once a fluid element’s motion is terminated, either by freezing or by dripping, the next element is released.
In the following sections the freezing probability and the shedding parameter will be related to the atmospheric conditions and the geometry of the problem, using a simple analytical approach.
The freezing probability
The freezing probability may be expressed as follows:

where Δs is step length measured along the accretion surface (m); S is the distance along the cylinder surface at which all the water has frozen (m); P c is the probability of motion along the accretion surface. Equation (14) may be examined by considering a simple case where the fluid element at each time step moves one cell downward along a vertical wall and consequently P C = 1. In this case, the freezing probability is the ratio of the distance covered in one step to the mean length of the element’s motion before freezing, i.e. half the distance required for all the water to freeze. When motion around a cylinder is considered, there are two problems which complicate this simple picture. First, fluid elements do not move along the cylinder surface in only one direction at each time step. Secondly, the step length along the cylinder surface does not correspond to the lattice spacing.
In order to estimate the probability of motion along a cylinder surface, a series of 1000 numerical experiments was performed. In each experiment, the freezing probability was set to zero and the probabilities of left, right and downward motion were each one-third. A fluid element was released from the top of a cylinder whose radius was 20 times the grid cell size. In the experiment, the average number of time steps required to reach the bottom of the cylinder was 449. The number of grid steps over the same distance is 84. Consequently, the probability of motion along the cylinder surface, for the assumed values of the directional probabilities, is 0.187.
The relationship between the step length measured along the cylinder surface Δs and the grid spacing Δl is simply:
This can be seen as follows. Since a fluid element is constrained to travel in either horizontal or vertical steps, it must travel a total distance 4R in order to get half-way round the circumference, namely πR. In order to do this in an equal number of steps, Equation (15) must be fulfilled.
The distance over which all of the flowing water freezes may be determined using an energy-balance equation. The sum of the heat loss to the air and the sensible heat brought by the impinging drops is proportional to the amount of freezing water:

where s is the distance measured along the cylinder surface from the upper stagnation line (Θ = 0) to Θ = π/2, and from there vertically downward (m); mo is total mass flux of impinging drops on to the cylinder, =WR (Equation (2)) (kg m−1 s−1); ms , is the mass flux of water at location s (kg m−1 s−1). Equation (16) takes a simpler form when the location S where all the water has frozen is considered. If s = S, then ms = 0 and so

Using Equations (15) and (17), the freezing probability may be expressed as:

Thus, the freezing probability is seen to be a function of the following variables: atmospheric conditions, combined in the form of the α parameter and the Stefan number, St, the ratio of the grid size and the cylinder radius, and the probability of motion along the cylinder surface which, in turn, depends upon the directional probabilities of motion. This expression for the freezing probability has been derived for a bare cylinder but, for convenience, it is also used during growth of the ice accretion.
The shedding parameter
The shedding parameter, which emulates the behaviour of a pendant drop, may also be expressed as a function of the atmospheric conditions. The pendant drop is assumed to be three-dimensional even though the accretion itself is two-dimensional. Hence, the mass-balance equation for the pendant drop may be written:

The pendant drop starts to form at t = 0 and, after a period T, its mass reaches a critical value MGR., at which point it drips off the accretion and the process repeats. The factor of 2 in Equation (19) allows for the fact that water flows into the pendant drop from both sides of the accretion. In view of Equation (16), ms may be written in the form

Since the pendant drop forms at a well-defined location (s = constant) for a given time interval, this mass flux is independent of time. This means that the average time interval for a fluid element to stay at the tip of the accretion, as part of the pendant drop, is half the drip period.
The shedding parameter is defined as the average number of time steps, Δ t, during which a model drop stays at the tip of the accretion before dripping. Hence

Calculating the period of dripping from Equation (19) and using Equation (20), the shedding parameter may be written:

and Sh0 is the initial shedding parameter (when s = 0).
Thus, the shedding parameter increases with increasing length of the accretion. This result can be explained by the fact that, as the accretion grows, an increasing amount of water freezes on the sides of the accretion and there is a decrease in the water flux reaching the tip of the accretion. Consequently, more time is required to reach the critical mass. As the accretion length approaches the maximum length, s→ S, the shedding parameter tends to infinity.
The critical mass of the pendant drop can be estimated from experimental data. The measurements show (e.g. Reference Maeno and TakahashiMaeno and Takahashi, 1984; Reference Chung and LozowskiChung and Lozowski, 1990) that the diameter of a pendant drop is approximately 5 mm, and hence its mass is 6.5 × 10⁻⁵kg. The distance between pendant drops formed under a horizontal cylinder is approximately 20 mm (Reference Makkonen and FujiiMakkonen and Fujii, 1993). Consequently, the critical mass M CR is estimated as 3.2 × 10⁻³kg m−1. In the next section, the following values are assumed: cylinder radius 20 mm, grid size 1 mm, velocity of the fluid elements moving along the accretion surface 10 mm s−1 (and hence a time step of 0.1 s).
Model Results and Discussion
A combination of the analytical model and the random-walk model is used to predict accretion on a cylinder under freezing-rain conditions. The analytical model determines the location where freezing begins and the random-walk model predicts the accretion shape. The random-walk simulations are performed on a two-dimensional lattice consisting of 100 by 150 cells.
Using the model, the influence of external heat flux and the rainfall rate on the accretion process is investigated. In general, the external heat flux consists of convective, evaporative and radiative terms. However, for convenience, we will simply refer to all of these as the convective heat flux. Model calculations show that a change in the temperature of the drops within a realistic range does not substantially influence the accretion shape. In the results presented here, the drop temperature is assumed to be 2°C.
The random-walk model’s prediction of the thickness of the uniform part of the ice layer on the upper half of the cylinder may be compared quantitatively with that predicted by a simple heat-balance model. The mass m L, of ice which forms during a time interval t is proportional to the difference between the convective-heat flux from the cylinder and the sensible-heat flux of the warm raindrops:

The thickness of the ice layer is

where ρI is ice density (920kg m−3). Equations (23) and (24) will be used in the discussion to check the validity of the random-walk model.
Influence of the convective-heat flux
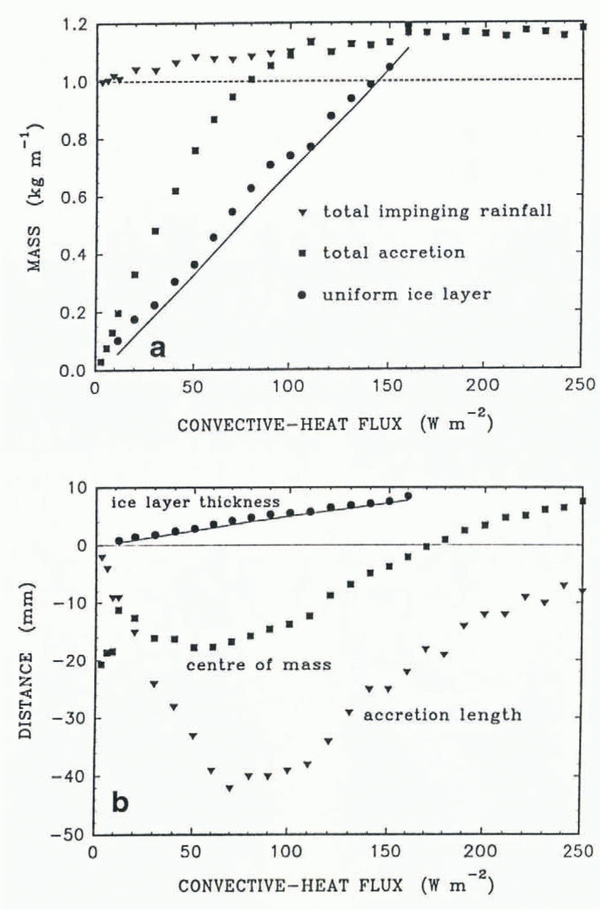
The influence of the convective-heat flux on the distribution of the mass in the ice accretion is shown in figure 4a. The total impinging rainfall mass increases slowly with the heat flux, since the horizontal cross-section of the accretion which intercepts the rain increases with external heat flux. The total accretion mass increases rapidly with the heat flux and it eventually reaches the total impinging rainfall mass. Thereafter, all of the impinging water freezes somewhere on the accretion. The “uniform ice-layer mass”, calculated as twice the mass accreted on the upper half of the cylinder, increases almost linearly with heat flux. When the accretion mass on the upper half of the cylinder exceeds the accretion below the cylinder, the uniform ice-layer mass is not displayed.

Fig. 4. The influence of the convective-heat flux on the accretion process. The following values have been assumed: the rainfall rate 5 mm h−1, the drop temperature 2°C, the simulation time 5 h and the cylinder radius 20 mm. a. Changes of the three characteristic masses. The solid line represents the ice-layer mass predicted by Equation (23). The dashed line shows the total mass of impinging drops, if the horizontal cross-section of the structure had not changed, b. Changes of the three characteristic distances. The solid line represents prediction of the ice-layer thickness by Equations (23) and (24).
Various linear measures of the ice-shape geometry are shown in figure 4b. These are: the thickness of the uniform ice layer, the vertical coordinate of the accretion’s centre of mass measured upward from the centre of the cylinder and the pendant accretion length, defined as the distance between the bottom of the cylinder and the lowest part of the accretion. For very small values of the convective-heat flux, ice forms only on the lower part of the cylinder. When the convective-heat flux reaches 11.7 Wm−2, the accretion covers the whole cylinder and the centre of mass moves slightly downward. A further increase of the convective-heat flux leads to upward motion of the centre of mass, which moves to locations above the axis of the cylinder at a heat flux of approximately 170 Wm−2. Small values of the convective-heat flux are associated with a small accretion length. Initially, an increase of the heat flux leads to an increase of the accretion length. However, for larger values of the convective-heat flux, more freezing occurs on the upper part of the cylinder and there is less water available to freeze below the cylinder. Thus, the accretion length decreases.
The accretion shapes for different values of the convective-heat flux are shown in Figure 5. An example of an accretion shape, when the ice covers only part of the cylinder surface, is shown in figure 5a. In this case, it has been assumed that α = 0.5 (Equation (11)), and consequently the convective-heat flux is 5.85 Wm−2. From Figure 3, it is clear that the value of parameter A must be known in order to determine the freezing angle. It has been assumed that the value of parameter A (Equation (6)), is unity (this means that h = 5.85 Wm−2K−1 and TA =−l°C) and the resulting freezing angle is equal to π/2. The drops freeze only under the cylinder and the accretion grows gradually with time. However, only 7.7% of the impinging drops freeze. When there is enough heat lost to the cold air, the ice layer covers the whole cylinder surface. Figure 5b is for a convective-heat flux of 11.7 Wm−2 when α = 1. In this region, the centre of mass of the accretion reaches its highest location (Fig. 4b), because the ice forms a uniform layer around the cylinder and the mass accreted below the cylinder is comparatively small.
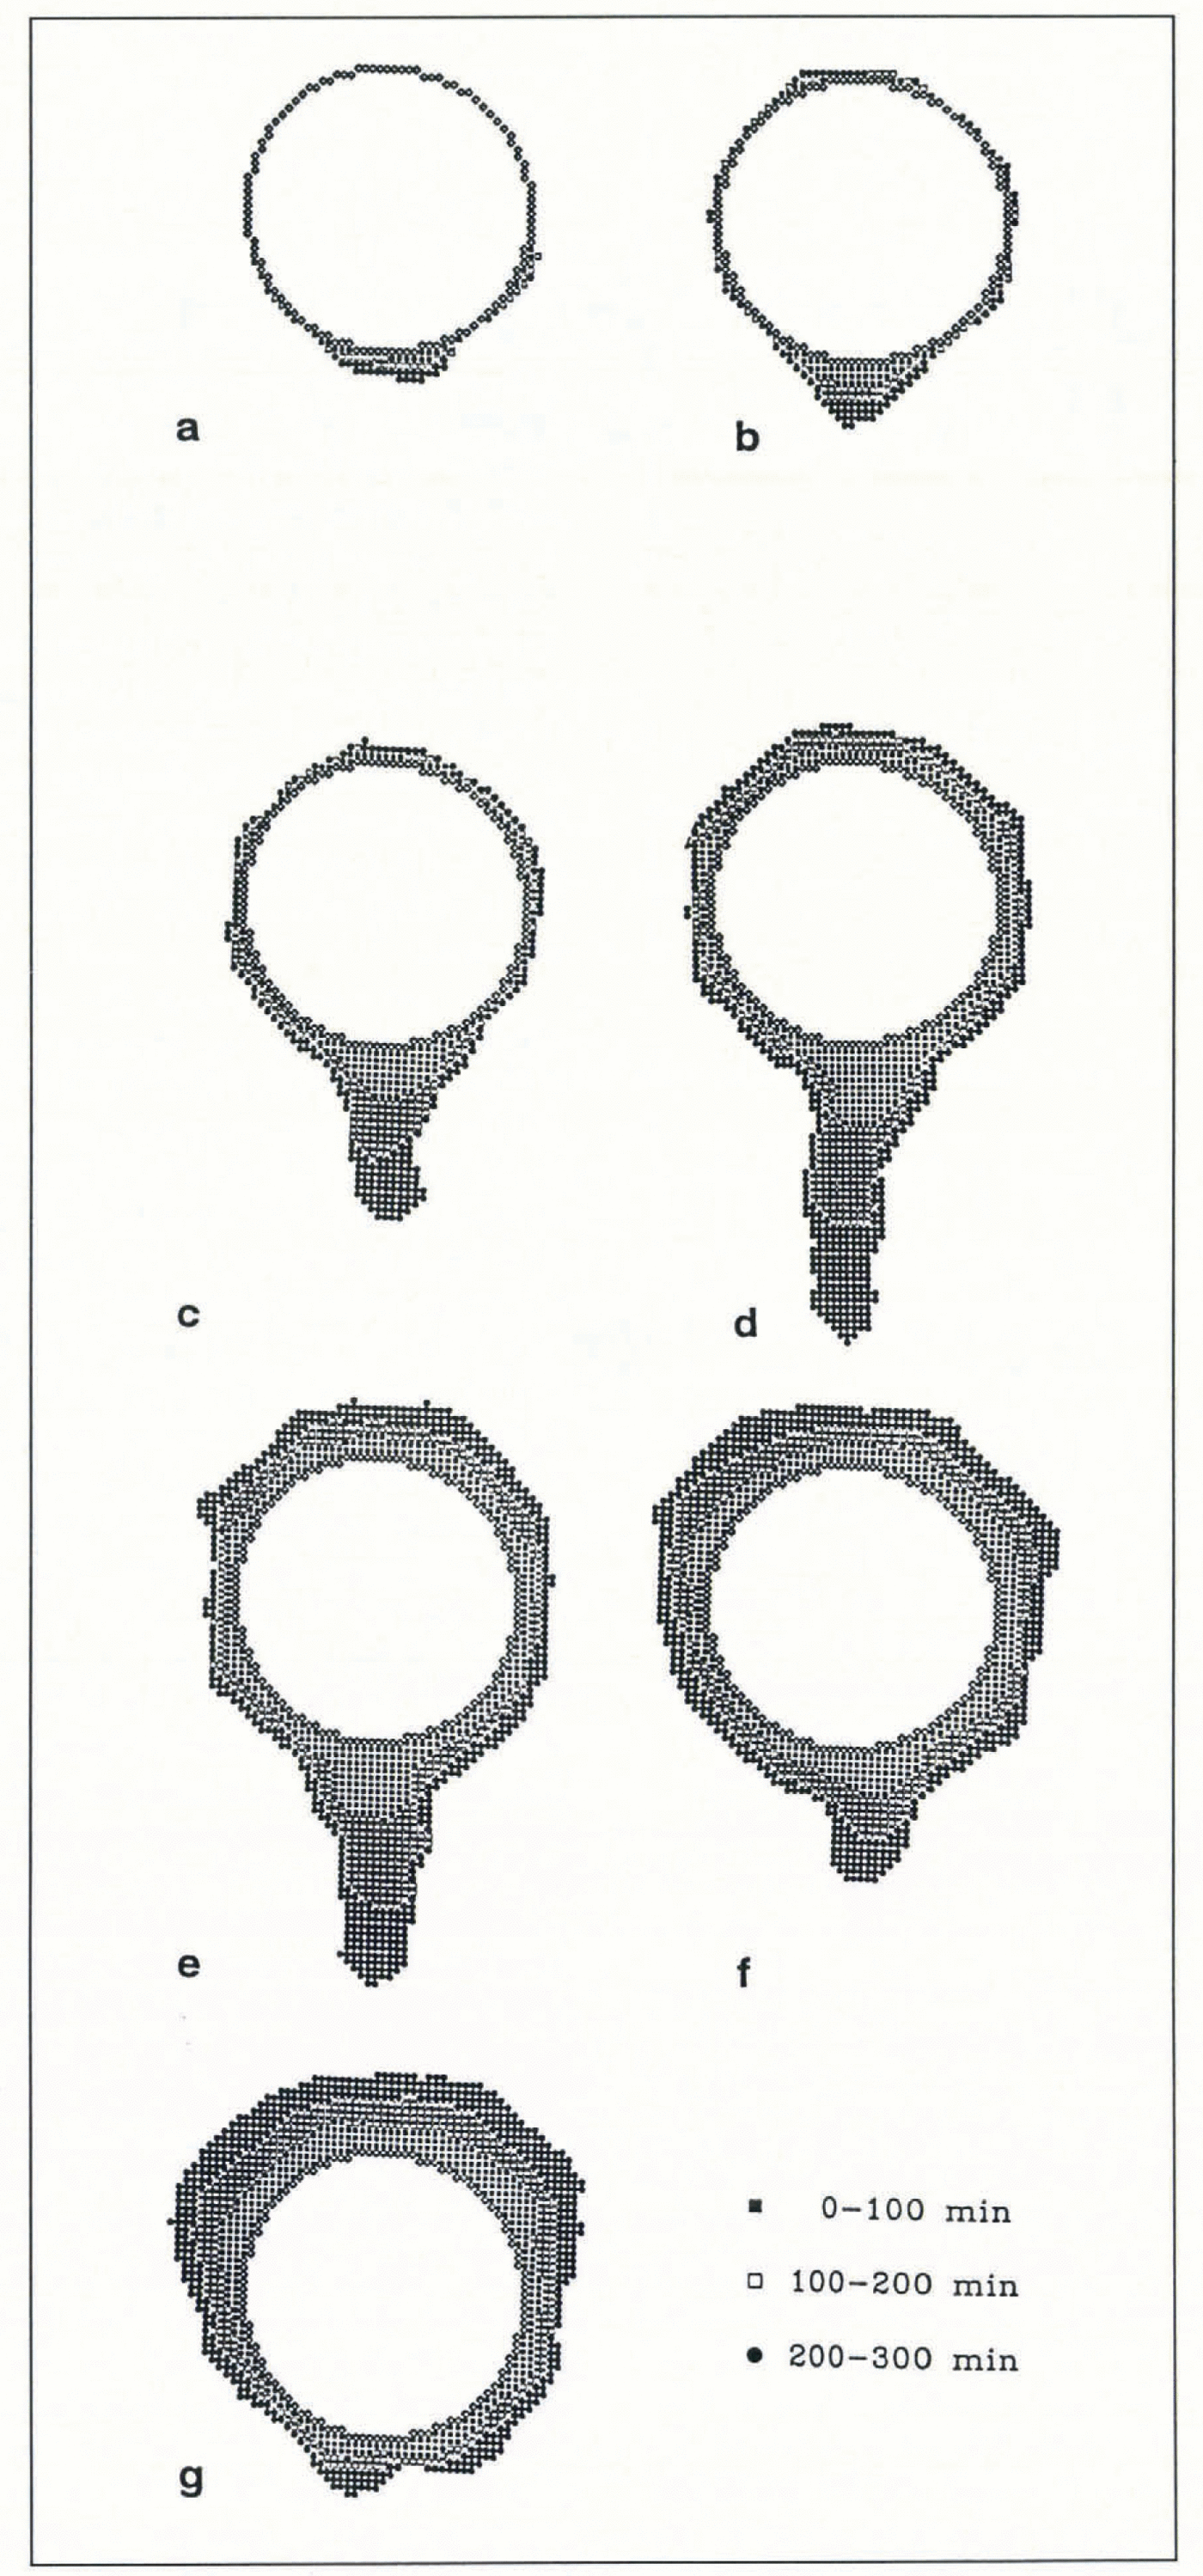
Fig. 5. The influence of the convective-heat flux on the shape of the ice accretion. Consecutive ice layers formed during 100 min time intervals are distinguished. The diamond shapes represent the cylinder-surface approximation. The values of the parameters are the same as in Figure 4 and only the convective-heat flux vanes, a. 5.85 Wm−2; b. 11.7 Wm−2; c. 30.0 Wm−2; d. 70.0 Wm−2; e. 120.0 Wm−2;f 170.0 Wm−2; g. 250.0 Wm−2.
When the convective-heat flux is 30 Wm−2 (Fig. 5c), the heat and water availability below the cylinder leads to a substantial accretion there. For a convective-heat flux of about 70 Wm−2 (Fig. 5d), almost all of the liquid impinging on to the accretion is incorporated into the ice structure and, at the same time, the accretion length reaches a maximum. At higher values of the convective-heat flux, the accretion mass on the upper half of the cylinder increases and hence the overall length of the accretion decreases, and the centre of mass moves upward. This process may be seen in Figure 5e. Still further increases of the convective-heat flux lead to an accretion which is larger above than below the cylinder (Fig. 5f and g). A substantial increase of the horizontal cross-section of the accretion leads to an increase in the number of drops impinging on to the accretion during accretion growth.
Since appropriate experimental data are not available, a partial verification of the model based on a comparison with existing experimental data, and with existing models which simulate some aspects of the process examined, has been achieved. The prediction of the uniform ice-layer mass and thickness has been compared with the simple continuous-model prediction of Equations (23) and (24). As can be seen in figure 4a and 4b, there is a good quantitative agreement between the random-walk model prediction and the values given by the simple model. Of course, the advantage of the random-walk model is that it predicts not only the uniform ice layer on the cylinder but also the entire accretion shape. The accretion below a cylinder has been compared qualitatively with the formation of icicles. Experimental data (Reference Maeno and TakahashiMaeno and Takahashi, 1984) show that a decrease of the air temperature leads to longer icicles. The same type of behaviour is exhibited by the proposed model for increasing convective-heat flux. In addition, the model suggests that, after reaching a maximum length, a further increase of the heat flux, or a decrease of the air temperature, leads to shortening of the pendant accretion.
Influence of the rainfall rate
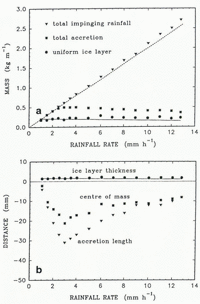
The influence of the rainfall rate on the accretion has also been examined (Fig. 6). At rainfall rates smaller than 1 mm h−1, the sensible heat brought by the warm rain is small and the convective-heat flux is large enough to freeze quickly all the impinging liquid. Consequently, most of the accretion occurs on the upper half of the cylinder and there is no dripping.
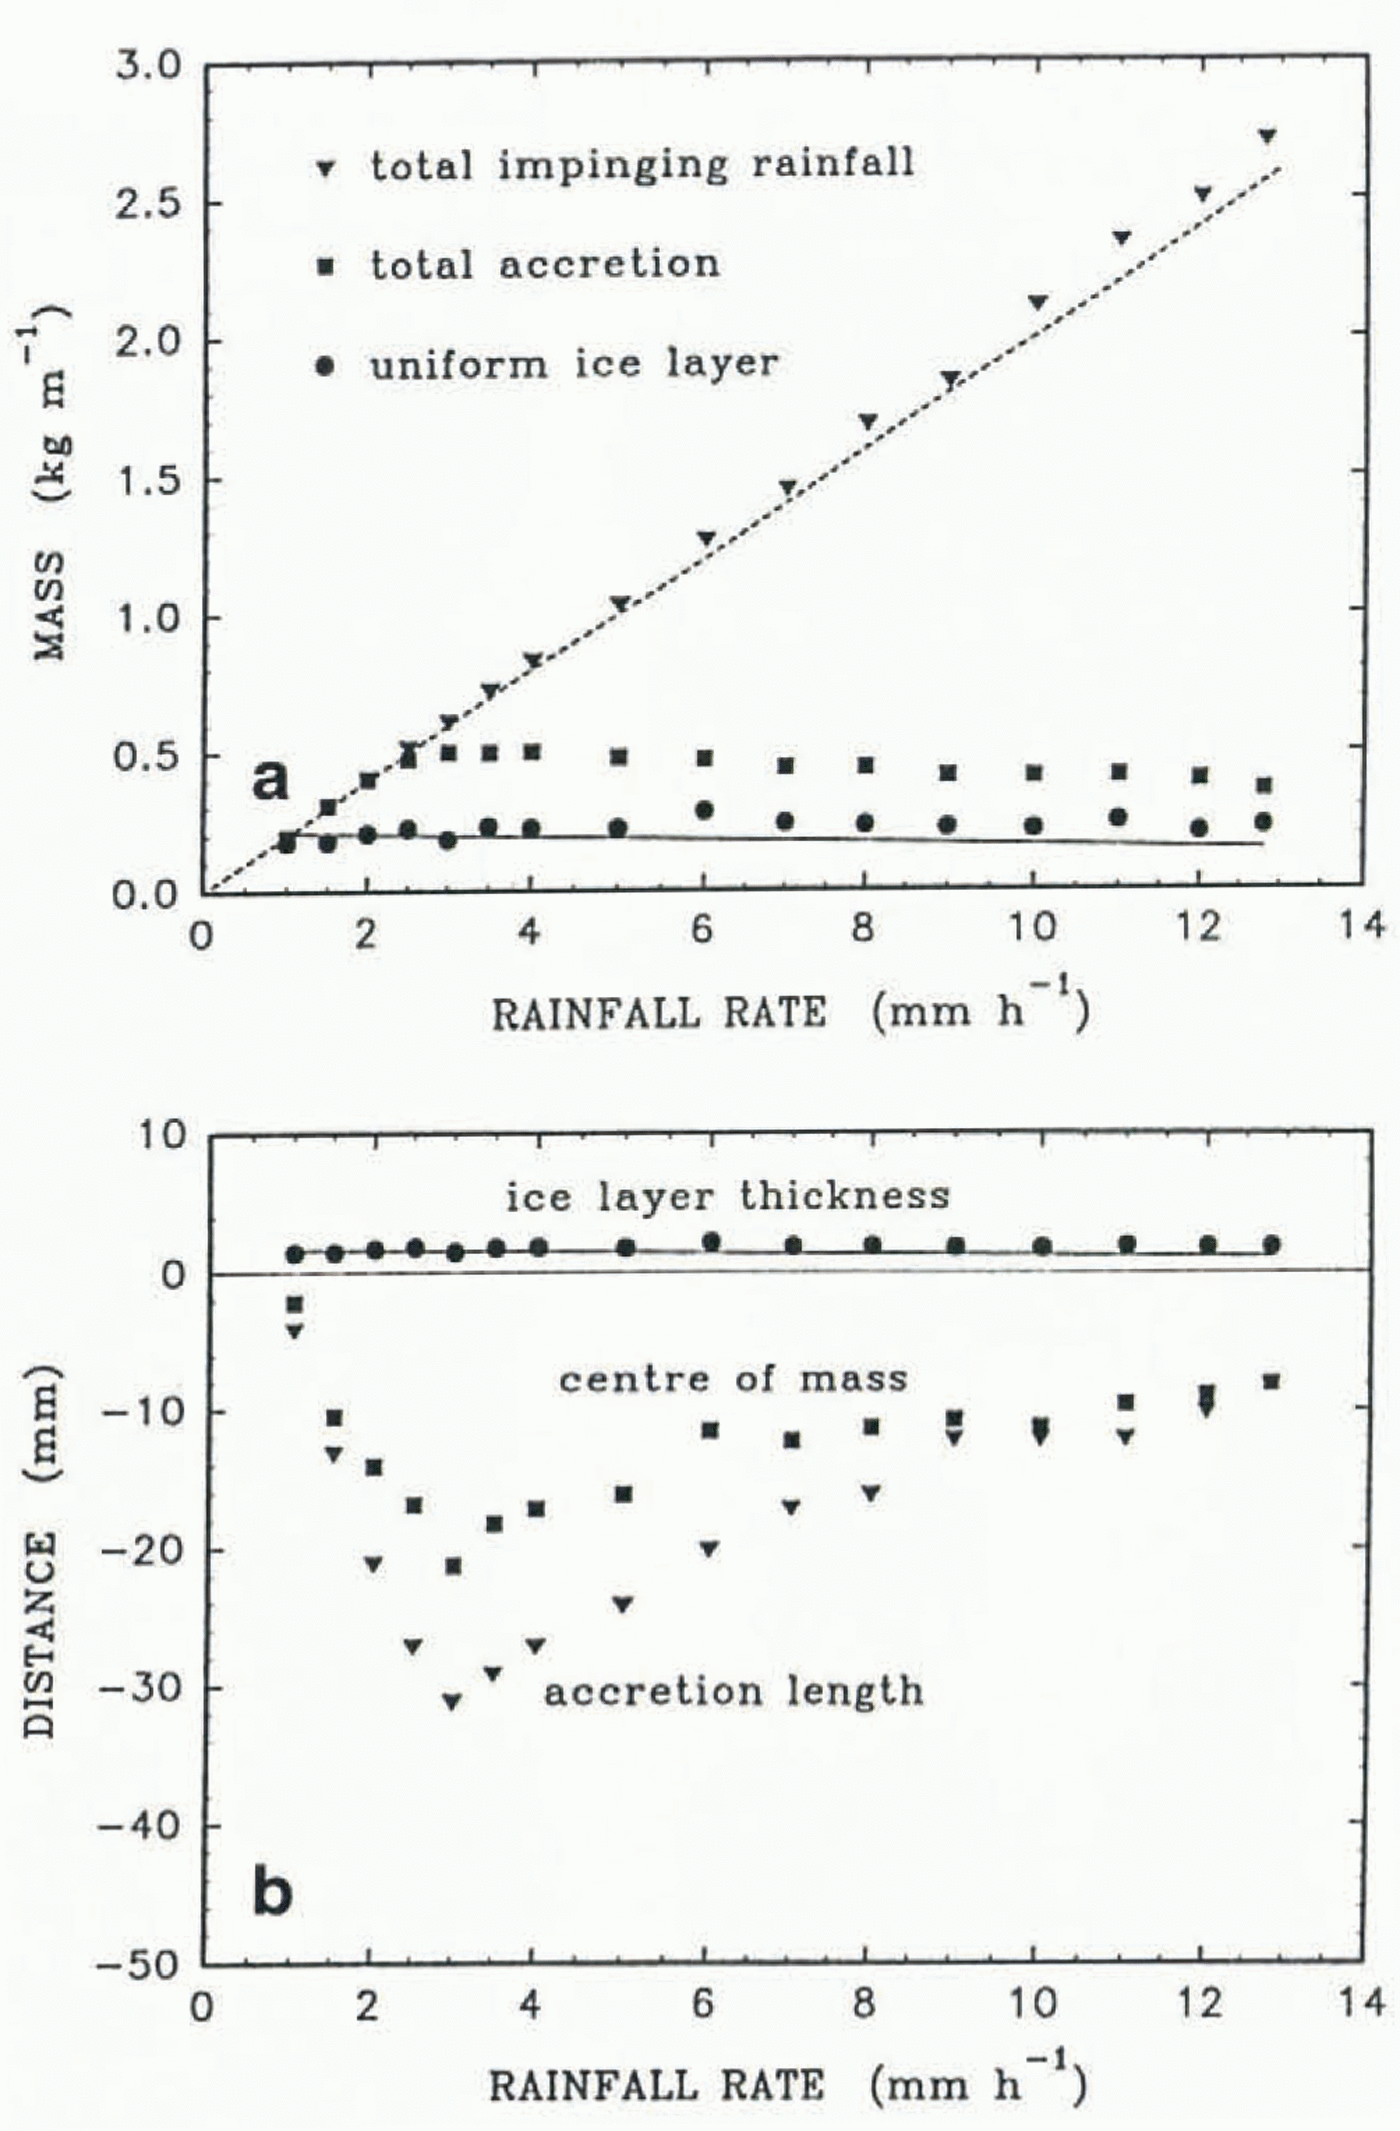
Fig. 6. The influence of the rainfall rate on the accretion process. The following values have been assumed: the convective-heat flux 30 Wm−2, the drop temperature 2°C, the simulation time 5 h and the cylinder radius 20 mm. a. Changes of the three characteristic masses. The solid line represents the ice-layer mass predicted by Equation (23). The dashed line shows the total mass of impinging drops, if the horizontal cross-section of the structure had not changed, b. Changes of the three characteristic distances. The solid line represents prediction of the ice-layer thickness by Equations (23) and (24).
When the rainfall rate is 1 mm h−1, there is a sufficient liquid flux to cover the whole cylinder. A further increase of the rainfall rate does not substantially change the amount of accretion on the upper half of the cylinder. Consequently, the mass and thickness of the uniform ice layer remains approximately constant. However, as the rainfall rate grows, the accretion below the cylinder increases, the centre of mass moves downward and some of the drops begin to fall from the tip of the structure. At a rainfall rate of 3 mm h−1, the accretion length reaches a maximum. The existence of two competing processes can explain the occurrence of this maximum. On the one hand, a low impinging-water flux means that there is the potential for more water to freeze. On the other hand, a large impinging flux means that more sensible heat is brought by the warm drops and the pendant drops drip faster.
Further increase in the rainfall rate leads to a gradual decrease in the accretion length below the cylinder. Consequently, the centre of mass of the accretion moves upward. The process of diminishing accretion below the cylinder and more-or-less constant accretion on top of the cylinder continues until the rainfall rate reaches 12.8 mm h−1. At this point, the parameter α becomes unity. A further increase in the rainfall rate leads to the disappearance of ice from the top of the cylinder, α < 1 (see Fig. 3). Since such a rainfall rate seems to be unrealistically high for freezing rain, these results are not shown in this paper.
A comparison between the random-walk model prediction of the uniform ice layer and the simple continuous model (Equations (23) and (24)) is promising (Fig. 6). The random-walk model prediction has also been compared qualitatively to the results of the icicle-growth model proposed by Reference MakkonenMakkonen (1988). The Makkonen model shows that, initially, an increase in the water-supply rate leads to an increase in the icicle length. However, after the maximum icicle length is reached, a further increase in the supply rate makes the icicle shorter. The same type of relation is found in the random-walk model for accretion below the cylinder. Despite differences in details between the processes, which these various models simulate, this qualitative agreement is encouraging. In addition, the same type of influence of the amount of supplied water on icicle geometry has been observed experimentally (Reference Maeno and TakahashiMaeno and Takahashi, 1984).
Conclusions
A random-walk model has been successfully used to simulate ice accretion due to freezing rain on a horizontal thermally insulated cylinder. The following aspects of accretion growth predicted by the random-walk model have been verified. The thickness of the uniform ice layer compares well with that predicted by a simple analytical model. The growth of the accretion below the cylinder is in qualitative agreement with experimental results and model predictions for icicle growth. In the future, three-dimensional simulations of accretion growth with a spatial distribution of the heat flux should lead to even more realistic predictions.
Acknowledgements
I am grateful to Professor G. Poots for his continuing support during this study. I am grateful to the U.K. SERC for a Visiting Fellowship to the Centre for Industrial Applied Mathematics. I also wish to express my appreciation to Professor E. P. Lozowski for valuable discussions, editorial help and financial support under NSERC Canada operating grant NSERCA8168.
The accuracy of references in the text and in this list is the responsibility of the authors, to whom queries should be addressed.


