


The glaciological work of the Trans-Antarctic Expedition (leader, Sir Vivian Fuchs) was begun at “Southice”, the inland ice station set up by the expedition on the Weddell Sea side of the continent, 290 miles (467 km.) from the expedition main base of Shackleton. “Southice” was situated at lat. 81° 56′ S., long. 29° W., at a height of 1350 metres. It was built in February 1957, the materials being flown in from Shackleton by the expedition’s Otter aircraft. The site was occupied from 4 February until 25 December 1957. Meteorological observations were made every six hours, micro-meteorological records were kept for a few days in each month (recording profiles of wind speed, air temperature, snow temperature, snow accumulation and snow drift characteristics) and an investigation was made on the firn profile, to 45 m. depth, including measurements of temperature, density, banding, texture and crystallography.
Method of Investigation in Firn
To provide access to the deeper levels of firn, a pit was dug with spade and snow-saw, to a depth of 14 m., the excavated material being raised to the surface by block and tackle. From the foot of this pit, a S.I.P.R.E. coring drill was used to sample a further 31 m., thereby providing a total profile of 45 m. Core recovery was almost complete.
From the surface to 16 m. deep a series of temperature profiles was measured by resistance thermometers in two independent bore holes made with the S.I.P.R.E. drill. Temperatures were measured in the deep hole with waxed spirit thermometers, lowered to the bottom of the freshly drilled hole as it progressed, and finally by resistance thermometers. Temperatures in the freshly dug pit walls were also measured with waxed spirit thermometers for com-parison.
Density was measured in detail in the top 10 m. of the pit, by weighing measured rectangular blocks cut from individual layers in the firn. These were supplemented by measurements in a second pit and two bore holes round the station. Below this depth, sawn blocks from the pit, and measured lengths of core from the bore-hole, were weighed.
Granularity of the firn was estimated in the hand specimen, with reference to “type” samples having measured grain sizes at 0.1mm. intervals between 0.5 and 1.5mm. mean diameter. The absolute accuracy of this method is questionable but it is rapid and accurate enough for relative comparisons of granularity in a profile beneath the surface.
Texture in the firn was observed macroscopically and also in thin section with a micro-scope. Thin sections were prepared mounted on glass slides and ground on emery paper to approximately 0.5 mm. thickness. For thin sections, friable firn was first soaked in diethyl phthalate; after this had frozen and the section had been ground, this cement was dissolved with tetralin.
Crystal size and orientation were measured in thin sections on a Cooke, Troughton and Simms’ polarizing microscope with a universal stage. This apparatus had been specially lubricated for work under cold conditions and behaved admirably in a temperature of −30° C. The universal stage was used without hemispheres, and tilts for the orientation of c axes, either vertically or horizontally, were corrected for refraction from tables provided by Dr. G. P. Rigsby (S.I.P.R.E.). Crystal orientations were plotted on a Schmidt equal area net and these diagrams were then contoured. All the microscope work was done in a snow laboratory below the surface.
Temperature
The temperatures recorded using spirit thermometers are shown in Fig. 1 with a temperature profile as recorded by resistance thermometers. The disagreement at depth is not great and is probably due to heat conduction along the cable to the resistance thermometers and/or to error in the spirit thermometers since these were made one month before the expedition saikd and are only now being calibrated.

Fig. 1 and 2 Firn temperature profiles at “Southice”
The alternation of winter and summer temperatures at the surface may be expected to produce a temperature profile in the form of a harmonic wave successively damped until the profile becomes a straight line at the mean annual temperature. Using observed temperature value, from the first 15 m. depth an attenuated sine wave was calculated but found to be very different from the observed profile. The damping is so severe that an exponential curve of the form
(where T = temperature at depth d) fitted the profile as shown in Fig. 2. The mean annual temperature is approximately −31 ° C.
Density
The mean density is shown against depth in Fig. 3. The main feature of interest is the more rapid increase in density between 5 and 8 m., which is believed to be due to the collapse of some of less dense layers at this depth. In Fig. 4, the exponential relationship between density and depth for the region below 10 m. is shown by plotting log

Fig. 3. Mean density curve

Fig. 4. Exponential relation of density and depth below 10 m. at “Southice”

Fig .5
Accumulation
Detailed density measurements in conjunction with granularity measurements indicate that annual layering at “Southice” is recognizable, but with difficulty. The thickness of the layers indicates a mean accumulation at “Southice” between 1930 and 1956 of approximately 10 cm. water equivalent, though the accumulation in recent years was rather less than this. The amount accumulated over 8 months at 66 stakes was 4 cm. water equivalent, most of this in July and October.
Granularity
(Fig. 6) Measurements show an increase in the mean grain size of firn from 0.6 mm. at surface to 1.05 mm. diameter at 10 m. Below this depth grain size down to 10 m. is in contrast with granularity measured by Schytt Reference Schytt 1 (p. 49) in the Maudheim ice shelf. At “Maudheim” there was found to be no increase.

Fig .6
Texture and Crystal Structure
Melting never occurs at “Southice”, as indicated by the complete absence of ice layers formed in this way. Metamorphism of the snow and firn near the surface, by evaporation and sublimation during the changing seasons of each year produces highly varied density and granularity in the firn; at or near the surface wind crusts are formed, and depth-hoar layers arise beneath it. Much of the firn has a prominent vertical structure, due to the elongation of many grains in this direction, parallel to the temperature gradient, but investigations show that this particular structure is not accompanied by any preferred orientation of the actual snow crystals which go to make up each grain of firn.
The texture of the snow crystals is simple at all depths. It is purely a growth texture and in thin sections may be described as polygonal. Each crystal tends to have 5 to 7 flat faces bounding it against its neighbours; these faces have no relation to the orientation of the crystal.
Fabric analyses made of normal firn (approximately 200 crystals were measured in each specimen) show there is almost no preferred orientation of crystals. On the contoured diagrams, the highest maxima found in shallow material have only 6 per cent per unit area. These maxima occur either vertically or horizontally and this weak orientation is believed to arise from the shape of the snow particles which accumulate on the surface. With depth no definite evolution of the fabric is evident, but there are indications that the vertical orientation strengthens slightly.
The only types of firn which provide strong crystal orientations are depth-hoar layers and wind crusts. Both of these types have a strong vertical orientation, resulting from crystal growth with c-axes parallel to the temperature gradient. In Fig. 7 typical fabric analyses for 4 types of firn are given.

Fig. 7. Petrofabric analyses of firn at “Southice”. N is true north. Equal area projection of lower hemisphere
Crystal Size
Crystal size is expressed here as cross section area, the mean of 50 to 100 crystal areas calculated from measured length and breadth.
Crystal size is approximately 0.01 sq. mm. at the surface. In the first centimetre it increases extremely rapidly to approximately 0.08 sq. mm. Below this depth, the relationship between crystal size and depth is a liner one, as indicated on Fig. 8. Even for three broadly defined types of firn, the linear relationship applies reasonably well. For comparison the crystal sizes measured by Schytt Reference Schytt 1 (p. 129) at Maudheim are included on the diagram; it is remarkable that the results of this study on shelf ice and the present one, done on inland ice having quite different rates and temperatures of accumulation, should coincide in the close way in which they do. Is this a coincidence, or does it emphasize a fundamental relationship between crystal size and depth, independent of temperature and the rate of accumulation which determines the age of the crystal?

Fig .8
Snow and Drift
A new type of snow gauge was tried, but the amount collected varied with the height of the gauge which, like all other gauges, collected drift snow as well as precipitation. Therefore a study was made of drifting snow. Particles collected on plastic smeared slides were examined under a microscope, the length and breadth measured and histograms drawn of the frequency of different sizes (areas) at heights up to 6 m. Fig. 9 shows the frequency distribution of all particles measured. The median is approximately 0.004 mm.and the range is approximately from 0.02 to 6.0 mm.2 × 10−2. The amount of drift present at a specific height was measured in a drift gauge designed to collect particles through the vertical aperture of a streamlined can which had a decelerator chamber and forced-air exit such that there was a minimum of interference with the wind through the gauge. The weight of drift varies with height according to a power law
where
-
D = drift amount in gm. cm.−2 hr.−1 at height H in cm.
-
S = constant for the drift storm measured and equals the amount of drift snow on the surface, which is directly proportional to the amount of snow fall and inversely proportional to the wind run since that snowfall.
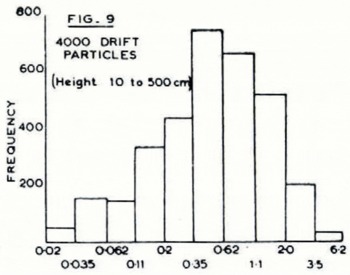
Fig. 9 Particle size mm.2 × 100
Because of the dependence of drift upon the snow fall and wind run, the amount of drift varies with wind direction but average conditions show that drift amount varies as the fourth power of wind speed.
Accumulation, Wind and Temperature Across the Ice Sheet
The holes drilled for seismic shots across the ice sheet gave snow cores up to 11 m. deep which were examined for texture. Some cores were weighed and grain sizes estimated. Rammsonde soundings were made to 2 or 4 m. deep to complete these stratification profiles for interpolation of annual accumulation. On a first analysis, snow accumulation across the plateau ranges from 5 to 20 cm. of water equivalent.
Wind direction, interpolated from sastrugi patterns is north-east to south-east from the Weddell Sea to near the Pole, when it becomes more southerly. Towards the Ross Sea a south-westerly component becomes dominant.
Temperatures plotted from overnight measurements in the bore holes indicate mean annual temperatures which decrease from −31° C. at “Southice” to −53° C. at the highest part of the journey across the plateau. These figures may be slightly modified when the spirit thermometers used have been calibrated.
Heat Balance
Radiation measurements were made by the meteorologist, Hannes La Grange, using a flux plate. From these and wind speed and temperature profiles recorded in the air above the surface (and in the snow immediately below the surface) a heat balance is being calculated. Up to 2 m. height the wind and air temperature profiles show that these elements vary as the logarithm of the height, almost regardless of stability. The short period showing a net flux of incoming heat by radiation and eddy conductivity does not, on a first analysis, seem to balance the heat lost from the snow surface. Other mechanisms (e.g. condensation) must complete the heat balance.
Acknowledgements
Thanks are extended to glaciologists of this country and to M. de Quervain and S. Steinemann of Switzerland. We are grateful for the assistance of members of the expedition, especially to K. V. Blaicklock who wintered with us at “Southice” and to the Committee and Leader who have given permission to publish this paper. Full results will be published in a series of Expedition reports.
MS. received 24 November 1958


