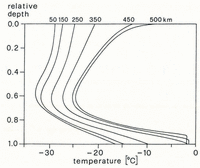
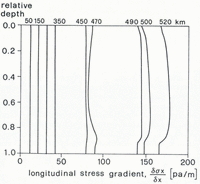
List of Symbols
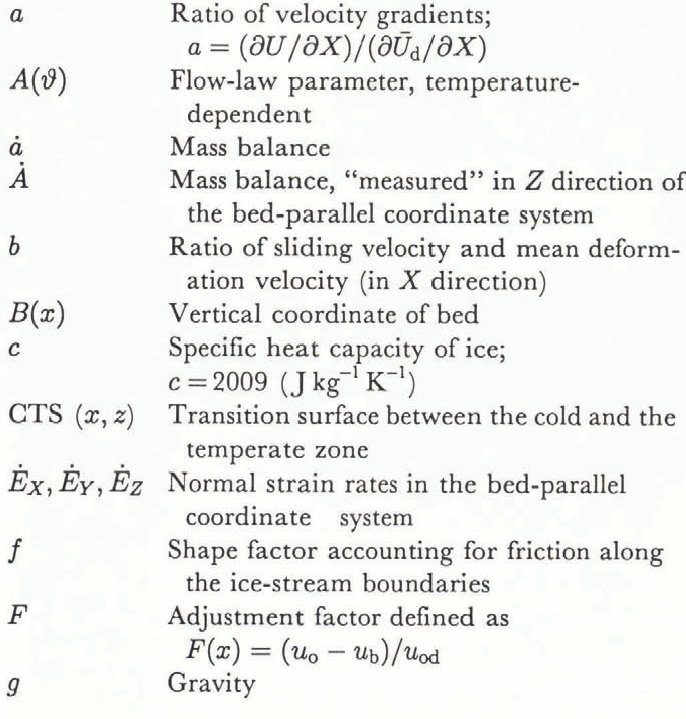
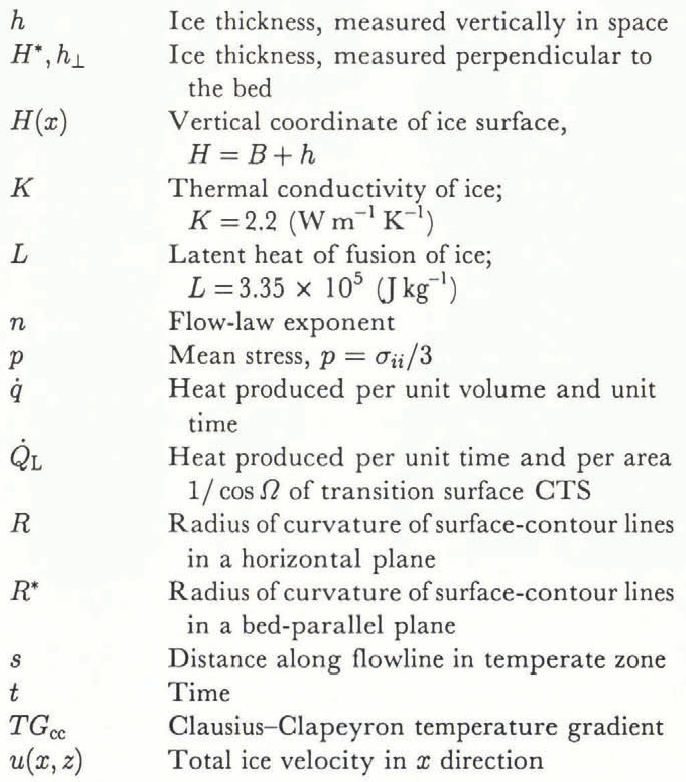
1. Introduction
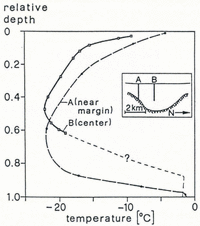
Many polar ice steams flow at high velocities. Jakobshavns Isbræ in West Greenland is the fastest ice stream known. The dynamics of this glacier have recently been investigated in detail (Reference Echelmeyer and HarrisonEchelmeyer and Harrison, 1990; Reference Echelmeyer, Clarke and HarrisonEchelmeyer and others, 1991, Reference Echelmeyer, Harrison, Clarke and Benson1992). Unlike the ice streams of the Siple Coast, Antarctica, Jakobshavns Isbræ flows through a deeply eroded bedrock trough, which extends about 80 km inland (Reference Clarke and EchelmeyerClarke and Echelmeyer, 1989). A possible mechanism contributing to the fast flow of this, and similar ice streams, is related to the three-dimensional ice deformation which takes place when the ice flows into and along this sub-surface channel. A hint on an unusual ice deformation comes from the unexpected, seemingly distorted shape of temperature-depth profiles measured in the ice stream (Fig. 1). The shape of these temperature profiles, measured at the center line and near the ice-stream margins, differs greatly. The temperature minimum of the central profile is located at a surprisingly shallow depth. In order to investigate how this temperature distribution may have developed, we model two-dimensional flow fields and temperature distributions.
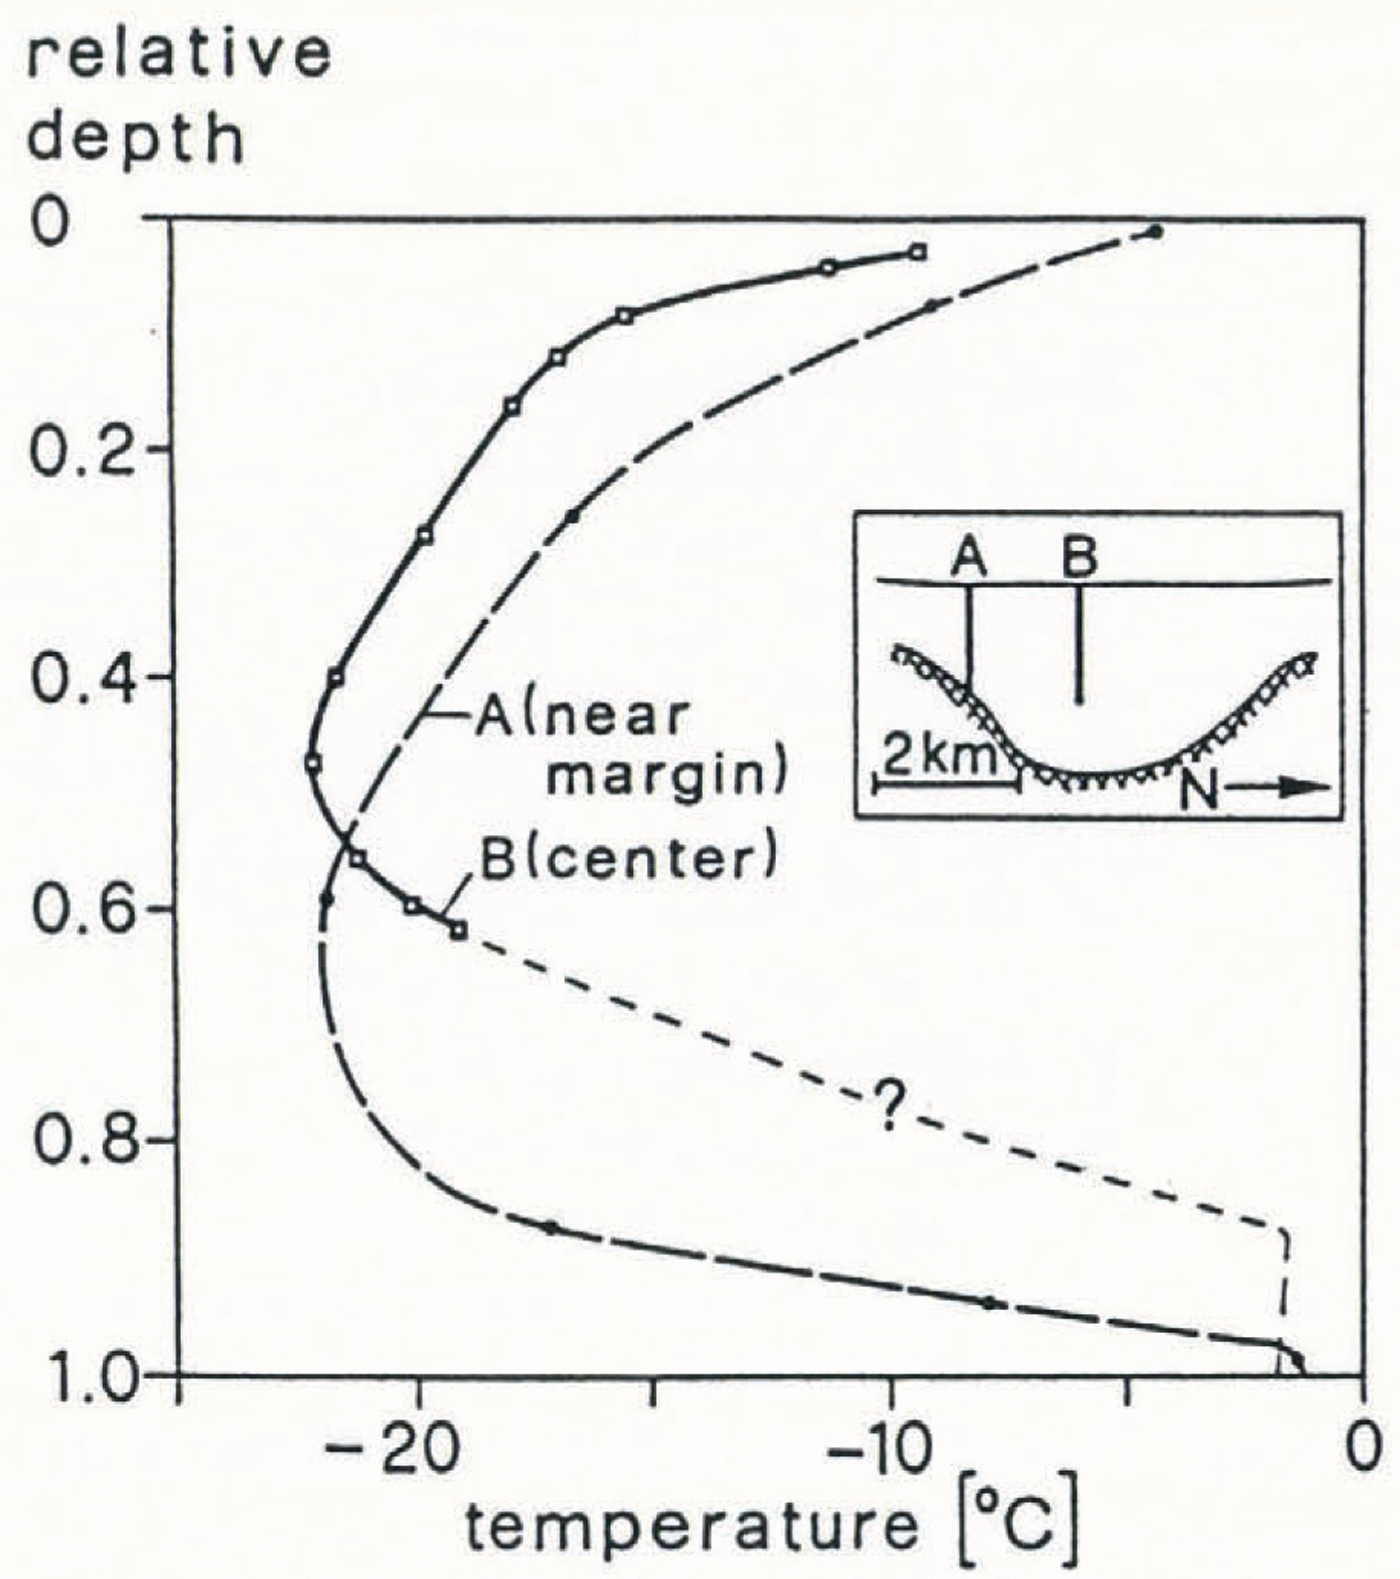
Fig. 1. Englacial temperatures measured in Jakobshavns Isbræ, 50 km upstream of the calving front (from Reference Iken, Echelmeyer, Harrison and FunkIken and others, 1993). A. Near the ice margin; B. At the center line; total depth 2500 m.
Our model accounts for the actual topographic, dynamic and climatic conditions along the central flowline of the Jakobshavn Isbræ drainage basin. However, modeling does not account for the three-dimensional ice flow which occurs in the sub-surface bedrock channel of the ice stream. Therefore, the modeled temperature profiles remain “undistorted” and are expected to differ in shape from the actual profiles. By comparing modeled and measured profiles, we obtain a rough estimate of the depth distribution of vertical straining taking place in the actual ice stream. We suspect that this type of vertical straining plays a role as a mechanism of fast flow of this ice stream.
Another important objective of this study concerns the possible existence of a temperate basal layer. This is suggested by extrapolation of the measured central temperature profile B (Fig. 1). For this reason, based on theoretical previous works (Reference HutterHutter, 1982; Reference Hutter, Blatter and FunkHutter and others, 1988), we have designed a model which allows for the formation of such a layer and calculates its thickness precisely.
This paper is organized as follows. In sections 2 and 3 two complementary numerical models are described: a model for the dynamics and a model for the temperature field. The first of these models calculates the internal distribution of velocities and deformation rates. It is based on Glen’s flow law and on prescribed velocities along the surface and base of the ice which, in case of Jakobshavns Isbræ, are more or less known. The temperature field, influencing the rate factor in Glen’s flow law, is obtained with the temperature model. This model solves the two-dimensional heat-transfer equation for successive vertical columns using a finite-difference scheme (Reference Hutter, Yakowitz and SzidarovskyHutter and others, 1986), subject to prescribed temperatures along the surface and a geothermal heat flux (or pressure-melting point temperature) along the base. We first calculate a steady-state situation with present climatic and topographic conditions as input. Since neither the flow field nor the temperature field are known at the beginning, an iterative procedure is used by running both, the dynamic and the temperature models, alternating until reaching convergence of the results. Sections 4 and 5 deal with the input to the models. In section 6, various results of modeling are presented and in section 7 the modeled temperature-depth profiles are compared to the measured ones, and conclusions are drawn on the amount of vertical stretching of the basal ice.
2. Dynamic Model
The purpose of this model is to provide a reasonable distribution of velocities and related quantities with depth based on measured surface velocities and estimated sliding velocities. It formulates two-dimensional flow in a sheet but allows for convergence of flow to ensure continuity. An iterative procedure is applied, alternating with the temperature model described in section 3, because the velocity field and temperature distribution are interdependent. The following assumptions are made:
-
1. The shear stress, τxz , varies linearly with depth (x is the horizontal coordinate in the downstream direction, z is the vertical coordinate, positive upward; Fig. 2a).
-
2. Surface and bed slopes are small. Moreover,
, where β is the bed slope and and
and are the basal shear stress and the basal longitudinal deviatoric stress, respectively, in a coordinate system oriented parallel to the bed.
-
3. The transverse shear stress, τxy , referring to shearing between flowlines, is negligible. The strain-rate tensor,
which is considered in the present model, is (In case of the central flowline of the stream, the friction along the boundaries is, however, accounted for by adjusting the basal shear stress with a shape factor.)
-
4. The transverse strain which develops while the ice flows a unit distance downstream is independent of depth or, equivalently, the azimuth of flow does not vary with depth.
These conditions characterize the type of flow we are modeling: assumptions 1 and 4 imply that a strain change over unit distance downstream is approximately independent of depth. In other words, any two surface-parallel layers of equal thickness, located at different depths, expand by the same amount while the ice is moving a unit distance downstream. This characterization applies to an ice sheet which has nearly parallel top and bottom surfaces and which does not slide. In contrast, “extending” or “compressive” flow, as analyzed by Reference NyeNye (1957), refers to a situation where the sliding velocity is not zero and increases linearly with distance downstream. In that flow, the vertical strain rate, not the vertical strain developing over unit distance downstream, is independent of depth. In Appendix B we will discuss in which sense the type of flow described above is modified when sliding is allowed for. Here, we will return to the assumptions and subsequently develop the equations of the model.
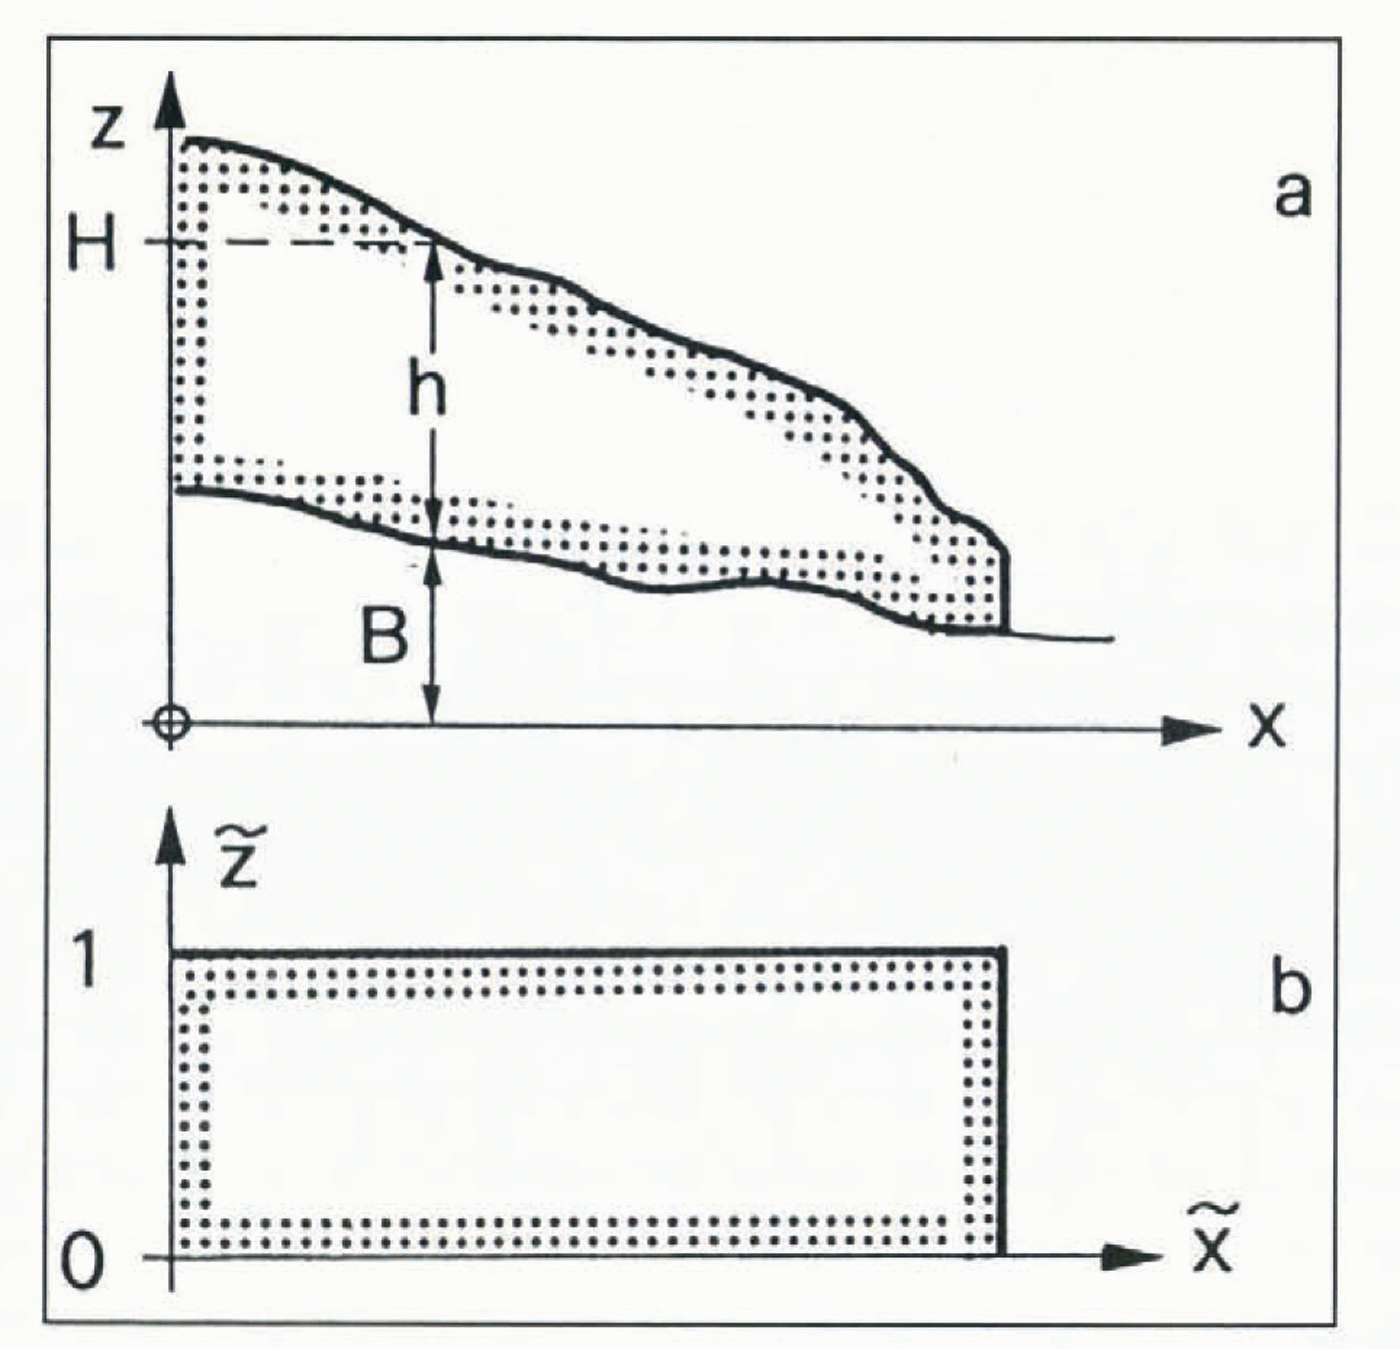
Fig. 2. a. Sketch of a longitudinal section of ice sheet or glacier with horizontal coordinate axis × and vertical axis z. b. Transformed longitudinal section.
Assumption 1 is valid when the longitudinal stress gradient,

with respect to z under assumption 3 results in the stated linear relation between τxz and z. Assumption 1 holds only approximately in Jakobshavns Isbræ; the deviations are examined in Appendix A.
Assumption 2 allows a simple calculation of the basal shear stress: if slopes are small (tan β ≈ β) the bed-parallel basal shear stress,

where α is the surface slope,

This equation allows for the effect of a longitudinal stress gradient on the basal shear stress.
The horizontal shear stress, τxz , is related to the bed-parallel shear stress,

At the base, τ xz(B) is denoted τb and, by assumption 2, reduces to

In general, assumption 2 holds in ice sheets but also over most of the length of the central flowline of Jakobshavns Isbræ. Exceptions are the confluence of tributaries, about 80 km inland from the calving front and a zone near the line where the ice begins floating. There, both the bed slope β and the longitudinal stress gradient are significant.
Assumption 3 applies to an ice sheet or at the center line of the ice stream.
Assumption 4 is, in general, valid for flow in an ice sheet. It does not hold for an ice stream where the flow of the basal ice is influenced by the geometry of a sub-surface channel. Therefore, we expect that failure of this assumption will lead to certain differences between modeled and actual temperature distribution in the ice stream.
2.1. Distribution of horizontal velocity with depth
The procedures in this and the subsequent paragraph are similar to those developed by Reference ReehReeh (1988). In contrast to that study, the present model does not exclude basal sliding. From assumption 1, the shear stress τxz can be written:

where B is the bed coordinate and h is the local ice thickness measured vertically.
In accordance with Equations (3) and (5), and making allowance for friction along the ice-stream boundaries by means of a shape factor f, τb can be written:

or, since β is small,

The shear strain rate έxz is related to τxz by Glen’s flow law:

In this equation ∂w d/∂x will be neglected, n is the flow-law exponent and

Neither the effective shear stress, τeff, nor the temperature-dependent rate factor,

The vertical velocity component w is initially:

where w o is the measured vertical velocity at the surface and w b is the vertical component of the estimated sliding velocity. With this very rough flow field, a first temperature field is calculated (according to section 3). It is used to determine the rate factor as a function of temperature following Reference Smith and MorlandSmith and Morland (1981, equation 21, case a). In the next iteration steps, the horizontal and vertical velocity components are calculated with the temperature-dependent rate factor as follows: the horizontal surface velocity due to deformation, Uoá, is calculated by integrating Equation (9) over the ice thickness h. The thus calculated surface velocity does in general not match the deformational part of the measured surface velocity, u0 . Therefore, the rate factor

u b being the horizontal component of the sliding velocity. Equation (9) is integrated again using the new rate factor, equal to
2.2. Distribution of vertical velocity with depth
Surface and bed topography of the ice sheet are variable; therefore, it is convenient to introduce a body-fitted coordinate system by defining the following transformation:

We begin by expressing the diagonal components of the strain-rate tensor in terms of

where

with

Inserting Equation (16b) into Equation (16a) and Equation (16a) into Equation (15), we get:

The last term in Equation (17) accounts for a change in velocity with relative depth which occurs together with an increment of the horizontal coordinate x
Assumption 2 implies that the transverse strain έy , which develops while the ice flows from a position x to a position x + Δx, is independent of depth or, equivalently, that έy varies as the velocity u:

where R is the radius of curvature of the elevation contour lines which are perpendicular to the flowlines. The term 1/R is equivalent to

or, using Equation (17),

The radius of curvature, R, can be determined either from a contour map or by integrating the continuity Equation (19a) with respect to z:

or

where q(x) is the volume flux of ice:
u is the mean of the total velocity:
and u d is:

The first term on the righthand side of Equation (20b) is evaluated as:

The first term on the lefthand side of Equation (20b) is:

where ȧ is the net mass balance at the surface (mass loss is here defined positive). The second term is:

In Equation (22c) we have neglected basal melting. Inserting Equations (22a) through (22c) into Equation (20b) gives:

In the model runs, we set ∂H/∂t = 0 because insufficient is known about the changes of the ice-sheet geometry in the past. Solving Equation (23) for 1/R and inserting this expression into Equation (19b) we obtain:

Finally, the vertical velocity w is:

3. Temperature Model
The model calculates the two-dimensional temperature distribution in a longitudinal section of an ice sheet or a glacier. It allows for both cold and temperate zones which are treated separately. The transition surface, which separates a cold from a temperate zone will be referred to as CTS. The model has been developed using the concepts formulated by Reference HutterHutter (1982), Reference Hutter, Blatter and FunkHutter and others (1988) and Reference Blatter and KBlatter and Hutter (1991). The following assumptions are made:
-
1. Thermal diffusivity κ, thermal conductivity K (heat capacity c and density of the ice ρ) are assumed to be constant throughout the ice sheet.
-
2. We presume that when ice enters the temperate zone it has a negligible water content μ. We neglect moisture diffusion and assume that the water content increases gradually by deformational energy dissipation as the ice flows further downstream:
where s is the position along a flowline within the temperate zone and(26) is the internal heat generation per unit volume and unit time. It is given by:
 where(27)
 is the temperature-dependent rate factor, n is the flow-law exponent and
 the second invariant of the strain-rate tensor
 . Presumably, the water content approaches a maximum value asymptotically. The additional water supply and water produced by sliding at the base is supposed to drain away. We assume μ max = 1%, which is a value within the range of experimental results quoted by Reference Lliboutry and DuvalLliboutry and Duval (1985).
The field equation, which describes the temperature distribution

where ∇ is the two-dimensional operator, K is the thermal conductivity,
In the temperate zone, the ice is everywhere at the pressure-melting-point temperature which is given by the Clausius-Clapeyron equation for air-saturated water. The small temperature gradient corresponding to the pressure gradient, TG cc, is constant within the temperate ice.
If

Equation (29) is valid in the case where the CTS moves into the cold zone.
3.1. Boundary conditions
The boundary condition at the surface is a prescribed value of temperature ϑs . At the bottom, a temperature gradient ∂ϑ/∂v which corresponds to the geothermal heat flux is prescribed. This applies where the bottom temperature is below the pressure-melting point ϑm. Where the base is temperate, ϑm is prescribed and the temperature gradient is a result of the calculation. In this case, a part (or eventually all) of the geothermal heat flux is consumed for melting ice from the base. The larger the proportion of geothermal heat flux which causes melt from the base, the smaller is the proportion conducted upward into the ice. The basal temperature gradient decreases accordingly and eventually approaches the Clausius–Clapeyron gradient TG CC. Under this condition, a temperate layer of finite thickness can exist at the base and no geothermal heat can be conducted upward. In this case, two conditions have to be specified for the CTS. These two conditions are important for determining the CTS location:
The temperature at the CTS is, by definition, equal to the pressure-melting-point temperature ϑm.
With regard to the cold zone, the temperature gradient at the CTS, ∂ϑ/∂z, depends on the direction of the ice flux. The following two situations can appear:

-
1. The ice flux is directed from the cold zone into the temperate zone. In this case, the moisture content at the CTS is negligible (assumption 2). Thus, no phase change occurs and the temperature gradient at the CTS is equal to the Clausius-Clapeyron gradient:
-
2. The ice flux is directed from the temperate zone into the cold zone. In this case, water, which (after a sufficient transit time of the ice in the temperate zone) is present at the CTS, is transported into the cold zone. The corresponding latent heat of freezing, released per unit time and area 1/cos Ω is:

where L is the latent heat of freezing, pw is the density of water, Ξ is the upward flux of ice through an element of the CTS of size 1/cos Ω and Ω is the slope of the CTS. The ice velocity normal to the CTS and with respect to coordinates fixed in space is given by:
In one of the model runs, we consider a time-dependent situation where, starting from a steady state with ice-age conditions, a gradual warming is precribed during the following millennia. In that case, the CTS is not stationary but moves gradually upward and the total velocity of the ice relative to the CTS is:
where û and ŵ are the horizontal and vertical components, respectively, of the velocity


We assume, for simplicity, that the latent heat Q L is released at the CTS rather than distributed over a finite volume of cold ice. An equal quantity of heat has to be conducted away from the CTS into the cold zone, so that the temperature at the CTS remains unchanged (at the pressure-melting point ϑm). This is accomplished by adjusting the vertical temperature gradient, ∂ϑ/∂z(CTS), accordingly:

In this energy-balance formulation, we have neglected the small contribution of horizontal heat conduction into the cold zone. The three prescribed conditions (surface temperature, temperature and temperature gradient at the CTS) serve as boundary conditions for the solution of Equation (28) in the cold zone and determine the location of the CTS.
The above formulations imply that in case (2) there is a kink in the temperature profile at the CTS. In reality, however, the change of the temperature gradient at the CTS is more gradual because there also exists a small amount of water in the cold ice. This amount decreases with decreasing temperature and distance from the CTS. The water is located in the veins at the three-grain intersections (Reference Raymond and HarrisonRaymond and Harrison, 1975) (here the freezing-point depression is larger than that given by the Clausius-Clapeyron equation because of the difference in pressure in the ice and in the veins, which corresponds to the curvature of the ice/water interface). Disregarding this feature has, however, no effect on the simulations in the interior of the cold zone, away from the CTS.
3.2. Numerical integration
The model first solves the steady-state case of Equation (28) for given boundary conditions. Based on the study by Reference Hutter, Blatter and FunkHutter and others (1988), a finite-difference scheme has been developed to solve Equation (28). The discretization of Equation (28) for the finite-difference formulation has been performed in the

where j = 0 …m, m is the number of vertical grid intervals, h is the local glacier thickness, B is the glacier-bed z coordinate and Λ is a parameter (Λ > 0) which determines the degree of variation of the vertical grid size. We use a grid interval of 1 km in the horizontal direction and h/100 with Λ = 50 in the vertical direction. For more details see Reference Fabri, M and AFabri and others (1992).
Horizontal diffusion is omitted in the first step. This simplification allows the integration of Equation (28) to be performed for each vertical column separately with consequent saving in array size. We used an implicit scheme with centered differences in the vertical direction and upstream differences in the horizontal direction. First, the temperature distribution in the vertical column located at the center of the ice cap is calculated, where the horizontal advection is zero and thus Equation (28) is one-dimensional. Next, the temperature distribution in the adjacent downstream vertical column is calculated by taking into account the results of the previous upstream column for the horizontal advection between the two vertical columns considered. This procedure is then repeated for successive columns until the glacier snout is reached. Afterwards, the solution is improved by taking into account the horizontal diffusion with an explicit finite-difference procedure, starting with the solution without horizontal diffusion. The differences of the results with and without horizontal diffusion are very small, less than 0.1 K standard deviation for the steadystate solution for the examples discussed below, so that neglecting the horizontal diffusion for calculating temperature fields in glaciers or ice sheets is a good approximation.
If, during the calculations, the basal temperature is equal to the pressure-melting point and the basal temperature gradient is larger than the Clausius–Clapeyron gradient, a basal layer of temperate ice is assumed to exist. In this case, the location of the CTS is determined iteratively: in a preliminary procedure, we determine the location of the CTS under the condition that the temperature gradient at the CTS is equal to the Clausius-Clapeyron gradient (i.e. we neglect the effect of the possible transport of water through the CTS). The iteration is started with a provisonal position of the CTS at i = B + (h/2). The further step depends on the calculated value of temperature at the presumed location of the CTS; if this temperature is negative (smaller than ϑm), the new location of the CTS is chosen closer to the bed; if it is positive, the location of the CTS is moved upward. An interval-splitting technique is employed, where the new location is assigned to the midpoint between the previous location and the bed or the surface, respectively. This procedure is continued until the desired precision δz is obtained. The last-obtained z is the position of the CTS for the vertical column considered. For each column, 10–12 interval splitings were necessary to obtain a CTS position with a precision δz = 1 m. This procedure is repeated for each column. With the position thus obtained for the CTS, the temperature gradient ∂ϑ/∂z at the CTS is then calculated for each column involved using Equations (34a) and (35), and the position is recalculated as explained before. This procedure is repeated as long as necessary to obtain a convergent mean position of the CTS within a prescribed precision δz between the two iterations. In our cases, 3–4 iterations were necessary.
Based on the steady-state solution of Equation (28), a computation forward in time can be performed by varying the boundary conditions, surface temperature and geometry with time (in our case, we kept the geometry constant). We used the Crank-Nicolson numerical scheme (Reference FletcherFletcher, 1988) for the discretization of the time derivative. The boundary condition at the bed and the method of determining the CTS position is the same as in the steady-state case described before. However, in the case of a cold base, the temperature gradient is introduced below the bed, as explained by Reference RitzRitz (1987).
4. Input of Flow and Temperature Models
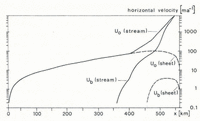
The input to the flow and temperature models is shown in Figures 3 and 4, and in Figure 7a and b.

Fig. 3. Prescribed values of horizontal velocity versus distance x from the center of the ice sheet. The velocity values along the ice stream are shown with a full line, those along a flowline in the adjacent sheet with a broken line. uo, surface velocity; ub, sliding velocity.

Fig. 4. a. Mass balance versus distance x. The full line represents the mass balance along a flowline through Jakobshavns Isbræ; the dotted line gives a lower bound. The dashed line refers to an area north of Jakobshavns Isbræ, included for comparison, b. Surface temperature versus distance x.

Fig. 7. Calculated isotherms, a. Ice stream; b. Ice sheet near ice stream. Shaded zones indicate temperate ice.
Surface topography is plotted in accordance with maps derived from satellite altimetry (Reference Bindschadler, Zwally, Major and BrennerBindschadler and others, 1989). The surface topography along the central flowline of the drainage basin and of the ice stream is shown in Figure 7a; that along a flowline about 10 km further south representing the “ice sheet” is shown in Figure 7b. In the coastal area, up to 150 km inland, more precise data from surveying and helicopter altimetry (Reference Echelmeyer, Clarke and HarrisonEchelmeyer and others, 1991) and from photogrammetric mapping (personal communication from T. Hughes) are available. These data are included in the graphs.
In the upper part of the drainage basin, bed topography (Fig. 7a and b) is assumed to be equal to that determined along the EGIG traverse (Reference HofmannHofmann, 1974). The EGIG traverse runs approximately along the northern boundary of the Jakobshavns Isbræ drainage basin. Airborne radar profiles cross the central flowline of the drainage basin at certain points and provide information on the depth at these locations. The main ice stream forms at the confluence of two tributaries; this confluence is located 80 km upstream from the terminus or, in the model, at x = 470 km (Fig. 7a). Seismic reflection studies (paper in preparation by T. Clarke and K. Echelmeyer) provide information on the depth of the main ice stream and locate the confluence. These seismic profiles also extend some distance into the ice sheet bordering the ice stream.
Certain features on aerial photographs (unpublished information from H. Brecher) and on satellite images suggest that several tributaries exist between x = 440 km and x = 470 km. With respect to these tributaries, we assume in the model that a channel incised into bedrock exists along the central flowline, downstream of x = 440 km (Fig. 7a).
In the upper part of the drainage basin, horizontal components of surface velocities (Fig. 3) were inferred from those measured along the EGIG line (Reference HofmannHofmann, 1974). These velocities were corrected for differences in ice thickness using:

with n = 3. u 0 is the surface velocity and h is the ice thickness. The index J refers to the central flowline of the Jakobshavns Isbræ drainage basin and E to the EGIG traverse. Correcting with n = 2 rather than 3 might be more appropriate in the light of considerations in section 5; however, in any case, these corrections are small. Along the ice stream, the surface velocity is known in detail (paper in preparation by K. Echelmeyer). For the zone bordering the ice stream, velocity data from repeated photogrammetry (personal communication from T. Hughes) were made available to us. The sliding velocity, also shown in Figure 3, is estimated very roughly, based on preliminary three-dimensional flow modeling at x = 500 km.
Mass balance is shown in Figure 4. In the upper part of the drainage basin, balance was taken to be equal to that measured at corresponding latitudes along the EGIG traverse. Near the coast, however, local variations in topography modify the mass balance significantly. According to measurements by Reference BenderBender (1984) and Reference Echelmeyer, Harrison, Clarke and BensonEchelmeyer and others (1992), the mass balance in the area of the ice stream is distinctly smaller (less precipitation) than at the EGIG line.
Near-surface ice temperatures (Fig. 4) were prescribed at locations along the upper part of the Jakobshavns Isbræ flowline using the results assembled by Reference OhmuraOhmura (1987). Along the ice stream, englacial temperatures to depths of 12 m have been measured by Reference Echelmeyer, Harrison, Clarke and BensonEchelmeyer and others (1992).
A geothermal heat flow, corresponding to a basal gradient of 0.02°C m−1 has been assumed.
The shape factor accounting for the friction along the ice-stream boundaries has been assumed to decrease from f = 0.8 at x = 470 km to f = 0.55 at x = 485 km. For larger x, the shape factor increases again up to f = 0.8 and remains at that level down to the terminus.
Some of the input data are not well-known; estimated tolerances are given in Table 1. To a large extent, the input for the “ice-stream” model is based on measurements. In contrast, the input for the model of the adjacent “sheet” is mainly estimated. The latter model is not intended to simulate precisely the actual conditions but to demonstrate specific differences between the temperature distributions in the ice stream and in the ice sheet beside it. The effect of changes in input on the calculated temperature distribution has been investigated in a sensitivity study (Reference Fabri, M and AFabri and others, 1992). Results of that study are included in section 6 and Table 2.
Table 1. Assumed tolerances of input

Table 2. Changes of modeled englacial temperatures in the ice stream at x — 500 km caused by changes of input parameters. Assembled from Reference Fabri, M and AFabri and others (1992)

5. Flow-Law Parameters
Initially, the model has been run with flow-law parameters n= 3 and

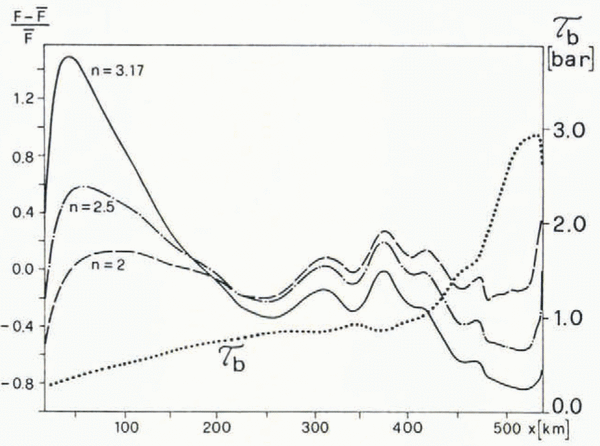
Fig. 5. Basal shear stress, τb, and normalized variations of adjustment factor F(x) versus distance x. The basal shear stress, calculated from Equation (6), is shown with a dotted line. Normalized variations of adjustment factors referring to different values of the flow-law exponent n: full line: n = 3.17, Ḟ = 4.96; dashed-dotted line: n = 2.5, Ḟ = 3.67; broken line: n = 2, F̄ = 3.07. F̄ is the mean value of the adjustment factor, taken along x.
Variations of F(x) expressed as (F(x) – F )/ F are shown in Figure 5. F is the mean value of F(x), taken along the flowline between x = 10 km and x = 530 km. For n = 2, these variations are relatively small. We have therefore adopted n = 2 for the present model.
A value of n, smaller than 3, has been suggested for polar ice by Reference Doake and WolffDoake and Wolff (1985). Our result seems to be consistent with their suggestion. On the other hand, stress deviator and strain history of the ice vary considerably with depth and also with distance along the flowline. These different conditions cause changes of fabrics and of deformation properties of the ice, so that one cannot expect a single value of η to apply for the whole ice sheet (Reference AlleyAlley, 1992). Thus, a variation of the deformation properties of the ice with distance x downstream may well occur. If n is kept constant, it would be manifest in a variation of F with x.
The choice of the (overall) value of n has no significant effect on the calculated temperature field.
6. Results of Temperature Modeling
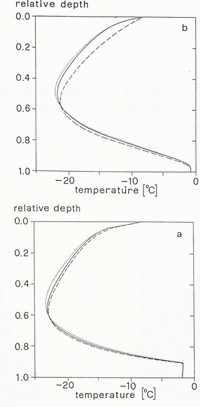
Figures 6–9 refer to a steady state. Figure 6 shows the flowlines in a longitudinal section along the center line of the ice stream. Figure 7a and b depicts the calculated temperature distribution in the same longitudinal section and in a section along a flowline through the ice sheet, south of the ice stream. The two sections are equal upstream of x = 430 km. The base becomes temperate at x = 225 km and the temperate basal layer exists downstream of x = 330 km. Where the bedrock channel of the ice stream forms, the temperate layer thickens considerably. Figure 8a and b shows plots of temperature versus relative depth, (h-(z-B))/h, for the ice stream and the ice sheet, respectively. At x = 500 km, the temper-ature profiles are distinctly different in the two models. The thickness of the temperate layer in the ice stream amounts to 9% of the total thickness, 2500 m, and in the sheet to only 3% of 1000 m. On the other hand, the minimum temperature is higher (warmer) in the ice sheet by 1.3°C. The relative depth of the temperature minimum is 0.47, whereas in the ice stream it is 0.55. There are obvious reasons for these differences:
The deformational energy dissipation which is equivalent to the loss of potential energy (or drop in altitude) is much larger in the ice stream than in the ice sheet. The corresponding “heat sources” are concentrated near the base where they cause the formation of the temperate layer.
The velocity of the ice is considerably larger in the ice stream than in the ice sheet. Hence, there is less time for warming up by conductive heating in the ice stream and the cold core of the ice remains colder.
The equilibrium line is located near x = 485 km. In the ablation zone, ice flow becomes more upward-directed. The corresponding upward displacement of the ice which occurs between x = 485 km and x = 500 km is larger in the ice sheet because of the longer transit time; this explains the smaller relative depth of the temperature minimum at x = 500 km in the ice sheet compared to the ice stream. The difference in response to changes of mass balance in the ice stream and ice sheet is further illustrated by Figure 9a and b.
The curvature of the temperature profiles just below the location of the temperature minimum is larger than above it. The corresponding difference in conductive heating tends to “shift” the temperature minimum upward. In the ice sheet, this process is more effective because of the longer transit time.
The relative depth of the temperature minimum is further influenced by the effect of basal sliding on the distribution of vertical strain rate, as discussed in Appendix B. In the zone where sliding is still small compared to deformational ice flow but where the downstream gradient of the sliding velocity is large, the basal ice tends to expand less in the vertical direction than the ice near the surface. Under this condition, the relative depth of the temperature minimum increases. This effect may have contributed to the relatively large depth of the temperature minimum in the ice stream downstream of x = 360 km (Figure 8a compared to Figure 8b). Figure 9a and b illustrates the strong influence of the changes in mass balance, indicated in Figure 4. The broken line refers to an increase in mass balance (more precipitation), which becomes significant downstream of x = 480 km. Between x = 480 km and x = 500 km, the transit time in the ice sheet amounts to about 200 years compared to 25 years in the ice stream. Therefore (and because of the smaller total ice depth of the ice sheet in this reach), this change in mass balance is much more effective in the ice sheet (Fig. 9b).

Fig. 6. Longitudinal section along the center line of an ice stream with flowlines. Numbers shown on the flowlines indicate total travel time of an “ice particle” along a flowline. Heavy triangles mark the distances traveled during 1000years. Shaded zones indicate temperate ice.

Fig. 8. Calculated temperature–depth profiles at various locations × along the flowline. a. Ice stream; b. Ice sheet.

Fig. 9. Calculated temperature–depth profiles at × = 500 km for three different input values of mass balance, a. Ice stream; b. Ice sheet. The different mass-balance distributions are shown in Figure 4.
Uncertainties in other input parameters are less influential; this was shown in a sensitivity study (Reference Fabri, M and AFabri and others, 1992). Some results of that study are summarized in Table 2. In general, the changes of input parameters indicated in this table refer to the full length of the flowline (i.e. the changes are applied at all x). Exceptions are, of course, the sliding velocity which occurs only near the ice-sheet margin, and the shape factor which accounts for friction along the ice-stream boundaries. In contrast to the assumption in the sensitivity study, the actual deviations from the prescribed input vary along the flowline and therefore have a smaller effect on the calculated temperature field than that indicated in Table 2. We believe that the actual deviations vary within the tolerances shown in Table 1.
In the calculations described so far, all input conditions have been kept constant in time. Actually, however, considerable variations of surface temperature have occurred in the past. In order to estimate the effect of such temperature variations in time, the following scenario has been modeled. Starting from a steady state, resembling “ice-age conditions” (−10°C colder surface temperatures) at 10 000 years BP, the surface temperature has been increased gradually by 8°C during 200 years and then by 2°C during 800 years until the present. All other input parameters are the same as in the steady-state model. The resulting englacial temperature distribution is depicted in Figure 10. The temperature profile at × = 500 km is not very different from that obtained with constant surface temperatures (Fig. 8a): the temperate basal layer is slightly thinner (by 35 m), the minimum temperature is 2°C colder and is located at a somewhat greater depth (0.61 of total depth). Moreover, the assumed change of temperature with time is probably too gradual, so that the calculated temperature distribution represents a lower bound in this case. Thus, assuming a steady state rather than time-dependent surface temperatures does not introduce large errors into the results at x = 500 km.

Fig. 10. Temperature–depth profiles at various distances × along the central flowline of the ice stream for a time-dependent input of surface temperature, starting from ice-age conditions.
Another test has been made concerning the smaller viscosity of “Wisconsin” ice. Prescribing for the viscosity of ice, older than 10 000 years (located along the base), an enhancement factor of 3 (e.g. Reference Dahl-JensenDahl-Jensen, 1985) had no noticeable effect on the temperature distribution at x = 500 km. This was to be expected, because the effect of this change on the velocity–depth distribution is similar to that of an increase in the flow-law exponent. (The latter change also had no significant effect on the temperature distribution.)
7. Comparison with Measured Temperature Profiles
Details of measurements of englacial temperatures have been described by Reference Iken, Echelmeyer, Harrison and FunkIken and others (1993). In Figure 11, measured and modeled temperature profiles are shown together. We start with comparing the profiles located at the center line of the ice stream (Fig. 11a). The general agreement is good, except for the following differences:
The measured minimum temperature is 0.8°C warmer than the modeled one.
The measured minimum temperature is located at a relative depth of 0.48, whereas the modeled minimum is located at 0.55 of the total ice depth.
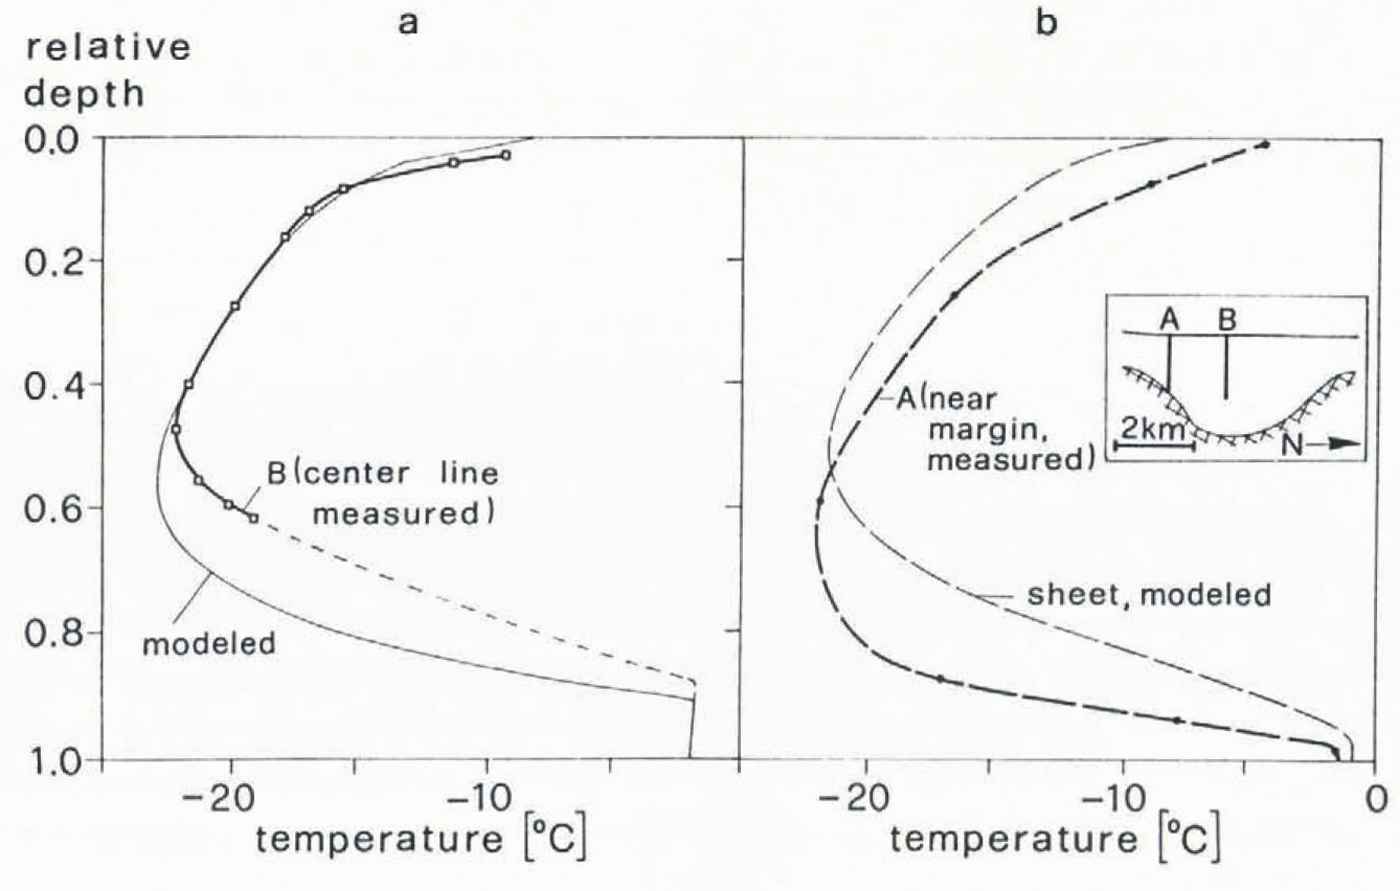
Fig. 11. Measured and modeled temperature profiles at × = 500 km. a. Temperature profiles at the center line of the ice stream (heavy line: measured profile; thin line: modeled profile). The dashed line is an extrapolation of the measured temperature profile, based on results of modeling (section 7). b. Temperature profile measured near the margin, at site A (heavy line) and modeled profile, referring to a location in the adjacent ice sheet (thin line). The locations of boreholes A and B ma cross-section of the ice stream, where ice temperatures were measured, are indicated in the inserted box.
The first of these differences is within the range corresponding to uncertainties of the model input. (For instance, a reduction of prescribed surface velocities by 8% and an increase of surface temperature by 0.5°C would produce agreement of the modeled minimum temperature with the measured one.)
Possible reasons for the large difference in relative depth of the temperature minima in the model and reality are:
-
1. Inaccurate input
The calculated temperature profiles are quite sensitive to changes in prescribed mass balance (see Figs 4 and Figs 9; Table 2). However, it is unlikely that the actual mass balance deviates from that prescribed by more than 0.1 ma−1, except perhaps locally. Other input parameters are less influential than mass balance. Therefore, we do not expect that the differences between measured and modeled temperature profiles can be attributed to inaccurate input. More likely it is an effect of three-dimensional flow.
-
2. Effects of three-dimensional flow at the confluence of tributaries
First, one may think of a non-uniform distribution of heat sources created by the convergence of flow at the confluence. However, the overall amount of heat production by convergent flow is small: a uniform reduction in width of the ice stream by 50%, together with a longitudinal extension, causes an overall warming by about 0.1°C due to strain heating. Variations of the respective straining with depth in the actual ice stream may cause certain deviations from the depth distribution of these heat sources. However, since the overall heating on this account is quite small, the deviations from uniform heating are likely to be insufficient to produce a substantial difference in the depth of the modeled and measured minima.
The second possibility is that the three-dimensional flow may produce an enhanced vertical stretching of the basal ice near the center line. This was proposed and discussed in Part I (Reference Iken, Echelmeyer, Harrison and FunkIken and others, 1993). As a consequence, the temperature minimum would be displaced upward, leading to a shape of the central temperature profile which is similar to that observed. Vice versa, the difference in relative depth of the measured and modeled temperature minima may be taken as indirect evidence of the outlined kinematic effect.
Accepting the existence of such a stretching mechanism at the center line of the ice stream, one may estimate, very roughly, the corresponding vertical stretching of the basal layer of temperate ice. This will be done in the following:
On the assumption that the extra vertical strain increases linearly from zero at a relative depth of 0.5 to max (∆ϵ z ) at the bed, the thickness of the lower half of the ice increases by a factor (1 + max(∆ϵ z )/2) and the upper half decreases by the corresponding amount, since the total ice depth is approximately independent of × in this part of the ice stream. Thereby, the temperature minimum is shifted upward from a relative depth of 0.55 (as calculated in the model) to a relative depth d m given by

According to the measurements, d m = 0.48. Inserting this value into Equation (37) yields:
Under these conditions, the temperate basal layer expands from 228 to 293 m, that is, to 12% of the total ice depth. The extrapolation of the central temperature profile (dotted line in Figure 11) is based on this result. (If the outlined analysis is carried out with the results of time-dependent modeling (Fig. 10) rather than with numerical values referring to a steady input, a similar result is obtained: in this case, the thickness of the temperate layer increases to 287 m, nearly the same value as 293 m, given above for the steady conditions.)
The minimum temperature, measured near the margin at site A, is essentially equal to that at the center line, which indicates that the ice arriving at the considered depth at this site has traveled for most of its path in the ice stream at high velocity. The high near-surface temperatures have been attributed to meltwater percolation into the numerous crevasses along the ice-stream boundaries and to enhanced strain heating (Part I). The shape of the observed temperature profile differs from both the ice-sheet and the ice-stream models. Interesting features are the large depth of the temperature minimum and the small thickness of the temperate basal layer. These features are probably effects of the three-dimensional flow. The thin temperate layer may in part also be an effect of remnants of ice-age conditions, which tend to reduce the thickness of the temperate layer by about 30 m as has been shown above.
8. Conclusions
Modeling of ice temperatures in Jakobshavns Isbræ and in the adjacent ice sheet has confirmed that a basal layer of temperate ice exists in a zone extending from near the ice-sheet margin to about 200 km inland. This temperate layer owes its existence to the large deformational heat production near the base.
If a steady state at the present climatic conditions is assumed, this layer has a thickness of about 230 m in the ice stream and of about 30 m in the adjacent ice sheet, at a distance of 50 km from the ice-sheet margin. A time-dependent model, which accounts for the lower surface temperatures 10 000 years ago, still predicts a temperate basal layer for the present, but of reduced thickness.
The modeled temperatures, in general, agree quite well with the measured englacial temperatures; however, the shape of the measured temperature–depth profiles appears to be distorted compared to the modeled profiles. We attribute this distortion to a characteristic ice deformation taking place in the ice stream, due to a convergent bedrock channel at depth (as discussed in Part I). The present study seems to support this hypothesis and suggests that this type of ice deformation is responsible for an increase in thickness of the temperate basal layer at the center line of the ice stream by about 30% (or by 65 m). This estimate is based on the difference in relative depth of the modeled and the measured temperature minimum at the center line of the ice stream, together with the assumption of a linear increase in the corresponding additional vertical strain in the ice stream with depth. As a consequence, the surface velocity increases by a comparable percentage. The outlined stretching mechanism, if real, therefore plays an important role in the fast flow of those ice streams which possess a convergent bedrock channel.
A direct verification of the outlined stretching mechanism is needed and presently under way by three-dimensional flow modeling of the ice stream.
Acknowledgements
We wish to thank R. Hindmarsh, D. MacAyeal, C. Raymond and an anonymous reviewer for their thorough reviews. Helpful comments were also given by H. Blatter, H. Gudmundsson and W. Harrison. We are grateful to W. Haeberli for reading the manuscript. We are indebted to K. Schram and S. à Marca for typing parts of it, and to B. Nedela for preparing the drawings.
The accuracy of references in the text and in this list is the responsibility of the authors, to whom queries should be addressed.
Appendix A
Variation of Longitudinal Stress Gradient ∂σx /∂x with Depth
The calculations of the ice flow (section 2) which are required for modeling englacial temperatures were based on the assumption that the shear stress, τxz , varies linearly with depth (assumption 1, section 2). This requires that the longitudinal stress gradient, ∂σx /∂x is independent of depth. As a consistency check, ∂σx /∂x (z) has been calculated numerically, based on the following equations:
where
where
If the slopes α and β vary only slowly with x, and if ρ is constant,

The stress deviators are related to the strain rates by the flow law:


Inserting Equations (A-2), (A-3) and (A-6) into Equation (A-1) and differentiating with respect to x gives, using Equation (A-4):


Fig. 12. Longitudinal stress gradient, ∂σx /∂x , versus relative depth.
Appendix B Typical Features of the Dynamic Model
In section 2 we have briefly described the type of flow we are modeling. Here we will consider the depth distribution of strain in more detail. We start with the case where sliding is absent and subsequently discuss how the strain distribution is modified if sliding is allowed for.
For simplicity, we will assume here that the traces of surface and bed in a vertical section along a flowline are parallel and are essentially straight lines. The X axis is parallel to the glacier surface and directed in the flow direction. The Z axis is oriented perpendicular to the bed, positive upward. The (curvilinear) Y axis follows the elevation contours of the glacier bed. In this coordinate system the velocities (U, V, W) and the strain rates

where U is the X component of the velocity and R* is the curvature of the contour lines in a plane tangent to the bed or surface.
To begin with, we make the additional assumption that the shape of the velocity-depth profile varies only slowly with X. This condition is satisfied if the glacier does not slide and if the flow-law parameters vary only slowly with X. The velocity U can then be expressed as a product of two factors (Reference ReehReeh, 1988), the first of which depends on X only and the second on Z:

U (X) is the depth-averaged velocity and Φ(Z) describes the variation of velocity with depth. The strain rate

Since both

In this equation, the value of the bracket does not depend on depth.
The increment of vertical strain, ΔΕZ , which develops while the ice moves an infinitesimal distance ΔX, is given by:

and, by Equation (B-4),

which means that ΔEz , and similarly ΔΕx and ΔΕy , are independent of depth. Moreover, the integral

is independent of depth. It can be shown that this feature is essentially preserved if a small change in ice thickness with distance X is permitted. This implies that, near the equilibrium line where the mass balance is negligible, a temperature profile, plotted versus dimensionless depth,
So far, we have excluded basal sliding. If sliding takes place, the total velocity can no longer be expressed by an equation analogous to Equation (B-2) and consequently

where U is the total velocity in the X direction and Ud and Ud are the deformational and the sliding velocity, respectively. R* can be evaluated by integrating the continuity equation, as was done in section 2, Equation (23). The result is:


The strain increment, developing over an infinitesimal displacement ∆X, is:

a quantity varying with depth. In the following we will investigate this variation. For transparentness, we define the following quantities:

Introducing these quantities in Equation (B-10), rearranging it, and making use of the relation:

we get:

Next, we inspect the variation of the square bracket with depth: at the surface, Ud attains the value Usd which is approximately related to U d by

Hence the surface-value of ∆EZ is:

At the depth where U d = U d and Z Z M:

At this depth, the strain rate is the same as without sliding (except that U in Equation (B-13) stands for the total velocity, averaged over depth). At the bed, U d = 0 and:

In the zone where the ice stream forms, the sliding velocity is still small but is rapidly increasing; here we have a > b and, in the case of Jakobshavns Isbræ,

near the surface, where Z > Z M Near the bed, for Z < Z M

At some place downstream, the sliding velocity has grown so that a = b and:

at any depth, like without sliding. When the sliding velocity is large but hardly increasing, a < b and the symbols > and < are reversed in the relations Equations (B-15) and Equations (B-16). However, near the coast,
If the ice surface and bed are not parallel, similar equations can be formulated; however, the parameters a and b vary slightly with depth. At a depth where U = U simple expression for Ε z similar to the case without sliding, is retained:


