1. Introduction
Natural and man-made biomass burning has a large impact on climate, since it is a major factor in controlling atmospheric particulate matter concentrations that influence global and local climate directly by absorbing and scattering solar and terrestrial radiation, and indirectly by modifying the mechanism of cloud formation (Reference Andreae and CrutzenAndreae and Crutzen, 1997; Reference SolomonSolomon and others, 2007). Therefore, to further understand past and present climate, there is an urgent need to quantitatively assess variations in the amount of fire-derived atmospheric particulate matter.
Ice cores provide environmental archives of atmospheric composition and, because of their annual resolution, contain information about climate and environmental events (Reference Wolff and PeelWolff and Peel, 1985; Reference XuXu and others, 2009a). Glaciers of the Tibetan Plateau hold the largest ice mass after the polar regions. Located at the intersection of the westerly winds and the south Asian monsoon air masses, they are strongly influenced by changes in air mass circulation, and thus have been intensively studied to reconstruct paleoclimate (Reference Morril, Overpeck and ColeMorril and others, 2003; Reference YaoYao and others, 2012). Related studies showed that black carbon (BC) content in ice cores from Tibetan glaciers is particularly high (up to 120 ng g−1) and has a significant impact on the observed rapid glacier retreat (Reference XuXu and others, 2009b). However, as BC is released in both anthropogenic fossil-fuel and burning biomass emissions, its occurrence in ice cores may not be directly used to reconstruct biomass burning events. A reliable proxy to quantify burning biomass emissions could be used to determine the impacts of anthropogenic fossil-fuel burning emissions on the glacier retreat of the Tibetan Plateau.
Levoglucosan and its isomers, mannosan and galactosan, are exclusively produced during cellulose and hemicellulose burning, with levoglucosan largely predominating (Reference SimoneitSimoneit and others, 1999). Due to its source-specific emission, ubiquity and environmental stability, levoglucosan is seen as the major molecular tracer for biomass burning activities (Reference Fraser and LakshmananFraser and Lakshmann, 2000; Reference Jordan, Seen and JacobsenJordan and others, 2006; Reference Kuo, Herbert and LouchouarnKuo and others, 2008).
Detection and quantification of levoglucosan and its isomers in dry samples are commonly performed by gas chromatographic (GC) separation with mass spectrometry (MS) (Reference Simoneit, Rogge and JafféSimoneit and others, 2000; Reference Leithead, Li, Hoff, Cheng and BrookLeithead and others, 2006; Reference ZhangZhang and others, 2008; Reference Fabbri, Torri, Simoneit, Marynowski, Rushdi and FabiaéskaFabbri and others, 2009). However, due to the high polarity of these compounds, GC-MS analyses involve prior derivatization of the hydroxyl groups with a silylation reagent (bis(trimethylsilyl)trifluoroacetamide) which requires very dry conditions. The presence of traces of water causes incomplete derivatization, leading to non-quantitative results and poor chromatography. Recently, liquid chromatography technology has been introduced to detect levoglucosan and other polar organic compounds in aerosol and soil (Reference Gao, Hegg, Hobbs, Kirchstetter, Magi and SadilekGao and others, 2003; Reference Dixon and BaltzellDixon and Baltzell, 2006; Reference EnglingEngling and others, 2006; Reference PuxbaumPuxbaum and others, 2007; Reference Lee, Engling, Lung and LeeLee and others, 2008; Reference GiannoniGiannoni and others, 2012; Reference PerronePerrone and others, 2012; Reference PiotPiot and others, 2012), offering an opportunity to analyze levoglucosan quickly and precisely from water samples. Reference Schkolnik, Falkovich, Rudich, Maenhaut and ArtaxoSchkolnik and others (2005) investigated levoglucosan in rainwater with a photodiode array (PDA) detector, and used ion-exclusion chromatography (IEC) with a high-performance liquid chromatography (HPLC) system to achieve levoglucosan separation. Reference Kawamura, Izawa, Mochida and ShiraiwaKawamura and others (2012) used a gas chromatograph with mass spectrometer to detect levoglucosan in ice cores from Gorshkov ice cap, Kamchatka, east Russia. However, as these former methods required concentration from a large volume of sample, they were not ideal for low-volume ice-core samples.
Reference Gambaro, Zangrando, Gabrielli, Barbante and CesconGambaro and others (2008) developed a method to quantify levoglucosan (pg mL−1) in Antarctic ice using HPLC/ electrospray ionization triple quadrupole mass spectrometry (ESI-MS/MS) with an injection volume of 100 mL. In addition, reversed phase (RP) chromatography with a C18 column has been shown to be suitable for trace analyses of levoglucosan in water samples using electrospray ionization /mass spectrometry (Reference Dye and YttriDye and Yttri, 2005; Reference Gambaro, Zangrando, Gabrielli, Barbante and CesconGambaro and others, 2008). This method was successfully employed to quantify levoglucosan in snow samples from Greenland (Reference KehrwaldKehrwald and others, 2012) and in contaminated aerosol samples from urbanized areas (Reference GiannoniGiannoni and others, 2012; Reference PerronePerrone and others, 2012). However, when applied to the Tibetan ice-core samples, this method had a very poor levoglucosan detection limit due to important chromatographic interferences. To quantify levoglucosan in ice cores from the Tibetan Plateau, we thus needed to develop a new HPLC/ ESI-MS method that efficiently separated levoglucosan from the other coeluting water-soluble organic compounds found in these samples. This new method should ensure good chromatographic separation and MS sensitivity, which are difficult to achieve simultaneously because the necessary eluent composition for good separation usually greatly suppressed ionization efficiency (Reference Wan and YuWan and Yu, 2007). In addition, the method should be easy, fast and applicable to a large number of samples, with minimal handling that may add additional contamination.
2. Experimental Methods
2.1. Chemicals and reagents
Levoglucosan (1,6-anhydro-β-d-glucopryanose) was purchased from Alfa Aesar GmbH & Co KG (Karlsruhe, Germany). Galactosan (1,6-anhydro-β-d-galactopyranose) and mannosan (1,6-anhydro-β-d-mannopyranose) were obtained from Merck (Darmstadt, Germany). HPLC gradient grade water, methanol (MeOH), acetonitrile (ACN), chloroform (CHCl3), formic acid (HCOOH), ammonium formate (NH4COOH) and sodium chloride (NaCl) were also purchased from Merck. The reagents used for preparing standards and analyses had a minimum purity of at least 98%. Ultrapure water with total organic compound (TOC) content within 1.06–2.67 ppb C was obtained from an Aquinity ultrapure water system (Membrapure, Bodenheim, Germany). As commercial water had a higher TOC content (∼10 ppb C) and thus showed higher background intensity, only ultrapure water was used for standard preparation and analyses.
Standard solutions of levoglucosan with different concentrations ranging from 40 to 800 ng mL−1 were diluted from a stock solution of 1000 ng mL−1. Additionally, 1000 ng mL−1 standard solutions of galactosan and mannosan in ultrapure water were prepared to identify the MS/MS spectrum characterizing the different isomers. All standard solutions were prepared in a thoroughly cleaned and well-ventilated fume-hood and stored at 4°C in sealed vials. Daily injections showed no degradation of the standards throughout the experimental period. As levoglucosan had been detected in relatively high concentrations in the laboratory atmosphere (up to 0.212 ng mL−1 in cleaned vials left open 24 hours (Reference Gambaro, Zangrando, Gabrielli, Barbante and CesconGambaro and others, 2008)), we were particularly careful about possible contamination derived from the laboratory itself. All glass flasks, beakers, pipettes and vials were cleaned with ultrapure water, combusted at 500°C for 5 hours and stored with precombusted aluminum foil covers.
2.2. Experimental set-up
The chromatographic separation was performed by a 1200 series high-performance liquid chromatography system (Agilent Technologies, Waldbronn, Germany), equipped with a vacuum degasser, a quaternary pump, an isocratic pump, an autosampler and a thermostated column compartment. Considering the low concentration of levoglucosan in ice-core samples, large-volume injection was employed to increase the sensitivity while maintaining accuracy and precision with minimal sample handling (Reference Hogenboom, Hofman, Kok, Niessen and BrinkmanHogenboom and others, 2000; Reference Chiaia, Banta-Green and FieldChiaia and others, 2008). For this purpose, a 1500 μL loop was installed and ten separate injections of 100 μL were collected into the loop and subsequently injected onto a Zorbax Eclipse extra dense bonding (XDB) C18 column (4.6 mm × 150 mm, 5 μm, Agilent, USA) maintained at 45°C. A mobile phase consisting of MeOH (solvent A) and ultrapure water (solvent B) was applied as a gradient at a flow rate of 0.2 mL min−1. The gradient program was as follows: 0–40 min, 50–90% A; 40–50 min, 90% A; 50– 51 min, 90–50% A; 51–60 min, 50% A. Formic acid (1% v/v) in ultrapure water was added using a T-connector after the chromatographic column by the isocratic pump at a flow rate of 0.05 mL min−1.
Elution of the target compounds was monitored using a LCQ Advantage MAX electrospray ionization mass spectrometer (ESI-MS) (Thermo Finnigan, San Jose, CA, USA) equipped with an ion-trap analyzer for single-stage MS/MS analysis. The optimal MS conditions for ESI analysis were as follows: sheath gas flow rate, 20 arb; aux/sweep gas flow rate, 30 arb; I spray voltage, 6 kV; capillary temperature, 150°C; capillary voltage, −10V; tube lens offset, −100. The [M+H]+ ions with m/z 163 were monitored and quantified in positive ion mode. The mass range from m/z 162.0 to m/z 163.5 was designed to enhance the sensitivity of mass detection. Ions were accumulated in the trap for 200 ms while 30 microscans were summed to generate a full scan acquisition. The Xcalibur analytical station was used to record the chromatographic map and the mass spectrum.
2.3. Study site, sample collection and preparation
Ice-core samples from two regions of the Tibetan Plateau were selected to further evaluate our method developed for levoglucosan analysis. Both areas were drilled by scientists from the State Key Laboratory of Cryospheric Science (SKLCS), Lanzhou, China. During July–August 2002, a 71 m ice core was drilled on a gentle slope in the northwest part of Muztagh Ata glacier (38°17′N, 75°04′E; 6350 m a.s.l.; Fig. 1) in the western Tibetan Plateau. In April 2004, a 190 m ice core was drilled in the accumulation area of Longxiazailongba glacier (33°6.6′N, 92°4.4′E; 5645 m a.s.l.; Fig. 1), Tanggula Mountains, central Tibetan Plateau.

Fig. 1. Map showing the Muztagh Ata ice core (black square) mainly influenced by the westerly winds (solid arrows), and the Tanggula ice core (black dot) in the interactional area of the westerly winds and the south Asian monsoon (dashed arrows), in the Tibetan Plateau. The boundary of the south Asian monsoon is according to Reference Morril, Overpeck and ColeMorril and others (2003).
Core sections with an average length of 80 cm from both sites were transported carefully in a frozen state and stored in the cold room (−18°C) of SKLCS. Each core section was incised longitudinally into four portions, and each portion was cut across its base every 15–20 cm for the Muztagh Ata ice core (total of 378 samples from surface to 71 m depth) and 2 cm for the Tanggula ice core (total of 117 samples from 1 to 3.5 m depth) using an ultraclean stainless-steel electronic saw. Approximately 2 cm of outer ice-core layers were then removed under a class 100 laminar-flow clean bench kept at −8°C. Previous work already demonstrated that this pre-treatment is sufficient to avoid contaminations with levoglucosan (Reference Gambaro, Zangrando, Gabrielli, Barbante and CesconGambaro and others, 2008), soluble ions (Zhao and others, 2011), heavy metals (Reference LiLi and others, 2006a), organic acid (Reference Wang, Yao, Xu, Wu and XiangWang and others, 2004) and BC (Reference XuXu and others, 2009b) from core handling and drilling. The uncontaminated core was melted at room temperature in an ultraclean precombusted 1000 mL beaker covered with aluminum foil. An aliquot of 15 mL melted ice was reserved in a clean polyethylene terephthalate (PET) bottle and kept frozen until analysis at the Max Planck Institute for Biogeochemistry, Jena, Germany. Ice-core samples were melted in the storage bottles at room temperature and then directly transferred into the HPLC-autosampler vials. To track possible contamination, we regularly tested blanks of ultrapure water treated the same as the ice samples.
3. Results and Discussion
3.1. Levoglucosan chromatographic separation
Recent studies have demonstrated that BC is not inert in the environment (Reference Kaal and RumpelKaal and Rumpel, 2009). Due to oxidation processes, BC becomes extractable in aqueous solutions, producing a large suite of organic compounds including carbohydrates, short-chain alkanes, different polycyclic aromatic hydrocarbons and N- and O-containing (poly)aromatics (Reference Kaal, Martinez Cortizas and NieropKaal and others, 2009). As a result, a large variety of different organic compounds with molecular weight close to that of levoglucosan are expected to be present in Tibetan ice samples.
In samples from the Tibetan Plateau, the Zorbax Eclipse XDB C18 column was found to yield adequate levoglucosan separation and low background intensity. Different solutions of methanol in ultrapure water (0%, 10%, 20%, 50%, 60%, 80%, 90%, 100% v/v) were tested as the mobile phase with a standard solution of 100 ng mL−1 levoglucosan. The best signal-to-noise ratio (S/N = 120 : 1) was obtained using a mobile phase of 90% methanol in ultrapure water giving a levoglucosan elution at 33.7 min (Fig. 2a). As expected, higher mobile phase polarity decreased levoglucosan retention time. For instance, a mobile phase of pure water caused levoglucosan elution at 15 min but with a poor S/N ratio (19 : 1).
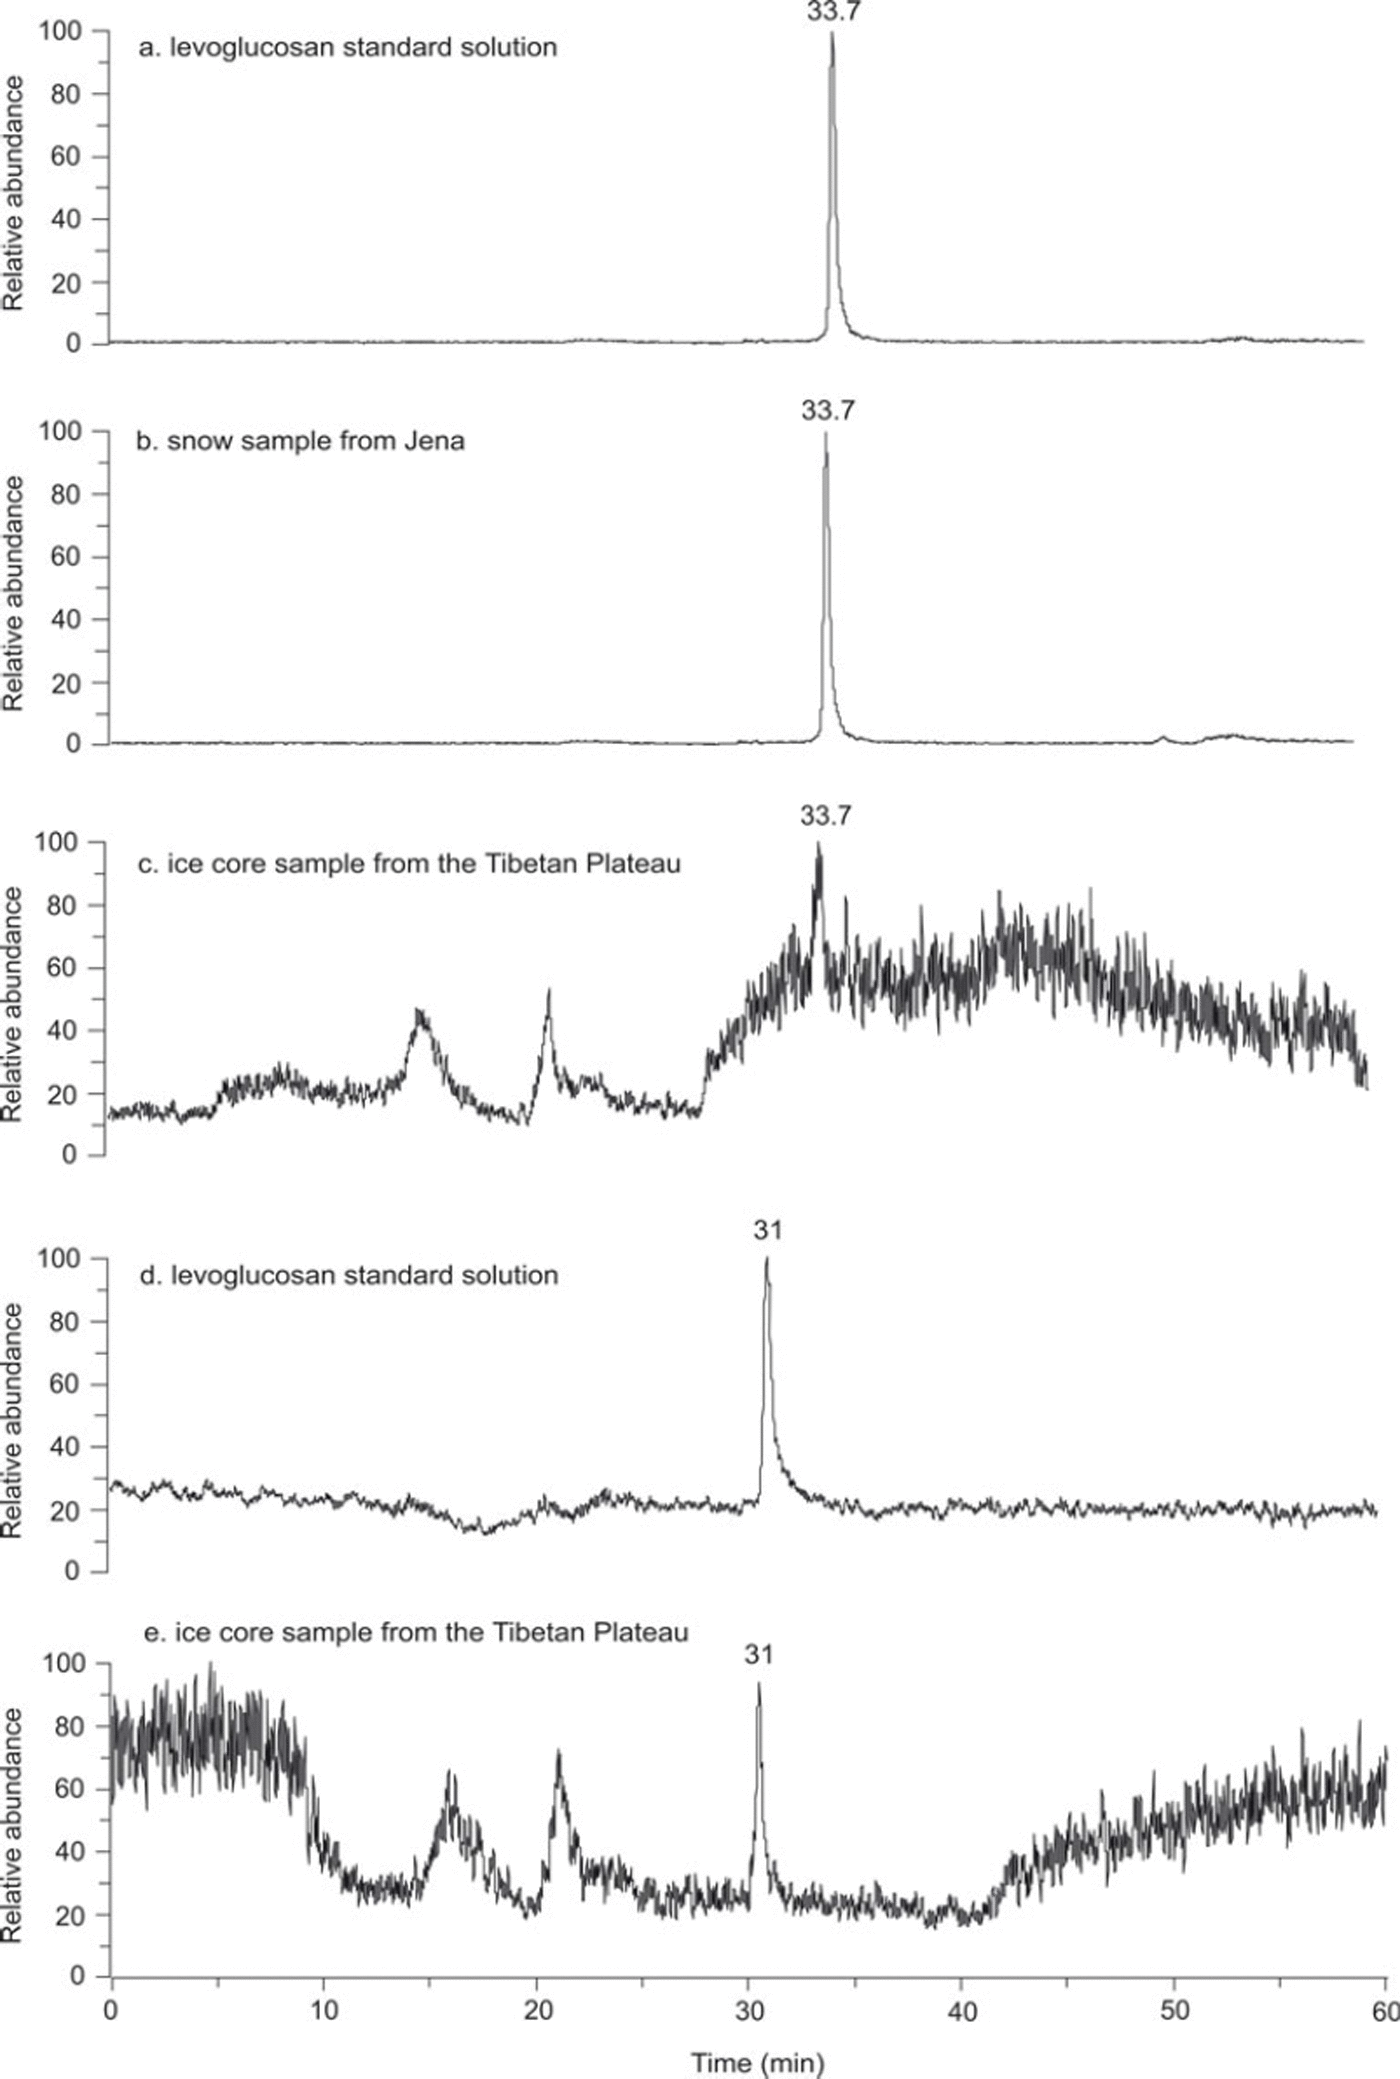
Fig. 2. (a–c) Ion chromatogram of a 100 ng mL−1 levoglucosan standard solution (a), Jena snow sample (b) and an ice-core sample from the Tibetan Plateau (c) using the 90% MeOH isocratic method. (d, e) Ion chromatogram of the same levoglucosan standard solution (d) and the same ice-core sample (e) using the gradient method.
The capacity of the isocratic method of 90% methanol in ultrapure water to purify levoglucosan in highly polluted samples was first tested with a snow sample collected in Jena on 12 January 2010. A sharp and high peak (S/N = 3583 : 1) of levoglucosan, with a baseline separation and the same retention time as the standard (33.7 min) indicated that this isocratic program of 90% MeOH in ultrapure water is optimal for the levoglucosan purification in an urban snow sample (Fig. 2b). However, when applied to the ice-core samples from the Tibetan Plateau, this isocratic program showed poor levoglucosan separation, with a low S/N ratio (7 : 1). The peak area of 3 724 398 was measured without subtraction of the background (Fig. 2c). The resolution factor between the levoglucosan peak (m/z 163[M + H]+; rt = 33.7 min) and the first peak of interferences (m/z 164 [M = H]+; rt = 33.8 min) was 0.1. The selectivity was close to 1. In order to separate levoglucosan from undefined compounds, a gradient method from 50% to 90% MeOH in ultrapure water in the first 40 min was developed. The column was finally rinsed for 10 min with 90% MeOH and re-equilibrated for 10 min with 50% MeOH. The total run lasted 60 min at a flow rate of 0.2 mL min−1, with the levoglucosan peak eluting at 31 min. The majority of organic compounds eluted in the first 10 min and after 40 min. This method showed optimal levoglucosan separations in both the levoglucosan standards (Fig. 2d) and the ice-core samples from the Tibetan Plateau (Fig. 2e), with S/N ratios of 117: 1 and 43 : 1 respectively. The levoglucosan peak area of 5.28 × 10⁻⁶ mV s−1 was measured without subtraction of the background (Fig. 2e). The resolution and selectivity factors between the levoglucosan peak and the following peak (m/z 164 [M = H]+; rt =40 min) were 7.5 and 2.4, respectively. This gradient program was then successfully applied to 378 ice samples from the Muztagh Ata ice core and 117 samples from the Tanggula ice core. No shift in the retention time of levoglucosane was observed. Significant chromatographic differences between the snow sample from Jena and ice-core samples from the Tibetan Plateau emphasized the importance of efficient chromatographic separation of levoglucosan. Inefficient separation caused important chromatographic interferences that may significantly reduce detection sensitivity, even when scanning over a mass range closely bracketing the target compound (here from m/z 162.0 to 163.5).
3.2. Optimization of post-column ionization and MS parameters
The quantification of levoglucosan remains partly an analytical problem, especially if the sugar concentration has to be quantified in ppb concentrations. The main problem is the lack of compatible mobile phase solution that carries out sufficient HPLC separation, with high efficiency of post-column ionization that brings acceptable detection sensitivity. Anhydro-sugars (e.g levoglucosan or sugar alcohols) have a particularly low rate of ionization, so they are difficult to detect using an ESI-MS detector (Reference Wan and YuWan and Yu, 2007). To handle this problem, strong acid (sulfuric acid) or reducing ions (Cl−) have been used as reagents (Reference Engelhardt and OhsEngelhardt and Ohs, 1987; Reference Zhu and ColeZhu and Cole, 2000). However, corrosion of metallic parts or salt accumulation (when using non-volatile salts) in the MS interfaces may cause serious problems of baseline stability and reduced detection sensitivity. Furthermore, when using MeOH, sulfuric acid cannot be used as a post-column reactant, since MeOH (CH3OH) in reaction with sulfuric acid (H2SO4) forms the ester dimethyl sulphate ((CH3)2SO4). Consequently, since the MS parameters and the rate of levoglucosan ionization are functions of the chromatographic conditions (solvent, column temperature, reaction time), different reactants for post-column ionization and various MS conditions have been used in previous quantitative studies of levoglucosan (Reference Gao, Hegg, Hobbs, Kirchstetter, Magi and SadilekGao and others, 2003; Reference PalmaPalma and others, 2004; Reference Wan and YuWan and Yu, 2006, Reference Wan and Yu2007; Reference Gambaro, Zangrando, Gabrielli, Barbante and CesconGambaro and others, 2008).
The ESI sensitivity for different targeted compounds was studied using flow injection analysis. Different reactants, 5 mM of NH4COOH (ammonium formate), 5 mM of NaCl (sodium chloride), 1% of HCOOH (formic acid) and pure CHCl3 (chloroform) were added to a 100 ng mL−1 levoglucosan standard solution before the ESI chamber by a T connector using a PHD 4400 Hpsi Programmable Syringe Pump (Harvard Apparatus Inc., Holliston, USA) at a flow rate of 10 μL min−1. The intensities of the different adduct ions m/z 180 [M+NH4]+, m/z 185 [M+Na]+and m/z 163 [M+H]+ in positive ion mode, and m/z 161 [M – H]− and m/ z 197 [M+Cl]− in negative ion mode were compared to determine the best MS sensitivity relativeto the monitored ions. As a non-volatile salt, NaCl deposited around the MS interfaces, causing large and rapid decrease of its sensitivity. Therefore, analysis using NaCl was not pursued further. Lower signals were observed in negative ion mode for both m/z 161 [M − H]− and m/z 197 [M+Cl]− ions with the absolute intensity of 167 and 142. In positive mode, the m/z 180 [M+ NH4]+ had an intensity of 1410 mV. The m/z 163 [M+H]+ ion was the most abundant ion, with an absolute intensity of 8440 mV, and was thus chosen as the targeted compound.
During method development, the tuning parameters for the ESI source were adjusted to obtain the maximum intensity of m/z [M+H]+. As expected, MS sensitivity was significantly influenced by changes of the spray voltage and temperature of the capillary (Reference Leinonen, Kuuranne and KostianenLeinonen and others, 2002; Reference Zweiner, Glauner and FrimmelZweiner and others, 2002; Reference Rafaëlly, Héron, Nowik and TchaplaRafaëlly and others, 2008). Spray voltage of 6 kV and capillary temperature of 150°C resulted in the highest signal intensity (1.80 × 10⁷ mV).
The column temperature may greatly affect the peak shape, so the post-column ionization efficiency (Reference Guillarme, Heinisch and RoccaGuillarme and others, 2004), signal intensity for m/z 163 [M+H]+, was tested at different column temperatures (25°C, 35°C, 45°C, 55°C) using previously optimized chromatographic conditions. The highest signal intensity (2.00 × 10⁷) for m/z 163 [M + H]+ was observed at 45°C. This column temperature was then used for sample analyses.
3.3. Levoglucosan isomers
As biomass burning produces higher levoglucosan concentration relative to its isomers, galactosan and mannosan (Reference SimoneitSimoneit and others, 1999; Reference Oros and SimoneitOros and Simoneit, 2001), levoglucosan concentrations predominated in aerosol, sediment, rain and ice samples (Reference SimoneitSimoneit, 1999; Reference Elias, Simoneit, Cordeiro and TurcqElias and others, 2001; Reference PalmaPalma and others, 2004; Reference Gambaro, Zangrando, Gabrielli, Barbante and CesconGambaro and others, 2008). As a result, most studies of biomass burning activities have focused mainly on levoglucosan (Reference Schkolnik and RudichSchkolnik and Rudich, 2006).
MS/MS analyses were performed with standard solutions of levoglucosan (100 ng mL−1 ), galactosan (100 ng mL−1 ), mannosan (100 ng mL−1) and one ice-core sample to determine if galactosan and mannosan may contribute significantly to the intensity of m/z 163 [M + H]+ in our samples. The MS/MS mass spectra of the different isomers and an ice-core sample were obtained using 25% collision energy and are presented in Figure 3. The low ratio of the m/z 85 versus 89 (with m/z 89 being characteristic for the levoglucosan and m/z 85 for its isomers) confirmed a minor contribution of mannosan and galactosan in our Tibetan ice samples. Figure 3 shows a proposed fragmentation scheme that explains the pseudo-molecular ion of levoglucosan, mannosan and galactosan in MS/MS spectrum and the predominance of the ion m/z 89 in levoglucosan relative to its isomers.
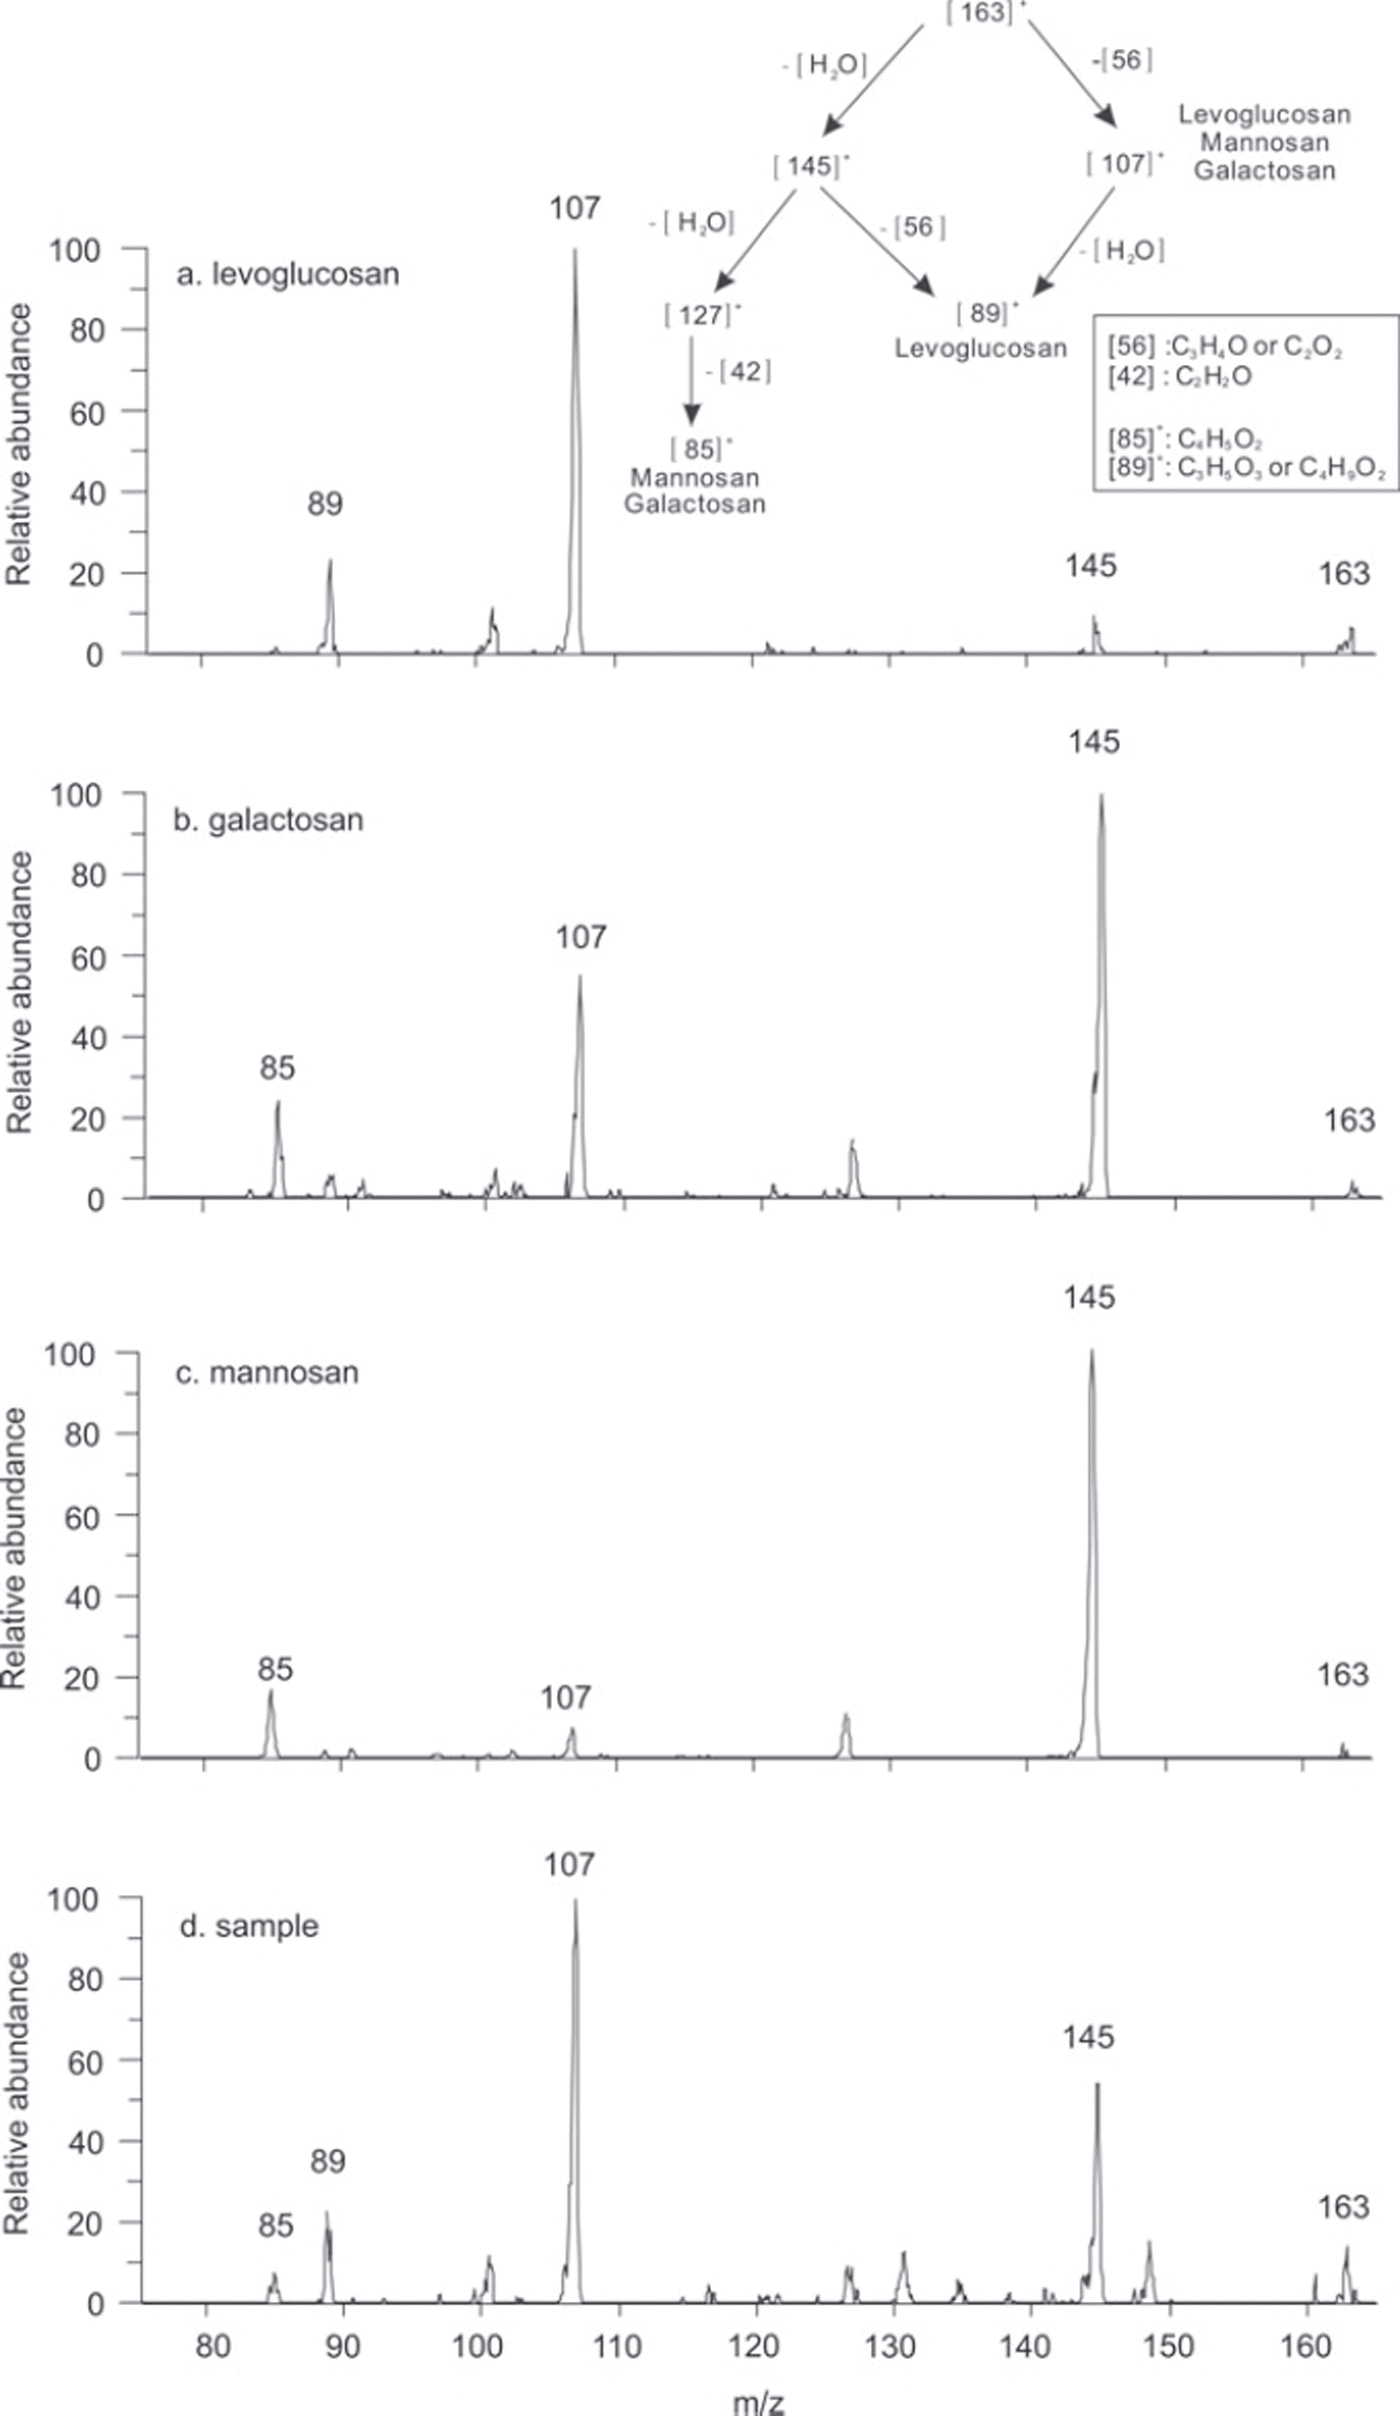
Fig. 3. Proposed fragmentation composition of MS/MS m/z 163 using 25% collision energy in positive mode (upper right) and spectra of levoglucosan (a), galactosan (b), mannosan (c) and an ice-core sample (d).
3.4. Calibration curve, limit of detection and quantification
The external standard calibration was used to evaluate levoglucosan concentration in the Tibetan ice-core samples. To determine the calibration curve, six levoglucosan standard solutions with concentrations of 40, 100, 200, 500, 800 and 1000 ng mL−1 were injected into the HPLC system and detected by mass spectrometry. The resulting adduct ion m/z 163 [M + H]+ peak areas were used as concentration-dependent response. A well-correlated linear calibration curve was obtained, with a coefficient of determination (R 2) value of 0.9958.
The limit of detection (LOD) was defined as the concentration of the analyte at S/N = 3 according to the Technical Specification ISO/TS 13530 (ISO, 2009) and was determined as 10 ng mL−1 in the current study. The criterion for the limit of quantification (LOQ) was estimated as three times the LOD with a relative measurement uncertainty of 33% which was met at 40 ng mL−1 .
To identify whether samples measured in series show a chronological dependency, a 200 ng mL−1 standard was measured seven times in one sequence. The Neumann trend test (P = 99%) applied to the resulting peak areas revealed no trend, and the standard deviation (3 ng mL−1, error 2%) of the resulting concentrations showed high precision. Furthermore, a possible time-dependent influence on the results between sequences was examined. Over a period of 1 month a levoglucosan standard was injected 37 times. Again, a Neumann trend test and also a visual check of the plotted data exposed no trend.
16 samples from the Muztagh Ata ice core were analyzed three times to evaluate the repeatability for an individual sample (Table 1). The relative standard deviation (RSD) ranged from 11% to 2%, and the average value was 6.8%. All these samples were reanalyzed after 6 months, and the results were at the same concentrations measured before, which suggests there is no significant degradation under a freezing condition of −20°C.
Table 1. Repeated measurements of levoglucosan concentration in selected samples from the Muztagh Ata ice core
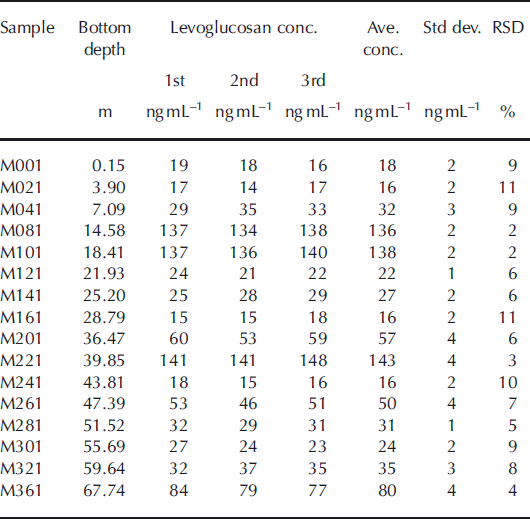
Table 2 shows a series of related qualitative and quantitative analyses of levoglucosan from different sample types with different analytical instruments. Although there are no uniform criteria to weigh their performance because of different sample types and detecting systems, the LOD and LOQ of our method were in the lower range of most of the other methods.
Table 2. Previous studies detecting levoglucosan in various sample types

3.5. Levoglucosan in the Tibetan ice-core samples
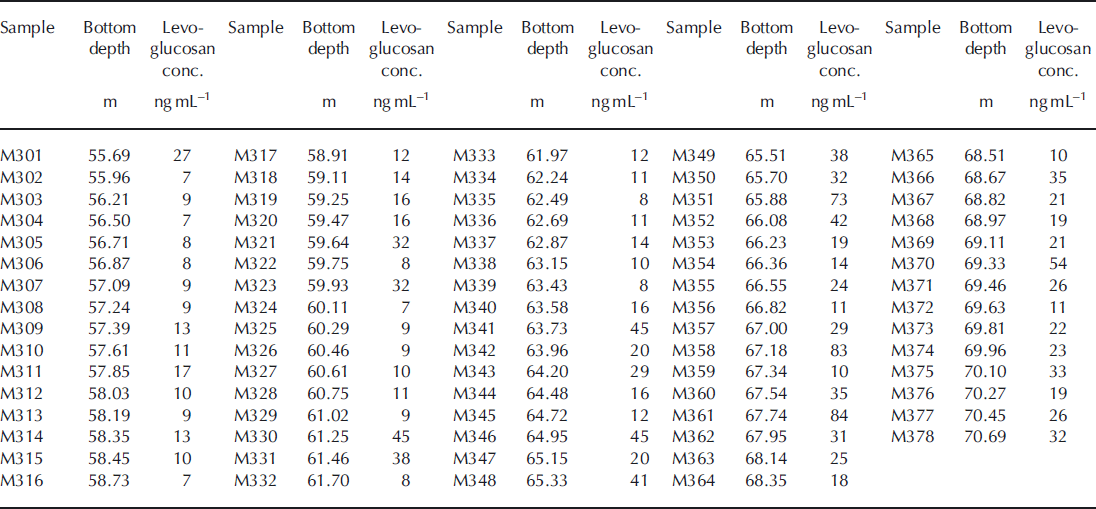
A total of 378 samples from the Muztagh Ata ice core from surface to 71 m depth, and 117 samples from the Tanggula ice core from 1 to 3.5 m depth, were analyzed using the method introduced above. Levoglucosan concentrations ranged from 10 to 718 ng mL−1 in the Muztagh Ata ice core (Appendix A) and from 10 to 93 ng mL−1 in the Tanggula ice core (Appendix B). The average levoglucosan concentration was 33 and 39 ng mL−1 in the Muztagh Ata and Tanggula ice cores, respectively. The average levoglucosan concentration of 39 ng mL−1 in the Tanggula ice core was ∼100 times higher than those in samples from east Russia (Reference Kawamura, Izawa, Mochida and ShiraiwaKawamura and others, 2012), and ∼1000 times higher than those in Greenland (Reference KehrwaldKehrwald and others, 2012). Higher levoglucosan concentrations supported the idea of stronger vulnerability of the Tibetan glaciers to anthropogenic/natural biomass burning events. As biomass burning on the Tibetan Plateau is itself relatively low (Reference LevineLevine, 1991), significant levoglucosan concentrations indicated important transport of continental atmospheric particulate matter from populated Asian zones to the Tibetan Plateau. Located in the western Tibetan Plateau, Muztagh Ata glacier is mainly influenced by the westerly winds that bring air masses from central Asia (Fig. 1) (Reference Wu, Yao, Xu, Tian, Li and DuanWu and others, 2008). The Tanggula Mountains are located in the center of the Tibetan Plateau and receive atmospheric particulates from two different air masses: the westerly winds in winter and the south Asian monsoon from the Indian Ocean in summer (Reference Yang, Yao, Gou, Wang and HaoYang and others, 2007).
Mutztagh Ata glacier has been intensively studied for glacier formations (Reference Yu, Yao, Tian, Li, Sun and WangYu and others, 2006), paleoclimate (Reference TianTian and others, 2006; Reference Duan, Yao, Wang, Tian, Xu and WuDuan and others, 2007) and paleo-environmental studies (Reference Wang, Yao, Xu, Wu and XiangWang and others, 2004; Reference Xiang, Yao, An, Xu and WangXiang and others, 2005; Reference LiLi and others, 2006a; Wu and others 2006, Reference Wu, Yao, Xu, Tian, Li and Duan2008; Liu and others, 2008; Reference Zhao, Yao, Xu, Li and DuanZhao and others, 2008, 2011). Several long ice cores (Reference Tian, Yao, Wu, Li, Xu and LiTian and others, 2007; Reference Wu, Yao, Xu, Tian, Li and DuanWu and others, 2008; Zhao and others, 2011) in the same altitude range (6350 and 7010 m a.s.l.) as the studied ice core (6350 m a.s.l) have been accurately dated. The mean annual snow accumulation rate has been calculated as 0.62 ± 0.1 m w.e. a−1, with a maximum of 1.39 m in the 1970s (Reference Duan, Yao, Wang, Tian, Xu and WuDuan and others, 2007). Based on these previous results, we estimate that the entire Muztagh Ata ice core covered a period of ∼100 years.
Distribution of burned areas in central Asia for each decade since 1900 showed three periods of peak-fire events, reaching a strong maximum in the 1990s, and two lower maxima in the 1950s and 1900s (Fig. 4a) (Reference Mouillot and FieldMouillot and Field, 2005). Although direct comparison between reconstruction of the fire history in central Asia and the levoglucosan concentration–year curve was not possible without exact dating of the core, both curves clearly show similar patterns (Fig. 4b). The strong maximum evidenced in the upper section of the core, and the two lower maxima in the middle and lower core sections (Fig. 4b). The delay between the two curves, which was more important in the upper core section, may result from variations in snow accumulation rates. Further analyses of the Muztagh Ata ice core including δ18O and BC will help to increase the accuracy of the relationships between the two curves.
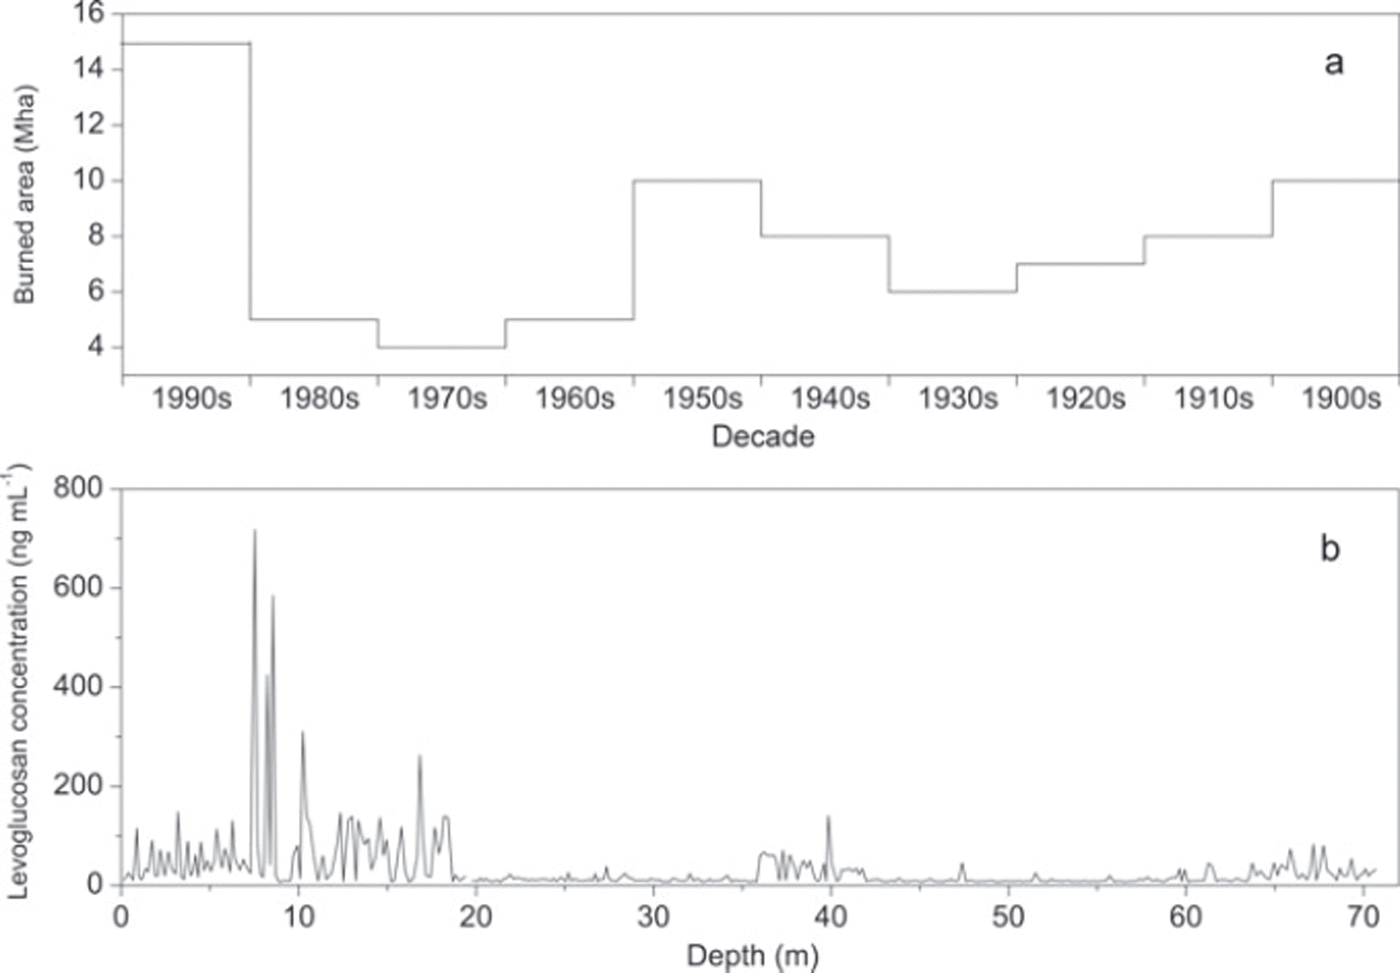
Fig. 4. (a) The temporal trend of burned areas (Mha) in averaged decades for central Asia (modified from Reference Mouillot and FieldMouillot and Field, 2005). (b) Profile of levoglucosan concentration vs depth in the Muztagh Ata ice core.
The chronology of the Tanggula ice core was determined by the maximum value of the β-activity in 1963, the seasonal variations of δ18O and inorganic ion layers. The core section from 1 to 3.5 m depth covered 1990–2000 and had an annual net accumulation rate from 33 to 4 cm a−1(Appendix B). During this period, mean annual levoglucosan concentrations, which were calculated based on the weighted net accumulation rate for each year, showed a strong maximum in 1995 and lower maximum in 1997/98 (Fig. 5).

Fig. 5. Temporal variation of annual levoglucosan concentrations with the error bars of standard deviation from 1990 to 2000 in the Tanggula ice core.
In May–June 1995, 677 700 ha of forest were burned during extreme forest fire events in Uttaranchal and Himachal Pradesh, north India (Reference Kimothi and JadhavKimothi and Jadhav, 1998; Reference Roy, Sivakumar, Roy, Harmsen and SahaRoy, 2004). Using the US National Center for Atmospheric Research (NCAR) reanalysis data from 30 May 1995 (ftp://arlftp.arlhq.noaa.gov/pub/archives/reanalysis/) and the HYSPLIT (installed version) clustering analyses to track the possible sources of the levoglucosan concentration peak in 1995 in the Tanggula ice core, we demonstrated that 75% of biomass burning particulates from north India could reach Tanggula glacier in 3–5 days (Fig. 6), which was within the lifetime of levoglucosan in the atmosphere (Reference Fraser and LakshmananFraser and Lakshmanan, 2000). The El Niño event in 1997/98 triggered widespread drought (Reference De and MukhopadhyayDe and Mukhopadhyay, 1998; Reference Barlow, Cullen and LyonBarlow and others, 2002) which particularly favored fires in 1998 in many regions of the world, including north India (Reference Roy, Sivakumar, Roy, Harmsen and SahaRoy, 2004), China and Indonesia (Reference Van der WerfVan der Werf and others, 2004). This particular condition may thus explain the trend of higher levoglucosan concentrations in 1997/98 in the Tanggula ice core.
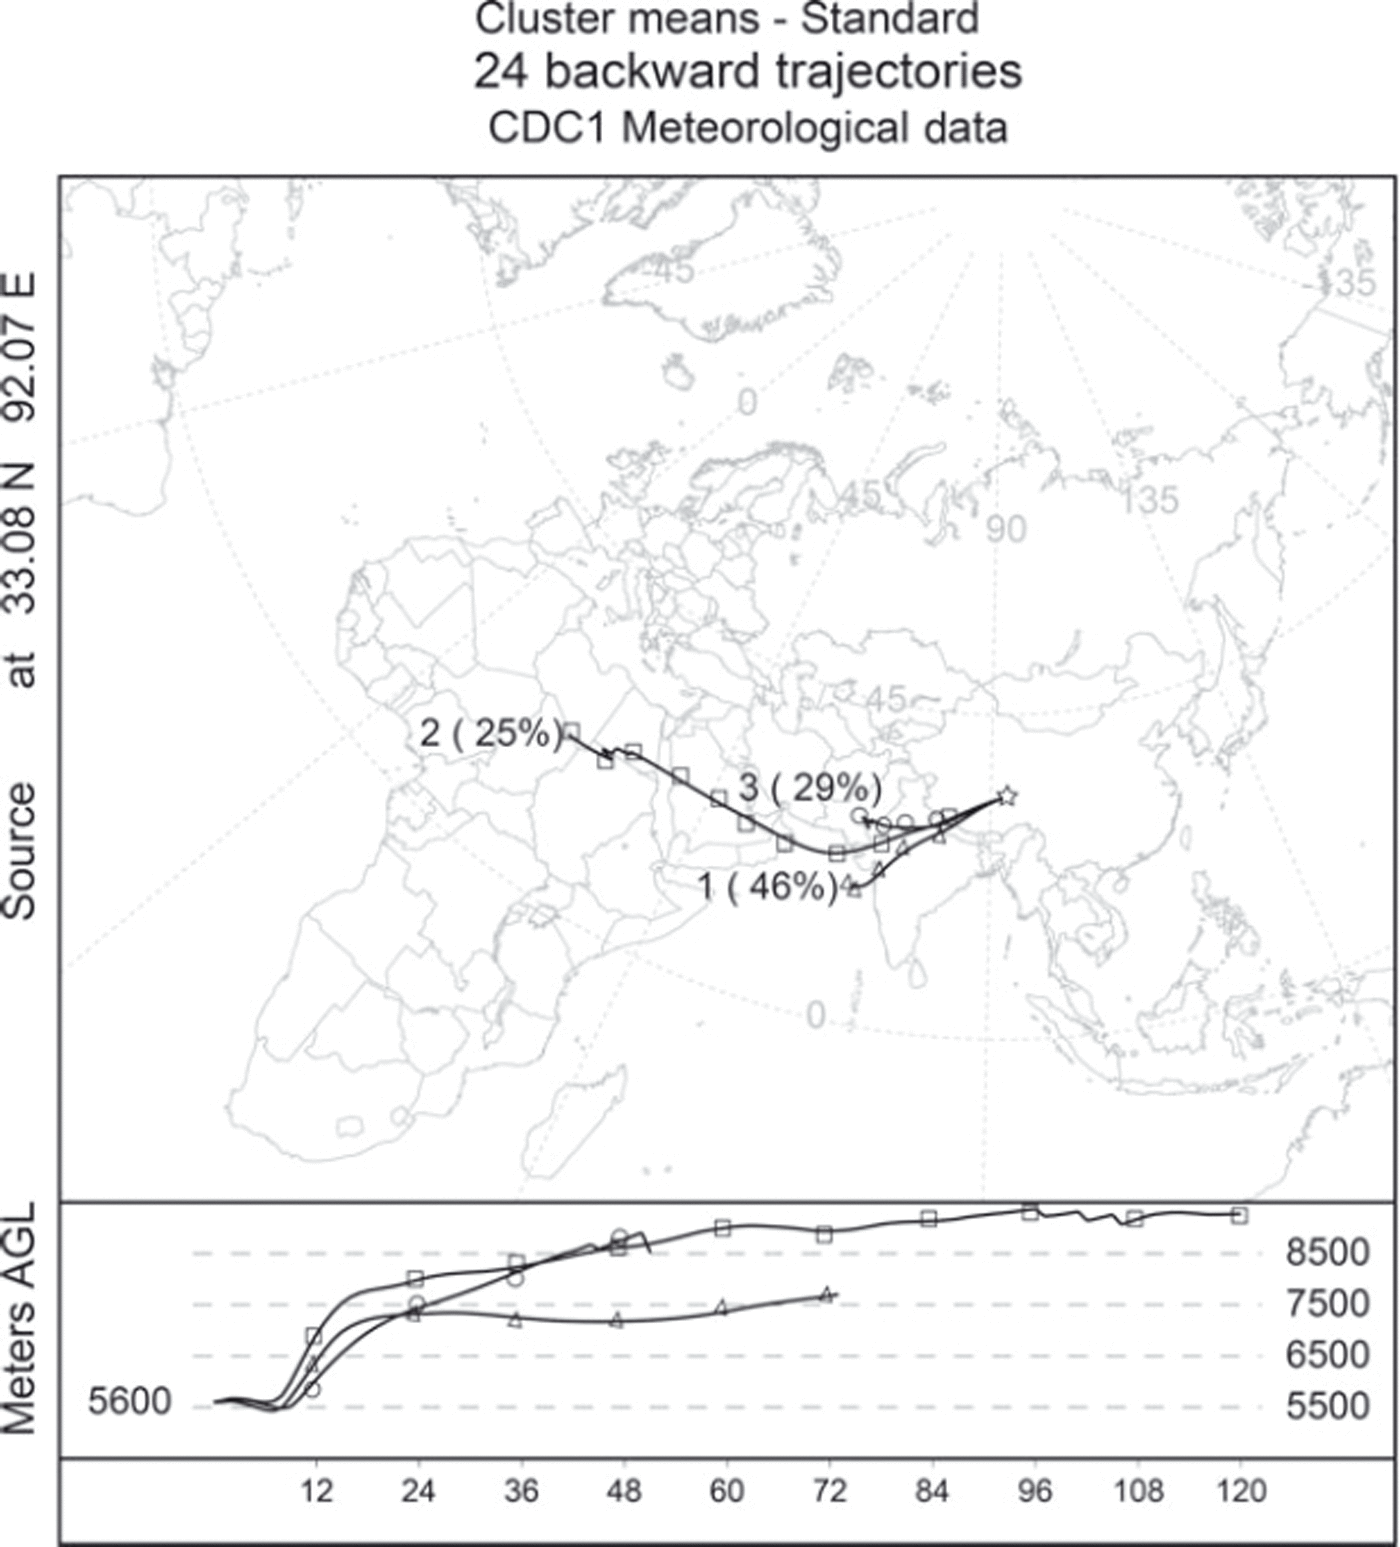
Fig. 6. Five-day backward trajectory analyses at the Tanggula Mountains from 30 May 1995. The trajectory calculations were performed every 12 hours from the Tanggula ice-core site (33°6.6′ N, 92°4.4′ E) at 5600 m a.s.l. using the HYSPLIT model (installed version). The lines with triangles, squares and circles indicate the percent of possible sources.
The agreement between biomass burning histories in central Asia and the levoglucosan concentrations in the Muztagh Ata ice core, and the extreme fire event in 1995 in north India and the levoglucosan peak concentration in the Tanggula ice core suggest that the westerly winds and the south Asian monsoon were the major sources of atmospheric particulate matter derived from biomass burning in the plateau. Further investigations that will combine levoglucosan concentrations with other biomass burning proxies (K+, NH4 + and oxalate) and BC contents will help us to better assess the role of biomass burning events relative to fossil-fuel burning in the atmospheric particulate matter of the Tibetan Plateau during the past several decades.
4. Conclusion
A high-performance liquid chromatography with electro-spray ionization mass spectrometry method was developed for quantifying levoglucosan in ice-core samples from the Tibetan Plateau. Minimum sample preparation avoided possible error and contamination during the pre-analytical procedure. A large injection volume (1 mL) was used to decrease the limit of detection in the ice-core samples.
Samples from the Muztagh Ata and Tanggula ice cores showed higher levoglucosan concentrations than those measured in ice or snow samples from Antarctica, Greenland or east Russia. Although an accurate timescale of the Muztagh Ata ice core has not been established, based on the dating of several other ice cores levoglucosan concentrations found in the Muztagh Atga ice core are in good agreement with the biomass burning events in central Asia. However, further work including δ18O dating and black carbon quantification will help to better constrain the accuracy of the relationship between the two curves. In the Tanggula ice core, the strong forest fire events in north India in 1995 coincided with the peak of mean annual levoglucosan concentration. These findings suggested that the westerly winds and the south Asia monsoon were the major sources of atmospheric particulate matter derived from biomass burning in the plateau. However, further investigations combining levoglucosan concentrations with other biomass burning proxies and black carbon contents will help to better assess the role of biomass burning events relative to fossil-fuel burning in the atmospheric particulate matter of the Tibetan Plateau.
Acknowledgements
This research was supported by the National Natural Science Foundation of China (40930526, 41125003, 41190081, 41190084). We thank the Max- Planck-Gesellschaft and Chinese Academy of Sciences doctoral promotion program 2010 for financial support of Ping Yao, and the German Research Foundation DFG (1257) for financial support of Vanessa-Nina Roth. We thank Susan Trumbore for helpful advice and discussions. We also thank Andrea Gambaro and another reviewer for helpful suggestions. We gratefully acknowledge the US National Oceanic and Atmospheric Administration (NOAA) Air Resources Laboratory (ARL) for provision of the HYSPLIT transport and dispersion model and READY website (http://ready.arl.noaa.gov).
Appendix A
Table 3a. Levoglucosan concentrations in the Muztagh Ata ice core with depth (samples M001–M150)
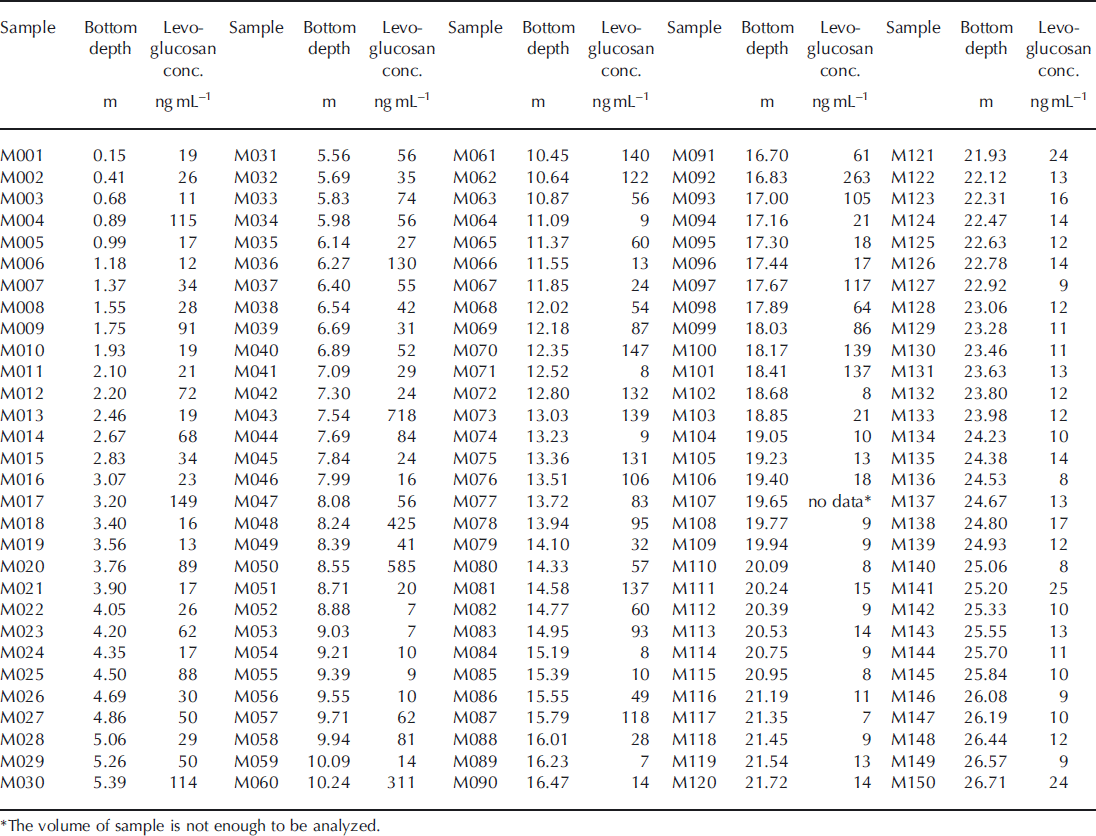
Table 3b. Levoglucosan concentrations in the Mutzagh Ata ice core with depth (samples M151–M300)

Table 3b. (continued)

Table 3c. Levoglucosan concentrations in the Mutzagh Ata ice core with depth (samples M301–M378)
Appendix B
Table 4. Levoglucosan concentrations in the Tanggula ice core with depth and chronology (samples T1-10–T3-24)

Table 4. (continued)


