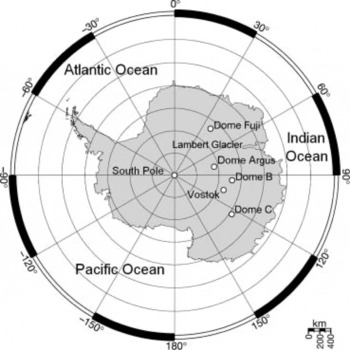
Dome Argus (80°00’22” S, 77°22’00” E;4093 m a.s.l.), also known as Dome A, the highest ice feature in Antarctica, is located near the center of East Antarctica, approximately midway between the head of Lambert Glacier and the South Pole (Fig. 1). Dome Argus was first identified by the US Geological Survey from US Navy aerial photographs taken in 1959–60 and further delineated by the airborne radioecho sounding program of the Scott Polar Research Institute, UK, in association with the US National Science Foundation and the Technical University of Denmark in 1967–79.

Fig. 1. Map of Antarctica showing locations of interest.
The 2004/05 Chinese Antarctic Research Expedition (CHINARE) traverse from Zhongshan station reached the summit of Dome Argus, carrying out detailed glaciological and meteorological measurements. Annual temperature at the summit, based on 10 m firn core temperature, is –58.5°C and annual accumulation rate during recent decades has been ~0.023 ma–1 w.e. (Reference Hou, Li, Xiao and RenHou and others, 2007). In addition, CHINARE recovered a 109.86 m firn core. Here we present results of dust measurements from five samples from 109.68 to 109.86 m depth. These samples are estimated to cover ~20 years in the mid-Holocene.
We measured the samples using a 256-channel Coulter counter (Coulter Multisizer IIe#) set up in a class 100 clean room at the Laboratoire de Glaciologie et Géophysique de l’Environnement, France. The instrument was adjusted to measure particles with a diameter > 0.7 μm. The ice samples were cut with a bandsaw and cleaned by three repeated bathings in ultra-pure water (Milli-Q). The final results are the averages of at least three independent measurements on the same sample. The total mass of insoluble dust is calculated from the volume size distribution assuming an average density of 2.5gcm–3.
Continental dust transported in the atmosphere can be used as a tracer for atmospheric circulation, and for providing information on climate in dust-source areas. Therefore, aeolian dust records of ice cores could contribute to documentation of environmental change on various geographical and temporal scales (Reference PetitPetit and others, 1999; EPICA Community, 2004). Compared with other ice-core paleoclimatic proxies, dust has the advantage of preserving information on both concentration and size distribution. Usually, a log-normal function is used to fit mean volume (mass) size distributions, and the modal value of the regression can be adopted as an indicator of particle transport time (Reference Delmonte, Petit and MaggiDelmonte and others, 2002).
The average number and mass concentrations for each sample are shown in Table 1. The dust mass concentrations are between 3.39 ppb (DA-3) and 11.07 ppb (DA-2). For particles with diameters d < 2μm, the mean mass concentration is 5.30 ppb, dominating about 65% of the total mass concentration. The percentages are 20% for 2.0–2.5 μm and 15% for 2.5–5.0 μm. The mean concentration of particles with 0.7μm < d < 5μm in five ice-core samples is 2931 mL–1, with a mean mass concentration of 8.10 ppb. This mean mass concentration is low and consistent with those of the Holocene period from the European Project for Ice Coring in Antarctica (EPICA) Dome C ice core (3900 mL–1; 15 ppb from data over the depth interval 40–360 m) (Fig. 2). No particle larger than 3.5 μm was detected, suggesting a very long travel time for the dust and probably a path through the high troposphere, allowing the large particles to settle before the dust mass reached inner Antarctica.

Fig. 2. Comparison between mean dust concentrations in the five samples from the Dome Argus core, and in the EPICA Dome C ice core during the Holocene. The error bars represent standard deviations.
Table 1. Concentrations in the five samples from the Dome Argus core

Log-normal regressions provide a reasonable initial estimate of the dust distributions. However, with our high- resolution measurements (256 channels) and for concentrated samples, some differences occur. The sharp drop in volume size departs significantly from the log-normal curve and appears slightly negatively skewed (Fig. 3a). A better fit might be obtained using a four-parameter Weibull function, as suggested by Reference Delmonte, Petit and MaggiDelmonte and others (2002) (Fig. 3b). The mode diameter calculated assuming the Weibull function for the Dome Argus ice-core samples is 2.01 ± 0.11 μm, which is less than the mode for the Holocene period in the Dome C ice core (2.21 ± 0.14μm). Preliminary measurements by isotopic fingerprints tend to confirm that the dust sources for the Holocene period in East Antarctica were located in South America (Reference Basile, Grousset, Revel, Petit, Biscaye and BarkovBasile and others, 1997; Reference DelmonteDelmonte and others, 2004a, Reference Delmonte, Petit, Andersen, Bas¡le-Doelsch, Magg¡ and L¡penkovb). However, in East Antarctica, the size distribution (and total concentration) is, at any given site, subject to variability that may be associated with variable advection of air masses on to the plateau or with source strength (Reference Delmonte, Petit, Krinner, Maggi, Jouzel and UdistiDelmonte and others, 2005). Although other factors (e.g. elevation, distance from coast) may also play a role in the deposition of smaller dust particles at Dome Argus than at EPICA Dome C, they are not well quantified at this stage. For instance, during the Holocene, alternative small and large dust particles, as well as high and low dust concentrations, can be observed between Vostok and EPICA Dome C.

Fig. 3. (a) Log-normal and (b) Weibull regressions of mean volume (mass) size distributions for the five samples from the Dome Argus core, expressed in relative units % (RU%).
In summary, the five ice-core samples from Dome Argus cover a short duration (~20 years) and provide high-quality climatic information. We expect therefore to obtain high- quality climate records from future deep drilling in the Dome Argus region.
Acknowledgements
We thank the members of the 21st CHINARE for field support. This work is supported by the National Natural Science Foundation of China (40576001, 2005DIB3J114) and the Chinese Academy of Sciences (100 Talents Project and KZCX3-SW-354).
10 November 2006


