Introduction
Structures of ice produced on freezing of aqueous solutions are extremely important in understanding the glacial phenomenon. In addition, usefulness of sea ice as a structural material depends to a great extent on its salinity (Reference KingeryKingery, 1960) and distribution of brine in the solid aggregate. Aqueous solutions of most ionic salts freeze by separation of practically pure ice crystals from the liquid phase; with very few exceptions, there is virtually no solid solubility of ionic salts in ice. The morphology of freezing ice crystals is of great importance in attempting to achieve separation from the brine in production of fresh water.
As an ice crystal grows there is rejection of solute from the moving interface into the liquid. Since the rejected solute moves primarily by diffusion, concentration gradients are established in the liquid. The highest solute concentrations are found in the liquid immediately adjacent to liquid-solid interfaces and lowest concentrations at locations farthest from these interfaces. The velocity with which a solid-liquid interface can grow locally is determined by the speed with which the solute can diffuse away from the solid-liquid interface. Since liquid diffusivities are quite low, the growth velocity is correspondingly low. However, the overall rate of liquid to solid conversion is dictated by the rate of heat extraction. To transform at the rate required by heat flow, ice crystals grow as arrays of parallel plates or dendrites. Solidification progresses by simultaneous longitudinal and transverse growth of ice plates. During growth most of the solute is rejected in the interdendritic liquid between neighboring plates where it is deposited as brine layers towards the end of the solidification cycle. The spacing between ice plates or brine layers governs the properties of the solid aggregate. Reference Weeks, Assur and KingeryWeeks and Assur (1963) have shown that vertical variation in the strength of sea ice is due to a change in the distribution of solute pockets. Reference Bennington and KingeryBennington (1963) has discussed the variation in salinity of Arctic ice with depth and its effect on properties.
Most of the work done on the formation of ice has been either on pure water or dilute solutions (Reference DorseyDorsey, 1948; Reference HimesHimes and others, 1959; Reference Harrison, Tiller and KingeryHarrison and Tiller, 1963; Reference FrenchFrench, unpublished). The present investigation was concerned with factors which affect spacing between ice dendrites in solutions up to fairly high concentration levels. The effects of freezing rates, solute concentration, solute diffusivity, the presence of more than one solute in a solution and external magnetic fields were investigated.
Theory
Mass transport
An analysis of mass-transport events in the interdendritic liquid between two growing plates (Figs. 1 and 2) provides a basis for quantitative interpretation of experimentally observed dendritic structures. The main purpose of the analytical treatment of interdendritic liquid diffusion is to relate the dendrite spacing and the maximum concentration differences in this region to solidification variables. Most analyses on re-distribution of solute have been for a case where the solute is being rejected into a large volume of liquid ahead of a plane interface (Reference TillerTiller and others, 1953). In the present situation, solute is being rejected into both sides of a liquid region bounded by parallel planes; in addition, these planes are simultaneously moving towards each other.

Fig. 1. Schematic representation of solute-concentration profile in the interdendritic liquid between two ice plates

Fig. 2. Actual-temperature and liquidus-temperature distributions in the interdendritic liquid
The solute rejected at the interface (X = a) moves towards the center of the interdendritic liquid region (X = 0), producing a concentration gradient in the liquid (Fig. 1). The concentration difference (ΔC) between the center (C = C 0) and the bounding surface (C = C i ) is directly proportional to supercooling, ΔT, prevailing in the center of the liquid region (Fig. 2). For binary solutions, solute concentration should conform to Fick’s second law:

where Θ = time and D = diffusivity of solute in liquid.
Since the constitutional supercooling in the liquid is generally of the order of 0.1°C. (Reference RohatgiRohatgi, unpublished [b]; Reference Rohatgi and AdamsRohatgi and Adams, 1965), the concentration gradients in the liquid remain quite small. Since the rate of increase of concentration, ∂C/∂Θ, is substantially independent of position, Fick’s law reduces to an ordinary differential equation:

Double integration of this equation leads to the difference in concentration between the center and the bounding surface of the interdendritic liquid region:

where a = half thickness of the interdendritic liquid region.
The average solute concentration of liquid C a increases during freezing as follows:

where
Substituting Equation (4) into (3) gives the concentration difference as a function of dendrite spacing, freezing rate, overall concentration and diffusivity:

The supercooling resulting from this concentration difference is:

where m = slope of the liquidus line on the pertinent phase diagram.
Freezing Systems and Heat Transport
Freezing of droplets
This technique consists of immersing small droplets of aqueous solution into a large quantity of a cold organic liquid (20 per cent kerosene, 80 per cent mineral oil). The organic medium is maintained at a temperature (typically −20°C.) substantially below the liquidus temperature of the solution. The relative density and the viscosity of the organic liquid are such that the droplet sinks slowly through it. The droplet remains perfectly spherical during freezing.
The size of the droplet and the ratio of its thermal diffusivity to that of the medium were such that temperature gradients within the droplet during freezing were negligible. Under these conditions the solidification rate did not vary either with position within the droplet or with time. In other words, the solidification rate was uniform with respect to space and time. Droplet diameters are typically of the order of 0.2–0.3 in. (5.1–7.6 mm.). The principal advantage of uniform freezing conditions is that the resulting dendrite spacings are uniform from the surface to the center of the droplet.
The freezing time of a droplet (Reference FrenchFrench, unpublished) is proportional to the square root of its diameter at any given temperature of the organic coolant.
Unidirectional freezing system
In this system aqueous solutions are poured into a “Tygon” tube fitted on a copper chill which is kept cool by freezing mixtures. The solution freezes under conditions of unidirectional heat flow from the chill surface. Unidirectional growth of ice from a constant-temperature surface is a heat-transfer situation of practical importance; it is manifested in nature during vertical freezing of saline-water pools with the atmosphere acting as a heat sink. Heat-transfer analysis during unidirectional solidification of solutions is more complicated, since the latent heat is evolved over a range of temperatures. Temperature gradients set up in the liquid are accompanied by the formation of a solid and a solid-plus-liquid zone growing from the chill surface. Freezing in these zones takes place in accordance with temperature patterns fully describable by solutions to Fourier’s law of heat conduction:

where T is temperature as a function of time, Θ, and distance y from the chill surface. α is the thermal diffusivity.
In the present situation of freezing from a constant-temperature chill surface, the temperature profiles can be represented to as close an approximation as desired by a combination of error-function equations. The temperature isotherms are parallel to the chill surface and they move at a parabolic rate. This is documented by observation of the eutectic temperature isotherm which is readily visible during growth as the limit of the all-solid region.
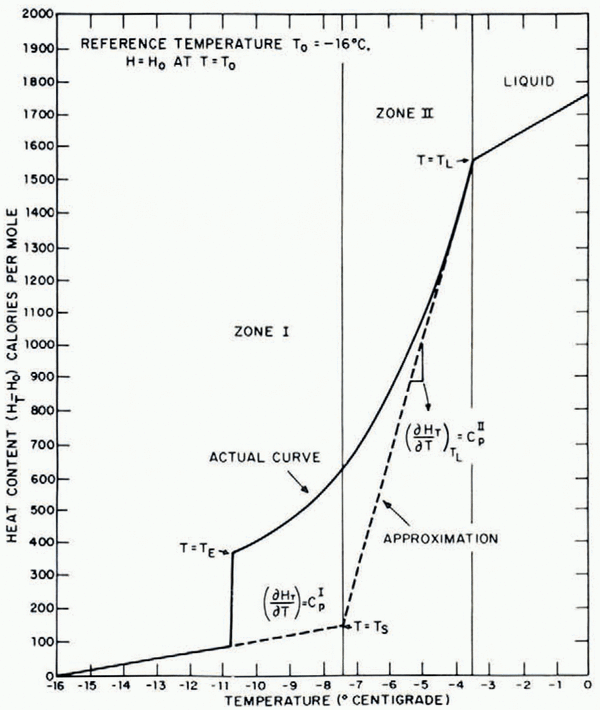
In view of growth conditions, actual-temperature distribution can be well approximated Ly a combination of two error-function equations describing the conditions in different temperature regions. For heat-transfer analysis the freezing material is approximated by two zones having different constant specific heats (Fig. 3). The specific heat of the forward zone II (which has a temperature above T s) is taken as equal to the effective specific heat of the liquid-solid region just below the liquidus temperature. The specific heat of material in zone I (which has a temperature below T s) is taken as equal to that of the solid. The error-function equations describing the temperature profiles (Fig. 4) in each zone are of the following form:


where α I, α II = thermal diffusivities in zones I and II, respectively, and A, B = constants, T i = chill surface temperature, T L = liquidus temperature.

Fig. 3. Variation in heat content of aqueous solutions with temperatures during solidification

Fig. 4. Schematic representation of temperature profiles when an aqueous solution is brought into contact with a cold chill
The boundary conditions and the approximations used in evaluating the constants are described in detail by Reference Rohatgi and AdamsRohatgi and Adams (in press). These temperature distributions can be transformed into a description of freezing events by making use of phase-diagram relationships:


Freezing rates at different distances from the chill obtained by differentiation of Equations (10) and (11) are of the form:


Figure 5 shows the freezing-rate distribution (Reference Rohatgi and AdamsRohatgi and Adams, in press) during unidirectional solidification of a 1.oN potassium chloride ingot. The results of heat-flow analysis can be summarized as:
-
i. When an aqueous solution at its liquidus temperature is presented to a constant-temperature chill surface, the liquid at each level is subjected to a spectrum of freezing rates. The freezing rate at each level starts low, goes through a maximum and then decreases during the freezing cycle.
-
ii. The spectrum of freezing rates is different at different distances from the chill and the maximum freezing rate, as well as the average freezing, is inversely proportional to the square of the distance from the chill:
(14) (15)
(15)
where y = distance from chill. Superscripts M and A mean maximum and average, respectively.

Fig. 5. Freezing rates of 1.oN potassium chloride solution versus fraction solid at different distances from a surface at −70°C. in contact with the solution
Freezing rate and freezing time
The freezing rate is expressed as the rate of fraction solid with time and has the dimensions of reciprocal time. Expressed in this way, the freezing rate has been found determinative of dendrite spacing. In some cases, such as the freezing of droplets in a cold organic liquid, the freezing rate is substantially uniform from beginning to end of solidification. In this special case the freezing time is numerically identical to the inverse freezing rate.
Specimen Preparation and Micrography
Thin slices are cut from droplets of unidirectionally frozen samples and mounted on a transparent glass slide by freezing small drops of water around their periphery. They are then polished on a series of emery papers; the final polishing is done on a soft tissue paper. A Leitz biological microscope was used for structural observations; photography was done by mounting a 35 mm. Exacta camera on the eyepiece tube using light transmitted through the specimen. Specimen preparation and photography were done at −40°C.
Results and Discussion
Dendrilic structure
The solid aggregate formed on freezing of aqueous solutions consists of groups of parallel plates of ice. Examination under polarized light shows the orientation of plates within a group is the same; different groups have different orientations. Figure 6 shows schematically the structural features of a group of dendrites after complete solidification. Figure 8 shows a microphotograph of a typical aggregate sectioned perpendicular to direction of growth. The dark phase between the ice plates is salt–ice eutectic, the very last material to solidify.

Fig. 6. Charateristic parameters of a group of dendrites of ice with solute entrapped in between
Effect of freezing rate
Dendrite-spacing measurements were made on different size droplets for four different solutions (Fig. 7). The freezing time of a droplet is proportional to its diameter. This means that dendrite spacing is directly proportional to the square root of freezing time, or, stated another way, proportional to the inverse square root of freezing rate (Fig. 7).

Fig. 7. Dendrite spacing as a function of the square root of the inverse freezing rate in droplets of four different solutions at a concentration level of 0.4 mole/l.
In unidirectional samples frozen from a constant-temperature chill surface the dendrite spacing increases linearly with distance from the chill surface. Figures 8 and 9 show transverse sections of a sample at increasing distances from the chill; the sample was made from a 1.0N potassium chloride solution in contact with a chill at −70°C. Examination of such successive sections and some longitudinal sections has indicated quite conclusively that the dendrite spacing increases principally by divergent growth of neighboring plates. The divergence of plates is accommodated by the decrease in the number of groups per unit area, with increasing distance from the chill. Out of the large number of groups that are produced next to the chill by very rapid initial freezing, only a few survive at larger distances from the chill.

Fig. 8. Transverse section of a unidirectional sample from a potassium chloride solution, 0.90 cm. from a −70°C. chill surface, × 23

Fig. 9. The same sample as in Figure 8, 3.2 cm. from the chilled surface, × 23
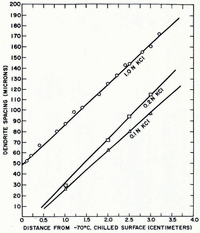
In both single- and mixed-solute systems studied so far, dendrite spacing has been found to increase linearly with the distance from the chill (Fig. 10). Each position in the sample during growth from a constant-temperature chill is subjected to a spectrum of freezing rates (Fig. 5). The maximum freezing rate at any level is proportional to the square of its distance from the chill. The dendrite spacing is, therefore, inversely proportional to the square root of the maximum freezing rate (Fig. 11).

Fig. 10. Variation of dendrite spacing with distance in unidirectional samples of potassium chloride solutions at different concentration levels

Fig. 11. Dendrite spacing in 1.0N potassium chloride ingot as a jnrtction of the reciprocal of the square root of the maximan, freezirrg rote at different distances from the chill surface at −70°C.
The dendrite spacings in the two systems were equal when the maximum freezing rate in the unidirectional freezing system equals the constant freezing rate of the droplet system.
In summary, the relationship between dendrite spacing and freezing rate, df s/dΘ, can be expressed:

where K 1 and K′1 are constants.
This means (Equations (5) and (6)) that the interdendritic supercooling, ΔT, or super-saturation, ΔC, does not vary with freezing rate (i.e. with position in the unidirectional specimen).
Effect of solute diffusivity
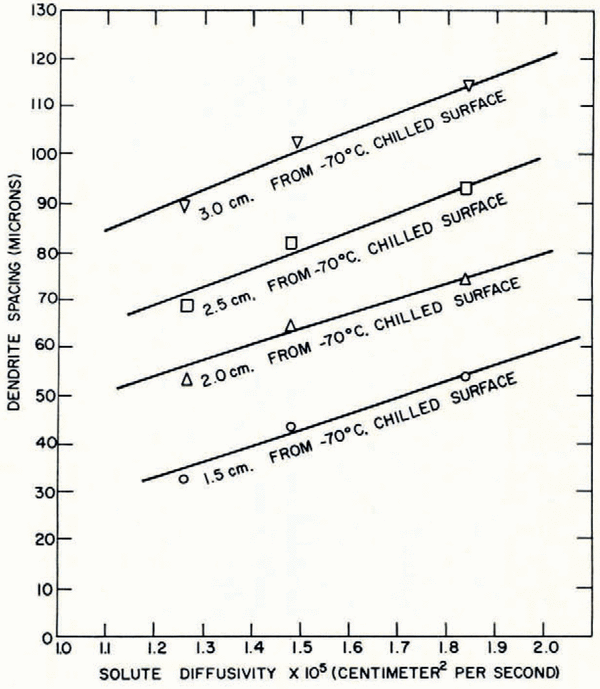
Dendrite spacings have been measured for solutions of potassium chloride, sodium chloride and lithium chloride at the same concentration and freezing rate. Figure 12 shows a linear increase of dendrite spacing with solute diffusivity for the droplet freezing systems. Figure 13 shows similar results for the unidirectional freezing system; the dendrite spacing at a fixed distance from the chill surface increases linearly with solute diffusivity. The dendrite spacing can be expressed as a function of solute diffusivity in the form:
where D is the diffusivity of the solute and K 2 and K′2 are constants.

Fig. 12. Variation of dendrite spacing with sahne diffusiuity in droplets containing 0.4 mole/l. of solute

Fig. 13. Variation of dendrite spacing with solute diffusivity in unidirectional samples containing 0.2 mole/l. of solute
The supersaturation ΔC and supercooling ΔT in the interdendritic liquid increase in the following manner:

For a system such as freezing of droplets, the transverse growth velocity,V, of the solid—liquid interface is given by:

At a given freezing rate the transverse growth velocity is higher the higher is the solute diffusivity.
Effect of solute concentration and magnetic fields
Dendrite spacing obtained on freezing aqueous solutions increases Iinearly with solute concentration. Figure 14 shows this for sodium chloride solutions. Similar effects have been observed in unidirectional samples frozen from potassium chloride (Fig. 10), sodium chloride and lithium chloride solutions. Solute concentration has been found to have a similar effect on dendrite spacings obtained on freezing of metallic solutions (Reference RohatgiRohatgi, unpublished [a]).

Fig. 14. Variation of dendrite spacing and dendrite morphology with solute concentration in sodium chloride droplets
The relationship between dendrite spacing, L, and solute concentration,
where K 3 and K′3 are constants.
The observed increase of dendrite spacing with solute concentration means that (Equations (5) and (6)) supersaturation ΔC and supercooling ΔT in interdendritic liquid increase with solute concentration in the following manner:

The transverse growth velocity, V, of dendrite surfaces increases with solute concentration.
At a fixed freezing rate an increase in solute concentration above a critical value leads to development of side branches on ice platelets (Reference Rohatgi and AdamsRohatgi and Adams, 1965). Curve B in Figure 14 shows that up to sodium chloride concentrations of 1.2N, and at a freezing rate of 0.006 sec−1, the ice plates have perfectly smooth sides (Fig. 15) but at higher solute concentrations the plates develop serrations and distinct side branches (Fig. 16).

Fig. 15. 0.2N sodium chloride solution droplet. Freezing rate 0.36 min−1, × 23

Fig. 16. 3.0N sodium chloride solution droplet. Freezing rate 0.36 min−1, × 23
The effect of a magnetic field at different solute concentrations is demonstrated by comparison of curves A and B in Figure 14. In all respects, imposition of a magnetic field is equivalent to increasing sodium chloride concentration; it increases the dendrite spacing and promotes the development of side branches on ice plates.
Structures from mixed solutions
Freezing of multi-component solutions involves the simultaneous rejection of more than one solute species at the solid-liquid interface. These solutions more closely simulate natural saline waters which generally contain several solutes. Solutions containing more than one solute (Reference Rohatgi and AdamsRohatgi and Adams, 1965; Reference BrushBrush, unpublished) freeze dendritically in the same manner as single-solute solutions.
Studies with solutions from the family NaCl-KCl-LiCl-H2O suggest the following trends in dendritic structure:
-
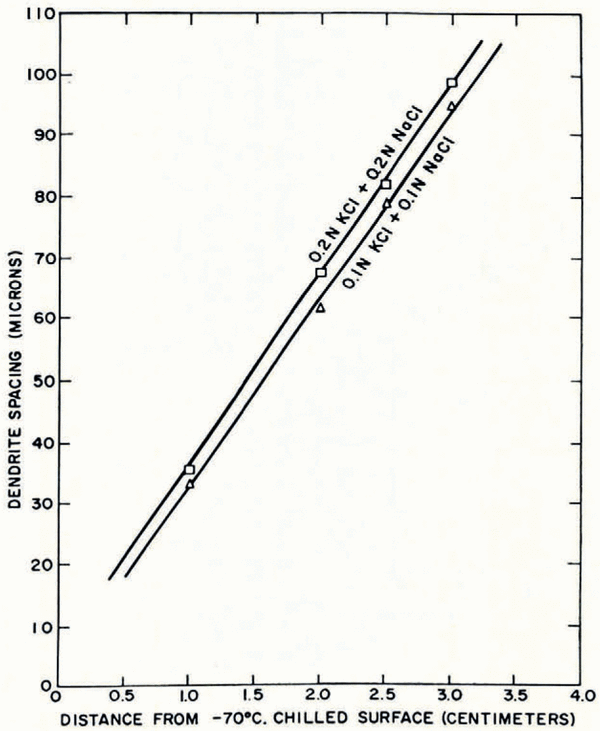
i. If two solutes are present in equal amounts, the dendrite spacing lies between the values obtained with individual solutions in which each solute is present at its same concentration (Fig. 17).
-
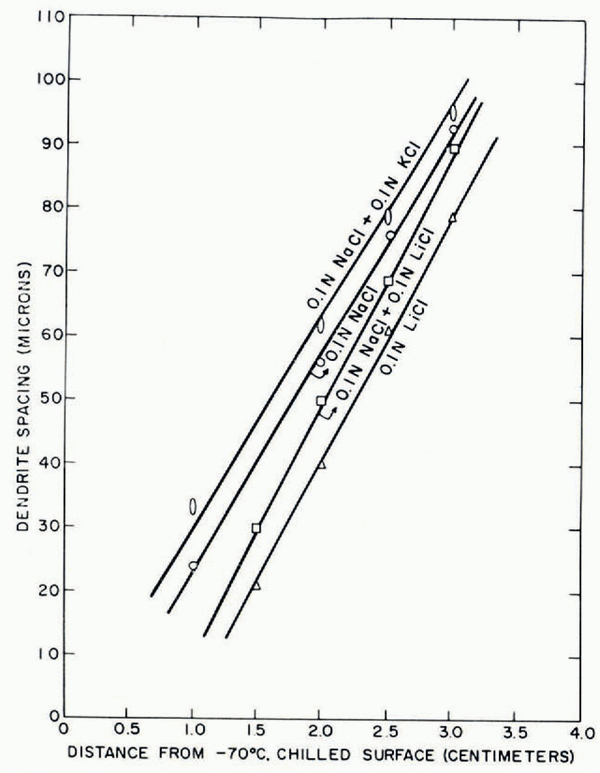
ii. The solute present in large concentrations tends to govern the dendrite spacing; small additions of other solutes cause a relatively small shift in the dendrite spacing. If the secondary solute has a higher diffusivity than the principal solute, dendrite spacing is increased and vice versa. Figure 18 shows small additions of a faster-moving potassium chloride cause an increase in the dendrite spacing obtained in a sodium chloride solution, whereas additions of a slower-moving lithium chloride decrease dendrite spacing.
-
iii. In solutions containing the constituent solutes in a fixed ratio, spacing is larger the greater is the total solute concentration (Fig. 19).

Fig. 17. Effects of additions of equal amounts of a second. solute on the dendrite spacings obtained with 0.1N sodium chloride and 0.1N lithium chloride solutions

Fig. 18. Effect of small additions of a second solute on dendrite spacings in unidirectional samples from 0.2N sodium chloride solutions

Fig. 19. Increase in dendrite spacing with tolal solute concentration in ternary solutions containing equal amounts of potassium chloride and sodium chloride
Conclusions
-
Binary, ternary and quaternary aqueous solutions freeze as groups of parallel plate-shaped dendrites of pure ice separated by layers of brine.
-
In systems where the freezing rate remains constant over the entire solidification cycle, the dendrite spacing is proportional to the square root of the freezing time.
-
In unidirectional growth from a constant-temperature chill, the solution at each location is subjected to a spectrum of freezing rates. The freezing rate starts low, goes through a maximum and then decreases to the end of solidification. The dendrite spacing increases Iinearly with distance from the chill surface; at each location dendrite spacing is inversely proportional to the square root of the maximum freezing rate.
-
Interdendritic supersaturation, ΔC, or supercooling, ΔT, are independent of freezing rate
-
An increase in solute concentration causes an increase in the dendrite spacing and, at relatively high concentrations, side branching of primary dendrites takes place.
-
In binary solutions dendrite spacing increases linearly with solute diffusivity at fixed values of concentration and freezing rate.
-
When more than one solute is present in solution, dendrite spacing is governed by the concentration and the diffusivity of each of the solutes.
-
Application of external magnetic fields causes an increase in dendrite spacing and promotes the development of side branches on ice plates.


