


1. INTRODUCTION
Anomalously high summer temperatures over the last few decades have resulted in sharply increased mass losses of glaciers and ice caps in the Canadian Arctic Archipelago (CAA), particularly since 2005 (Gardner and others, Reference Gardner2011; Harig and Simons, Reference Harig and Simons2016). Between 2003 and 2009, glaciers and ice caps of Baffin and Bylot Islands in the southern CAA lost mass at an area-averaged rate 1.6 times greater than glaciers in the northern CAA (Gardner and others, Reference Gardner, Moholdt, Arendt and Wouters2012). Projections by a coupled atmosphere/snow model forced with the IPCC's moderate RCP4.5 greenhouse gas emission scenario forecast sustained and irreversible glacier mass losses in the CAA, increasing from −51 ± 26 Gt a−1 over the period 2000–11 to −144 ± 33 Gt a−1 by the end of the 21st century, resulting in a projected 18% loss of the current ice volume (Lenaerts and others, Reference Lenaerts2013).
A major unresolved question in assessing the response of Arctic glaciers to climate change is whether they will speed up or slow down as surface melt rates increase. Observations of short-term, high velocity events on some parts of the Greenland ice sheet (GIS) in summer (Zwally and others, Reference Zwally2002) have led to concerns that accelerated ice motion may occur as the climate warms and surface melt rates increase. In turn, this could produce dynamic thinning (Alley and others, Reference Alley, Clark, Huybrechts and Joughin2005) and greater drawdown of ice from the interior, resulting in increasing mass wasting rates in response to future warming (Parizek and Alley, Reference Parizek and Alley2004). Several studies support the short-term speedup mechanism initially proposed by Zwally and others (Reference Zwally2002), in that delivery of surface meltwater to the ice-sheet bed results in an over-pressurized basal drainage network, reduced basal friction and a short-term increase in ice motion. For example, Bartholomew and others (Reference Bartholomew2012) measured pronounced multiday speedup events inferred to be forced by rapid variations in meltwater input to the subglacial system from diurnal and weather-related fluctuations. Similarly, Fitzpatrick and others (Reference Fitzpatrick2013) measured a dramatic acceleration (100% over 11 days) on the lower portion of an outlet glacier, located on the western sector of the GIS, 4 days after the onset of melt. Similar positive relationships between melt and short-term velocity variations have been observed on temperate and polythermal valley glaciers (Iken, Reference Iken1981; Mair and others, Reference Mair2003; Copland and others, Reference Copland, Sharp, Nienow and Bingham2003b) .
However, other recent studies indicate that the relationship between increased surface melt rates and glacier velocities is not straightforward. For example, Sundal and others (Reference Sundal2011) found a positive correlation between surface melt rates and peak velocities during early summer (~May to mid-July) for land-terminating glaciers in southwestern Greenland over a 5 year period, but found that mean summer velocity was lower during high melt years. A slow-down occurred when a critical amount of meltwater entered the ice sheet, causing a switch to a channelized subglacial drainage network. In years with high surface melting this switch occurred earlier in the summer, resulting in lower mean summer ice velocities compared with years with less melt. Simulations using subglacial hydrology models support this pattern as they show that when the subglacial water inputs exceed a critical rate, subglacial channelization occurs rapidly (Schoof, Reference Schoof2010; Banwell and others, Reference Banwell, Hewitt, Willis and Arnold2016). Other studies have identified a relationship between high summer melt rates and the evolution of a more efficient subglacial drainage system, which results in lower velocities the following winter (Burgess and others, Reference Burgess, Larsen and Forster2013; Sole and others, Reference Sole2013; Tedstone and others, Reference Tedstone2013). Long-term (≥8 years) ice motion measurements from a land-terminating region of the western GIS (Tedstone and others, Reference Tedstone2015) and many other non-surging glaciers elsewhere (van de Wal and others, Reference van de Wal2008; Heid and Kääb, Reference Heid and Kääb2012b; Waechter and others, Reference Waechter, Copland and Herdes2015; Thomson and Copland, Reference Thomson and Copland2017) also reveal decreasing ice velocities despite an overall increase in temperature and surface melt rates.
In the northern CAA, Van Wychen and others (Reference Van Wychen2016) found a deceleration of several major tidewater glaciers since ~2011, but two more than doubled their speed between 1999 and 2015, despite being non surge-type, and now account for ~62% of the total dynamic (iceberg) discharge from all ice masses in the northern CAA. Other measurements in the same region have identified ice velocity variations on timescales of years to decades, some of which are related to glacier surging (e.g. Copland and others, Reference Copland, Sharp and Dowdeswell2003a, Reference Copland, Sharp, Nienow and Binghamb; Williamson and others, Reference Williamson, Sharp, Dowdeswell and Benham2008; Van Wychen and others, Reference Van Wychen2012, Reference Van Wychen2014). Together, these studies indicate that glacier velocities vary considerably across the Canadian Arctic, but it is currently unclear if observed long-term variations are related to contemporary changes in climate. Large Arctic ice masses can take hundreds of years to respond dynamically to a change in mass balance (Oerlemans, Reference Oerlemans2005), so it is possible that the recent changes in ice motion may represent a delayed response to climate variations in the distant past, rather than an immediate response to current changes in surface melt rates and/or marine conditions (e.g. ocean temperature, sea-ice extent). Understanding this connection is important for projecting future changes in ice motion, and resulting glacier mass changes.
In this study, we present a multi-decadal record of ice velocity variations since the 1950s on Penny Ice Cap (PIC), the largest land ice mass on Baffin Island, using optical and radar remote sensing imagery updated to 2014, as well as comparisons of these data with earlier, historical field measurements. In an earlier study, Heid and Kääb (Reference Heid and Kääb2012b) used repeat satellite optical imagery to assess velocity changes for parts of 12 outlet glaciers on PIC between 1985 and 2011. The present study examines velocity variations across the whole of PIC in much greater detail over the same period by producing a complete ice-cap wide velocity map for 2011/12, and mapping ice motion along the centre flow lines and several transverse profiles for key outlet glaciers, rather than at a limited set of point locations, as was done by Heid and Kääb (Reference Heid and Kääb2012b). The acquired velocity data are also compared with in situ mass-balance data, and to estimates of ice mass loss obtained with a time-varying mass-balance model. These comparisons provide insights into the causes and patterns of ice velocity variability on one of the largest ice caps in the CAA over the past 30–60 years.
2. STUDY SITE
PIC (67°N, 66°W) is the southernmost large Canadian Arctic ice cap, covering an area of ~6300 km2 (Fig. 1). Higher topography and relief dominate the eastern side of the ice cap, which reaches a maximum elevation of ~1930 m at its summit. Toward the west, elevations decrease gradually and PIC terminates in a broad, gently sloping lobe-like region. Major outlet glaciers radiate from the ice cap interior through deeply-incised valleys toward the north, east and south. Two of these outlet glaciers are tidewater terminating: Coronation Glacier in the south-east, and an unnamed glacier in the north-central sector (Glacier 3). These glaciers discharge 10.6 and 9.3 Mt a−1, respectively, which accounted for 0.23% of the total mass loss over PIC in 2011 (Van Wychen and others, Reference Van Wychen, Copland, Burgess, Gray and Schaffer2015). The mean, maximum and minimum air temperatures measured by an automatic weather station (AWS) at the PIC summit between 1 August 2007 and 31 July 2008 were −15.4, 2.9 and −42.9°C, respectively. Annual surface mass balance (SMB) measurements have been conducted on PIC since 2006 along three survey lines (designated 100, 200 and 300; Fig. 1). Based on these measurements, the mean equilibrium line altitude (ELA) between 2006 and 2014 was ~1646 m, varying between ~1320 m in low mass loss years to 1820 m during high mass loss years. The average SMB along the 100 survey line (Fig. 1), which covers an elevation range 329–1817 m, was −1.3 m w.e. a−1 between 2007 and 2014, but varied from −0.8 to −1.7 m w.e. a−1 during low and high mass loss years, respectively. The maximum ice thickness measured on PIC by a NASA airborne radar in 2013 was 880 m at a point ~5.5 km northwest of the mass balance stake P106 (Fig. 1; Shi and others, Reference Shi2010). The average dates for the onset and end of the summer melt period between 2007 and 2010, determined from passive microwave data, were ~23 May and ~3 September, respectively (Personal communication from F. Dupont, 2015). These same data reveal that the average melt season length on PIC nearly doubled between 1979 and 2010 (Zdanowicz and others, Reference Zdanowicz2012). Shallow cores also show that the mean density in the accumulation area of the ice cap has been increasing since the mid-1990s due to the formation of thick infiltration ice layers in the firn. Deep meltwater percolation has caused the 10 m firn temperatures to rise by ~10°C between the mid-1990s and 2011. In situ measurements from 2007 to 2011 indicate a surface lowering of 3–4 m a−1 as a result of surface mass loss near the ice cap margin, which are among the largest thinning rates reported in the Canadian Arctic (Zdanowicz and others, Reference Zdanowicz2012).
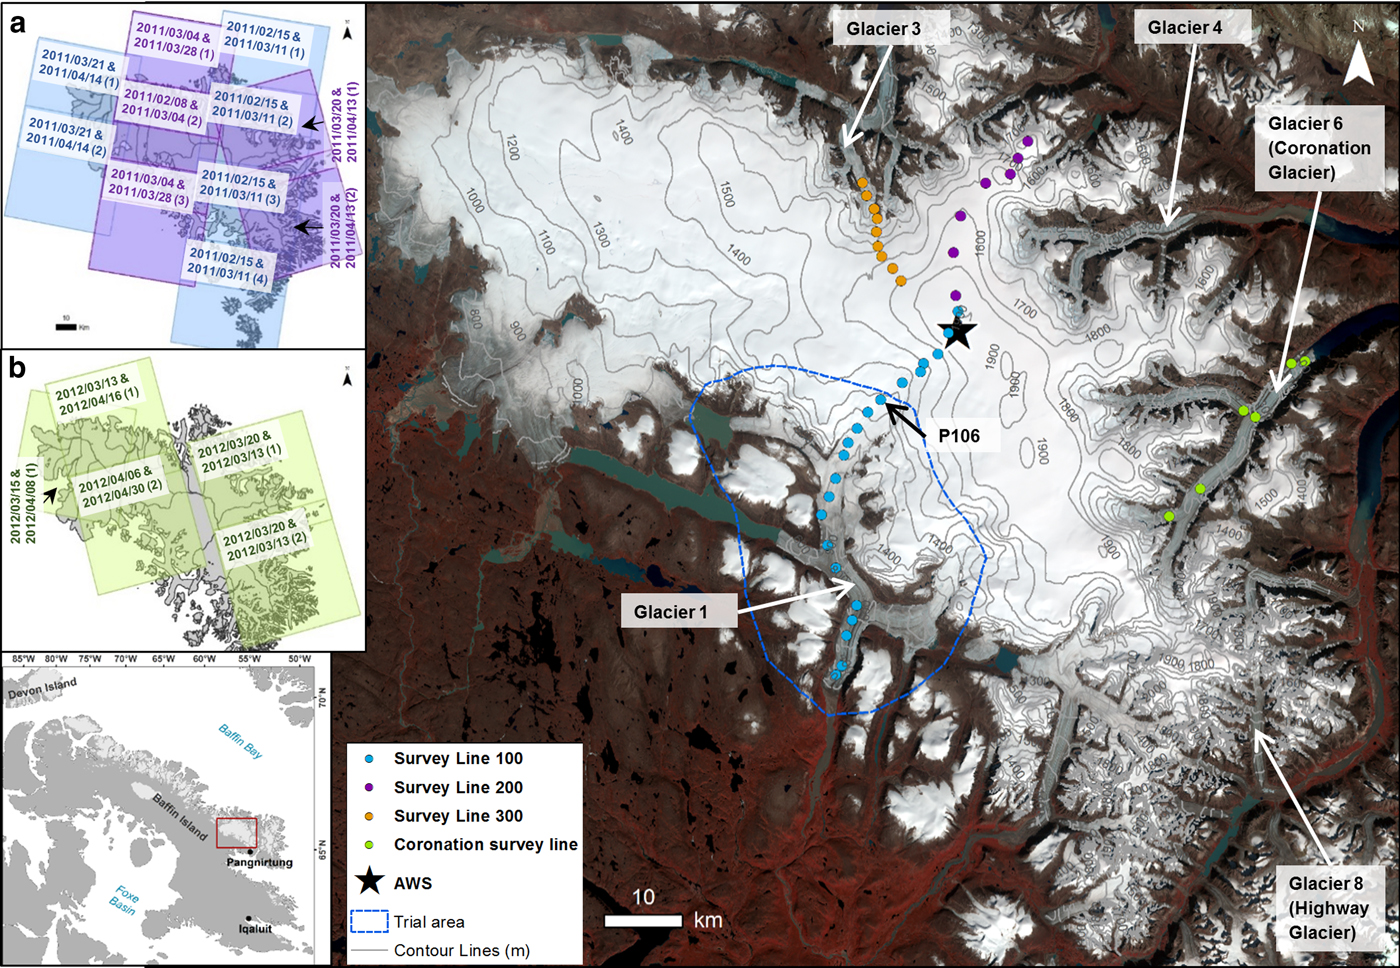
Fig. 1. Map of PIC (67°N, 66°W) with mass-balance survey lines, automatic weather station (AWS; star) and the block size trial area (blue polygon). RADARSAT-2 image pair footprints used to produce the velocity map shown in Figure 3 are included as insets for the (a) 2011 fine beam and (b) 2012 ultrafine beam images. Background image: Landsat 5, 19 August 1985.
The first ice velocity measurements on PIC were carried out by the Arctic Institute of North America (AINA) using a theodolite during July and August 1953 at eight mass-balance stakes on Highway Glacier (Baird, Reference Baird1953). Surface velocity was also inferred from the displacement of a medial moraine seen on 1948 air photos and surveyed in 1953. These studies showed that Highway Glacier (Fig. 1) was moving at ~60 m a−1 in the early 1950s. Between 1962 and 1965, surface velocities measured near the current location of the summit AWS (Fig. 1) were just over ~1.3 m a−1 (Weber and Cooper, Reference Weber and Cooper1993). A broader assessment of velocities was completed by Heid and Kääb (Reference Heid and Kääb2012b) using approximately annually separated optical satellite image pairs acquired in late summer (July or August) 1985–87 and 2009/10 over parts of 12 outlet glaciers. Their results showed a mean decrease in ice motion of 25% per decade, with the greatest change of more than −20 m a−1 on Coronation Glacier, Glacier 1 and Glacier 4 (Fig. 1). Heid and Kääb (Reference Heid and Kääb2012b) also investigated ice motion during an intermediate period (1997/98) and found that average speeds had increased by 1.5 m a−1 between 1985–87 and 1997/98, then decreased by 11.3 m a−1 between 1997/98 and 2009/10 over the 12 outlet glaciers measured. More recently, Van Wychen and others (Reference Van Wychen, Copland, Burgess, Gray and Schaffer2015) used speckle-tracking of winter 2010/11 ALOS PALSAR Synthetic Aperture Radar satellite data to show that the interior and the western sectors of PIC were slow-moving (<40 m a−1). Topographically constrained outlet glaciers that connect with large areas of accumulation in the interior had the highest velocities, ranging from ~100 to 120 m a−1, with the fastest movement in areas of highest relief. In contrast to Barnes Ice Cap (central Baffin Island) and Bylot Island Ice Cap, none of the outlet glaciers on PIC appear to be surge-type (Van Wychen and others, Reference Van Wychen, Copland, Burgess, Gray and Schaffer2015), making this ice cap a more suitable site to investigate the relationship between climate and ice motion.
3. DATA AND METHODS
We calculated surface ice velocity on PIC for each decade from the mid-1980s to 2014 via feature tracking of approximately annually-separated optical satellite imagery and, for winter 2011/12, via speckle tracking of RADARSAT-2 data. The seasonal and interannual variability was quantified, and ice velocity changes were compared with SMB changes. In addition, our measurements were compared with those made on Highway Glacier in the 1950s.
3.1. Feature tracking (optical imagery)
Surface velocities on PIC were derived from the mid-1980s to 2014 by comparing pairs of late summer (9 July–1 September), cloud-free images from both Landsat TM (30 m resolution) and ETM+ (15 m resolution). Whenever possible, the higher resolution ETM+ imagery was used (Table 1). Images ~1 year apart were preferentially selected to minimize the effect of seasonal velocity fluctuations on estimates of mean annual displacement. All Landsat images were downloaded from the United States Geological Survey data portal (http://earthexplorer.usgs.gov) in orthorectified (Level 1T) format, and image pairs were always matched with the same path and row to minimize distortion errors. Feature tracking requires good visual contrast in the images, so the analysis was generally restricted to the ablation area and crevassed parts of the accumulation area.
Table 1. Optical image pairs used in this study
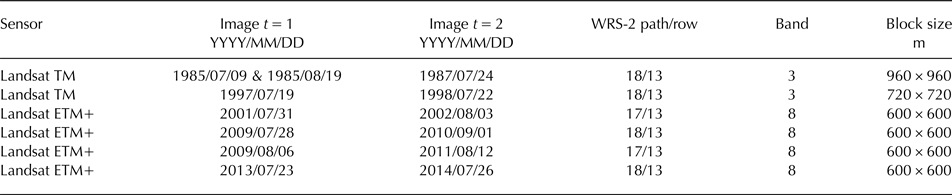
Path/row refers to the Landsat Worldwide Reference System 2 (WRS-2). The optimal band and block size (m) used for the velocity matching of each image pair were obtained from a ~40 km2 test area covering Glacier 1 (see Fig. 1 for location).
Features visible in any two Landsat images were tracked using automatic matching of image pairs with a cross-correlation method that operates in the frequency domain using oriented (complex) images (CCF-O), called orientation correlation (Fitch and others, Reference Fitch, Kadyrov, Christmas and Kittler2002). This method performed best in a global evaluation of glacier feature tracking methods that are effective on striped Landsat 7 images (Heid and Kääb, Reference Heid and Kääb2012a). The outer portions of Landsat 7 images are striped from 31 May 2003 onwards due to the failure of the scan line corrector (http://www.lta.cr.usgs.gov/LETMP). The image correlation software CIAS (Kääb and Vollmer, Reference Kääb and Vollmer2000; Heid and Kääb, Reference Heid and Kääb2012a), which includes CCF-O, was used for the optical image analyses (http://www.mn.uio.no/geo/english/research/projects/icemass/cias).
CCF-O converts Landsat images to oriented images, where each pixel is a complex number that represents the orientation of the intensity gradient (Fitch and others, Reference Fitch, Kadyrov, Christmas and Kittler2002; Heid and Kääb, Reference Heid and Kääb2012a). The oriented images are matched by systematically correlating a block of pixel values in the first image with the same size block moved repeatedly within a larger window size in the second image. Cross correlation is operated in the frequency domain and a cross-correlation surface, representing matches between the reference block in the first image and the block position within the window in the second image, is produced. The peak of this cross-correlation surface represents the best match from which the displacement between the blocks is calculated.
We determined an optimal image matching block size and Landsat band for each image pair after testing various options on a trial area of ~40 km2 (Fig. 1; Table 1). A search area twice the block size and a velocity vector spacing of 120 m were used for all image pairs. Point velocity mismatches were removed from the dataset (Section 3.3) and the remaining vectors were interpolated to a raster with 120 m grid spacing using the point to raster conversion tool in ArcMap 10.3.1. Final rasters were clipped to PIC using the Randolph Glacier Inventory glacier outline version 4.0 (Pfeffer and others, Reference Pfeffer2014). Velocities along centre flow line and transverse profiles on the major outlet glaciers of PIC were extracted from the rasters for every decade of the study period to quantify changes in ice motion through space and time.
3.2. Speckle tracking (radar imagery)
To investigate the recent spatial variability in ice motion in areas where optical image matching does not work (e.g., the accumulation area), we produced an ice cap-wide map of glacier motion from speckle tracking of RADARSAT-2 data. Scenes were acquired from the Canadian Space Agency every 24 days between 5 February and 28 April 2011, and 13 March to 26 April 2012. Images from a period of below-freezing temperatures (hereafter: ‘winter’) were selected to maximize coherence, which can be hampered when there is surface melt or snowfall between scenes. In total, 11 image pairs from 2011 (fine beam; 8 m resolution) and five image pairs from 2012 (ultrafine beam; 3 m resolution) were used to cover the entire ice cap (Table 2; Fig. 1). Whenever possible, the higher resolution 2012 images were prioritized for fast flowing areas.
Table 2. RADARSAT-2 image pairs used in this study
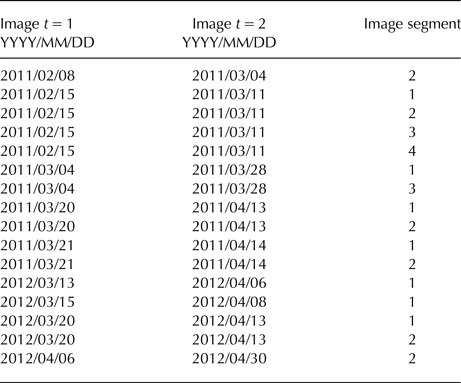
The 2011 imagery is fine beam (8 m resolution), while the 2012 imagery is ultrafine beam (3 m resolution). See Figures 1a, b for image footprints.
Ice surface motion was determined using a custom-written Matlab speckle-tracking code based on that used by Short and Gray (Reference Short and Gray2005), modified to process RADARSAT-2 data (Van Wychen and others, Reference Van Wychen2014). The program tracks the relative displacement of small image chips by applying a two-dimensional cross-correlation algorithm to accurately co-registered image pairs (co-registration was completed using an area cross-correlation technique; Gray and others, Reference Gray, Short, Mattar and Jezek2001). If there is good coherence between image pairs, the radar speckle in the two image chips will be correlated and a calculation of relative displacement can be made. If obvious features are present (e.g. crevasses), the program will track the displacement of those features instead (Short and Gray, Reference Short and Gray2005). Displacements were calculated for both azimuth and range directions using chip sizes of ~453 m in azimuth and ~688 m in range for the fine beam imagery, and ~177 m in azimuth and ~188 m in range for the ultrafine beam imagery. These chip sizes were chosen to provide a balance between high noise at small chip sizes and lack of velocity detail at large chip sizes. The Canadian Digital Elevation Dataset (1 : 250,000, Level 1) was used to remove the topographic component of the slant-range displacement. Displacements were calibrated using manually selected areas of zero motion, such as bedrock outcrops, to remove systematic biases due to inaccuracies in the baseline or squint effects during image acquisition (Gray and others, Reference Gray, Short, Mattar and Jezek2001).
Final displacements were converted to annual velocities. Image pair results with the least number of mismatches were selected, prioritizing the higher resolution 2012 results for fast flowing areas (Fig. 1). Point velocities were filtered to remove mismatches (Section 3.3), merged into one file and interpolated to 100 m grid spacing using the inverse-distance weighting method with a fixed 500 m search radius in ArcMap 10.3.1. The final raster was clipped to the area of PIC using the outline provided by the Randolph Glacier Inventory version 4.0 (Pfeffer and others, Reference Pfeffer2014).
3.3. Filtering velocity vectors
Incorrect matches are occasionally produced by the feature tracking and speckle-tracking algorithms when there are no repeatable patterns to track or if there is a pattern shift not associated with glacier movement. For example, a lack of patterning can occur if there is snow cover present for feature tracking, or if there is a lack of coherence due to snowfall or melt between repeat images used for speckle tracking. Velocity vector outputs from feature and speckle tracking were therefore checked manually and filtered in ArcMAP, following the methodology of Copland and others (Reference Copland2009), Van Wychen and others (Reference Van Wychen2014) and Waechter and others (Reference Waechter, Copland and Herdes2015). Three criteria were used for filtering:
(a) The direction of ice motion should follow surface flow features (e.g. medial moraines) and topography where motion is constrained;
(b) The ice motion direction or magnitude should not change dramatically (~≥45°) over short distances;
(c) Motion should generally be faster at the centre of the glacier than at the margins.
The filtering was partially automated by finding the area with the highest velocities in a region of interest (e.g. an outlet glacier) and calculating the 99% confidence interval for the fastest flowing part of the region. Point velocities that fell outside the 99% confidence interval were automatically removed. Remaining vectors were then manually removed if they (a) did not meet two or more of the criteria outlined above or (b) did not meet one of the criteria and there was no plausible reason for the anomalous vector(s).
3.4. Error analysis
The accuracy of the CCF-O matching method is stated as ~1/10 of a pixel (Heid and Kääb, Reference Heid and Kääb2012a). In Landsat images, the pixel noise limits the image-to-image registration accuracy to ~5 m for the ETM+ sensor (Lee and others, Reference Lee, Storey, Choate and Hayes2004) and ~6 m for the TM sensor (Storey and Choate, Reference Storey and Choate2004). In this study, the apparent motion of 703,902 points located on ice-free stable ground was, on average, 5.4 m a−1, and ranged from 3.5 to 9.2 m a−1 depending on the image pair (Table 3). We assume that this provides a representative error for our study, encompassing the effects from all sources. This error level enables an effective determination of glacier motion since the speed of most outlet glaciers on PIC (~100–120 m a−1) far exceeds this amount.
Table 3. Error estimates for surface ice velocities on PIC determined from apparent motion over stationary areas (bedrock (BR) and ice divides (ID)) for both feature tracking (optical imagery) and speckle tracking (SAR)
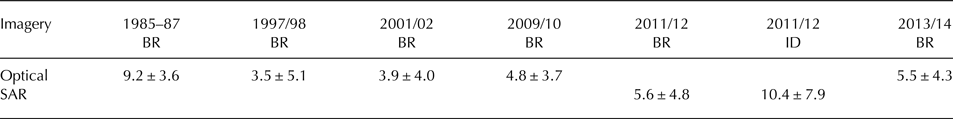
Values represent the average ice motion, while error values are the standard deviation. All values are in m a−1.
Errors associated with the speckle tracking method and associated cross-correlation technique are discussed in Gray and others (Reference Gray, Short, Mattar and Jezek2001), Joughin (Reference Joughin2002), Short and Gray (Reference Short and Gray2004) and Van Wychen and others (Reference Van Wychen2012). For 24-day repeat imagery with good coherence, speckle tracking provides velocity errors of 2–10 m a−1 in the Canadian Arctic (Short and Gray, Reference Short and Gray2005). In heavily crevassed, faster-flowing regions, the program switches to feature tracking with errors of ~10–20 m a−1 (Short and Gray, Reference Short and Gray2005). Based on 130,727 measurements of apparent motion over bedrock areas, the mean error associated with speckle tracking of RADARSAT-2 data over PIC was 5.6 m a−1. For 13,233 measurements along ice divides where zero horizontal motion was assumed, the mean error was 10.4 m a−1 (Table 3). Ice divides delineated in version 4.0 of the Randolph Glacier Inventory were used for this analysis. The estimated errors over bedrock and ice divides are sufficiently low to confidently map the ice motion over all major outlet glaciers on PIC and provide meaningful results in slower moving areas.
3.5. Seasonal and interannual variability
Glacier motion varies seasonally and from year to year in response to short-term fluctuations in meltwater availability, among other factors. To evaluate if the observed long-term (decadal) velocity changes were meaningful, we quantified the ice motion variability on interannual and seasonal timescales.
The interannual variability was calculated from in situ dual-frequency GPS (dGPS) measurements collected between 2011 and 2014 along three mass-balance transects (Fig. 1; Table 4), and by optical matching of Landsat images from 2008 to 2014 (Table 1). Velocities measured using these methods along a glacier centre flow line were used to compute the standard deviation (σ), corrected for the total number of measurements (n) at each location. The 95% confidence interval, representing the interannual variability, was then calculated from  $1.96(\sigma /\surd n)$.
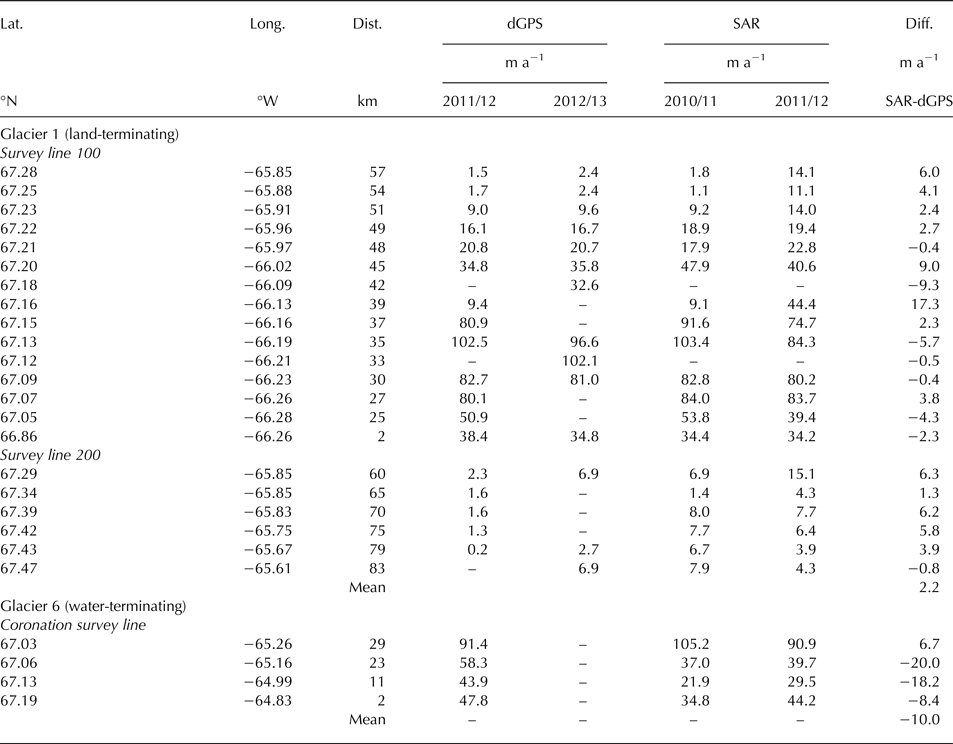
Table 4. Comparison of displacements derived from in situ dGPS (annual) and satellite derived ice motion (winter) for Glaciers 1 and 6 (location of dGPS stations denoted in Fig. 1). The latitude (lat.), longitude (long.), distance from the glacier terminus (dist.), velocities at each stake location (dGPS), corresponding SAR velocity (SAR) and the difference in velocity between the dGPS and SAR datasets (Diff.) are provided
To estimate the seasonal variability, we computed the difference between the annual motion derived from the in situ dGPS measurements, and the winter synthetic aperture radar (SAR) velocities derived from the RADARSAT-2 (2011/12) data processed for this study and from the ALOS PALSAR (2010/11) data processed by Van Wychen and others (Reference Van Wychen, Copland, Burgess, Gray and Schaffer2015). The SAR velocity values at each dGPS measurement location were extracted and the difference between the annual dGPS and winter SAR velocities, standardized to annual values, were calculated. The total short-term variability was calculated from the root sum of squares of the interannual and seasonal variability, assuming the two terms to be uncorrelated.
3.6. Mass balance
To assess potential controls on long-term variations in ice motion, we calculated annual in situ SMB from the 100 survey line between 2007 and 2014 (Fig. 1), and also used estimated SMB outputs from 1958 to 2014 from the regional atmospheric climate model RACMO2.3 (Lenaerts and others, 2012; Noël and others, Reference Noël2015). The RACMO2.3 model is forced by ERA-interim, the most recent reanalysis data from the European Centre for Medium-Range Weather Forecasts. It includes a scheme for snow redistribution, and outputs SMB data at a grid resolution of 11 km.
We assessed how well the model represents measured mass balance at PIC by extracting RACMO2.3 SMB at grid cells overlapping each 100 line stake over the period 2007–2014. In situ measurements of SMB along this line were averaged and compared with the RACMO2.3 data against time (Fig. 2). We found that the RACMO2.3 data captured the interannual variability of SMB well, but underestimated the actual magnitude of mass loss. This is likely due to the model averaging of elevation over each 11 km grid cell, which leads to an overestimation of the mean elevation for grid cells with low-lying outlet glaciers, where melt rates are greatest (Personal communication from B. Noel, 2016). We therefore multiplied the RACMO2.3 SMB data by a correction factor of 1.92, which provided the best match to the in situ measurements (r = 0.89) (Fig. 2). The ice cap-wide average SMB was extracted for all grid cells covering PIC and the output was similar in magnitude to the 2007–14 measurements extrapolated from the 100 survey line, and also captured the interannual variability well.
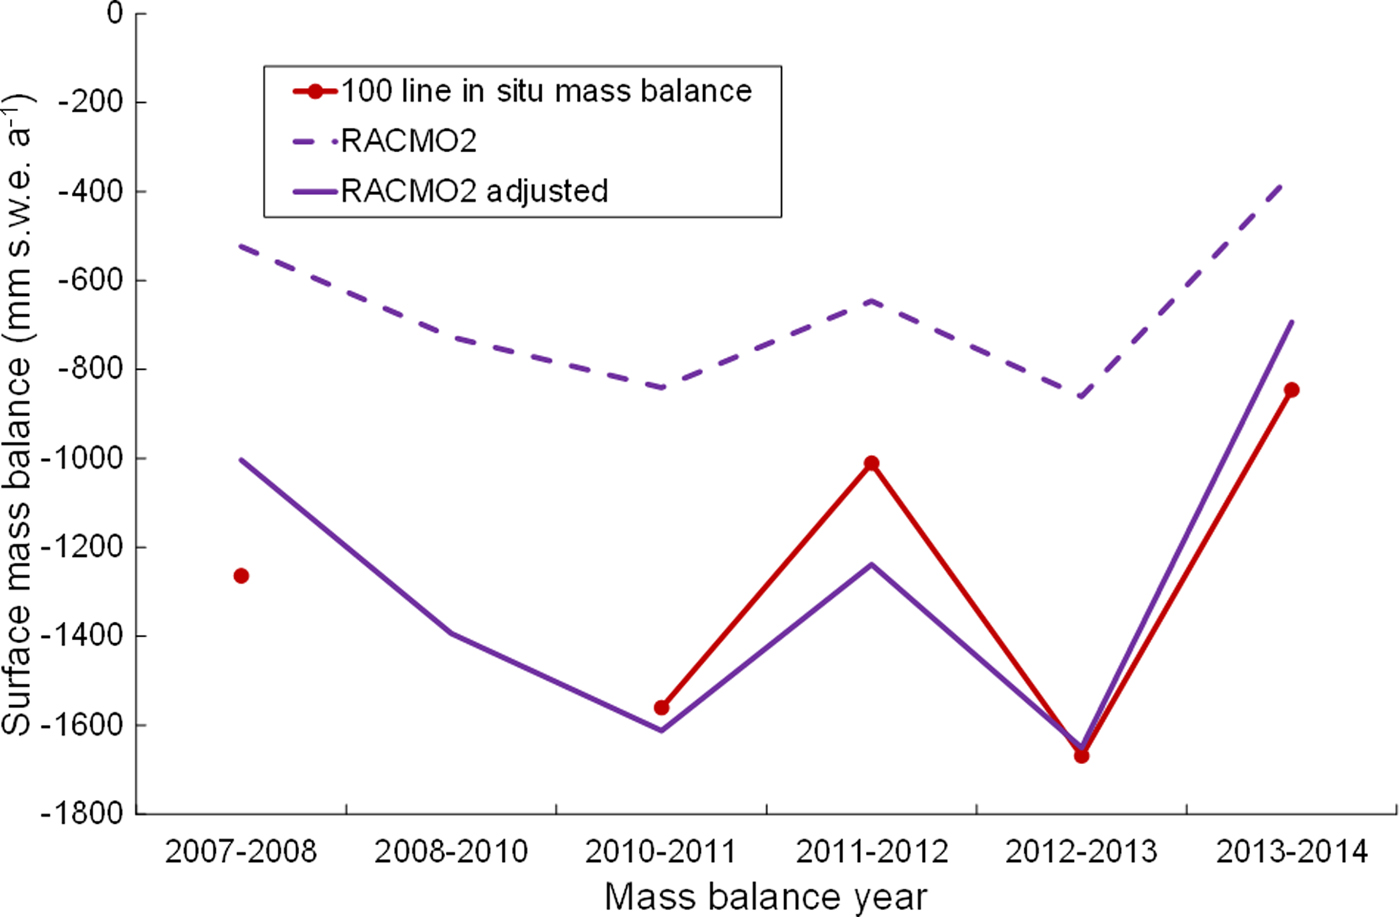
Fig. 2. Comparison of annual mean in situ mass-balance measurements along the 100 survey line on PIC, RACMO2.3 mass-balance outputs for grid cells overlapping each stake on this survey line and the same data multiplied by a correction factor of 1.92 (average in situ SMB/average RACMO2 SMB).
4. RESULTS
4.1. Ice cap-wide velocity patterns
The SAR-derived velocity map of PIC shows that most of the ice cap is slow-moving (<20 m a−1), particularly in high elevation regions in the accumulation area, with faster motion limited to topographically constrained outlet glaciers (Fig. 3). The highest velocities occur in areas of high relief on the upper reaches of outlet glaciers and range from ~100 to 250 m a−1. Low velocities over much of PIC suggest that the ice is frozen to the bed and flowing by internal deformation only, whereas areas of higher velocity likely represent a transition from cold to warm basal conditions as the ice is channelled into topographically constrained valleys, allowing for basal sliding in addition to deformation (Burgess and others, Reference Burgess, Sharp, Mair, Dowdeswell and Benham2005; Van Wychen and others, Reference Van Wychen2016).
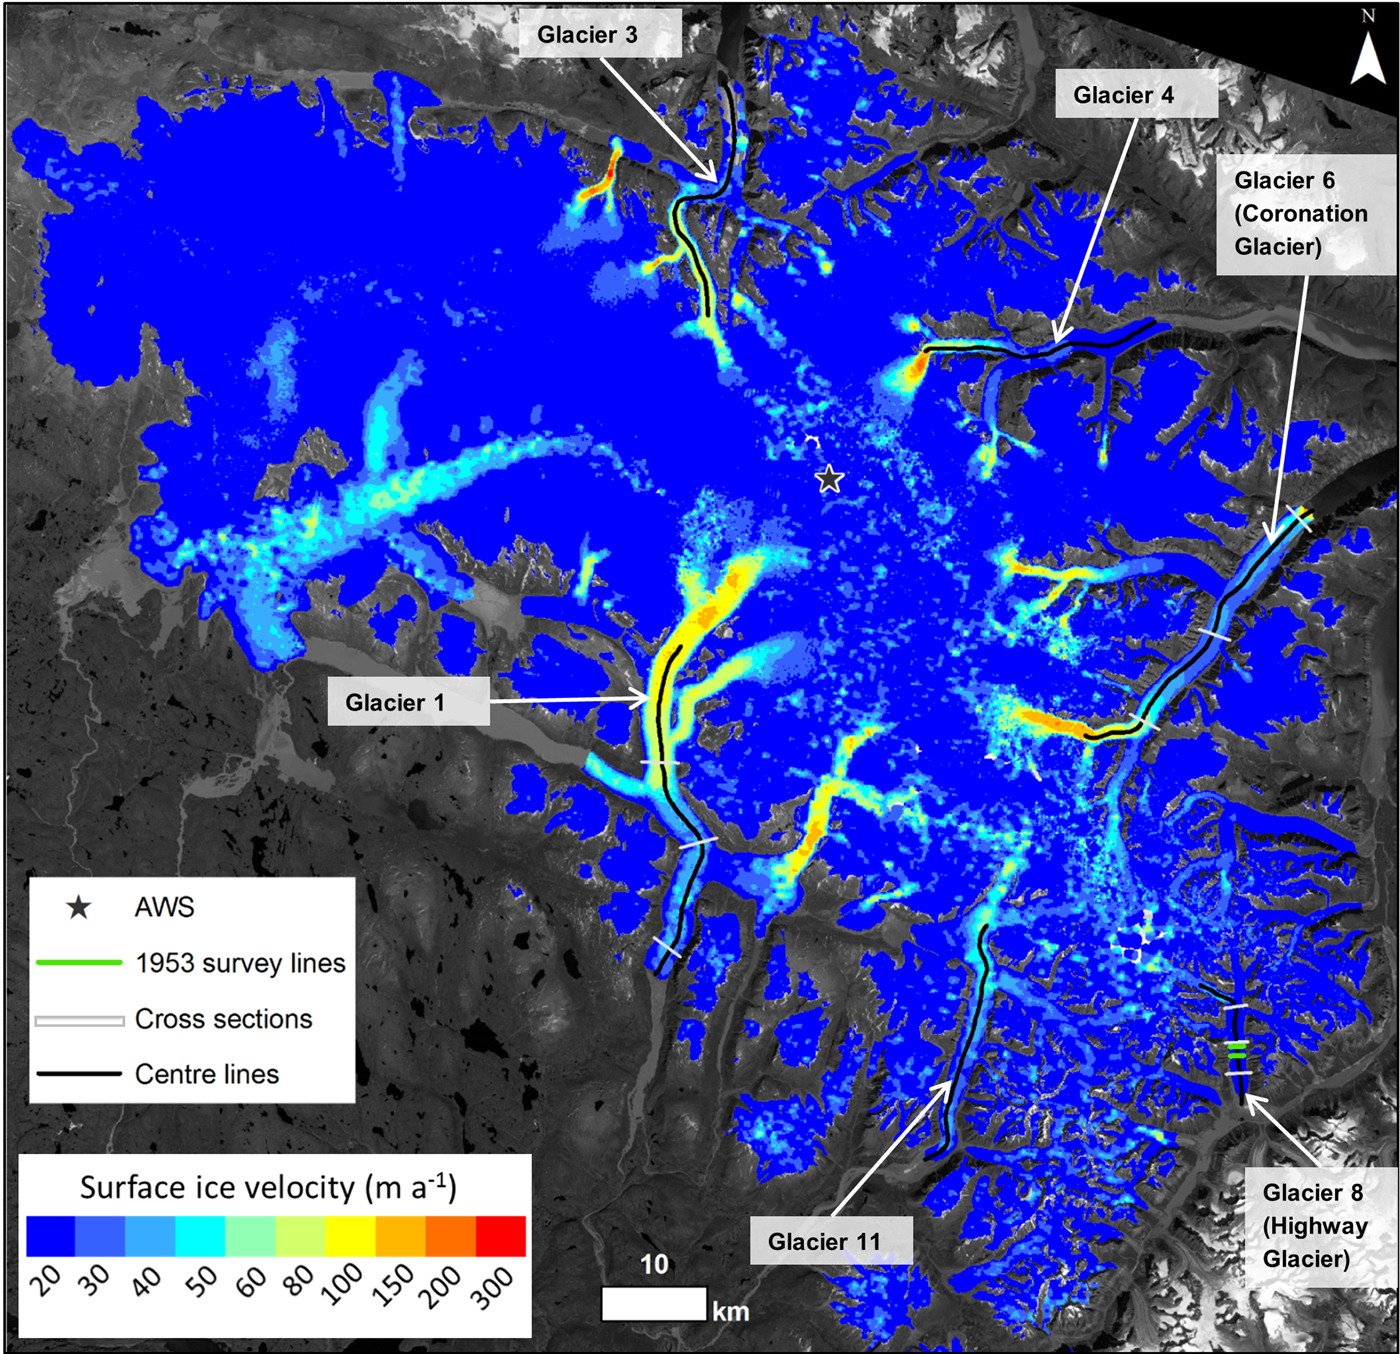
Fig. 3. RADARSAT-2 derived surface velocity map of PIC from images acquired in winter 2011 and 2012 (see Fig. 1). The location of the automatic weather station (AWS; star), glacier cross sections (white bars), centre flow lines (black lines), and sites of velocity measurement from 1953 on Highway Glacier (green bars; Ward, Reference Ward1955) are indicated. Background image: Landsat 5, 22 July 1998.
4.2. Velocity changes through time
The annual velocities derived from optical image matching show clear patterns and temporal changes over most of the major outlet glaciers (Figs 4, 5). Individual velocity vectors align well with glacier flow features, such as medial moraines, which provides confidence in the results (Fig. 4 insets). To visualize the flow patterns, centre flow line velocities were extracted for the ablation area of the six outlet glaciers with the best data coverage between 1985 and 2014: four land-terminating (Glaciers 1, 4, 8, 11) and two tidewater-terminating (Glaciers 3, 6) (Figs 3, 5). For most glaciers, velocities are highest near the top of their ablation areas. The main exception is Glacier 11, which has relatively low overall velocities and does not have a distinct area of high velocity up-glacier. On Glaciers 1, 3 and 6 there is a noticeable decrease or levelling of velocities at 20, 15 and 17 km from the terminus, respectively, associated with areas of relatively flat topography. On Glacier 3, a large peak in velocity at ~17 km likely arose due to the merging of a tributary with the main glacier trunk. Tidewater glaciers show a pronounced increase in velocity at their termini, while land-terminating glaciers show decreasing velocities at their termini.
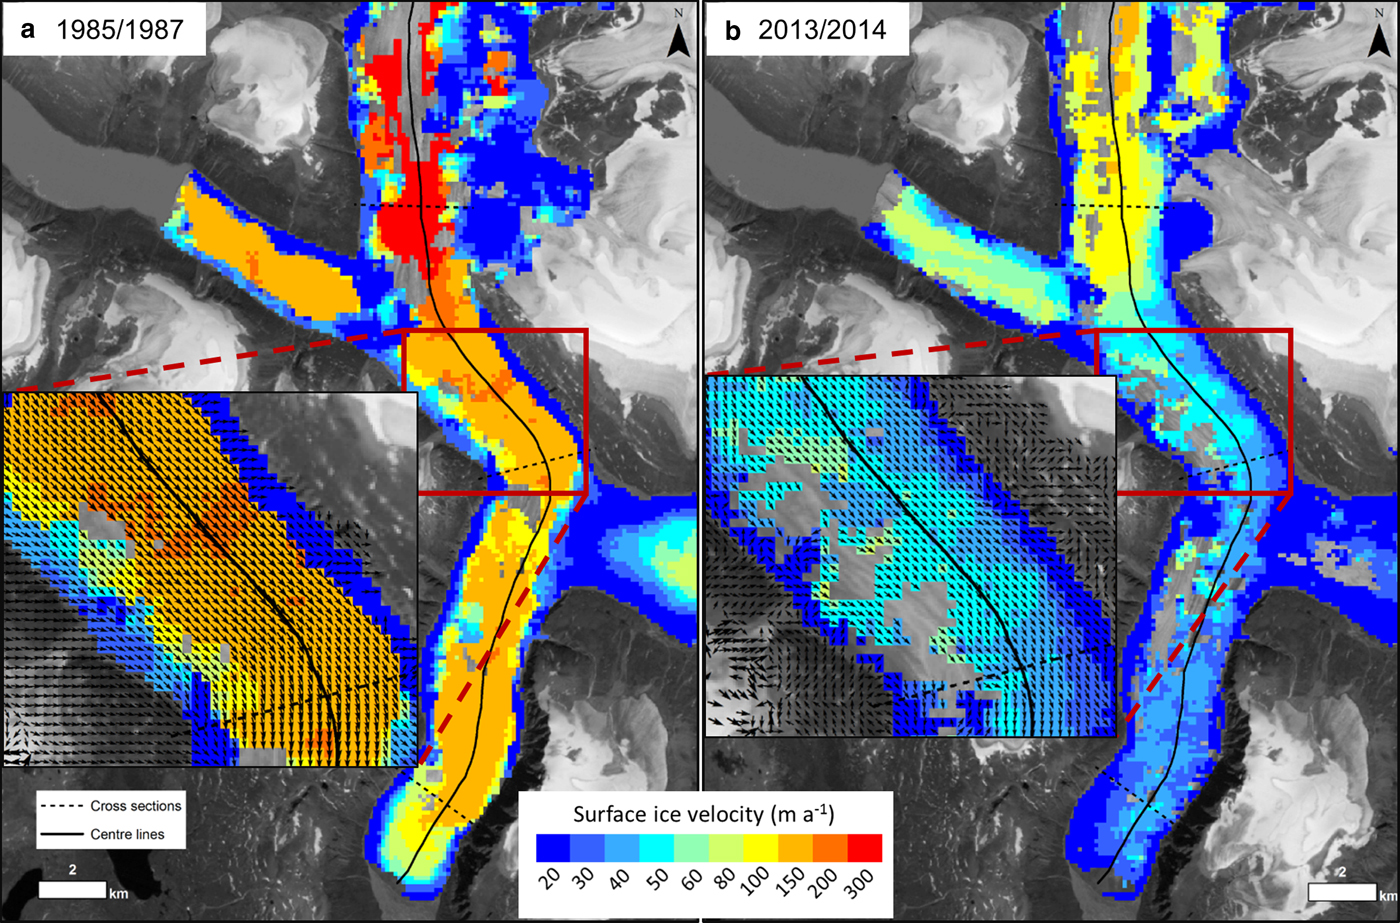
Fig. 4. Spatial distribution of surface velocities on Glacier 1 between (a) 1985–87 and (b) 2013/14 from feature tracking of optical image pairs. Insets show individual velocity vectors.
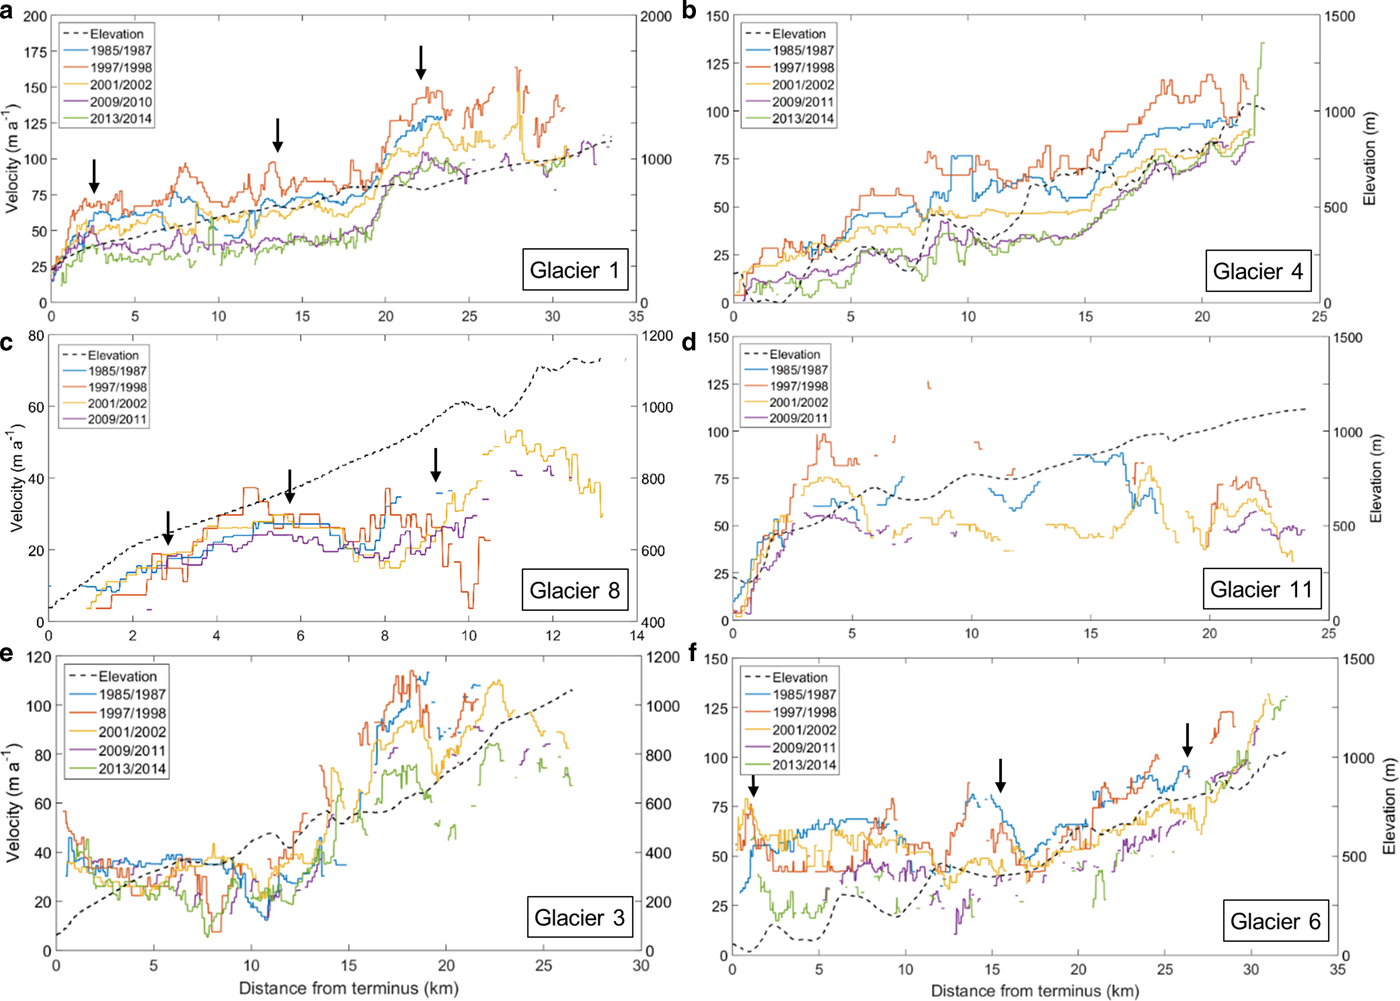
Fig. 5. Surface velocity changes from 1985 to 2014 for land-terminating (Glaciers 1, 4, 8, 11) and tidewater-terminating (Glaciers 3, 6) centre flow lines on PIC derived from feature tracking of optical image pairs. The locations of transverse profiles shown in Figure 9 are indicated with black arrows.
Most glaciers show considerable velocity changes over time. For example, velocities over the majority of the ablation area of Glacier 1 showed a significant decrease between 1985–87 and 2013/14 (Fig. 4). When analyzed in more detail, however, it is clear that the glacier velocity changes were not uniform through the study period. For all glaciers except Glacier 6, velocities increased from 1985–87 to 1997/98, and decreased thereafter. For example, Glacier 1 velocities increased by an average of 13.0 m a−1 between 1985–87 and 1997/98, and decreased by 34.5 m a−1 between 1997/98 and 2009/10. On Glacier 4, velocities increased by 9.9 m a−1 in the first 12 year period and decreased by 32.4 m a−1 in the second 12 year period. In contrast, velocities on Glacier 6 decreased by 6.2 m a−1 in the first period and further decreased by 19.7 m a−1 in the second period.
The temporal and spatial variability along the centre flow line for the three glaciers with the most complete records is shown in Figure 6. In general, velocities initially increased until 1998, and decreased thereafter for the two land-terminating glaciers (Glaciers 1 and 4), and also between 25 and 35 km up-ice from the terminus of Glacier 6. Lower portions of Glacier 6 showed a different pattern, with decreasing velocities from 1985 to 2014 between 5 and 25 km from the terminus, and an increase in velocities after 1998 within 5 km of the glacier terminus.
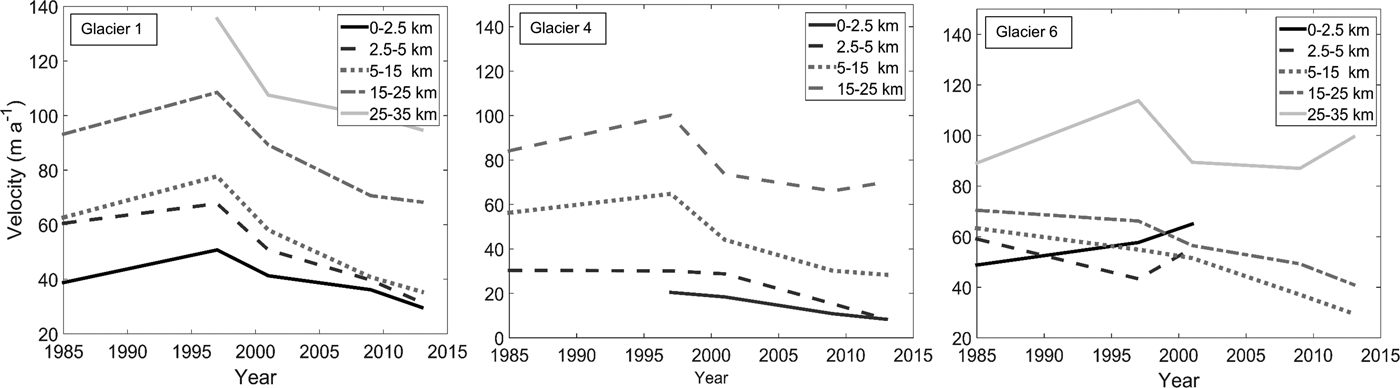
Fig. 6. Surface velocity changes from 1985 to 2014 on PIC for the three outlet glaciers with the most continuous data coverage. Each series represents the averaged velocity over a section of the centre flow line identified by its distance from the terminus.
Figure 7 summarizes the changes in glacier velocity presented on Figures 5, 6. The mean values along the centre flow line for each year (e.g. 1985/87) were calculated, excluding points missing data for one or more years. Glacier 11 was not included in this figure because the data are so sparse that an average value would not be meaningful. Between 1985 and the most recent velocity estimate (2011 or 2014), all six PIC outlet glaciers decelerated (Figs 5, 7). This deceleration has coincided with terminus retreats, measured along the centreline of each glacier, of 178, 380, 840 and 939 m, respectively, for land-terminating Glaciers 1, 4, 8 and 11, and with retreats of 973 and 820 m for tidewater Glaciers 3 and 6, respectively. On Highway Glacier (Glacier 8), historical measurements allow a reconstruction of velocity changes over the past 58 years. From stake measurements made along two transverse profiles ~0.87 km apart with a mean elevation of 760 m a.s.l., Ward (Reference Ward1955) estimated the mean annual surface velocity of the glacier to be 57 m a−1 over a 38 day period in July and August 1953 (Figs 3, 8). He also calculated the annual surface motion from the change in position of a medial moraine (situated between stakes A and B; Fig. 8) between 1948 air photos and 1953 field measurements. A mean annual ice velocity of 60 m a−1 was obtained, which compared well with equivalent annual speeds of 50 and 74 m a−1 measured at stakes A and B, indicating that the stake measurements were representative of annual motion. Our own measurements show that the average ice motion over these two historical transects slowed by ~71% from 57 m a−1 in 1953 to 17 m a−1 in 2009–11, with consistent velocity decreases at all stakes (Fig. 8).
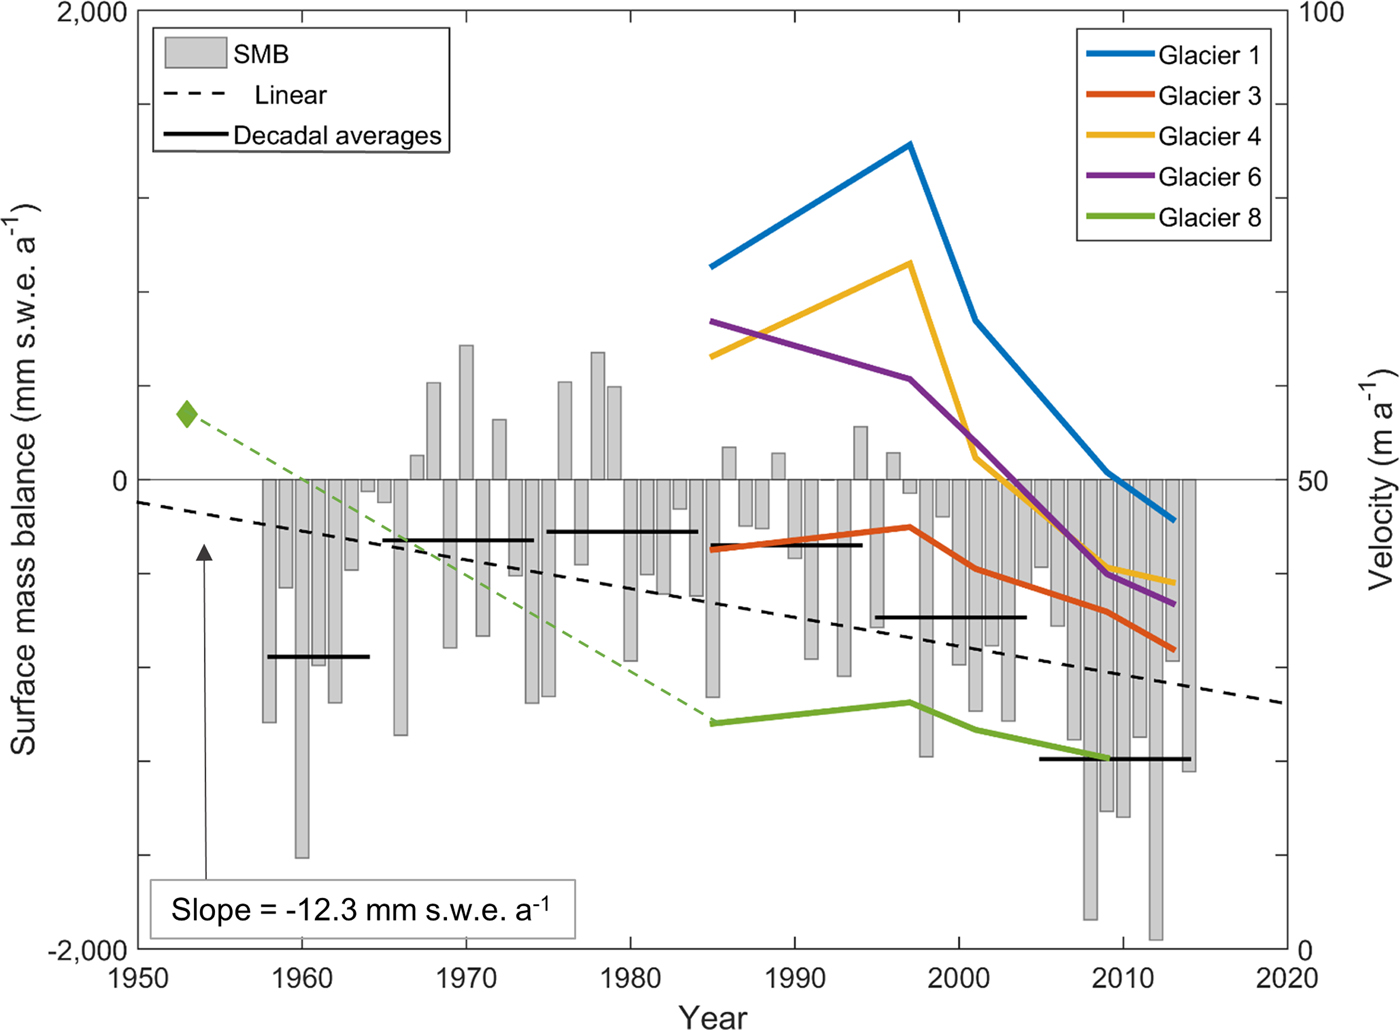
Fig. 7. Comparison of velocity and mass-balance changes observed on PIC since the early 1950s: Average annual glacier velocities derived from optical imagery (1985–2014), the ice cap-wide average annual and decadal mean SMB simulated by RACMO2 (1958–2014), linear SMB trends over the same period and the average 1953 velocity on Highway Glacier (Glacier 8) calculated from eight stake measurements (green diamond; Ward, Reference Ward1955).
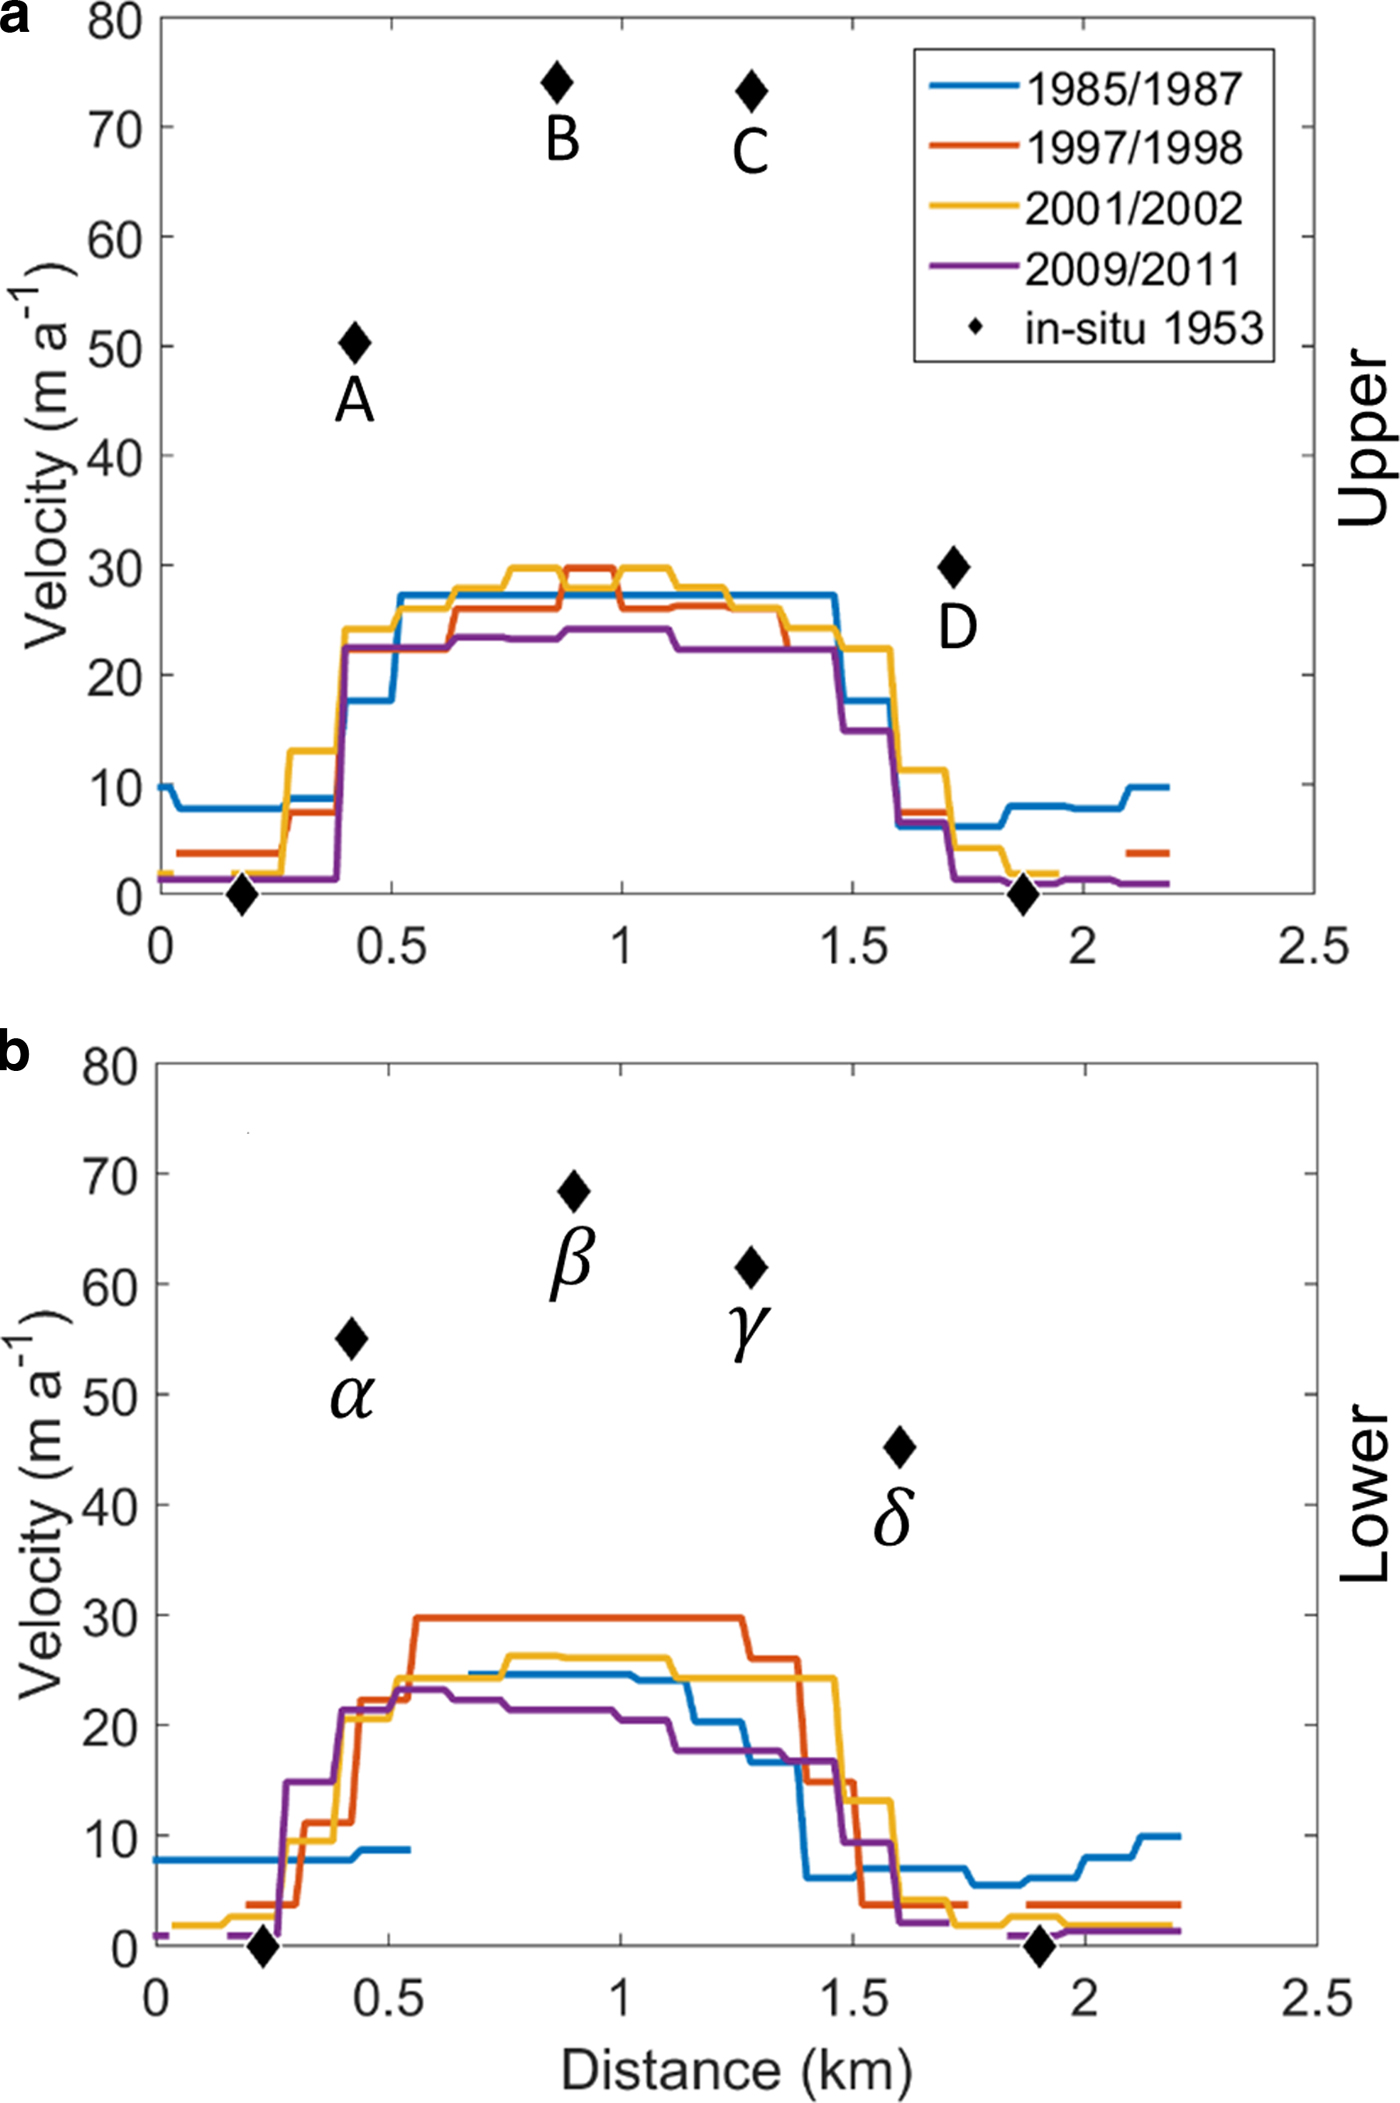
Fig. 8. Velocity stake measurements from 1953 on the upper (A-D) and lower elevation (α-δ) Highway Glacier transverse transects (Ward, Reference Ward1955; Fig. 3) with annual optical imagery results extracted along the same transect. Zero motion in 1953 was assumed to occur at the glacier edge defined using the oldest Landsat image available (16 August 1975).
Transverse profiles across the upper, middle and lower sections of the ablation area of three glaciers (Glaciers 1, 8, 6) showed an increase in motion between 1985–87 and 1997/98, followed by a decrease thereafter (Fig. 9). Transverse profiles can aid in identifying the relative importance of basal sliding vs internal deformation. Where basal sliding dominates, ice tends to move with high and relatively constant velocities near the glacier centre, and velocities decrease rapidly close to the margins (Kamb and others, Reference Kamb1985; Fatland and others, Reference Fatland, Lingle and Truffer2003; Copland and others, Reference Copland2009). This has been termed blockschollen (or plug flow) by Kick (Reference Kick1962). In contrast, glaciers that flow primarily by internal ice deformation usually display a transverse velocity pattern where motion decreases gradually from the centre flow line towards the margins. On PIC, the transverse flow patterns of Glaciers 1 and 6 show a rapid decrease in velocity near the glacier margins, typical of flow dominated by basal sliding, during years with faster flow (e.g. 1997/98), or in areas of higher flow (e.g. the upper glacier; Fig. 9). In contrast, lower flow years and slower moving parts of these glaciers, are generally characterized by a transverse flow profile more typical of internal ice deformation. Glacier 8 maintains a plug-type flow from 1985 to 2011 in both its upper and middle regions. Likewise, the upper portion and left side of Glacier 1 (~0.5 km) maintain a flow structure more similar to plug-type flow than deformation.
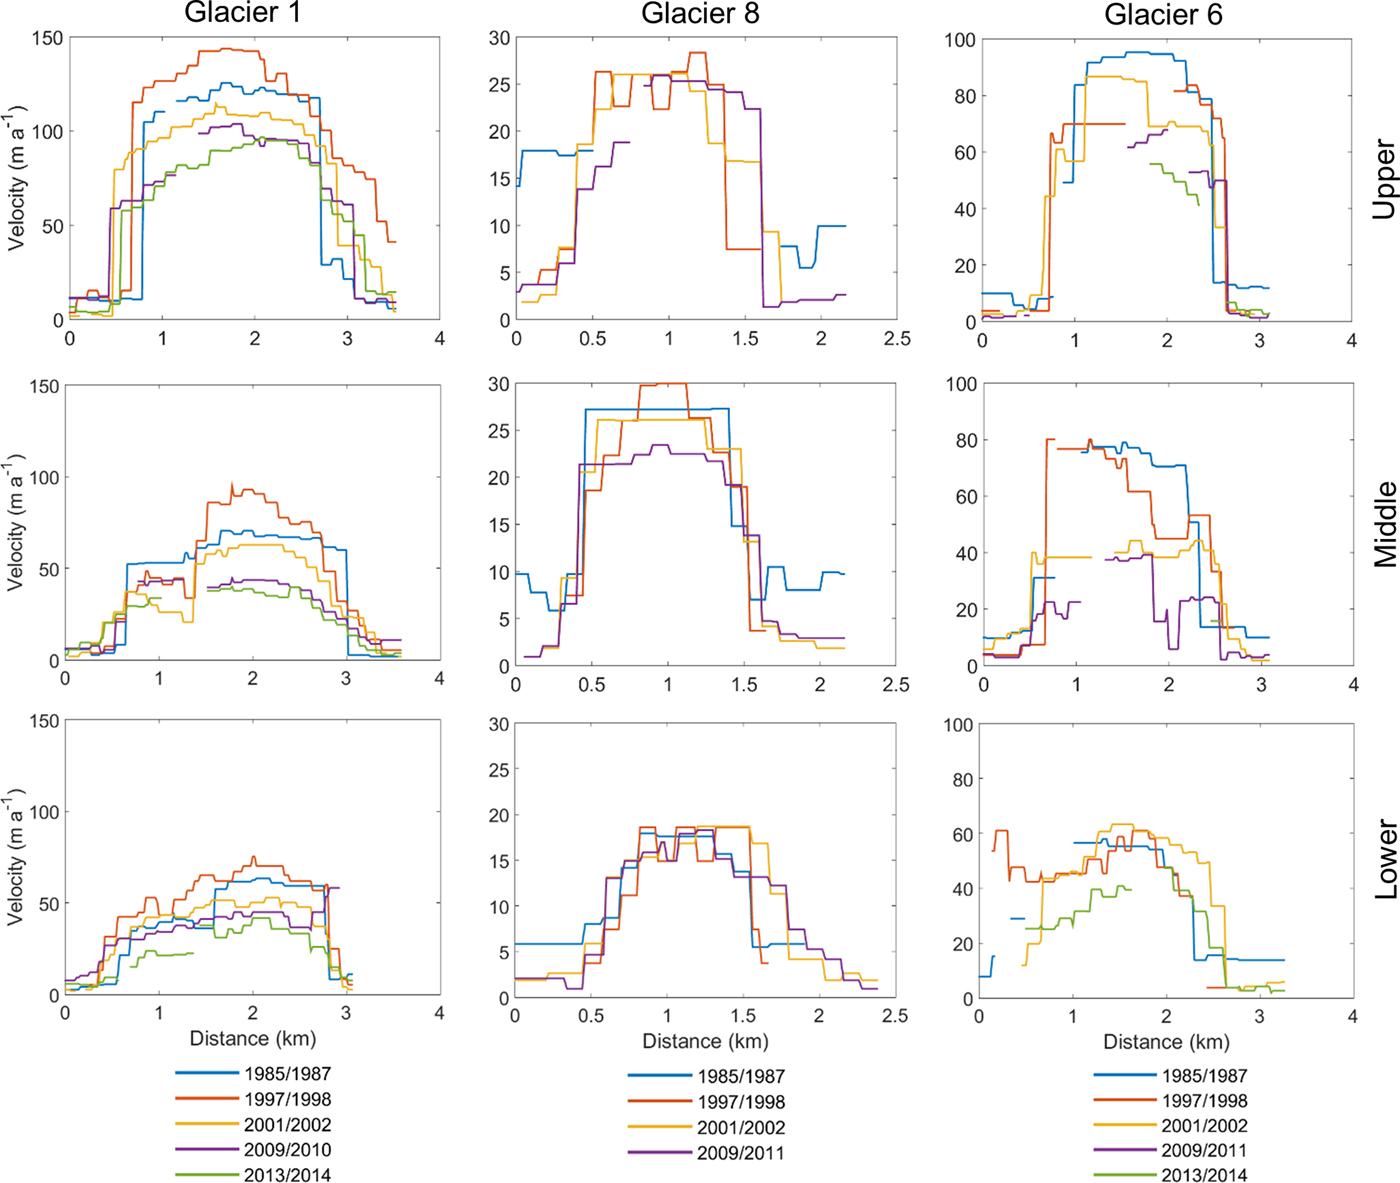
Fig. 9. Cross-sectional surface ice velocities from feature tracking of optical image pairs for the upper, middle and lower ablation areas of Glaciers 1, 8 and 6 on PIC (1985–2014). Distance was measured looking in an up-glacier direction, from left to right across each glacier.
4.3. Short-term variability of ice velocities
To quantify the interannual variability of ice motion, we compared annual in situ dGPS measurements collected within 500 m of the centre flow line on Glaciers 1 and 6 with the optical feature tracking results (Fig. 10) at the same distance from the terminus. To check if the dGPS velocities were comparable with those along the centre line, we compared the velocity at the location of each dGPS point to the nearest location along the centre line using the speckle tracking raster (Fig. 3). Velocities were found to be comparable (<4 m a−1 difference), except for points near the terminus of Glacier 1 which were ~ 7–10 m a−1 slower than the nearest centre flow line location. The estimated mean 95% confidence intervals for interannual velocity variations calculated from four locations on Glaciers 1 and four locations on Glacier 6 were ±8.9 m a−1 and ±3.7 m a−1, respectively. The minimum confidence interval for Glacier 1 was found near the terminus, and for Glacier 6 it was ~10–25 km from the glacier terminus.
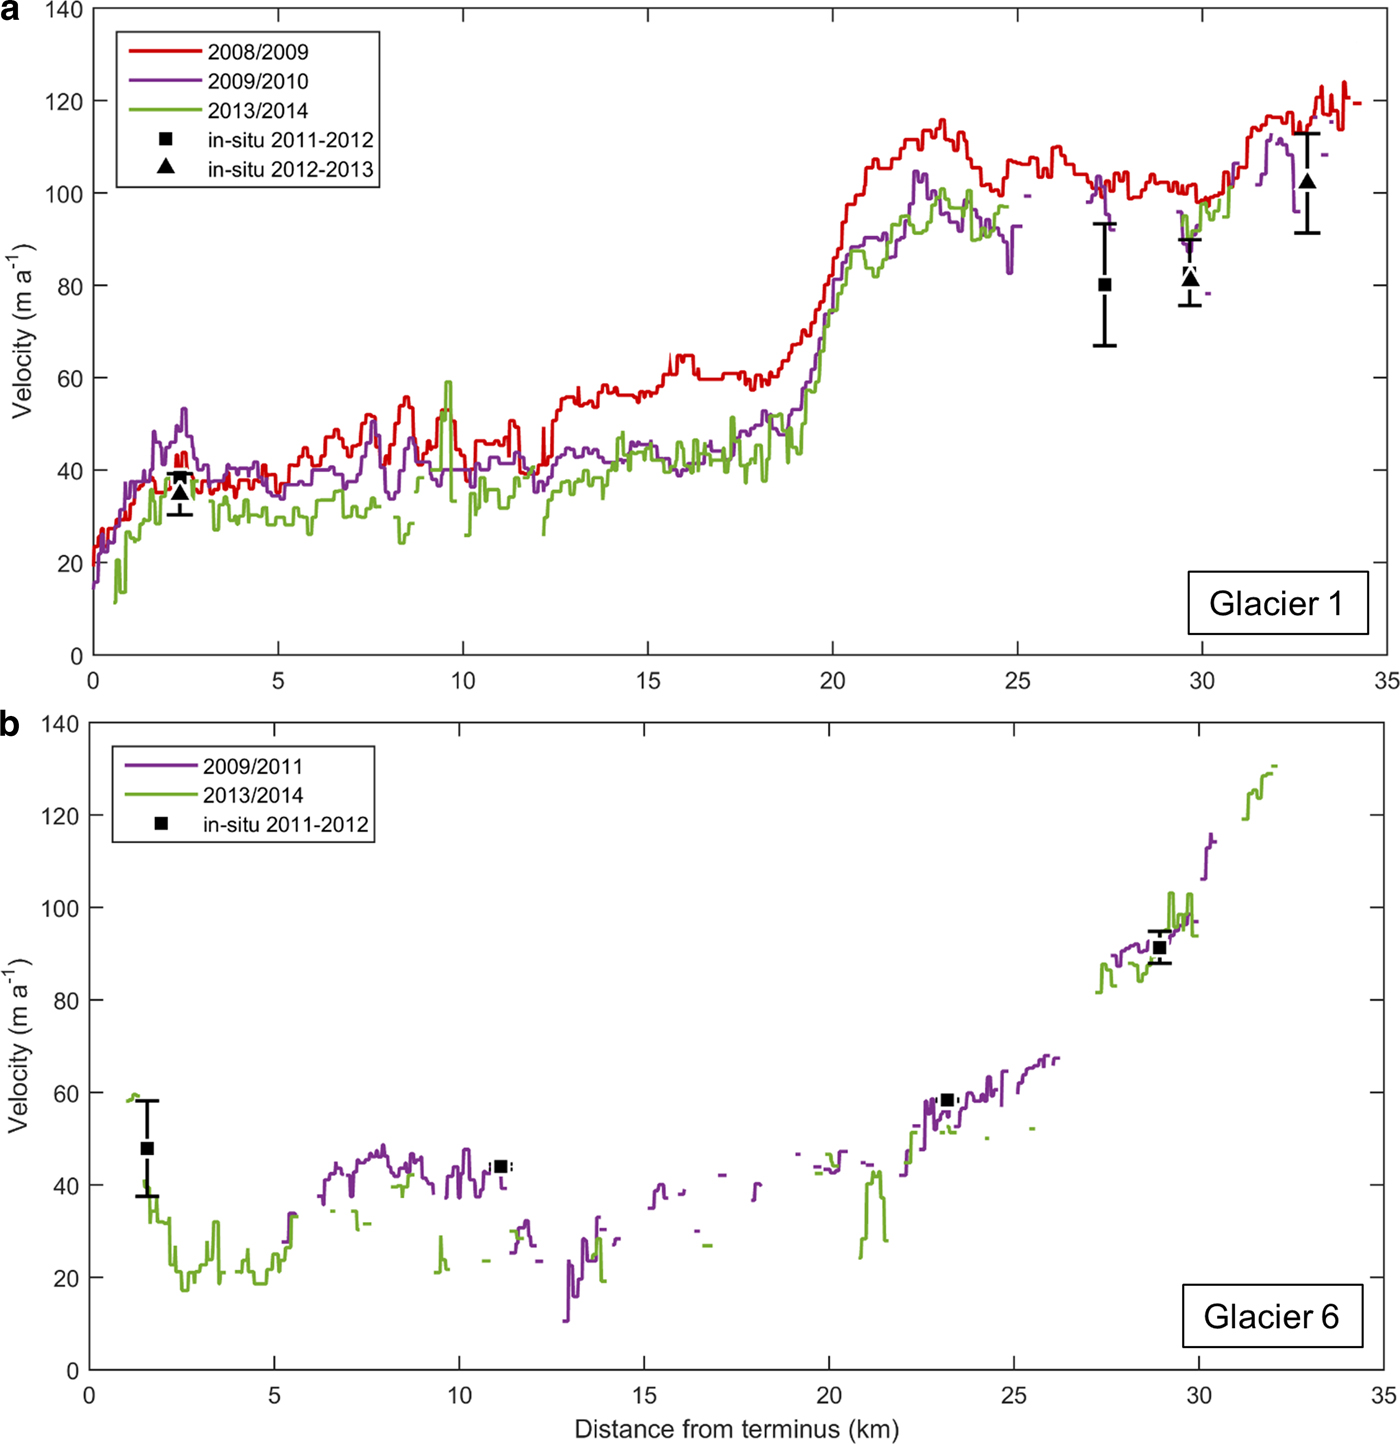
Fig. 10. Annual variability in surface ice velocities on PIC along glacier centre lines captured with optical imagery (coloured lines) and in situ dGPS measurements (black triangles or squares) from 2008 to 2014, including 95% confidence interval error bars for: (a) Glacier 1 (land-terminating); (b) Glacier 6 (tidewater-terminating). The 95% confidence intervals for dGPS points at ~11 km and ~23 km for Glacier 6 are <±0.6 m a−1 and are therefore not visible.
To calculate the seasonal variability, speckle tracking velocities were extracted along a transect that started at each glacier terminus and connected the dGPS points (Fig. 11, Table 4). The average difference between all the dGPS annual point velocities and SAR-derived winter velocities at the same location was 2.2 m a−1 (std dev. = 8.0 m a−1) for Glacier 1. This figure is within the error limits of the SAR data (±5.6 m a−1), indicating that there was no significant difference between winter and annual velocities for this glacier. In contrast, on Glacier 6 the differences averaged −10.0 m a−1 (std dev. = 12.4 m a−1), which was outside of the SAR error limits, indicating that winter velocities were significantly lower than annual velocities on this glacier. The deviation between winter and annual velocities was greatest in the centre of Glacier 6, ~10–25 km from the terminus.
Fig. 11. Winter SAR-derived surface ice velocities (coloured lines) and annual in situ dGPS velocity measurements along the central flow line of PIC outlet glaciers (Fig. 3) connecting the dGPS point locations on: (a) Glacier 1 (land-terminating); (b) Glacier 6 (tidewater-terminating). 2010/11 and 2011/12 SAR velocities were derived from ALOS PALSAR and RADARSAT-2 data, respectively.
The total short-term variability was estimated from the root sum of squares of the seasonal and interannual variability. For land-terminating Glacier 1, this was ±8.9 m a−1 and for tidewater Glacier 6 it was ±12.9 m a−1. The mean net deceleration between 1985 and 2011, for the four land-terminating glaciers was −25.5 m a−1 and for the two tidewater glaciers it was −20.3 m a−1, well above recent short-term motion variability. All glaciers except Glacier 6 accelerated from 1985–87 to 1997/98, and all decelerated from 1997/98 to 2009–11. The velocity changes in the first 12-year period for all tidewater glaciers and Glacier 8 were within the range of total short-term variability, whereas the changes in the second 12-year period exceeded the short-term variability for Glaciers 1, 4, 6 and 11. When averaged over all glaciers, velocity changes in the second period exceeded the short-term velocity variability for both land (−23.6 m a−1) and tidewater (−14.5 m a−1) glaciers.
5. DISCUSSION
This widespread deceleration across PIC between 1985 and 2011 or 2014 (Figs 5, 7) suggests that it is primarily driven by factors common to all glaciers, rather than local effects such as changes in individual glacier thicknesses, localized slope gradients, or melt patterns. The RACMO2.3 simulation indicates a sustained, long-term decrease in SMB (Fig. 7) over PIC since the mid-1980s, consistent with increases in summer and winter temperature anomalies reported in this region since 1985 (Zdanowicz and others, Reference Zdanowicz2012; Vincent and others, Reference Vincent2015) and with increased mass losses over PIC determined from NASA Airborne Topographic Mapper (ATM) altimetry elevation changes from 1995 to 2013 (Schaffer, Reference Schaffer2017). The surface elevation changes from 2005 to 2013 resulted in an estimated mass loss rate of −5.4 ± 1.9 Gt a−1, four times greater than in the previous 5 years (1995–2000: −1.3 ± 0.72 Gt a−1; Gardner and others, Reference Gardner, Moholdt, Arendt and Wouters2012). Increased melt is also evidenced by a near doubling of the volumetric fraction of infiltration ice layers in near-surface firn strata at the PIC summit between 2011 and 2013, and by a rapid recent up-glacier migration of the ELA (currently at ~1646 m), leading to large areas of remnant firn at elevations >400 vertical meters below the present day ELA (Schaffer, Reference Schaffer2017).
The connection between ice motion variations and SMB changes can be investigated by comparing the RACMO2.3 SMB model output to glacier velocities (Fig. 7). The initial increase in velocities between 1985 and 1998 followed several years of positive SMB from the late 1960s to late 1970s. This period of positive balance coincided with anomalously low regional temperatures in both summer and winter measured at weather stations close to PIC (Bradley, Reference Bradley1973; Zdanowicz and others, Reference Zdanowicz2012). After 1998, there was a marked decrease in motion for all PIC glaciers, which was accompanied by a 325% decrease in mass balance from −0.28 m w.e. a−1 between 1985 and 1994 to −1.19 m w.e. a−1 between 2005 and 2014. These patterns suggest that the outlet glaciers of PIC respond quickly to increases in surface melt rates by decelerating, and accelerate in response to mass accumulation at times of positive SMB.
The transverse velocity profiles at PIC provide insights into the relationships between mass loss and ice motion as they record a transition from plug-type flow associated with high basal sliding rates, to motion increasingly influenced by internal deformation as velocities decreased from 1985 to 2014 (Fig. 9). This suggests a shift from a distributed to a more efficient channelized subglacial hydrological system, and an overall drop in basal water pressure, as mass loss increases, supporting the findings of Sundal and others (Reference Sundal2011) and Schoof (Reference Schoof2010). The lack of variability between our winter and annual velocity measurements toward the end of our study period (2009–2014) also supports this contention (Fig. 10).
To assess the relative importance of internal deformation at different periods, we used historical and current measurements of ice thickness and surface slope at Highway Glacier (Ward, Reference Ward1955) to compute expected deformation rates using a simplified form of Glen's flow law (Glen, Reference Glen1955):
 $$\dot \varepsilon = A{\rm \tau} ^{n_{\rm g}} $$
where  $\dot \varepsilon $ is the strain rate, τ is the basal shear stress, and A and n g are empirically-derived values, the first varying with ice temperature. The surface velocity due to creep (U i) was calculated by replacing τ with the equation for driving stress and integrating with respect to height to obtain:
 $$U_i {\rm = 2}A{(\rho} _i gH\tan { \alpha )}^{n_{\rm g}} H$$
where ρ i is the density of ice, g is the gravitational constant, α is the surface slope and H is the ice thickness. These calculations were made for 1953 and 2010 at two stakes closest to the glacier centreline (B and β in Fig. 8) using ρ i = 910 kg m−3, α = 3.5° (measured in 1953) and n g = 3.3. Measurements of summer ice temperatures near the surface in 1953 at altitudes of 440 m and 1010 m were −5.5 and −6°C, respectively, so a mean value of −5.75°C was used to calculate A = 3.48 × 10⁻¹⁹ a−1 pascals−3.3. The measured ice thickness on Highway Glacier was 270 m in 1953. The current ice thickness (251.5 m) was estimated from the cumulative SMB obtained by RACMO2.3 over the period 1953–2010, subtracted from the 1953 ice thickness. The calculated values of U i for Highway Glacier were 21.9 and 16.2 m a−1, respectively, for 1953 and 2010. Based on these results, internal ice deformation would have accounted for 31% of the total centreline surface velocity in 1953 (71.2 m a−1), compared with 72% in 2010 (22.3 m a−1). This suggests that the basal sliding component of glacier motion must have decreased significantly over the 57 year interval. The calculated reduction in surface velocity due to internal deformation of (5.7 m a−1) would only account for 12% of the observed change in total surface velocity of 48.9 m a−1, also suggesting a significant decrease in basal sliding.
Sensitivity analyses were performed with respect to slope and ice temperature. A present-day slope of 3.7° between the two 1953 transects was obtained from the ArcticDEM (http://pgc.umn.edu/arcticdem) based on imagery from 2015. The values of U i for 1953 and 2010, recalculated with this slope, were 24.6 and 18.1 m a−1, respectively. Velocities were also calculated for ice temperatures 1°C above and below the measured 1953 temperature of −5.75°C with a slope of 3.5°. For these temperatures, the corresponding values of U i in 1953 would have been 25.1 and 18.5 m a−1, respectively, while in 2010 they would be 19.3 and 14.3 m a−1.
Our long-term velocity results for PIC are consistent with those of Heid and Kääb (Reference Heid and Kääb2012b), who reported an acceleration from 1985–87 to 1997/98, and a deceleration from 1997/98 to 2009–11. Results of the two studies are comparable wherever there is spatial overlap, but we report higher mean velocities due to the greater spatial coverage of our data on PIC outlet glaciers. For example, in 1985–87 we found that the mean velocity over PIC was 53 m a−1, compared with 21 m a−1 reported by Heid and Kääb (Reference Heid and Kääb2012b). We also calculated a deceleration rate of 12% per decade between 1985 and 2011, compared with a deceleration of 25% per decade by Heid and Kääb (Reference Heid and Kääb2012b) over the same period. For the entire period 1985–2014, we calculated an overall deceleration rate of 15% per decade, but this excludes Glaciers 8 and 11 as there are no data available during 2013/14 for these glaciers.
The multi-decadal slowdown found at PIC is similar to that observed over the predominantly land-terminating western margin of the GIS ,where a 12% decrease in ice velocities was observed in conjunction with a 49.8% increase in surface meltwater production between 1985 and 2014 (Tedstone and others, Reference Tedstone2015). Sustained high production of surface meltwater on the GIS is thought to have been responsible for the observed slowdown, due to the expansion of a channelized subglacial drainage system resulting in increased drainage efficiency and lower basal water pressures. As on PIC, thinning only accounted for a small percentage (17–33%) of the slowdown (Tedstone and others, Reference Tedstone2015). Likewise, Heid and Kääb (Reference Heid and Kääb2012b) found that glacierized regions dominated by land-terminating glaciers with negative mass balance experienced decreasing ice velocities over the past few decades, with reported decadal mean decelerations of 43% in the Pamir (50 glaciers studied), 8% in the Caucasus (16 glaciers) and 11% in the Alaska Range (nine glaciers). The same is true for Glacier d'Argentière in France (Vincent and others, Reference Vincent, Soruco, Six and Meur2009), Glacier Universidad in the Andes (Wilson and others, Reference Wilson, Mernild, Malmros, Bravo and Carrion2016), Franz Josef Glacier in New Zealand (Anderson and others, Reference Anderson2014), White Glacier on Axel Heiberg Island (Thomson and Copland, Reference Thomson and Copland2017) and the lowermost 10 km of Kaskawulsh Glacier in the Yukon (Waechter and others, Reference Waechter, Copland and Herdes2015).
6. CONCLUSIONS
This study has confirmed that most of PIC is slow-moving (<20 m a−1), with faster motion restricted to areas of high relief where the broad accumulation area in the interior connects to topographically constrained outlet glaciers. Velocities on land-terminating outlet glaciers range from ~100 to 250 m a−1 and generally decrease down-glacier. In contrast, tidewater glaciers showed a distinct increase in velocities in their lower terminus region. The six outlet glaciers examined in detail as part of this study showed an overall deceleration between 1985 and 2014, with an early period of moderate speedup for most glaciers from 1985–87 to 1997/98, followed by a pronounced slowdown thereafter. The deceleration after 1998, as well as the long-term slowdown over the entire study period (1985–2014) for PIC, was beyond the estimated short-term ice motion variability. Historical measurements on Highway Glacier show that velocities there have decreased by 71% since 1953.
We postulate that decreased ice motion on PIC is correlated with increased mass loss and with a transition from motion dominated by basal sliding to motion increasingly influenced by internal deformation. This is confirmed for Highway Glacier, where the estimated rate of internal deformation could only account for 30% of the surface velocity in 1953, but increased to 70% by 2010. Our findings support the hypothesis of Schoof (Reference Schoof2010) that increased surface melt enhances the formation of an efficient channelized subglacial drainage system, which results in lower basal water pressures and reduced ice velocities. Our results add to the growing body of literature, which indicates that the majority of land-terminating glaciers are decelerating in response to a warming climate. The response of tidewater glaciers is more variable as they are controlled by marine influences and changes in backstress, in addition to changes in ice thickness and subglacial hydrology. On PIC, tidewater glaciers are decelerating. However, this is not true for all tidewater glaciers in the CAA. For example, Trinity and Wykeham Glaciers on Ellesmere Island have more than doubled in speed over the past 15 years (Van Wychen and others, Reference Van Wychen2016). Likewise in Greenland, widespread acceleration of outlet glaciers occurred in the early- to mid-2000s (Luckman and others, Reference Luckman, Murray, de Lange and Hanna2006; Howat and others, Reference Howat, Joughin, Fahnestock, Smith and Scambos2008).
Further work is needed to confirm the cause of deceleration observed across PIC. Thickness change and ice temperature measurements over the most dynamically active outlet glaciers (e.g. Glacier 1) are required to accurately determine the contribution of internal deformation vs basal sliding to the observed changes in velocity. For tidewater glaciers, measurements of sea surface temperatures and bathymetry in Baffin Bay, as well as continued monitoring of glacier motion and runoff, are required.
ACKNOWLEDGEMENTS
We thank Geological Survey of Canada staff (Alexander Chichagov and Mark Ednie), Parks Canada staff in Pangnirtung and Iqaluit, Alexandre Bevington, Patricia Payton and Charles Latour for their assistance with field work, Laurence Gray for providing the speckle tracking code, Wesley Van Wychen for guidance using the code and the Department of Earth Sciences at Uppsala University for hosting N. Schaffer during part of this study. We would also like to thank various data providers: Brice Noël at the Institute for Marine and Atmospheric Research Utrecht (IMAU) for the RACMO2.3 model outputs, the US Geological Survey for Landsat imagery and the National Science Foundation who funded the creation of the ArcticDEM by DigitalGlobe Inc. (awards 1043681, 1559691 and 1542736). This work was supported by funding from the Ontario Graduate Scholarship (OGS), Natural Sciences and Engineering Research Council of Canada (NSERC), Northern Scientific Training Program (NSTP), Canada Foundation for Innovation (CFI), Ontario Research Fund, Polar Continental Shelf Program (PCSP) and University of Ottawa.


 Open access