1. Introduction
Tibetan glaciers are heterogeneous in many respects and can be categorized into different types. Reference Shi and LiuShi and Liu (2000) grouped them into three types according to their continentality (maritime, subcontinental, continental). Reference Rupper and RoeRupper and Roe (2008) categorized them into three classes (western, eastern and northern) according to geographic differences in their spatial variability. Reference Maussion, Scherer, Mölg, Collier, Curio and FinkelnburgMaussion and others (2014) defined five distinct classes of Tibetan glaciers (winter, summer and spring accumulation types and two intermediate classes) based on precipitation seasonality. All these categories are related to local climate backgrounds. Tibetan glaciers have been retreating in the past few decades as shown by numerous works, including in situ measurements and remote-sensing studies (Reference Fujita and AgetaFujita and Ageta, 2000; Reference BolchBolch and others, 2012; Reference YaoYao and others, 2012; Reference WagnonWagnon and others, 2013). Patterns of glacier change (e.g. climatic mass balance) differ under different regimes (Reference Jacob, Wahr, Pfeffer and SwensonJacob and others, 2012; Reference Kääb, Berthier, Nuth, Gardelle and ArnaudKääb and others, 2012). However, the fundamental mechanisms controlling these spatial patterns are still disputed (Reference Fujita and NuimuraFujita and Nuimura, 2011; Reference Scherler, Bookhagen and StreckerScherler and others, 2011; Reference Gardelle, Berthier and ArnaudGardelle and others, 2012; Reference Jacob, Wahr, Pfeffer and SwensonJacob and others, 2012; Reference Kääb, Berthier, Nuth, Gardelle and ArnaudKääb and others, 2012; Reference YaoYao and others, 2012), indicating that the response of Tibetan glaciers to climate change is complex due to a variety of climate settings on the Tibetan Plateau (TP) (Reference FujitaFujita, 2008; Reference Rupper and RoeRupper and Roe, 2008). Energy- and mass-balance models are a useful tool to determine the key factors affecting the climatic mass balance of glaciers, and have been successfully applied on many mountain glaciers and ice sheets around the world (Reference Klok and OerlemansKlok and Oerlemans, 2002; Reference Mölg and HardyMölg and Hardy, 2004; Reference Hock and HolmgrenHock and Holmgren, 2005; Reference Dadic, Corripio and BurlandoDadic and others, 2008; Reference Mölg, Cullen, Hardy, Kaser and KlokMölg and others, 2008; Reference PellicciottiPellicciotti and others, 2008; Reference Reijmer and HockReijmer and Hock, 2008; Reference Van den Broeke, Smeets, Ettema, Van der Veen, Van de Wal and OerlemansVan den Broeke and others, 2008).
However, few detailed studies are available on glacier mass- and energy-balance processes on the TP and surrounding regions. Although some in situ point surface energy-balance measurements are available (e.g. Reference Takahashi, Ohata and XieTakahashi and others, 1989; Reference Xie, Xie and KotlyakovXie, 1994; Reference Zhang, Yao, Pu, Ohata, Yabuki and FujitaZhang and others, 1996; Reference Aizen, Aizen and NikitinAizen and others, 2002; Reference YangYang and others, 2011), these results are difficult to compare because of varying observation periods (e.g. ablation season or multiple years) and locations (e.g. ablation zone or accumulation zone). The characteristics of surface energy and mass balance for a few individual glaciers were analysed using an energy- and mass-balance model (e.g. Reference Kayastha, Ohata and AgetaKayastha and others, 1999; Reference Fujita and AgetaFujita and Ageta, 2000; Reference ZhangZhang and others, 2013). Recent studies have found that glacier energy- and mass-balance processes are closely linked with atmospheric circulation. Reference Mölg, Maussion, Yang and SchererMölg and others (2012) quantified the impact of the Indian summer monsoon on Zhadang glacier over different monsoonal stages, and Reference Mölg, Maussion and SchererMölg and others (2014) found that the mid-latitude westerlies are another important driver of interannual mass-balance variability on this glacier. Reference Yang, Yao, Guo, Zhu, Li and KattelYang and others (2013) found that ‘spring-accumulation type’ glaciers, concentrated in a wedge-shaped region along the Brahmaputra River, are influenced by regional atmospheric circulations including the Indian summer monsoon, southern westerlies and the Bay of Bengal vortex. Although some experiments based on the energy- and mass-balance model have evaluated the spatial climatic sensitivity pattern of Tibetan glaciers under different climatic backgrounds (Reference Zhang, Fujita, Ageta, Nakawo, Yao and PuZhang and others, 1998; Reference Rupper and RoeRupper and Roe, 2008; Reference Fujita and NuimuraFujita and Nuimura, 2011), most studies have focused on the relationship between a single glacier and relevant climate factors on the TP. Detailed comparisons of glacier energy- and mass-balance processes during the same periods have not been carried out in different climatic regimes.
To address this issue, we set up two automatic weather stations (AWSs) on Zhadang glacier (subcontinental glacier according to Reference Shi and LiuShi and Liu, 2000) and Parlung No. 4 glacier (a maritime glacier) during the period 15 August 2010 to 25 July 2012 (Fig. 1). Both stations are located near the median elevation of each glacier and are approximately 145 and 195 m lower than the equilibrium-line altitude (ELA) for Zhadang and Parlung No. 4 glaciers, respectively. First, the relevant meteorological and energy- and mass-balance characteristics at the two AWS sites are compared. Second, the physical mechanisms that control the differences in mass loss are discussed. Third, the spatial pattern of energy fluxes on the TP and in surrounding regions is examined by reviewing recently published data on different types of glaciers.

Fig. 1. Locations of Zhadang glacier (a) and Parlung No. 4 glacier (b) on the Tibetan Plateau (rectangle in the inset maps), with glacier contour maps showing locations of AWSs (stars) on both glaciers and monthly precipitation distribution (data from Damxung station nearest to Zhadang glacier and Zayu station nearest to Parlung No. 4 glacier). The glacier polygons of Zhadang and Parlung No. 4 glaciers are derived from Landsat Enhanced Thematic Mapper Plus (ETM+) 2001 and Landsat Thematic Mapper (TM) 2005 imagery, respectively.
2. Data and Method
2.1. Glacier settings
Zhadang glacier (30°28.57′ N, 90°38.71′ E; 2.0 km2; length 2.2 km) is located in the Nam Co basin, south TP (Fig. 1). This glacier faces north-northwest and ranges from 5515 to 6090 m a.s.l. (Reference Shi, Liu, Wang, Liu and YeShi and others, 2005). Its area decreased by 0.39 km2 between 1970 and 2009 (Reference BolchBolch and others, 2010). Two almost identical AWSs (AWS1-Z and AWS2-Z) were installed in the middle section (5665 m a.s.l.) and near the terminus (5580 m a.s.l.), respectively. The characteristics of the surface energy and mass balance during 2009–11 have been analysed at both point and glacier-wide scales (Reference Mölg, Maussion, Yang and SchererMölg and others, 2012, Reference Mölg, Maussion and Scherer2014; Reference ZhangZhang and others, 2013). In this study, the AWS1-Z dataset on Zhadang glacier from 15 August 2010 to 25 July 2012 was selected for comparison with the mass and energy features of Parlung No. 4 glacier.
Parlung No. 4 glacier (29°14.4′ N, 96°55.2′ E) lies in the Parlung–Zangbu river basin, southeast TP (Fig. 1). The glacier flows northward from an elevation of 5964 m to 4650 m, with area ∼11.7 km2 and length of nearly 8 km in the 1970s (Reference Shi, Liu, Wang, Liu and YeShi and others, 2005). In this region, three AWSs (AWS1-P, AWS2-P and AWS3-P) were deployed near or on Parlung No. 4 glacier. AWS1-P, located 5 km north of the glacier snout, operated on a lateral moraine at 4600 m a.s.l. Both AWS2-P (4800 m a.s.l.) and AWS3-P (5202 m a.s.l.) were located on Parlung No. 4 glacier. The summertime surface energy budget and scalar roughness length parameterization in the ablation zone at 4800 m a.s.l. have been studied by Reference YangYang and others (2011) and Reference GuoGuo and others (2011), respectively.
Both Zhadang and Parlung No. 4 glaciers are affected by the Indian summer monsoon in summer. However, regional precipitation seasonality shows distinct differences (Fig. 1). Zayu meteorological station (∼90 km from Parlung No. 4 glacier) shows that Parlung No. 4 glacier is governed by a bimodal distribution of precipitation. Precipitation data from the Damxung meteorological station (∼44 km from Zhadang glacier) show that precipitation at Zhadang glacier occurs mainly during summer.
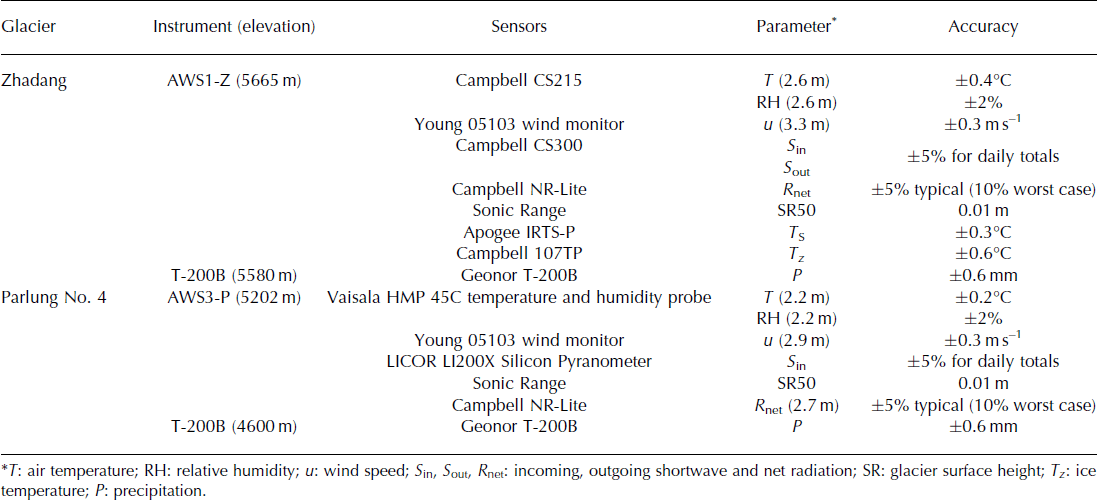
Both AWS1-Z on Zhadang glacier and AWS3-P on Parlung No. 4 glacier recorded the following data in 10 min mean values for a nearly horizontal glacier surface: incoming solar radiation; net radiation; air temperature; relative humidity; air pressure; wind speed and direction; and subsurface ice temperature at different ice depths. Detailed specifications of all sensors are provided in Table 1. Additionally, AWS1-Z on Zhadang glacier recorded the reflected solar radiation and surface temperature measured by infrared thermocouple sensor. The SR50 sonic ranging sensors were deployed near each AWS to measure the distance to the glacier surface. Two all-weather precipitation gauges (T-200B) with a hanging weighing transducer were operated close to Parlung No. 4 glacier at 4600 m a.s.l. and near Zhadang glacier at 5580 m a.s.l.
Table 1. Sensor information on the two AWSs used in this study with their technical specifications
2.2. Data processing
2.2.1. Data correction
The temperature and relative humidity sensors are housed in ventilated radiation shields on Zhadang glacier and are not ventilated on Parlung No. 4 glacier. Reference SmeetsSmeets (2006) proposed a method for assessing the unaspirated temperature measurements using net shortwave radiation (S net) and wind speed. With respect to the fact that S net was not measured at AWS3-P (Table 1), a compromise method that uses net total radiation (R net) and wind speed was adopted, and its capability was examined at AWS2-P in which both four-component radiation values were measured (Reference YangYang and others, 2011). Relative humidity (RH) data at both sites were corrected by the method of Reference Curry and WebsterCurry and Webster (1999) when hourly air temperature was <0°C. Corrections were applied to sonic ranger (SR50) data according to the method of Reference MaussionMaussion and others (2011). The rain gauge undercatchment was corrected using a method suggested by Reference YangYang and others (1998) and Reference Ma, Zhang, Yang and FarhanMa and others (2014) based on temperature and wind speed during precipitation events. The mean undercatch was estimated at 30% on Parlung No. 4 glacier and 17% on Zhadang glacier.
2.2.2. Data gap
Because of the harsh environmental conditions at high elevation, a non-negligible amount of missing data needed to be filled. The wind speed probe of AWS3-P on Parlung No. 4 glacier failed after 31 August 2010. Given the poor linear correlation between AWS1-P (moraine) and AWS2-P (glacier), we established the relationship between gridded data and wind speed available at AWS2-P on the glacier to fill in the wind speed at AWS3-P, assuming the same wind speed over the entire glacier (Reference Hock and HolmgrenHock and Holmgren, 2005). The 0.1° × 0.1° ITPCAS (Institute of Tibetan Plateau Research, Chinese Academy of Sciences) wind-forcing grid data (http://dam.itpcas.ac.cn/rs/?q=data; Reference He and YangHe and Yang, 2011) were used to fill the wind speed data gaps using the method of Reference Giesen, Van den Broeke, Oerlemans and AndreassenGiesen and others (2008). Monthly ratios were established by comparing the ITPCAS monthly wind speed in the corresponding grid with the observed values at AWS2-P. Figure 2a displays the reconstructed daily mean wind speed and the measurements at AWS2-P with a root-mean-square error (RMSE) of 2.3 m s−1.

Fig. 2. (a) Comparison of measured and reconstructed wind speed at AWS2-P on Parlung No. 4 glacier and (b) cumulative numbers of precipitation events and (c) cumulative precipitation amount at Parlung No. 4 glacier between the T-200B precipitation gauge and the scaled ITPCAS precipitation data during the periods June 2009–October 2010 and June–October 2012. (d) Daily precipitation recorded by T-200B precipitation gauge near Zhadang glacier and (e) measured and reconstructed daily precipitation from ITPCAS grid data at AWS1 near Parlung No. 4 glacier. Date format is yyyy-mm.
Precipitation data from T-200B were available from August 2010 to July 2012 for Zhadang glacier and from August 2010 to October 2010 and from June 2012 to October 2012 for Parlung No. 4 glacier. Reference Yang, Yao, Guo, Zhu, Li and KattelYang and others (2013) showed that the reconstructed data from the ITPCAS precipitation forcing are in good agreement with the T-200B precipitation gauge records, both in cumulative number of precipitation events and cumulative precipitation amounts (Fig. 2b and c). The ITPCAS gridded precipitation from November 2010 to May 2012 was therefore used to fill in the precipitation data gap on Parlung No. 4 glacier. The RMSE of daily precipitation between the measurement and reconstructed data was 1.4 mm. Figure 2d and e display the daily precipitation near Zhadang and Parlung No. 4 glaciers, respectively.
2.3. Meteorological variables recorded by the AWSs
2.3.1. Air temperature (T) and humidity
Daily mean air temperatures at the AWS sites (AWS1-Z and AWS3-P) display an almost perfect resemblance in both daily fluctuations and annual amplitude (Fig. 3a). The mean air temperatures over the measurement periods (from 15 August 2010 to 25 July 2012) were −6.3°C on Zhadang glacier and −5.6°C on Parlung No. 4 glacier (Table 2). The mean air temperature is 1.1°C higher on Parlung No. 4 glacier in the cold season (October–May), but the temperature difference during the ablation season (June–September) is smaller on both glaciers, probably because of air cooling by the melting surface and katabatic winds. The total hours with air temperature above 0°C were 4543 on Zhadang glacier and 5127 on Parlung No. 4 glacier.

Fig. 3. Daily mean values of air temperature (a), relative humidity (b), wind speed (c), incoming shortwave radiation (d) and atmospheric transmissivity (e) at 5665 m a.s.l. on Zhadang glacier and 5202 m a.s.l. on Parlung No. 4 glacier during the observation period 15 August 2010 to 25 July 2012. The atmospheric transmissivity was calculated by the methods of Reference Yang, He, Tang, Qin and ChengYang and others (2010). The other meteorological factors are measurement values. Date format is yyyy-mm.
Table 2. Mean values of meteorological variables and energy fluxes (W m−2) during different periods between 15 August 2010 and 25 July 2012 on Zhadang and Parlung No. 4 glaciers
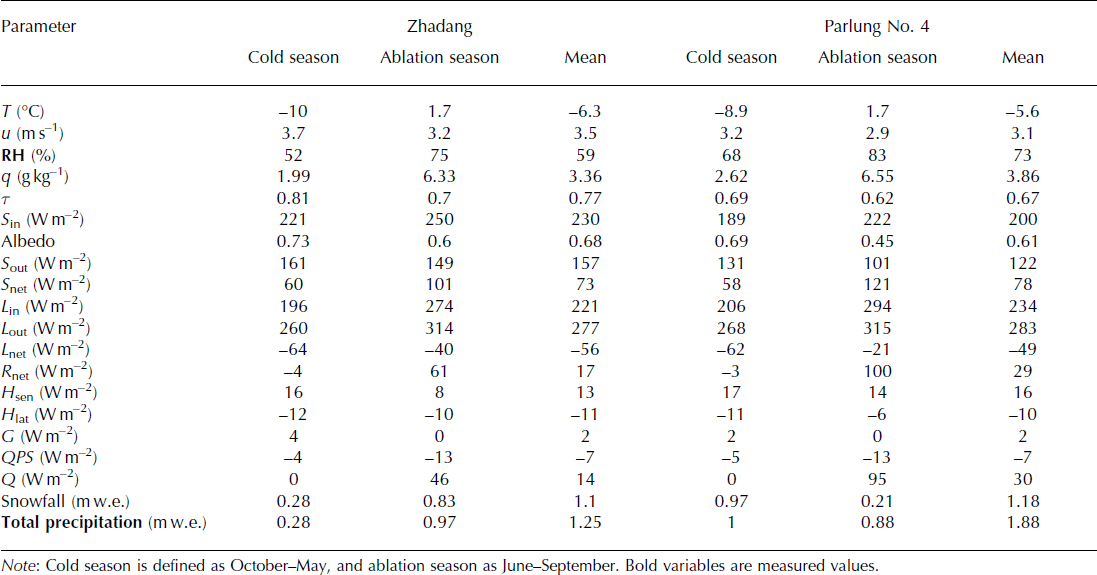
Due to the influence of the Indian summer monsoon, the mean relative humidity is higher in summer than in winter at both sites (Fig. 3b). Relative humidity remained generally between 60% and 100%, and daily values below 50% only occurred occasionally in winter and spring. The mean relative humidity is 14% greater and the specific humidity (q) is 0.5 g kg−1 higher on Parlung No. 4 glacier than on Zhadang glacier during the whole observation period, indicating a more continental climate on Zhadang glacier.
2.3.2. Wind speed (u) and wind direction (WD)
The wind speed rarely exceeded 10 m s−1, and the wind direction was predominantly from the south in summer for both glaciers (Fig. 3c). Wind speed was much stronger in winter than in summer and winds came predominantly from the northwest on Zhadang glacier and from the north on Parlung No. 4 glacier. Wind speeds are slightly higher on Parlung No. 4 glacier (Table 2). The dominant wind directions on the two glaciers are related to the local topography and local circulation (especially in the summer months) and large-scale circulation (especially in winter).
2.3.3. Incoming solar radiation (Sin)
The mean values of S in are 28 W m−2 larger in the ablation season, and 32 W m−2 larger in the cold season, on Zhadang glacier (Table 2; Fig. 3d). The difference in mean values of the top-of-atmosphere incoming solar radiation is neglected since the difference in latitude is only 1°. The influence of shading on S in is limited, especially in the ablation season when the solar zenith angle is much smaller, so the dominant factor determining the S in difference between the two glaciers should be cloud cover (Reference Greuell, Knap and SmeetsGreuell and others, 1997; Reference Strasser, Corripio, Pellicciotti, Burlando, Brock and FunkStrasser and others, 2004).
To quantitatively compare the cloudy conditions in two different climatic regions, we introduce radiative transmittance, a good index for uniform cloud cover (Reference Greuell, Knap and SmeetsGreuell and others, 1997). Radiative transmittance is the ratio of the measured S in to the calculated clear-sky incoming shortwave radiation. Hourly clear-sky incoming shortwave radiation data are calculated using the method suggested by Reference Yang, He, Tang, Qin and ChengYang and others (2010). Figure 3e shows that the daily mean values of atmospheric transmissivity are always higher on Zhadang glacier than on Parlung No. 4 glacier (Table 2).
2.4. The energy- and mass-balance model
The energy- and mass-balance model used in this study was first presented by Reference Yang, Yao, Guo, Zhu, Li and KattelYang and others (2013) and formulas are described in the Appendix. Here we present its most important features only. The model solves for

where M is the point mass balance (m w.e.), Q is the melt energy (W m−2), H lat is the turbulent latent heat flux (associated with ice/snow sublimation or deposition), L m and L v are the latent heat of ice melting (3.34 × 10⁵ J kg−1) and evaporation/sublimation (2.50 × 10⁶ J kg−1/2.83 × 106 J kg−1), respectively, and C en and P snow are the accumulation owing to the refreezing of meltwater and solid precipitation (m w.e.). The refreezing amount was calculated by the model proposed by Reference Fujita and AgetaFujita and Ageta (2000). Meltwater percolates vertically through the snowpack and refreezes where snow temperatures are below the melting point. When the snowpack is saturated with meltwater, the remaining meltwater is assumed to run off. P snow is modelled by the total daily precipitation (P) and two critical air temperature (T) thresholds for rain (T rain) and snow (T snow). We used linear interpolation to separate the rain and snow from measured precipitation. Q is calculated by the surface energy-balance equation
where S in and α are the incoming shortwave radiation and albedo, and L in and L out are the incoming and outgoing longwave radiation. Albedo and L in were optimized by AWS2-P on Parlung No. 4 glacier and AWS1-Z on Zhadang glacier (Fig. 4). The RMSE between the modelled and measured values is 0.11 and 19 W m−2 for albedo and L in, respectively. H sen and H lat are the sensible and latent heat fluxes and QG is the subsurface heat flux. Net longwave radiation is written as L net. R net is the sum of S net and L net. All fluxes are defined as positive when directed towards the surface. Heat supplied by rain is neglected in this study. The subsurface melt has not been calculated in the model, as in previous works (e.g. Reference Fujita and AgetaFujita and others, 2000; Reference Hock and HolmgrenHock and Holmgren, 2005; Reference Oerlemans, Giesen and Van den BroekeOerlemans and others, 2009). The units of energy-balance components are W m−2. The parameters of the model are listed in Table 5 in the Appendix.

Fig. 4. Measured and modelled daily mean albedo (a) and incoming longwave radiation (b) on Zhadang glacier during the observation period 15 August 2010 to 25 July 2012. Date format is yyyy-mm.
A set of observed daily data (air temperature, relative humidity, wind speed, precipitation and incoming shortwave radiation) from measurement periods was used as input data to run the energy- and mass-balance model. The initial and boundary conditions are set as follows. The initial snow thickness was set to zero on both sites. The densities of fresh snowfall and ice are 200 and 900 kg m−3, respectively, on both glaciers. The snowpack density will change with the refreezing of capillary water. In the model, the ice temperature at the lowest boundary was assumed to remain stable. The initial ice temperature profile was generated by continuously running the model over the measurement period until the 10 m temperature (−3.5°C) on Parlung No. 4 glacier and the 8 m temperature (−5.5°C) on Zhadang glacier were stable within 0.01°C.
3. Results
3.1. Model performance and parameter sensitivity
3.1.1. Model performance
Measured R net, surface temperature (T S) and surface height were used to evaluate the model results. Figure 5a and b show the modelled versus observed daily average R net for two AWS sites. The bias between measured and modelled R net is 1 and 5 Wm−2 for Zhadang glacier and Parlung No. 4 glacier, respectively, during the observation periods. The RMSE between modelled and observed R net is 29 and 34 W m−2, and the correlation coefficient is 0.84 and 0.85, for Zhadang and Parlung No. 4 glaciers, respectively, during the observation periods. T S was measured by AWS1-Z on Zhadang glacier (Fig. 5c). The overall agreement is good, although the surface temperatures are somewhat over-estimated in the snow/ice transition period. The RMSE between modelled and observed T S is 2.1°C, with a correlation coefficient of 0.96. Figure 5d and e show that the model reproduces the measured surface heights quite well. The RMSE between daily measured and modelled glacier surface heights (SR) is 0.11 and 0.18 m on Zhadang and Parlung No. 4 glaciers, respectively, over the measurement period.

Fig. 5. (a, b) Measured and modelled daily mean net radiation on Zhadang glacier (a) and Parlung No. 4 glacier (b) during the observation period 15 August 2010 to 25 July 2012. (c) Comparison between measured and modelled daily mean surface temperature at the AWS site on Zhadang glacier. (d, e) Evolution of surface heights measured by SR50 sensor (black), compared with the modelled curves (grey) at the AWS sites on Zhadang glacier (d) and Parlung No. 4 glacier (e). Date format is yyyy-mm.
3.1.2. Parameter sensitivity and uncertainty
Analysis of parameter sensitivity can be used to test the reliability of the mass components and to indicate which parameters are more influential in determining glacier mass-balance fluctuations. Sensitivity to individual parameters was investigated using the method of Reference Anslow, Hostetler, Bidlake and ClarkAnslow and others (2008). One parameter is varied by 5% intervals around the optimum values spanning a range of ±30%, and other parameters were held unchanged. Thirteen resulting values of the model mass-balance output were fitted using second-order polynomials. The slope of the second-order polynomials near the origin is used as an indicator of the sensitivity of the model to a given parameter (Reference Anslow, Hostetler, Bidlake and ClarkAnslow and others, 2008; Reference Heynen, Pellicciotti and CarenzoHeynen and others, 2013).
Figure 6 shows the magnitude of the calculated sensitivity for the parameters. For both glaciers, the most sensitive of the parameters are related to those in the albedo model (e.g. a freshsnow and a firn) and variations in C 1 and C 2 in the L in model. The sensitivity to the parameterization of albedo is high because shortwave radiation provides up to 60% of the melt energy on both glaciers. The higher mass-balance sensitivity to variations in the C 1 and C 2 of the L in model shows that L in has a great influence on the ablation rates. Indeed, L in is an important energy gain for the glacier melt, and the daily L in is larger than S in in the ablation season on both glaciers (Table 2). The parameters of albedo and L in can be carefully calibrated using measured values, which can reduce the uncertainty of the model. For the transfer coefficient of the turbulent heat flux calculation, the lower sensitivity is a result of the lower sum of H sen and H lat on both glaciers. The parameters related to snowfall, i.e. the threshold temperature (T rain), affect the mass balance by changing the accumulation and albedo, and the ratio of penetrating S net affects the energy for melt.
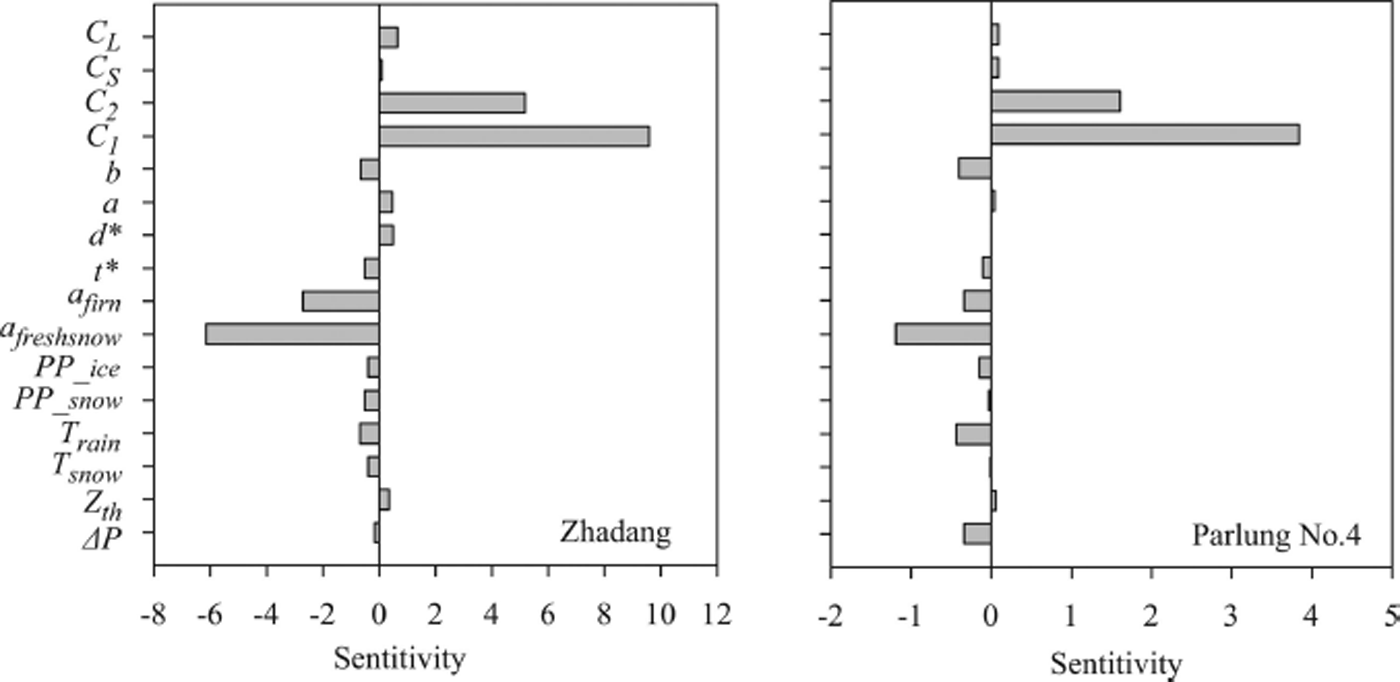
Fig. 6. Sensitivity of parameters for Zhadang and Parlung No. 4 glaciers during the observation period 15 August 2010 to 25 July 2012. Sensitivity is given as change in total mass balance per parameter change (dimensionless; from fig. 3 of Reference Heynen, Pellicciotti and CarenzoHeynen and others, 2013).
In addition, using Monte Carlo methods it is possible to evaluate the uncertainty in energy- and mass-balance model output to random errors in the parameters (Reference Anslow, Hostetler, Bidlake and ClarkAnslow and others, 2008; Reference Machguth, Purves, Oerlemans, Hoelzle and PaulMachguth and others, 2008). We analysed a suite of 1000 model runs to evaluate the distribution of simulated mass balance over a range of parameter values (randomly by ±5%). We did not take into account the parameters for albedo and L in on Zhadang glacier and parameters of L in on Parlung No. 4 glacier because they were calibrated by the measurements. The standard deviations of 1000 runs are 0.08 m w.e. on Zhadang glacier and 0.34 m w.e. on Parlung No. 4 glacier, and both are <10% of the total mass balance by control model during the observation period.
3.2. Energy fluxes on the two glaciers
The surface energy components on two glaciers are shown in Figure 7. The melt energy is 2.1 times larger on Parlung No. 4 glacier than on Zhadang glacier during the whole observation period, and melt mainly occurs in the ablation season (June–September). S net is, on average, 20 W m−2 larger on Parlung No. 4 glacier (Table 2) in the ablation season, as a result of different albedos of Zhadang and Parlung No. 4 glaciers. The mean surface albedo during the ablation season is ∼0.15 higher on Zhadang glacier than on Parlung No. 4 glacier. In addition, L net is 19 W m−2 less negative on Parlung No. 4 glacier than on Zhadang glacier in the ablation season (Fig. 7; Table 2). L in is 20 W m−2 higher on Parlung No. 4 glacier than on Zhadang glacier in the ablation season due to higher temperature, humidity and cloudiness, but L out was nearly equal on both glaciers. H sen is 6 W m−2 larger on Parlung No. 4 glacier than on Zhadang glacier in the ablation season due to higher air temperatures (Table 2). H lat is 4 W m−2 larger on Parlung No. 4 glacier in the ablation season because of a lower or reversed specific humidity gradient during a short period in summer, which means that condensation can occur (Fig. 7). The ground heat flux is small compared with the other energy fluxes (Fig. 7; Table 2). The average values of G and QPS in the ablation season are almost the same on both glaciers.
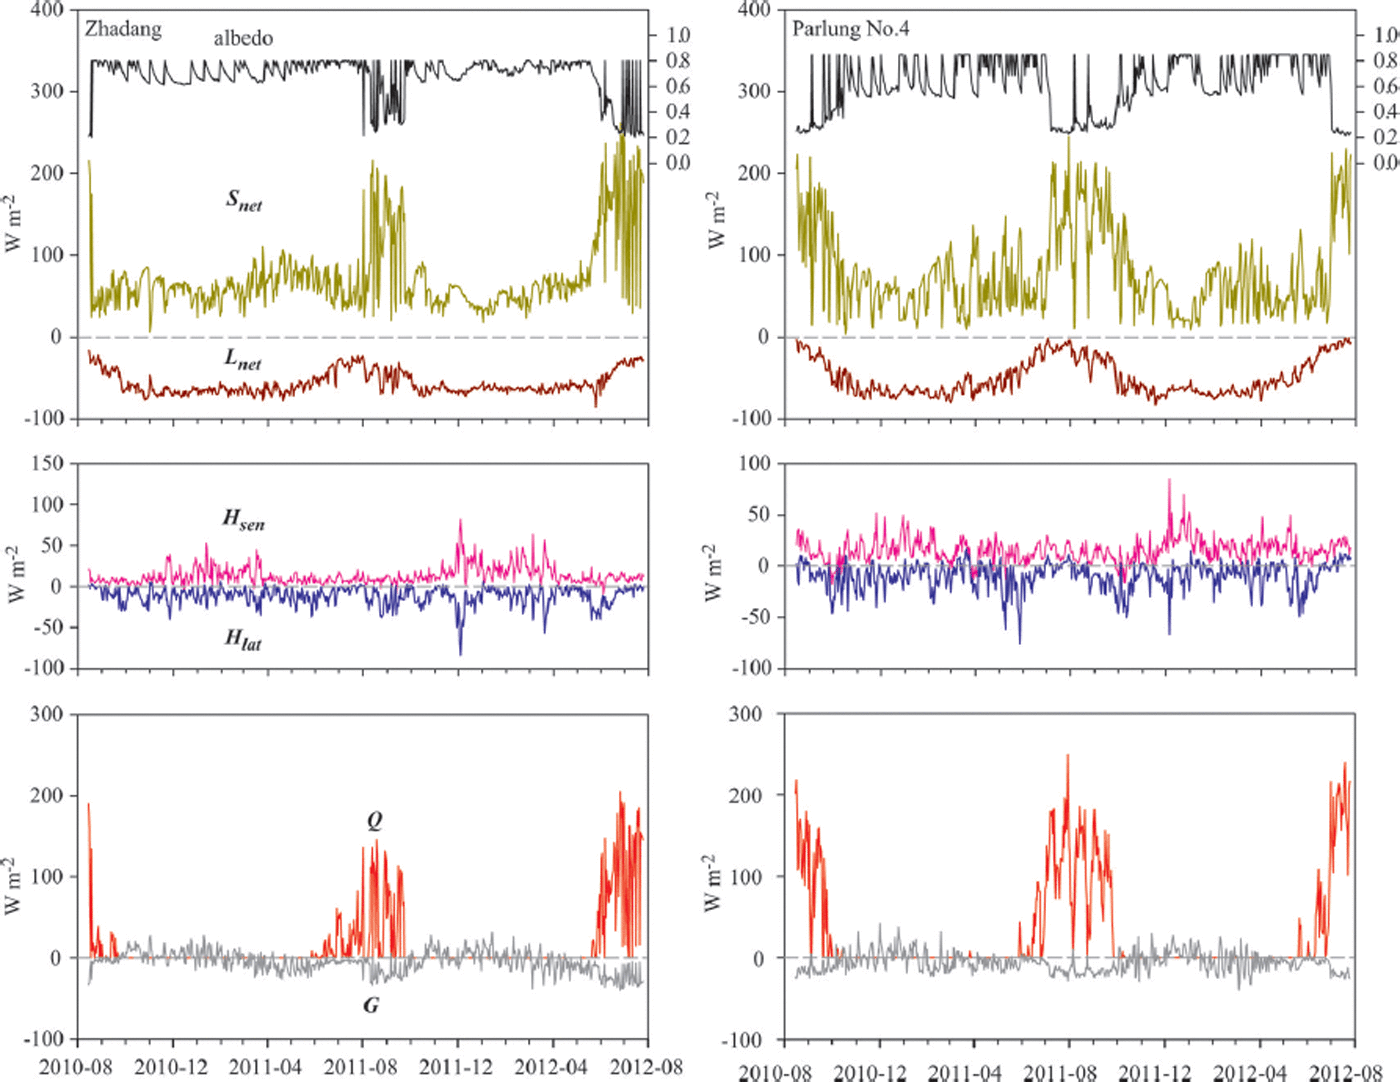
Fig. 7. Modelled daily mean surface energy fluxes on Zhadang and Parlung No. 4 glaciers during the observation period 15 August 2010 to 25 July 2012. Date format is yyyy-mm.
3.3. Mass-balance characteristics of the two glaciers
The glacier mass balance consists of surface melt, sublimation/evaporation, refreezing and snowfall. The point mass balance at the AWS site was −4.5 m w.e. on Parlung No. 4 glacier, nearly 2.5 times larger than for Zhadang glacier, during the period 15 August–25 July 2012 (Table 3). Surface melt dominated the glacier mass loss, with values of 2.85 m w.e. on Zhadang glacier and 5.63 m w.e. on Parlung No. 4 glacier. Mass loss through sublimation/evaporation was minor compared to surface melt, and sublimation/evaporation was similar on both glaciers (∼0.25 m w.e. on Zhadang glacier and 0.21 m w.e. on Parlung No. 4 glacier). During the cold season, sublimation is the most important factor for mass loss on both glaciers.
Table 3. Point-scale mass-balance components and surface characteristics between Zhadang and Parlung No. 4 glaciers for the observation period 15 August 2010 to 25 July 2012
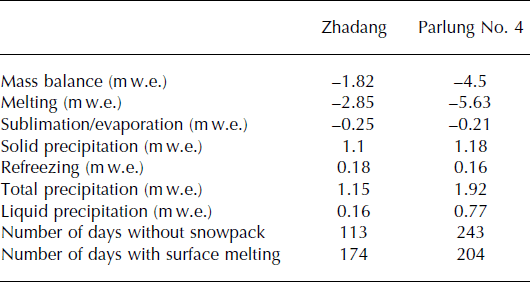
Mass gain is primarily due to solid precipitation, with a contribution of 1.18 m w.e. on Parlung No. 4 glacier and 1.1 m w.e. on Zhadang glacier during the observation periods (Table 3). Snow reaches its maximum thickness of 1.32 m at AWS3-P on Parlung No. 4 glacier in spring, but hardly any snow accumulates during summer at the same site (Fig. 8). On Zhadang glacier, the maximum snow-cover height reaches 0.64 m at the Indian summer monsoon onset (25 May–24 June; Reference Mölg, Maussion and SchererMölg and others, 2014), and frequent snowfall occurs in the ablation season (Fig. 8). In addition, we modelled a certain amount of meltwater that refroze into the snowpack, an important englacial mass storage on both glaciers. The refreezing amounts were similar on both glaciers (0.18 m w.e. on Zhadang glacier and 0.16 m w.e. on Parlung No. 4 glacier; Table 3).

Fig. 8. Modelled daily values of snowpack thickness at the AWS sites on Zhadang and Parlung No. 4 glaciers during the observation period 15 August 2010 to 25 July 2012. Date format is yyyy-mm.
4. Discussion
4.1. Representation of energy- and mass-balance comparison by two AWSs
The glacier equilibrium line is generally suitable for study of the different energy-balance and mass-balance characteristics. It is directly related to regional climate and provides a common measure location whereby changes can be compared directly (Reference Rupper and RoeRupper and Roe, 2008). Measured ELAs were available for both glaciers during the 2005/06 and 2006/07 balance years (Reference YaoYao and others, 2010; Reference YuYu and others, 2013). The elevation differences between the mean ELA (2 year average) and AWSs are 145 and 195 m on Zhadang and Parlung No. 4 glaciers, respectively. However, we note that the ELAs have obvious interannual fluctuations on Zhadang and Parlung No. 4 glaciers. A surrogate way to represent the balanced budget ELA is the mid-range altitude (Reference Evans and CoxEvans and Cox, 2005; Reference Braithwaite and RaperBraithwaite and Raper, 2009). The differences between the AWS sites and the mid-range altitude are 107m and 137m on Parlung No. 4 and Zhadang glaciers, respectively. This comparison of two AWS datasets may be considered an indicator of the meteorology and energy- and mass-balance differences.
4.2. Mechanism controlling the mass- and energy-balance difference between the two glaciers
Although both glaciers are influenced by the Indian summer monsoon during the ablation season, the point net mass loss was much larger on Parlung No. 4 glacier than on Zhadang glacier. In examining the temporal differences between each mass-balance component (Fig. 9a), it is clear that both solid precipitation and melt show large seasonal differences.
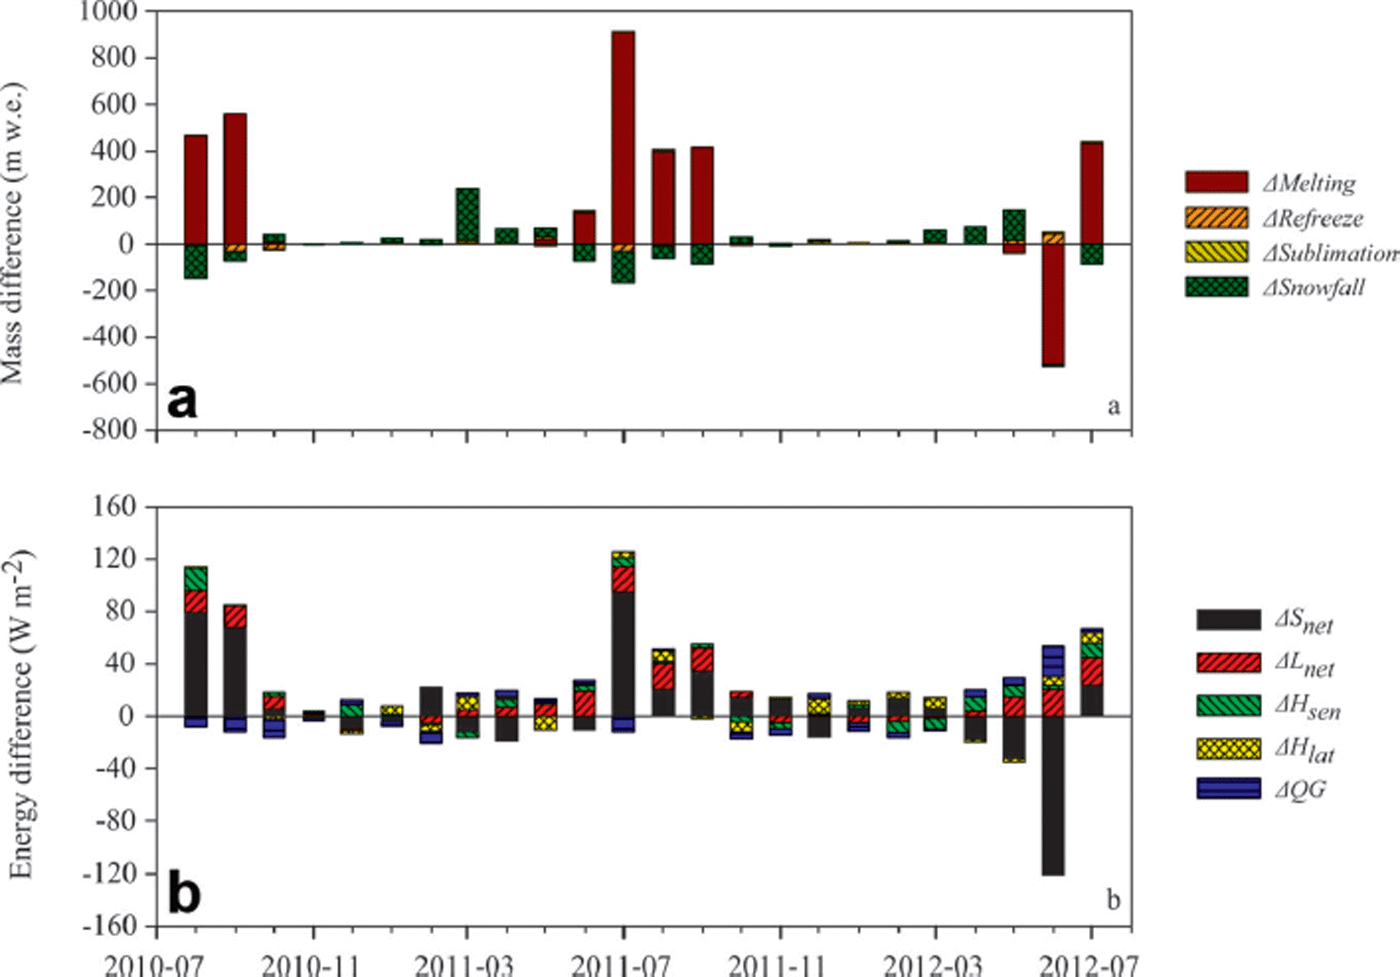
Fig. 9. Monthly differences of mass balance (a) and energy balance (b) between Parlung No. 4 and Zhadang glaciers. Note that the individual mass difference is defined as positive (negative) when the absolute value is larger (smaller) on Parlung No. 4 glacier. Date format is yyyy-mm.
As shown in Figure 9a, snowfall is larger on Zhadang glacier than on Parlung No. 4 glacier during summer (June–August), but less than on Parlung No. 4 glacier during spring (March–May). Most glaciers on the TP are ‘summer-accumulation type’, where maximum surface ablation and mass accumulation occur simultaneously in the summer, after the Indian summer monsoon (Reference Ageta and HiguchiAgeta and Higuchi, 1984; Reference FujitaFujita, 2008; Reference Maussion, Scherer, Mölg, Collier, Curio and FinkelnburgMaussion and others, 2014). Figure 8 and Table 2 show that snowfall events on Zhadang glacier primarily occur from June to September. In contrast, the maximum surface mass accumulation for glaciers on the southeastern TP occurs before the Indian summer monsoon onset. Snowfall and snow accumulation during March–May on Parlung No. 4 glacier is obvious from Figure 8 and Table 2, indicating that different accumulation stages (summer for Zhadang vs spring for Parlung No. 4 glacier) contribute to seasonal differences in the snowfall supply.
Figure 9a also illustrates distinct seasonal mass melt. Figure 9b shows that the dominant factor controlling such differences is net shortwave radiation followed by net longwave radiation. Since both summer and annual incoming solar radiations are larger on Zhadang glacier due to less cloud cover (Table 2), higher surface albedo may be responsible for this lower net shortwave radiation. The most striking differences occur in July–September, when Zhadang glacier has more frequent and a greater amount of snowfall than Parlung No. 4 glacier (Figs 8 and 9). Due to the surface snow albedo feedback mechanism (Reference Oerlemans, Giesen and Van den BroekeOerlemans and others, 2009), more solar radiation will be absorbed for snowmelt due to a lower albedo, which in turn accelerates disappearance of the snowpack and sustains a lower albedo.
In addition to surface albedo, a secondary but important factor for energy difference between the two glaciers is L in (Fig. 9b; Table 2). For example, during the 2011 ablation season, the mean values of L in were ∼21 W m−2 larger on Parlung No. 4 glacier and displayed a weak seasonal pattern. The value of L in depends on the temperature and humidity of the atmosphere and on cloud cover (Reference Sicart, Hock, Ribstein and ChazarinSicart and others, 2010). As shown in Table 2 and Figure 3, Zhadang glacier lies under a relatively cold-arid and cloudless environment, whereas Parlung No. 4 glacier exists in a warm-humid and cloudy climate. The longwave radiation emission capacity of the atmosphere is stronger on glaciers on the southeastern TP.
4.3. Energy-balance comparison to other glaciers on the TP
To compare the surface energy fluxes with values from other glaciers, we collected published energy flux data obtained from different glaciers on the TP (Table 4). The criteria for these data are that the reported values consist mostly of averages in the ablation zone over the ablation season. It should be kept in mind that these comparisons are altered by the different empirical methods for turbulent heat flux calculation, different meteorological conditions in different observational years, and the accuracy of instruments in different studies. The objective of our comparison is to detect possible spatial characteristics of energy balances on different types of glaciers under different climatic conditions.
Table 4. Comparison of mean energy fluxes (W m−2) between different types of glaciers on the Tibetan Plateau for the ablation season (note different lengths of periods) and at the point scale
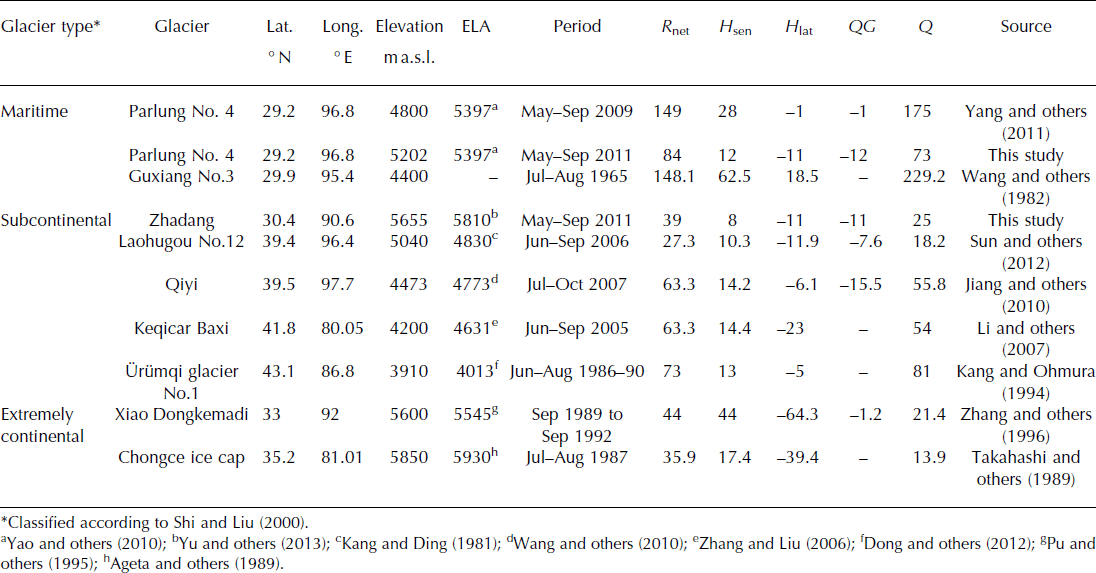
From the energy consumption perspective, energy losses below or at the ELA on most maritime and subcontinental glaciers appear to be dominated by surface melting, whereas the energy for surface sublimation (H lat) appeared to increase on the continental glaciers (Xiao Dongkemadi glacier and Chongce ice cap). This pattern is consistent with Reference Rupper and RoeRupper and Roe’s (2008) large-scale theoretical energy- and mass-balance model, showing ablation at the ELA is dominated by sublimation in regions where precipitation is low, but controlled by melting in regions where precipitation is high. Such differences in energy consumption between maritime/subcontinental and continental glaciers indicate a spatial variability in sensitivity to climate change on different glaciers (Reference FujitaFujita, 2008; Reference Rupper and RoeRupper and Roe, 2008).
From the energy supply perspective, net radiation is the largest source of incoming energy on most Tibetan glaciers, followed by sensible heat flux. The percentage contribution of net radiation to surface energy supply ranges from 70% to 85% on most maritime and subcontinental glaciers (except Guxiang No. 3 glacier), but this percentage decreases on the continental glaciers (50% for Xiao Dongkemadi glacier and 67% for Chongce ice cap).
Finally, energy for surface melting on different types of glaciers seems to be related to their geographical climate conditions. We take Parlung No. 4, Qiyi, Keqicar Baxi and Xiao Dongkemadi glaciers as examples for comparison. The observational elevation of Parlung No. 4 glacier (4800 m a.s.l.) is higher than that of the other glaciers. However, the melting energy on this glacier is approximately two to three times larger than that of the other glaciers. This warm-wet climatic combination provides additional L in and turbulent heat flux for glacier melt, and the higher air temperature may lead to less accumulation and lower albedo on the glacier due to reduced snowfall. However, we assume that the available energy experiments represent the mean condition of each glacier, without considering the annual variation of energy components. Therefore, we acknowledge that the quantification of the relationship between melting energy and geographical conditions requires further work, including additional observations during the same observation periods and using the same experimental procedures.
5. Conclusions
Based on 2 years of glacio-meteorological data observed from 15 August 2010 to 25 July 2012 on Zhadang and Parlung No. 4 glaciers, we studied the point-scale energy- and mass-balance differences between subcontinental and maritime glaciers of the TP using a physical energy and mass-balance model. Meteorological conditions reveal a maritime climate on Parlung No. 4 glacier, with higher air temperature, higher humidity and more frequent cloud cover than the relatively cold-dry climate on Zhadang glacier. The mass-balance comparison shows that mass accumulation on Parlung No. 4 glacier occurred mainly before the Indian summer monsoon onset, but the maximum mass accumulation for Zhadang glacier occurred after the Indian summer monsoon. On Parlung No. 4 glacier, total net mass loss at the AWS site was 4.5 m w.e., nearly 2.5 times higher than for Zhadang glacier. The largest difference lies in the amount of melt, with values of 2.85 m w.e. on Zhadang glacier and 5.63 m w.e. on Parlung No. 4 glacier. Different albedos and different longwave radiation emission of the atmosphere under these two climatic environments determine the mass loss difference between the two glaciers. Finally, a tentative analysis of the spatial characteristics of glacier energy fluxes on the TP and in the surrounding regions found possible energy-balance patterns under different climatic conditions. But it elucidated the general problems of data availability and consistency that hinder the quantitative comparison of glacier responses under various climatic conditions. In our study we used a consistent modelling system on two glaciers during a parallel time period, which is a step forward. Future studies should focus on distributed modelling on larger spatial and temporal scales.
Acknowledgements
We acknowledge the staff at the Nam Co Monitoring and Research Station for Multisphere Interactions, Institute of Tibetan Research, Chinese Academy of Sciences (CAS), for help in the field. We thank four anonymous reviewers and the editor, Thomas Mölg, for valuable insights that greatly strengthened the manuscript. We thank the National Climate Center, China Meteorological Administration, for providing the climate data used herein. This study was jointly funded by the National Natural Science Foundation of China (grant 41190081), the Strategic Priority Research Program (B) of CAS (grant XDB03030208) and the National Natural Science Foundation of China (NSFC) (grants 41371085 and 41201058). F.M. and E.H. acknowledge support from the German Federal Ministry of Education and Research (BMBF) Programme ‘Central Asia – Monsoon Dynamics and Geo-Ecosystems’ (CAME) within the WET project (‘Variability and Trends in Water Balance Components of Benchmark Drainage Basins on the Tibetan Plateau’) under the code 03G0804A and 03G0804E, and from the German Research Foundation (DFG) Priority Programme 1372, ‘Tibetan Plateau: Formation–Climate–Ecosystems’, within the DynRG-TiP (‘Dynamic Response of Glaciers on the Tibetan Plateau to Climate Change’) project under the codes SCHE 750/4-1, SCHE750/4-2, SCHE 750/4-3 and SCHN 680/3-1, SCHN 680/3-2, SCHN 680/3-3. F.M. acknowledges further support from the Austrian Science Fund (FWF project P22443-N21).
Appendix: Description of Parameters and Formulas in the Energy- and Mass-Balance Model
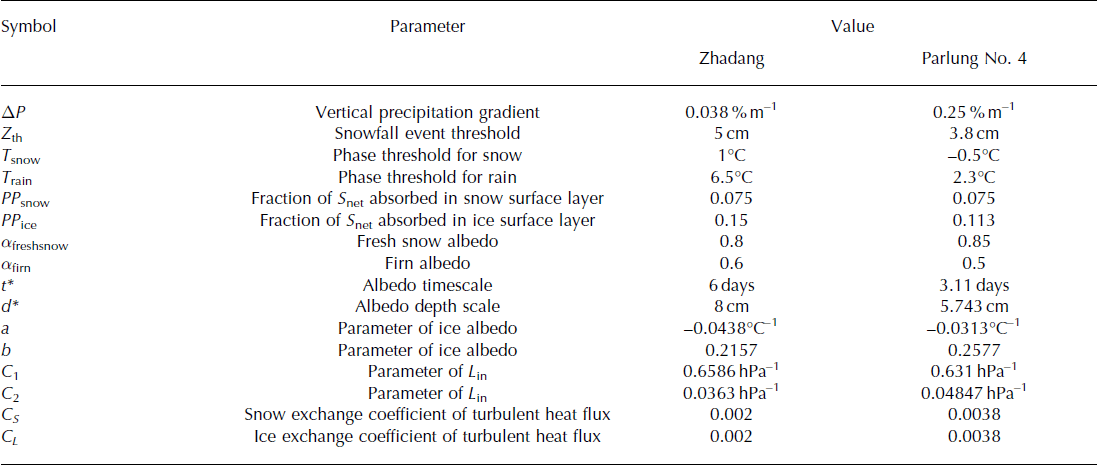
Albedo (α) is parameterized for both glaciers, as in Reference Yang, Yao, Guo, Zhu, Li and KattelYang and others (2013) on Parlung No. 94 glacier and Reference Mölg, Maussion, Yang and SchererMölg and others (2012) on Zhadang glacier. The ice surface albedo was assumed to vary as a function of the dew-point temperature (Reference Mölg, Cullen, Hardy, Kaser and KlokMölg and others, 2008):


where α ice is ice surface albedo, a and b are the two constants, T c is dew-point temperature, α s is the albedo of snow, which is calculated using Eqn (A2), α firn is the firn albedo, α freshsnow is the fresh-snow albedo, s is the time since the last snowfall event (days), i is the actual time, t* is timescale, d is the snow depth (cm) and d* is the characteristic scale for snow depth. Given that the relatively thin fresh snowpack likely melted away within a few hours in summer, a snowfall threshold (Z th) was introduced to determine whether fresh snowfall could persist through an entire daily cycle. The L in value is calculated according to the air temperature and humidity (Reference DuguayDuguay, 1993):
where T is the air temperature, e a is the water vapour pressure of the air (hPa) calculated from relative humidity and air temperature, σ is the Stefan–Boltzmann constant (5.67 × 10⁻⁸ W m−2 K−4) and C 1 and C 2 are empirical constants (Table 5). L out is calculated conventionally by the Stefan–Boltzmann law from modelled surface temperature (T S) and surface emissivity (ε = 1):
Table 5. Input parameters for the energy- and mass-balance model on Zhadang and Palrung No. 4 glaciers
The turbulent fluxes are computed using the bulk method based on differences in temperature, humidity and wind speed between the measurement level and the surface.
where ρ air is the density of air (kg m−3), Cp is the specific heat of air at constant air pressure (1006 J kg−1 K−1), CS and CL are constant bulk exchange coefficients used to calculate the turbulent heat flux (Reference Yang, Yao, Guo, Zhu, Li and KattelYang and others, 2013; Reference ZhangZhang and others, 2013), u is the wind speed (m s−1) and q and q s are the specific humidity at 2 m and at the snow/ice surface, respectively.
The total energy flux in the subsurface (QG) consists of a conductive heat flux (G) and an energy flux due to the penetrating shortwave radiation (QPS). The conductive heat flux (G) was computed from the one-dimensional heat-transfer equation for 0.1 m thick layers for snow and 0.5 m layers for ice below snow. Meanwhile, the model classified each layer as snow and ice. The penetrating shortwave radiation (QPS) was calculated as fractions of the net shortwave radiation over snow (PP snow) and ice (PP ice). The values of the extinction coefficient in QPS are taken from Reference Yang, Yao, Guo, Zhu, Li and KattelYang and others (2013) on Parlung No. 4 glacier and from Reference Mölg, Maussion and SchererMölg and others (2014) on Zhadang glacier. Using an iterative procedure, the surface energy balance was solved for the surface temperature T S (Reference Fujita and AgetaFujita and Ageta, 2000; Reference Yang, Yao, Guo, Zhu, Li and KattelYang and others, 2013). If the T S determined by the model is higher than the melting point temperature, T S is set back to 0°C, and the excess energy is used for melting.
P snow is modelled by the total daily precipitation P, which is calculated by the vertical precipitation gradient ΔP, and two critical air temperature thresholds for rain (T rain) and snow (T snow). We used linear interpolation to separate the rain and snow from measured precipitation. The T snow and T rain for Zhadang glacier are assumed to be 1°C and 6.5°C (Reference Zhou, Kang, Gao and ZhangZhou and others, 2010; Reference Mölg, Maussion, Yang and SchererMölg and others, 2012), respectively, and −0.5°C and 2.3°C for Parlung No. 4 glacier (Reference Yang, Yao, Guo, Zhu, Li and KattelYang and others, 2013).


