1. INTRODUCTION
Cryoconite is a dark-coloured granular sediment found in supraglacial environments, and it represents an aggregate of mineral particles, black carbon (BC) and organic matter (OM) formed by microbial communities (Hodson and others, Reference Hodson2008; Stibal and others, Reference Stibal, Sabacka and Zarsky2012; Cook and others, Reference Cook, Edwards, Takeuchi and Irvine-Fynn2016). This sediment originates from supraglacial and englacial entrainment, landslides from valley walls and aeolian processes through both natural and anthropogenic pathways (Mcintyre, Reference Mcintyre1984; MacDonell and Fitzsimons, Reference MacDonell and Fitzsimons2008). Cryoconite significantly accelerates glacial melting by reducing the surface albedo and absorbing substantial solar radiation because of its dark colour (Takeuchi and others, Reference Takeuchi2015). Accordingly, cryoconite can often be found in small ice-lidded holes on the Antarctic ice sheet (Foreman and others, Reference Foreman, Sattler, Mikucki, Porazinska and Priscu2007), open holes or dispersed over the ablation surface of the Greenland ice sheet (Bøggild and others, Reference Bøggild, Brandt, Brown and Warren2010), European Alpine glaciers (Di Mauro and others, Reference Di Mauro2017) and Tibetan glaciers (Dong and others, Reference Dong2016). Thus, it is important to study the roles of cryoconite in surface albedo reduction and ablation, particularly in areas where glaciers are experiencing rapid shrinking.
BC can strongly enhance absorption at visible and near-IR wavelengths (Dal Farra and others, Reference Dal Farra2018), whereas iron oxides, the primary light-absorbing component in mineral dust, reduce UV and visible reflectance (Lafon and others, Reference Lafon, Sokolik, Rajot, Caquineau and Gaudichet2006; Zhang and others, Reference Zhang, Wu, Zhang, Xu and Zhou2015). Therefore, BC and iron oxides have been regarded as the strongest light-absorbing impurities (LAIs) in the atmosphere and on ice and snow after deposition (Tegen and others, Reference Tegen1997; Sokolik and Toon, Reference Sokolik and Toon1999; Hansen and Nazarenko, Reference Hansen and Nazarenko2004; Flanner and others, Reference Flanner, Zender, Randerson and Rasch2007; Bond and others, Reference Bond2013). Spatiotemporal variations in BC and dust (also Fe) have been observed, and their climatic implications have been assessed with respect to mountain glaciers (Qu and others, Reference Qu2014; Kaspari and others, Reference Kaspari, Skiles, Delaney, Dixon and Painter2015; Li and others, Reference Li2017; Zhang and others, Reference Zhang2017a), ice sheets (Clarke and Noone, Reference Clarke and Noone1985; Doherty and others, Reference Doherty, Warren, Grenfell, Clarke and Brandt2010; Aoki and others, Reference Aoki2014) and seasonal snow (Painter and others, Reference Painter2010; Huang and others, Reference Huang2011; Doherty and others, Reference Doherty, Dang, Hegg, Zhang and Warren2014). However, studies reporting the concentrations of LAIs in cryoconite remain limited. In the Morteratsch Glacier (Swiss Alps), the concentrations of BC and Fe in cryoconite were 2.2–10 and 27.7–50.5 mg g−1, respectively (Baccolo and others, Reference Baccolo2017; Di Mauro and others, Reference Di Mauro2017). The Fe concentrations in cryoconite from a Himalayan glacier (25.1 ± 2.2 mg g−1) were higher than those from Arctic glaciers (16.7–22.3 mg g−1) (Singh and others, Reference Singh2017), and the highest Fe concentration in cryoconite was reported for the Qiyi Glacier in the central Qilian Mountains (44.8–53.6 mg g−1) (Wu and others, Reference Wu, Xu, Zhang, Zhang and Yan2016). However, most studies have focused on the total mass per unit area or treated the OM in cryoconite as the only solar light absorber. The abundance of cryoconite on glacial ablation surfaces in the Arctic (Takeuchi and others, Reference Takeuchi, Kohshima, Goto-Azuma and Koerner2001a, Reference Takeuchi, Nagatsuka, Uetake and Shimada2014) was found to be much lower than that on glaciers on the Tibetan Plateau and its surroundings, which is referred to as the Third Pole (Takeuchi and others, Reference Takeuchi, Kohshima and Seko2001b, Reference Takeuchi, Matsuda, Sakai and Fujita2005, Reference Takeuchi, Uetake, Fujita, Aizen and Nikitin2006). The amount of OM contained in cryoconite represented <3% of the total impurities in Antarctica (Foreman and others, Reference Foreman, Sattler, Mikucki, Porazinska and Priscu2007) and represented 5–10% of the total impurities in the Third Pore (Takeuchi and others, Reference Takeuchi, Kohshima and Seko2001b, Reference Takeuchi, Matsuda, Sakai and Fujita2005, Reference Takeuchi, Uetake, Fujita, Aizen and Nikitin2006; Takeuchi and Li, Reference Takeuchi and Li2008), the subarctic (Takeuchi and others, Reference Takeuchi, Kohshima, Goto-Azuma and Koerner2001a; Stibal and others, Reference Stibal, Sabacka and Kastovska2006) and Greenland (Hodson and others, Reference Hodson2010; Takeuchi and others, Reference Takeuchi, Nagatsuka, Uetake and Shimada2014). Recently, Cong and others (Reference Cong2018) found that the OM in cryoconite was the most important light absorber at wavelengths of 450 and 600 nm and that goethite played a stronger role than BC at shorter wavelengths for most glaciers on the Tibetan Plateau. Moreover, it has been suggested that ice algae, especially during blooms, can darken the surface of the Greenland ice sheet (Yallop and others, Reference Yallop2012; Wang and others, Reference Wang, Tedesco, Xu and Alexander2018; Williamson and others, Reference Williamson2018). In addition, Ganey and others (Reference Ganey, Loso, Burgess and Dial2017) determined that microbial communities on the snow surface contributed to 17% of the total melting on an Alaskan icefield.
Compared with snow and ice surfaces, cryoconite typically exhibits stronger light absorption, and its broadband albedo is <0.1 due to its effective absorption of visible and near-IR wavelengths (Bøggild and others, Reference Bøggild, Brandt, Brown and Warren2010; Di Mauro and others, Reference Di Mauro2017). Thus, cryoconite can effectively influence the mass balance of glacier surfaces. In the ablation area of the Yala Glacier (Nepal Himalaya), dark-coloured cryoconite accelerated surface melting at a rate approximately three-fold greater than that of impurity-free bare ice from which cryoconite material had been removed (Kohshima and others, Reference Kohshima, Seko and Yoshimura1993). In Russian Siberia, impurities increased the melting rate of ice surfaces by a factor of 1.6–2.6 with respect to clean bare ice without impurities (Takeuchi and others, Reference Takeuchi2015). However, studies on the impacts of LAIs in cryoconite on albedo reduction and glacial melting in the Third Pole are still limited. Glaciers in this region could be greatly affected by the emissions of anthropogenic pollutants from East and South Asia (Kopacz and others, Reference Kopacz2011).
This study aimed to describe the reduction in albedo and the enhancement of surface ablation by cryoconite in the western Qilian Mountains. In the present work, cryoconite samples were collected from Laohugou Glacier No. 12 (LHG) on the north-eastern Tibetan Plateau during the summer of 2015. The size distribution of incoherent granular cryoconite particles was measured (range 0.02–2000 µm), and we evaluated the concentrations and light absorbability of BC, organic carbon (OC) and Fe in cryoconite. Furthermore, the spectral and broadband albedos of both cryoconite and snow/ice surfaces were examined. A control experiment was carried out in the field to investigate the role of cryoconite in the acceleration of glacial melting.
2. DATA AND METHODS
2.1 Study area
LHG is the largest valley glacier in the western Qilian Mountains, and it is located on the north-eastern Tibetan Plateau (96°30′−35′E, 39°25′−30′N; 4260–5481 m; Fig. 1a); faces northwest; covers an area of 20.4 km2; and is ~9.85 km long (Du and others, Reference Du, Qin, Liu and Wang2008). The average equilibrium line altitude of LHG is ~5015 m (Chen and others, Reference Chen2017). The climate is typically arid and continental because it is controlled by the Siberian anticyclone and the westerly wind regime (Zhang and others, Reference Zhang, Qin, Du, Liu and Sun2013). Since 1957, the terminals of LHG has retreated 240 m (Du and others, Reference Du, Qin, Liu and Wang2008), and the surface height has decreased by 18.6 ± 5.4 m, corresponding to a total volume loss of 0.218 km3 (Zhang and others, Reference Zhang, Liu, Shangguan, Li and Zhao2012). Over the same time period, the entire glacial area in the river basin has been reduced by 11.59% (Zhang and others, Reference Zhang, Qin, Du, Liu and Sun2013) as a result of the increase in the annual mean temperature of 0.3°C per decade (Qin and others, Reference Qin2015). Moreover, Sr-Nd isotopes and rare earth element geochemistry have indicated that dust in LHG primarily originates from the nearby Qaidam basin and the Tengger and Badain Jaran Deserts via long-range transport (Wei and others, Reference Wei, Dong, Kang, Qin and Guo2017).
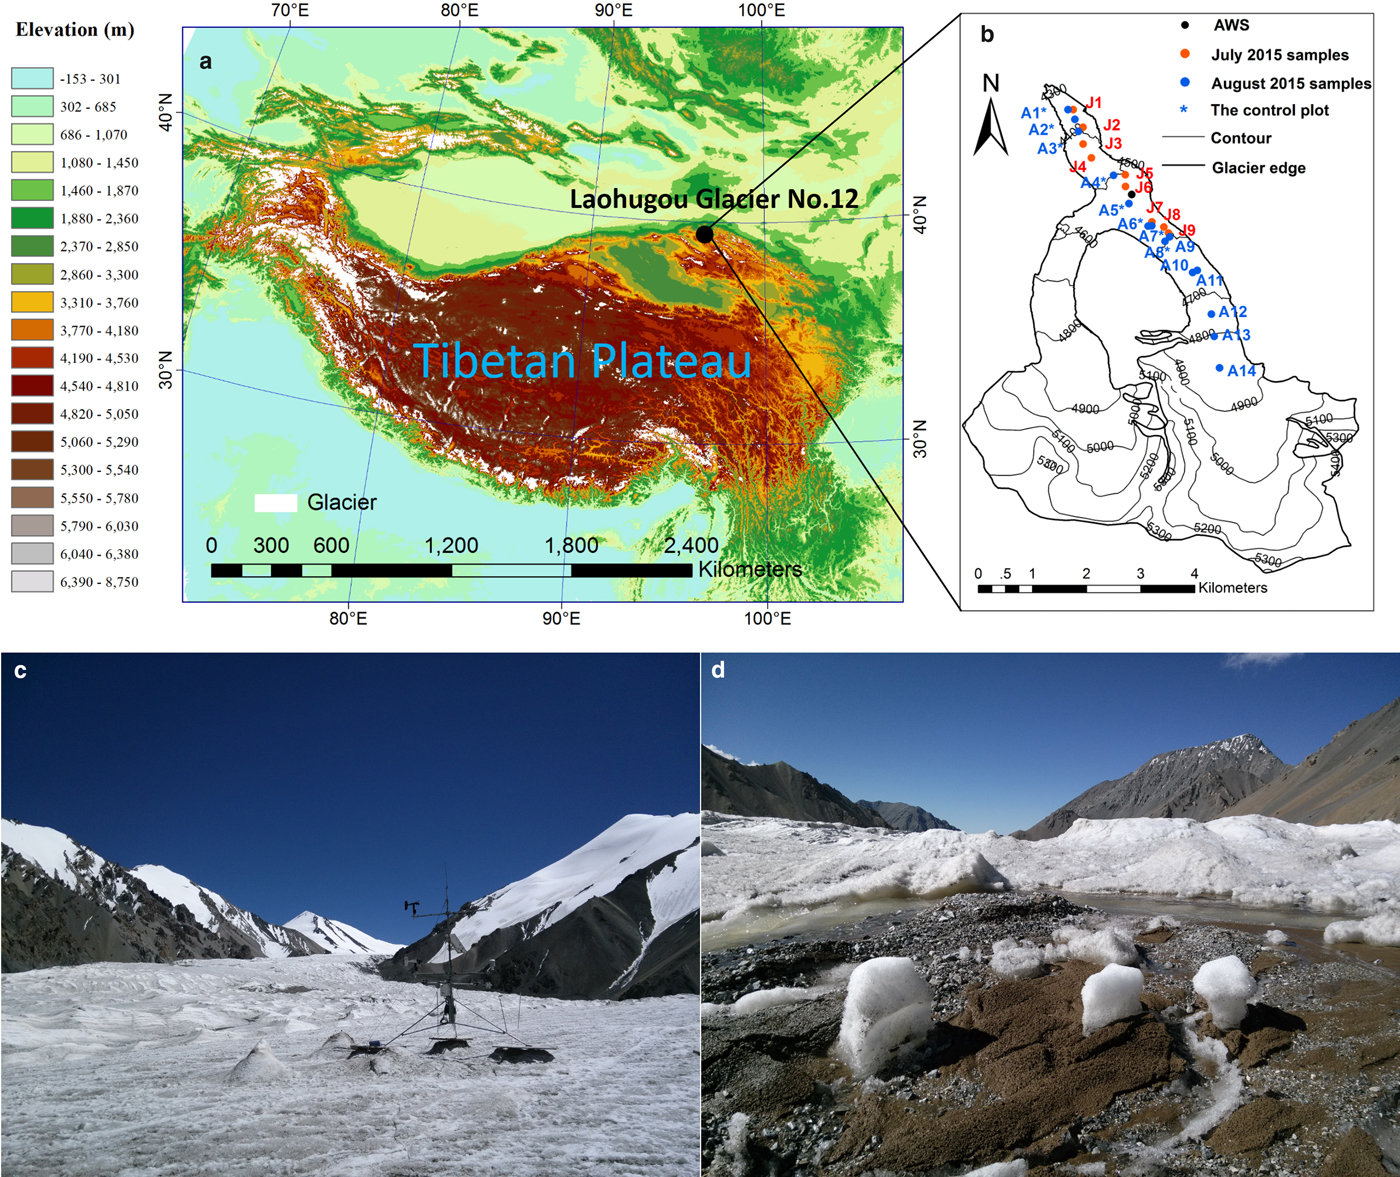
Fig. 1. (a) Topographic map (units: m) of LHG in the western Qilian Mountains, with (b) the sampling sites marked. The control experiments were implemented at A1-8. (c) Typical surface in the ablation zone of LHG and (d) glacier ice covered by debris and cryoconite at A8.
2.2 Sample collection
In the beginning of July 2015, cryoconite was commonly found in holes at a few centimetres deep and a few millimetres/centimetres wide. However, when we collected the samples, the cryoconite typically appeared as surface cryoconite and cryoconite basins and mounds. Surface cryoconite (i.e., dirty ice) is defined as a mixture of cryoconite granules and ice crystals on the glacier surface. Cryoconite basins are holes whose widths exceed their depths, and the floors of these basins are entirely covered by a combination of cryoconite material and water. Cryoconite mounds are composed of damp cryoconite materials that are concentrated and exposed on the glacier surface.
In total, 23 cryoconite samples from the ablation zone on LHG were collected with a stainless-steel shovel at elevations from 4350 to 4598 m on 25 July (nine samples, J1–J9) and 13 August 2015 (eight samples, A1–A8) and from 4598 to 4848 m on 16 August 2015 (six samples, A9–A14) (Fig. 1b). Sample sites of 25–400 cm2 area were established with an approximate elevation interval of 50 m, typically on flat and homogeneous surfaces and along the centre line of LHG, and cryoconite was taken from the top 1–3 cm. The cryoconite samples were stored in Nalgene bottles (250 ml, high-density polyethylene) and then transported to the State Key Laboratory of Cryospheric Science (Lanzhou) within a container filled with ice. All the samples were kept frozen until further analysis.
2.3 Laboratory analysis
2.3.1 Grain size measurement
The cryoconite samples were freeze-dried at −70°C and then divided into six subsamples for measuring grain size, total Fe, BC, total carbon (TC), inorganic carbon (IC, i.e., carbonate) and backup. The original subsamples for measuring grain size were weighed to ~0.35 g using a microbalance (accuracy: 0.1 mg). The samples were then treated sequentially with 10 ml of 30% H2O2 (to remove OM), 10 ml of 1.5 M HCl and 10 ml of 1% sodium hexametaphosphate [(NaPO3)6] dispersant and sonicated for 90 s for dispersal (Feng and others, Reference Feng, Hu, Ju and Lin2014). A Malvern Mastersizer 3000 was employed to examine the grain size distributions of the cryoconite samples.
2.3.2 Analysis of total Fe
Subsamples for the total Fe and carbonaceous matter analyses were ground into powder form (sieved in 75 µm). Subsamples (~20 mg) for total Fe were dissolved via a pressurized acid digestion procedure following previously described methods (Liang and others, Reference Liang, Jing and Gregoire2000). The abundances (by mass) of total Fe in the cryoconite was determined using inductively coupled plasma optical emission spectrometry (Teledyne Leeman Labs). A USGS geochemical reference standard (Andesite, AGV-2) was repeatedly measured to ascertain the accuracy and precision of the total Fe measurements. The measured values for total Fe agreed well with the standard (recovery of >94%). For each sample, total Fe was measured three times, and the relative std dev. were all <10%.
2.3.3 Measurement of carbonaceous matter
Elemental carbon (EC) is typically used as a proxy for BC because they are composed of the same fraction of carbonaceous particles (Lavanchy and others, Reference Lavanchy, Gaggeler, Schotterer, Schwikowski and Baltensperger1999). In the present work, a procedure for separating BC from lake sediments was adapted for determining the BC in the cryoconite, and the detailed protocol can be found in previous papers (Han and others, Reference Han2011; Cong and others, Reference Cong2013). Briefly, ~0.1 g of the powder subsamples for BC was acid-treated (HCl and/or HF) to avoid disturbances in the carbonates and other minerals, and the samples were then filtered via quartz fibre filters (Tissuquarz 2500QAO-UP, Pall, USA) that were 47 mm in diameter and presented an even distribution. The filters were analysed for BC using a thermal-optical carbon analyser (DRI 2015 model) according to the IMPROVE-A protocol, with the standard OC–EC split at 635 nm (Chow and others, Reference Chow2007), and we used varieties of the thermal-optical reflectance (TOR) and transmittance (TOT) signals to determine the BCTOR and BCTOT, respectively. Moreover, three blanks were prepared and analysed following the same procedure as the samples, although no BC was detected. TC and IC were analysed using a TOC-VCPH carbon analyser (Shimadzu Corp., Japan), and the results were calculated as mass percentages. Thus, OC = TC − IC − BC (the average of BCTOR and BCTOT).
2.4 Measurement of spectral albedo
The reflectance measurements of cryoconite/snow/ice surface were carried out with an Analytical Spectral Devices FieldSpec 3 (ASD® FS-3) spectroradiometer (radiation wavelengths: 350–2500 nm) during the field survey in 2015. To cover the sample surface, the sensor (25° collimating lens) was held at an ~0.5 m height (footprint: 386 cm2) directly above the sample surface. A nearly perfect Lambertian reflector was used as a white reference surface, which was measured before and after each new measurement (Cook and others, Reference Cook2017). At each site, the spectral albedos were measured ten times and averaged within 5 min, with the assumption that the effect of atmospheric and illuminative conditions cannot be altered (Negi and Kokhanovsky, Reference Negi and Kokhanovsky2011).
To minimize disturbances from significant stray light at shorter wavelengths, we calculated only the broadband albedos at radiation wavelengths from 500 to 2500 nm via a standard terrestrial solar spectral irradiance distribution, which was provided by the American Society for Testing and Materials (ASTM G-173-03 data). The broadband albedo (α broad) was calculated by Eqn (1):
 $$\alpha _{{\rm broad}} = \displaystyle{{\mathop \int \nolimits_{500}^{2500} \alpha _{{\rm narrow}}(\lambda )i(\lambda ){\rm d}\lambda} \over {\mathop \int \nolimits_{500}^{2500} i(\lambda ){\rm d}\lambda}} $$
where α narrow(λ) and i(λ) denote the measured narrowband albedo and incoming solar irradiance reference at wavelengthλ, respectively (Ming and others, Reference Ming, Wang, Zhao and Chen2013).
2.5 Calculation of Incident Radiative Forcing
In terms of the broadband albedo (α broad) and broadband albedo reduction caused by LAIs (![]() ${\rm AR}_x^{{\rm broad}} $), the Incident Radiative Forcing (IRF) absorbed by the glacier surface and LAIs can be obtained using Eqn (2):
${\rm AR}_x^{{\rm broad}} $), the Incident Radiative Forcing (IRF) absorbed by the glacier surface and LAIs can be obtained using Eqn (2):
where R in−short indicates the incident incoming shortwave solar radiation measured by Kipp and Zonen Net Radiation LITE radiometers (300–2800 nm), which were set up at a height of 1.5 m in the ablation zone of LHG (39.478°N, 96.535°E; 4550 m). Radiation data for the study period are presented in Fig. S1.
2.6 Control experiment
To assess the effect of cryoconite on surface ablation, a control experiment was implemented in the field. The cryoconite material on the glacier surface ice (covering an area of at least 30 × 30 cm) was removed from A1–A8 (11 sites, two sites at A1, A6 and A8) in the LHG ablation zone on 13 August 2015 (Fig. 1b). First, the majority of cryoconite material was removed with a sterile stainless-steel shovel, and then we washed the surface ice by water to clean the residual cryoconite. The spectral albedos and changes in surface conditions were measured, and comparisons were conducted between the experimental plots (cryoconite-free glacier ice) and the control plots with intact cryoconite layers from 13 to 25 August 2015.
3. RESULTS AND DISCUSSION
3.1 Particle size distribution
The grain size distributions of the cryoconite particles clearly illustrated that cryoconite was primarily composed of silt grains (~2–63 µm), which accounted for 81.9–89.7% of the total cryoconite (Fig. 2). The mean clay grain (<2 µm) content ranged from 4.6 to 8.0%. The mean sand (>63 µm) content ranged from 3.2 to 12.4%, with an average of 8.1%. In addition, the grain size distribution showed a unimodal pattern with a modal size of 9.8–14.5 µm, which is similar to that described in previous deposition studies on LHG cryoconite (Dong and others, Reference Dong2016), melting water (Dong and others, Reference Dong2014a) and snow pits (Dong and others, Reference Dong2014b), larger than that in aerosol samples (Xu and others, Reference Xu2013) but smaller than that in surface soils from potential sources (Zhang and others, Reference Zhang, Dong, Li, Qian and Jiang2016).
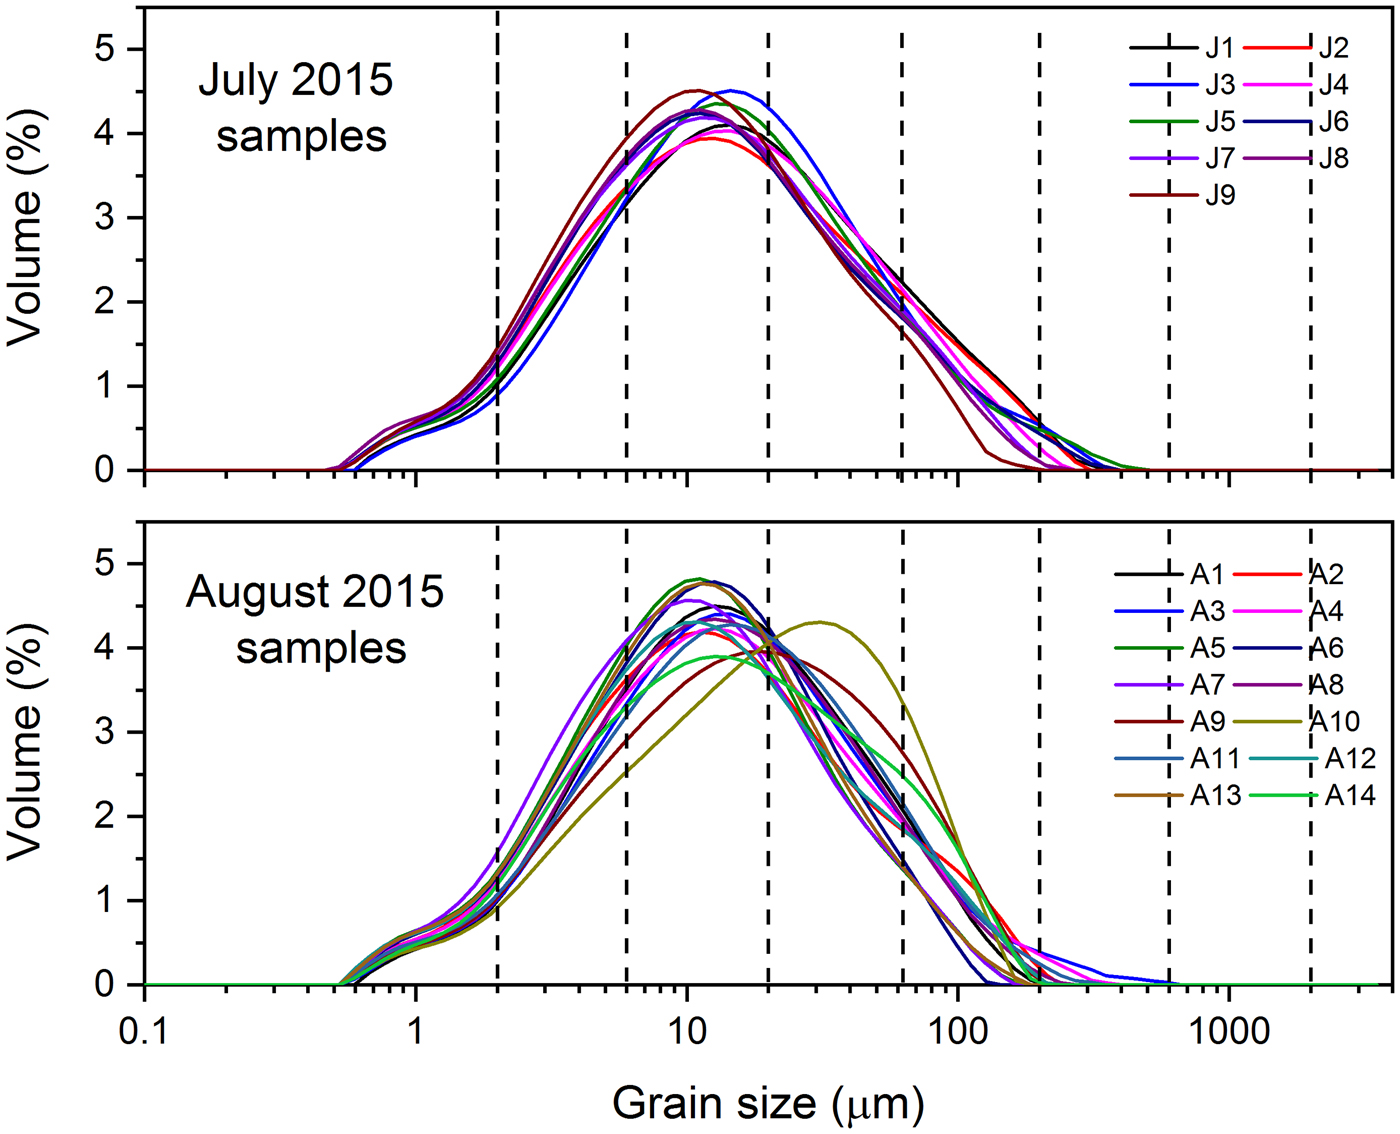
Fig. 2. Grain size distributions of cryoconite particles measured during the two expeditions shown in Figure 1. The size categories are as follows: clay (diameter <2 µm), fine silt (2–6 mm), medium silt (6–20 µm), coarse silt (20–63 µm), fine sand (63–200 µm), medium sand (200–600 µm) and coarse sand (600–2000 µm).
3.2 Concentrations and light absorption of Fe and carbonaceous matter in cryoconite
In this study, the total Fe concentrations ranged from 15.46 to 51.92 mg g−1, with a mean value of 39.94 mg g−1 (Fig. 3a), which is similar to the observed total Fe concentrations in cryoconite from LHG (Cong and others, Reference Cong2018), aerosols from Dunhuang (180 km away from LHG) (Zhang and others, Reference Zhang2003) and samples of the upper continental crust. Similar levels of total Fe in cryoconite have also been reported in previous studies on Qiyi Glacier in the central Qilian Mountains (Wu and others, Reference Wu, Xu, Zhang, Zhang and Yan2016), Urumqi No. 1 Glacier in the Tienshan Mountains, Baishui No. 1 Glacier in the Yulong Mountains (Cong and others, Reference Cong2018) and Morteratsch Glacier in the Swiss Alps (Baccolo and others, Reference Baccolo2017). The aforementioned total Fe concentrations were much higher than those recorded at glaciers in the Himalaya and Arctic (Singh and others, Reference Singh2013, Reference Singh2017) (Table 1).
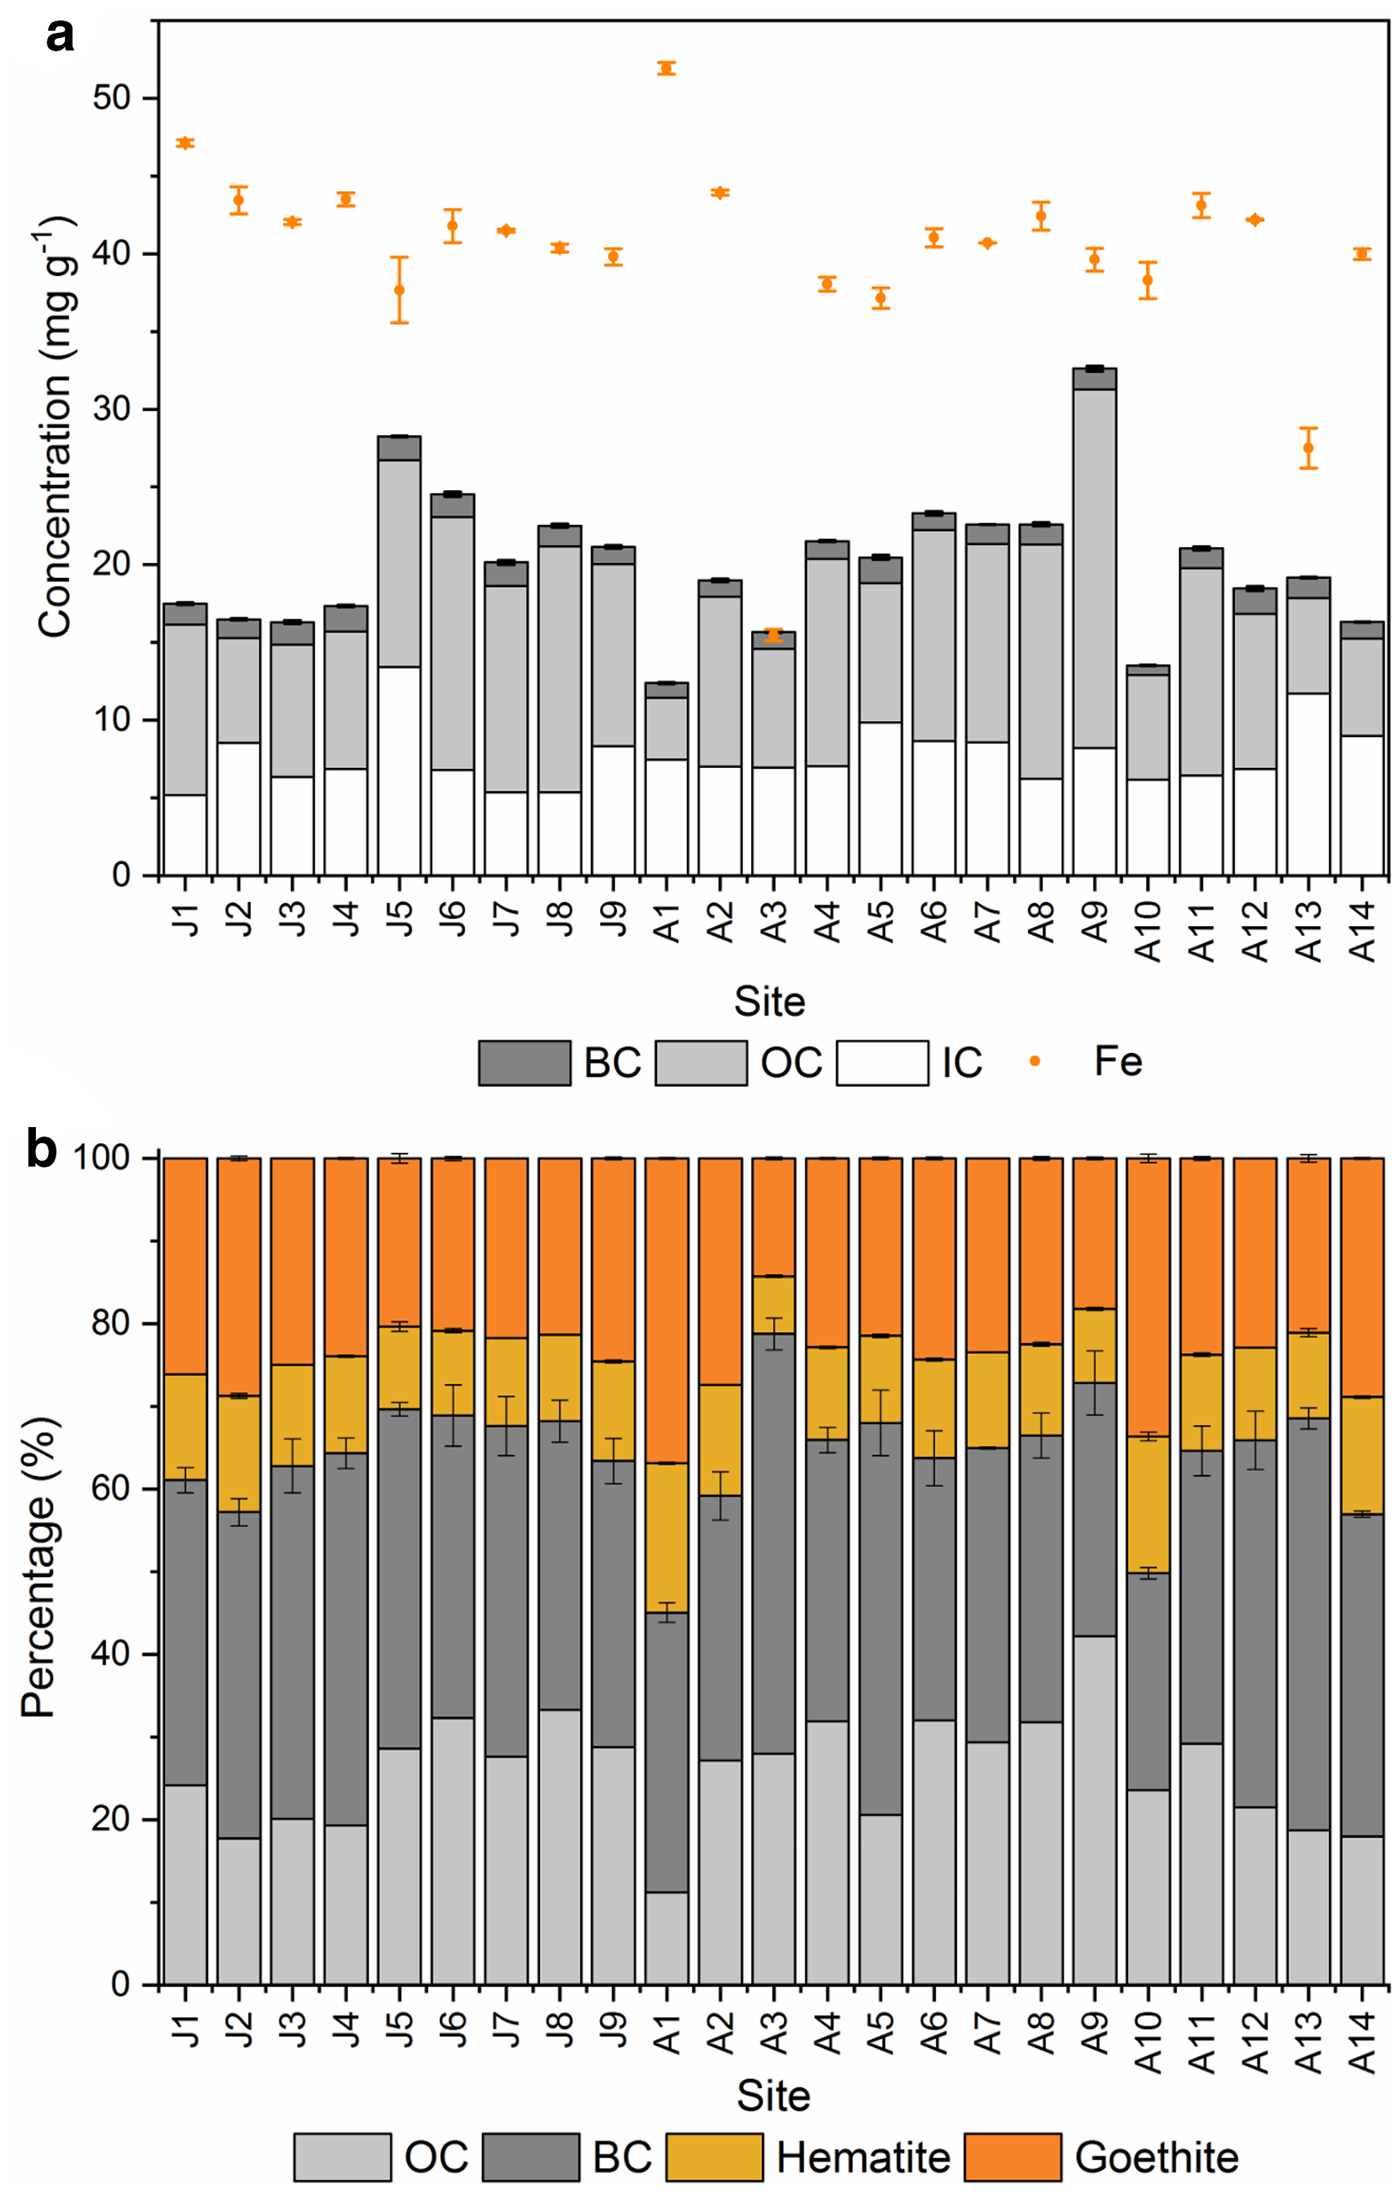
Fig. 3. (a) Concentrations of total Fe and carbonaceous matter in cryoconite collected on the surface of LHG during the summer of 2015. (b) Proportions of total light absorption contributed by OC, BC, hematite and goethite. Error bars indicate the std dev..
Table 1. Comparisons of the total Fe and BC concentrations in cryoconite samples from the Third Pole, European Alps and Arctic glaciers

a Average values of BCTOR and BCTOT
BC is primarily obtained from the incomplete combustion of biomass and fossil fuels, and it is considered to be the second largest warming agent after CO2 (Bond and Bergstrom, Reference Bond and Bergstrom2006; Ramanathan and Carmichael, Reference Ramanathan and Carmichael2008). East Asia and South Asia are the largest emitters of BC (Lu and others, Reference Lu, Streets, Zhang and Wang2012), which can be transported to the Tibetan Plateau (Luthi and others, Reference Luthi2015). Therefore, BC in the Tibetan Plateau has become an important research topic in recent years. In general, the concentrations of BCTOR in the LHG cryoconite (0.59–1.74 mg g−1) were ~5% more than the concentrations of BCTOT (0.61–1.69 mg g−1) shown in Fig. S2, which is consistent with the results of a previous study (Chen and others, Reference Chen2015), and this phenomenon is related to the recovery of the initial transmittance signal value after a delay. In this study, the BC concentration was based on the average concentrations of BCTOR and BCTOT at each sampling site, and it averaged 1.28 ± 0.25 mg g−1 (Fig. 3a). Our data are consistent with previously reported BC concentrations in cryoconite across the Third Pole but lower than those reported for Baishui No. 1 Glacier in the Yulong Mountains (Cong and others, Reference Cong2018) and Morteratsch Glacier in the Swiss Alps (Baccolo and others, Reference Baccolo2017) (Table 1). The higher values in the latter regions are indicative of greater anthropogenic influence. Baishui No. 1 Glacier is typically affected by anthropogenic BC transported from South Asia and East Asia (the largest BC emitters) via the Indian summer monsoon and East Asian summer monsoon (Niu and others, Reference Niu2018), and Morteratsch Glacier is located within tens of kilometres from the most industrialized and inhabited region of Europe, the Po Valley. BC sources to LHG, however, are separated by several hundred kilometres (e.g., Hexi Corridor) or thousand kilometres (e.g., eastern China).
Furthermore, BC can be divided into char (BC measured at low temperature (580°C) minus the pyrolysed carbon, BCLT) and soot (the sum of BC measured at high temperatures (740 and 840°C), BCHT) based on the IMPROVE-A protocol. The ratio of BCLT to BCHT can be used to identify the source (Han and others, Reference Han2007; Cong and others, Reference Cong2013). In the LHG cryoconite, the values of BCLT−TOR/BCHT–TOR and BCLT–TOT/BCHT–TOT varied from 0.58 to 1.75 and from 0.5 to 1.82, respectively (Fig. 4), indicating that fossil fuel contributed the majority of BC in the LHG cryoconite. This finding is compatible with the recent source-diagnostic Δ14C/δ13C compositions of BC isolated from LHG snow pit, which revealed that fossil fuels contribute 66 ± 16% (Li and others, Reference Li2016).

Fig. 4. Ratios of BCLT to BCHT in cryoconite collected on the surface of LHG during the summer of 2015. (TOR and TOT represent the thermal-optical reflectance and transmittance method, respectively.)
In this study, TC was divided into IC, OC and BC. TC concentrations in the LHG cryoconite ranged between 12.36 and 32.49 mg g−1 and averaged 20.09 mg g−1. Although the average concentrations of IC, OC and total Fe (7.67, 11.18 and 39.94 mg g−1, respectively) were much higher than those of BC (Fig. 3a), the light absorbability of IC is typically trivial and thus ignored, whereas BC is a much more effective absorber than OC and Fe. Accordingly, the mass absorption cross-section (MAC) values for uncoated BC and OC particles are 7.5 and 0.6 m2 g−1 (550 nm), respectively (Kirchstetter and others, Reference Kirchstetter, Novakov and Hobbs2004; Bond and Bergstrom, Reference Bond and Bergstrom2006). In this study, we referenced the average ratios of goethite/total Fe and hematite/total Fe (0.486 and 0.065, respectively) in the LHG cryoconite (Cong and others, Reference Cong2018) to calculate the concentrations of goethite and hematite to effectively control for the absorption of dust. In addition, the MAC values for the goethite (Stream Chemicals, Inc., Newburyport, MA, USA) and hematite standards (Sigma Aldrich Inc., St. Louis, MO, USA) at 550 nm were set, respectively, at 0.31 and 1.13 m2 g−1 (Cong and others, Reference Cong2018). Here, we assumed that the light absorption of LAIs = concentrationsLAIs × MACLAIs and components other than BC, OC and free Fe in the LHG cryoconite could be considered negligible with respect to solar light adsorption. Putting together these pieces of information about LAIs concentration and properties, we conclude that the BC in the LHG cryoconite was responsible for a higher fraction of light absorption (38.1%) than the Fe (goethite + hematite, 35.9%) and OC (26.0%) at 550 nm (Fig. 3b). Recently, Cong and others (Reference Cong2018) found that BC in LHG cryoconite also contributed more to light absorption than free Fe at 600 nm, whereas goethite played a stronger role at short wavelengths due to its higher MAC value (1.55 ± 0.08 m2 g−1 at 450 nm, 0.15 ± 0.01 m2 g−1 at 600 nm). Furthermore, in their study, OM dominated light absorption at both 450 and 600 nm because OM is composed of LAIs other than OC, such as soil humus, humic-like substances and microbial particles. However, only OC was considered in our study.
3.3 Spectral and broadband albedos
In addition to the angular and spectral distribution of incoming solar radiation, snow albedo is influenced by the physical properties of the snow (e.g., complex refractive index, optically equivalent grain size, density, depth, liquid water content and LAIs within the snowpack) (Warren and Wiscombe, Reference Warren and Wiscombe1980; Wiscombe and Warren, Reference Wiscombe and Warren1980). The spectral and broadband albedos for various types of LHG surfaces measured in the field are shown in Figure 5 and Table 2, respectively. The rough shape of the snow spectral albedo is controlled by the complex refractive index of ice, which is very close to that of liquid water for λ < 5 µm (Warren and Wiscombe, Reference Warren and Wiscombe1980). Therefore, the valleys at wavelengths of ~770–830, 870–920, 1000–1060, 1200–1300, 1400–1600, 1900–2100 and 2400–2500 nm were attributed to the peak values of light absorption of ice/water at the corresponding wavelengths (Warren and Brandt, Reference Warren and Brandt2008).
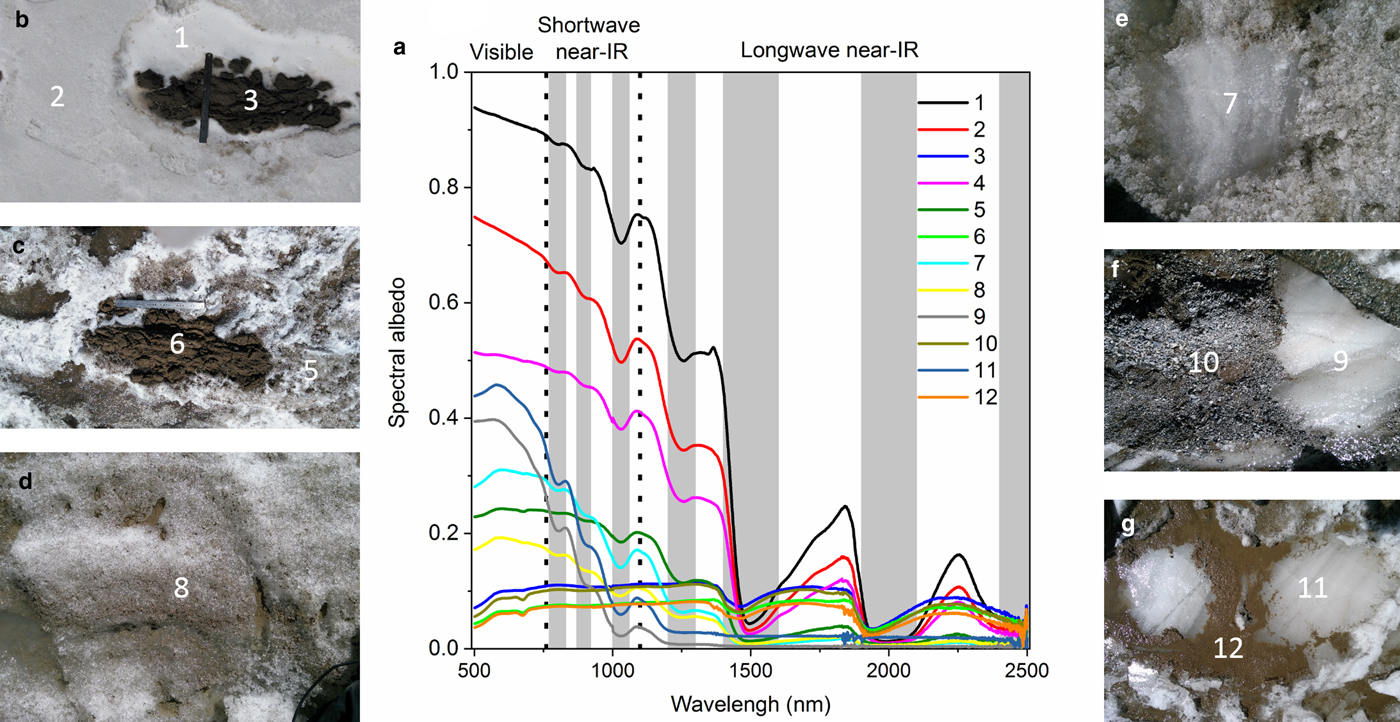
Fig. 5. (a) Spectral albedos of cryoconite/snow/ice in the ablation zone (greyed shading for known water absorption wavelengths). Broadband albedos for the cryoconite/snow/ice types listed in Table 2. (b) Snow surrounding the cryoconite ice mound (A14 in Table 2); (c) ice surrounding the cryoconite ice mound (A12 in Table 2); (d) and (e) surface ice and cryoconite materials, respectively (A1-2 in Table 2); (f) surface ice before and after the removal of uniform debris (A9 in Table 2); and (g) cryoconite basin (A7 in Table 2).
Table 2. Broadband solar albedos for characteristic snow/ice/cryoconite types in LHG (August 2015). (1) Cryoconite basin, (2) cryoconite mound, (3) surface ice with cryoconite, (4) surface ice after the removal of cryoconite, (5) surface ice with uniform debris, (6) surface ice after the removal of debris, (7) coarse-grained ice around the cryoconite mound, (8) coarse-grained snow around the cryoconite ice mound, (9) cloud amount, (10) solar zenith angle and (11) elevation (m)
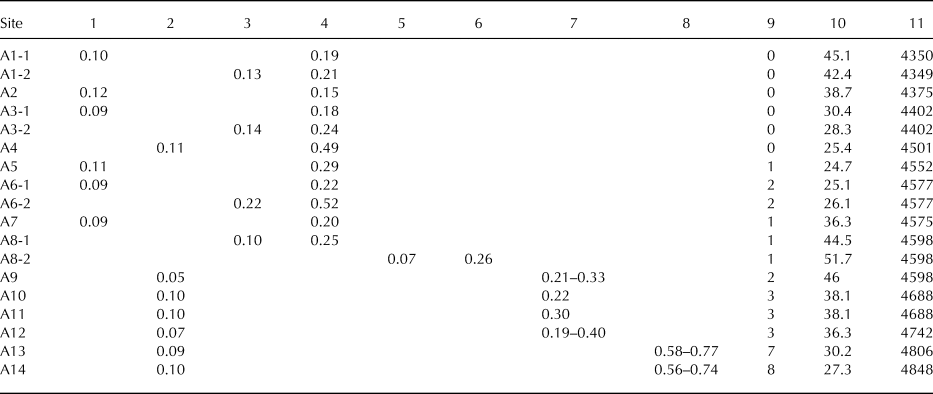
The cryoconite basin and mound as well as the moraine sediments had the lowest spectral albedos in Figure 5a, and the mean values were <0.1 across the visible and near-IR region. In general, the spectral albedos increased at wavelengths shorter than 560 nm and decreased at wavelengths longer than 2300 nm. In particular, the cryoconite mound, that is substantially dry, and moraine and moraine sediments (3 and 10 in Fig. 5, respectively) showed higher reflectance than the wet cryoconite accumulated in ice holes or dispersed on the glacier surface (6 and 12 in Fig. 5). The reason for this is linked to the effect played by wetness and liquid water on light absorption; it is commonly known that the presence of superficial liquid films decreases the albedo of some materials (Ångström, Reference Ångström1925; Lekner and Dorf, Reference Lekner and Dorf1988), including cryoconite (Di Mauro and others, Reference Di Mauro2017). Once the cryoconite material and moraine sediments were removed, the spectral albedos of the cryoconite/moraine-free ice (9 and 11 in Fig. 5) increased in the visible light and shortwave NIR range but decreased in the longwave NIR wavelengths and even approached zero at wavelengths longer than 1500 nm, indicating that the glacier ice contained less LAIs and that much of the NIR radiation was absorbed by the melting ice surface and/or transmitted into deeper layers. These effects complemented each other, resulting in higher broadband albedos for clean ice layers.
The shape of the spectral albedos for surface snow (1, 2 and 4 in Fig. 5) and ice (3 and 5 in Fig. 5) near the cryoconite mound was generally similar to those for snow and sea ice measured in the Arctic (Bøggild and others, Reference Bøggild, Brandt, Brown and Warren2010; Aoki and others, Reference Aoki2013; Pope and Rees, Reference Pope and Rees2014). The reflectance of snow showed a higher average range across almost all the investigated spectra than those of other types of surfaces. The dirty ice albedos showed low reflectance values of ~0.3 in the visible wavelengths and <0.2 in the NIR wavelengths due to the presence of LAIs, which dramatically altered the optical properties of these surfaces. In this work, we did not measure the concentrations of LAIs in surface snow/ice, although the concentrations of BC and mineral dust in LHG snow pits have been reported to be only 35 ng g−1 (Ming and others, Reference Ming2009) and 3.5 µg g−1 (Dong and others, Reference Dong2014b), respectively, whereas BC concentrations of up to 2000 ng g−1 have been observed in surface snow/ice (Zhang and others, Reference Zhang2017c). The lower LAI concentrations could explain the higher broadband albedos of the coarse-grained snow (0.56–0.77) and ice (0.19–0.4) surrounding the cryoconite. After spreading to nearly clean snow/ice surfaces via wind, streams or gravity, cryoconite granules containing abundant LAIs reduce the surface albedo, efficiently absorb solar radiation, accelerate glacial melting and produce holes in the ice.
3.4 Surface melting caused by cryoconite
The changes between the control and experimental plots during the study period were recorded at eight different elevations in the ablation zone (Fig. 6 and Table 3). After a few hours of melting, the ice surfaces at the experimental plots became whiter and ~1–2 cm higher than their surroundings (i.e., the control plots in Fig. 6a) on 13 August 2015. The low-density and more opaque layer formed in the uppermost glacier ice was referred to as weathering crust (Müller and Keeler, Reference Müller and Keeler1969). Although the weathering crust contained LAIs and would be reduced by net radiation and sensible heat, it could result in a greater reflection of incident radiation than absorption by the melting ice surface and/or greater transmittance to deeper layers. Therefore, the melting rate of the subsurface ice layer was confined (Irvine-Fynn and Edwards, Reference Irvine-Fynn and Edwards2014). However, the dirty cryoconite layers in the control plots were merely a few millimetres thick; therefore, the heat fluxes could be transported to the subsurface ice layer, thereby increasing the temperature of the subsurface ice layer to 0°C and accelerating melting.
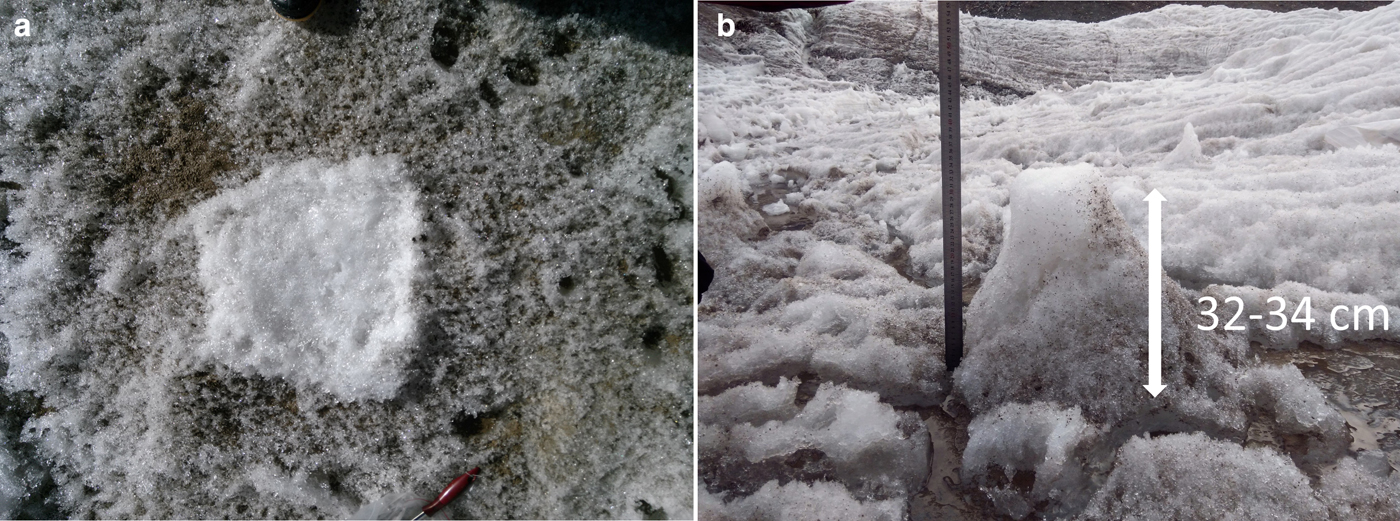
Fig. 6. Observed surface melting enhanced by cryoconite from LHG, Qilian. (a) Weathering crust formed after ~6 h of melting, and (b) ice pillars that survived after 12 d of melting.
Table 3. Heights of ice pillars that survived in the experimental plots and accelerated melting rate caused by cryoconite relative to cryoconite-free ice surfaces from 13 to 25 August 2015

After the 12 d in situ experiment, the ice pillars that survived in the experimental plots were 28–40 cm higher than the control plots' surfaces. The ice pillars were covered by a layer of porous ice with loosely interlocking crystals underlain by material with a higher density. Therefore, the cryoconite material increased glacial melting by a factor of 2.27–3.28 cm d−1 relative to cryoconite-free ice surfaces under the same meteorological conditions (Fig. S1). For comparison, cryoconite accelerated surface ablation at a rate ~ three and 1.6–2.6 times greater than that observed for cryoconite-free bare ice in Yala Glacier (Nepal Himalaya) (Kohshima and others, Reference Kohshima, Seko and Yoshimura1993) and in Glacier No. 31 (Russian Siberia) (Takeuchi and others, Reference Takeuchi2015), respectively. Additionally, there was a poor correlation (R 2 < 0.1) between the enhanced melting rate and the broadband albedos of the control plots (Fig. S3a). Furthermore, there was no obvious altitude effect on the melting rate (R 2 < 0.22) (Fig. S3b), indicating that the results could be also influenced by these unmeasured factors, such as the liquid water content and thickness of the cryoconite, which could impact the transmitting efficiency of conductive heat, slope and aspect, which could in turn influence the abundance of solar radiation reaching the glacial surface.
3.5 Estimated albedo reduction and surface ablation by LAIs in cryoconite
Because the spectral albedos of the weathering crust were not measured in the field, we simulated them using the SNICAR-online model (Flanner and others, Reference Flanner, Zender, Randerson and Rasch2007), which is constrained by the average concentrations of BC and dust (48.7 ng g−1 and 72.8 µg g−1, respectively) in the glacier ice layers (excluding the dirty layers) of an ice pit excavated in the ablation area (4550 m) of LHG (1 August 2016). We used a snow optical grain radius of 1500 µm and a snow density of 600 kg m−3. Atmospheric conditions were input as a clear or cloudy sky based on the observed incoming shortwave radiation. Snow thickness was assumed to be 1 m. Albedos of the underlying ground followed the recommended values for the SNICAR model (visible: 0.2, near-IR: 0.4). The simulated spectral albedos of the weathering crust are shown in Fig. S4. In addition, we assumed that the differences of albedo, IRF and surface ablation between the control plots and the experimental plots were only contributed by BC, OC and free Fe based on their total light absorption proportions at 550 nm (Fig. 3b), regardless of ice algae, humic matter and liquid water.
The modelled broadband albedos of the weathering crust in LHG (0.506–0.565) were consistent with the minimum albedos of coarse-grained snow around the cryoconite observed at A13 and A14 (0.56) but were 0.292–0.491 higher than those observed for the LHG cryoconite (0.051–0.216) (Fig. 7a) due to the presence of LAIs, thus the cryoconite simultaneously absorbed at least 312.0–486.6 W m−2 more than the weathering crust (Fig. 7b). Consequently, the albedo reductions of BC, OC and free Fe (hematite and goethite) were respectively of 0.159 ± 0.037, 0.108 ± 0.037 and 0.154 ± 0.046 (Fig. 7a). The associated uncertainties could be due to discrepancies in LAI concentrations and their contributions to total light absorption, solar zenith angle and atmospheric conditions. Furthermore, the averaged IRF of BC was comparable to that of hematite + goethite (~150 W m−2) but much higher than that of OC (102.8 W m−2); the BC IRF in the LHG cryoconite was comparable to or higher than most previously reported BC IRF in the surface snow and ice of Third Pole glaciers (Yang and others, Reference Yang, Xu, Cao, Zender and Wang2015; Ming and others, Reference Ming, Xiao, Wang, Li and Li2016; Niu and others, Reference Niu2017a, Reference Niu2017b; Zhang and others, Reference Zhang2017a, Reference Zhang2017b, Reference Zhang2017c). During the 12 d in situ experiment, the various LAIs in cryoconite effectively enhanced the melting rate by 2.27–3.28 cm d−1 compared to a cryoconite-free ice surface under the same meteorological conditions. Free Fe played the most important role in accelerating surface ablation (1.01 ± 0.25 cm d−1), followed by BC and OC (0.99 ± 0.15 and 0.76 ± 0.30 cm d−1, respectively) (Fig. 7c). Considering that the ablation period often lasts for more than 2 months in this area, this melting rate should considerably affect the ablation process of LHG. Therefore, the results highlight that the albedo of cryoconite-loaded ice is critical for the mass balance of Tibetan glaciers.
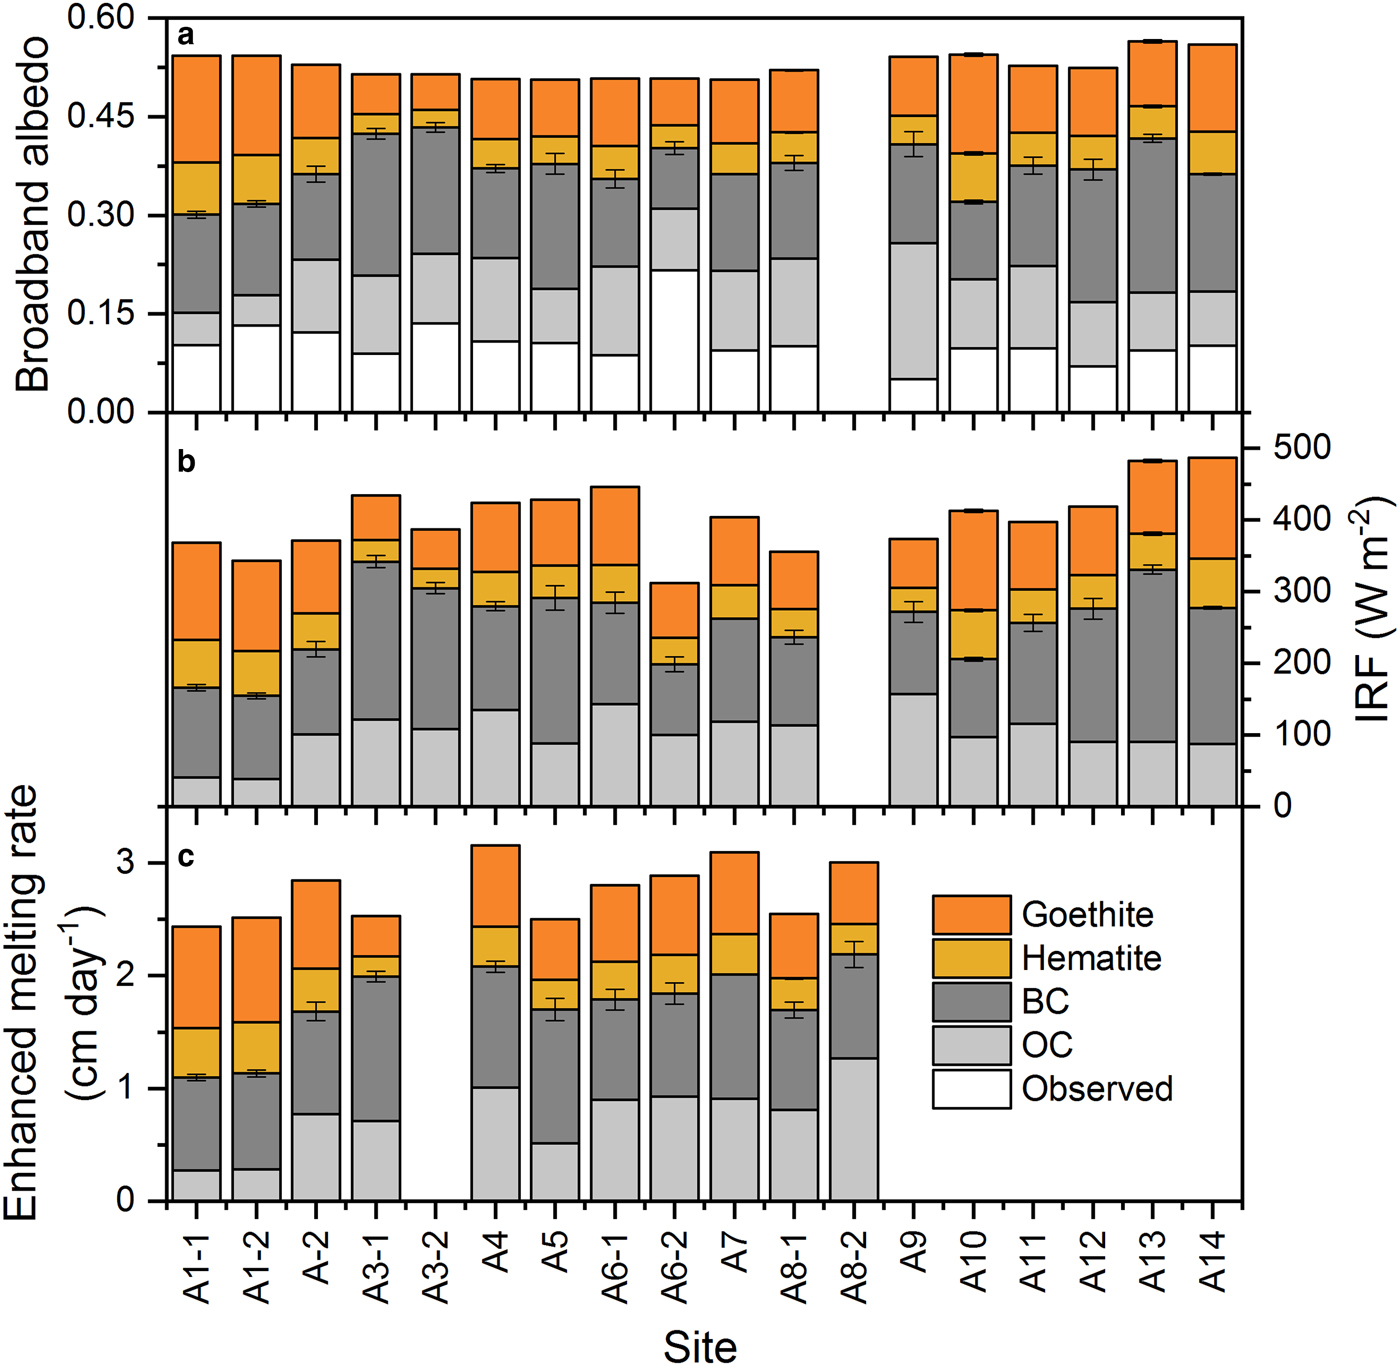
Fig. 7. (a) Simulated broadband albedo of the weathering crust and observed broadband albedo of the LHG cryoconite. The discrepancies are due to the albedo reduction caused by LAIs. Simulated (b) IRF and (c) enhanced melting rate contributed by OC, BC and free Fe (hematite and goethite) in the LHG cryoconite.
4. CONCLUSIONS
This study presents the particle size distributions, LAI concentrations and spectral albedos of cryoconite and the cryoconite-enhanced melting rates on LHG on the north-eastern Tibetan Plateau. The particle size distribution of LHG cryoconite presented a unimodal pattern. Silt grains (~2–63 µm) accounted for 81.9–89.7% of the total cryoconite particles. The average concentrations of IC, OC and Fe (7.67, 11.18 and 39.94 mg g−1, respectively) were much higher than that of BC (1.28 mg g−1), whereas BC was responsible for a higher fraction of light absorption (38.1%) than Fe (goethite and hematite) and OC (35.9% and 26.0%, respectively). Therefore, cryoconite granules containing abundant LAIs can reduce the surface albedo and efficiently absorb solar radiation. Based on spectral albedo observations, cryoconite exhibited the darkest surface and the lowest mean reflectance (i.e., <0.1) across the visible and near-IR wavelength range of any material. Compared with the cryoconite-free ice surface under the same meteorological conditions, cryoconite effectively enhanced the melting rate by 2.27–3.28 cm d−1 during the 12 d in situ experiment. However, free Fe played the most important role in accelerating surface ablation (1.01 ± 0.25 cm d−1), followed by BC and OC (0.99 ± 0.15 and 0.76 ± 0.30 cm d−1, respectively). The results presented here further enhance our understanding of the complex role of cryoconite in the glacier mass balance in the northern areas of the Tibetan Plateau.
Supplementary material
The supplementary material for this article can be found at https://doi.org/10.1017/jog.2019.41
Acknowledgements
This work was supported by the Chinese Academy of Sciences (XDA20040501, QYZDJ-SSW-DQC039), the National Natural Science Foundation of China (41630754 and 41721091) and the State Key Laboratory of Cryospheric Science (SKLCS-ZZ-2018). The authors gratefully acknowledge the field team for their assistance and the anonymous reviewers and the editor for their helpful comments and suggestions. We are also very grateful to American Journal Experts for editing the English language of this manuscript. Observation data of the spectral albedos and LAI concentrations can be freely shared, contact the corresponding authors for access to the data.


