


1. Introduction
Flow around multiple bluff bodies has been widely studied, both because of its obvious importance in various engineering applications and because it provides an opportunity to study the interaction between several fundamental fluid dynamics phenomena. Of the many and varied geometries and configurations within this field, the case of two cylinders in tandem is perhaps one of the most canonical. Even after decades of research, this flow remains an object of interest for engineers and physicists alike.
In the present study we consider the flow around tandem cylinders with axial curvature. This type of configuration may be applicable in the offshore industry, for marine catenary risers or pipelines. Curved tandem cylinders can also be considered a simplified model of a double-tubed submerged floating tunnel (Eidem et al. Reference Eidem, Minoretti, Xiang and Aasland2018).
Flow around straight tandem cylinders of equal diameter is characterised by three main flow regimes: overshoot (also called the extended-body regime), reattachment and co-shedding. When the cylinders are closely spaced, the shear layers from the upstream cylinder overshoot the downstream cylinder and roll up in its wake, so that vortex shedding essentially occurs from the upstream cylinder alone. When the spacing between the cylinders increases, the upstream cylinder shear layers reattach onto the downstream cylinder. Vortex shedding now occurs solely from the downstream cylinder. Reattachment may be alternating, quasi-steady/symmetric or intermittent (Zdravkovich Reference Zdravkovich1987). Initially, the reattachment points are located on the back face of the downstream cylinder, but the points move upstream, onto the front face, with increased spacing and/or higher Reynolds number (Alam et al. Reference Alam, Moriya, Takai and Sakamoto2003; Xu & Zhou Reference Xu and Zhou2004; Zhou & Yiu Reference Zhou and Yiu2006). Finally, when the spacing between the cylinders is sufficiently large, the upstream cylinder shear layers roll up in the gap and vortex shedding occurs from both cylinders.
Tandem cylinder flow regimes are normally discussed in terms of the gap ratio  $L/D$, where
  $L$ is the centre-to-centre spacing between the cylinders and
  $D$ is the cylinder diameter. The gap ratio at which co-shedding first occurs is traditionally referred to as the critical spacing,
  $L_{c}/D$. Because the flow depends strongly on the Reynolds number (
 ${{Re}} = U_{0}D/\nu$, where
  $U_{0}$ is the inflow velocity and
  $\nu$ is the kinematic viscosity) (Xu & Zhou Reference Xu and Zhou2004), and other factors such as free-stream turbulence (Ljungkrona, Norberg & Sunden Reference Ljungkrona, Norberg and Sunden1991) or inflow gust amplitude (Wang et al. Reference Wang, Zhou, Alam, Yang and Li2022), there is quite a spread in the reported values of
  $L_{c}/D$. Typically, the critical spacing varies between
  $3.0 D$ and
  $5.0 D$ (Okajima Reference Okajima1979; Igarashi Reference Igarashi1981; Xu & Zhou Reference Xu and Zhou2004; Alam Reference Alam2014). Owing to the Reynolds number dependency, defining the extent of the regimes exclusively in terms of the gap ratio is challenging. Nonetheless, the following classification by Zdravkovich (Reference Zdravkovich1987) remains in wide use: overshoot
  $1.0 \leq L/D \leq 1.2\unicode{x2013}1.8$, reattachment
  $1.2\unicode{x2013}1.8 \leq L/D \leq 3.4\unicode{x2013}3.8$ and co-shedding
  $3.4\unicode{x2013}3.8 \leq L/D$. Specific gap ratio and Reynolds number ranges exist where vortices are fully formed on the upstream cylinder, but are unable to be shed due to the interference of the downstream body. This particular case does not fit neatly into either the reattachment or co-shedding categories. Behara, Chandra & Prashanth (Reference Behara, Chandra and Prashanth2022) reported a similar situation, but in the completely different case of two tandem rotating cylinders.
Transition between the different flow regimes of straight tandem cylinders is unstable and hysteretic (Carmo, Meneghini & Sherwin Reference Carmo, Meneghini and Sherwin2010). Near a transition point, the flow jumps intermittently between regimes, and these may persist for short or long time intervals, depending on the Reynolds number and gap ratio (Igarashi Reference Igarashi1981). The coexistence of two flow regimes near a transition point manifests itself as two distinct velocity spectral peaks of similar magnitude. Igarashi (Reference Igarashi1981) coined the term ‘bistability’ for an intermittent switch between reattachment and co-shedding, but a second type of bistability was reported by Xu & Zhou (Reference Xu and Zhou2004), namely a switch between overshoot and reattachment. The latter has not been reported by others, to the knowledge of the authors, but the reattachment/co-shedding bistability is reported in a number of studies (Igarashi Reference Igarashi1981; Xu & Zhou Reference Xu and Zhou2004; Kitagawa & Ohta Reference Kitagawa and Ohta2008; Alam Reference Alam2014; Afgan et al. Reference Afgan, Kahil, Benhamadouche, Ali, Alkaabi, Berrouk and Sagaut2023). A third type of bistability is found within the co-shedding regime at subcritical Reynolds numbers: intermittent lock-in of the downstream cylinder vortex shedding frequency to the upstream cylinder shedding frequency (Alam et al. Reference Alam, Elhimer, Wang, Jacono and Wong2018). This phenomenon may occur approximately in the range  $8 \leq L/D \leq 12.5$.
It is worth noting that summaries of the literature on tandem cylinder flow will often, for the sake of brevity, skip the complexity of the different flows grouped under the bistable regime. Igarashi (Reference Igarashi1981), for instance, reported that in the beginning of the bistable regime, the gap vortices become unstable, and shedding occurs intermittently. This regime is labelled ‘regime D’ in that study, and the illustration portrays a gap flow where one shear layer reattaches, while the opposite shear layer overshoots the downstream cylinder and at the same time allows a gap vortex to escape and be convected into the near wake. True intermittent roll-up of the gap shear layers occurs within the next regime, labelled ‘regime E’. Similarly, the bistable flow described by Kitagawa & Ohta (Reference Kitagawa and Ohta2008) consists of a switch between symmetric reattachment, with a highly turbulent non-shedding wake, and a state where small vortices are shed from the gap shear layers, combined with a vortex street in the wake. In the illustrations of the latter, one gap shear layer clearly forms a vortex, while the opposite shear layer overshoots. A similar flow regime was reported by Aasland et al. (Reference Aasland, Pettersen, Andersson and Jiang2023a), who found that vortex shedding may occur repeatedly from just one gap shear layer, while the opposite shear layer reattaches or overshoots the downstream cylinder. Moreover, this flow regime may be spanwise localised, so that bistability manifests in short spanwise cells.
The inherent intricacies of tandem cylinder flow contribute to a substantial increase of complexity when non-uniformity of the geometry is introduced, such as for non-parallel or curved tandem cylinders. There are still very few studies that investigate such flows. Flow around non-parallel tandem cylinders was studied by Younis, Alam & Zhou (Reference Younis, Alam and Zhou2016) and Alam et al. (Reference Alam, Rastan, Wang and Zhou2022) at subcritical Reynolds numbers. Curved tandem cylinders in the convex configuration (meaning that the inflow is directed at the outside of the curved cylinders and parallel to the plane of curvature) at  ${{Re}} = 500$ was the topic of two papers by the present authors (Aasland et al. Reference Aasland, Pettersen, Andersson and Jiang2022a, Reference Aasland, Pettersen, Andersson and Jiang2023b). Another relevant study is that of Zhu et al. (Reference Zhu, Wang, Bao, Zhou, Ping, Han and Sherwin2019), which is concerned with a symmetrical, hanging riser segment of different curvatures (i.e. different distances between the end points) at
  ${{Re}} = 100$. For high curvatures, the cylinder end segments are close enough that the flow resembles that of tandem cylinders, with a concave cylinder in the wake of a convex one.
What these flows have in common is that different tandem cylinder flow regimes coexist and interact along the span of the same geometry. Information may travel along the span by means of axial flow (induced either by curvature or yaw angle, depending on the geometry), and this alters the dynamics of the flow regimes (Aasland et al. Reference Aasland, Pettersen, Andersson and Jiang2023b). In the study of Alam et al. (Reference Alam, Rastan, Wang and Zhou2022), the transitions between flow regimes were accelerated in terms of gap ratio, compared with a straight tandem cylinder at a similar Reynolds number. Moreover, the gap ratio range over which reattachment/co-shedding bistability could be found was significantly increased. Both Zhu et al. (Reference Zhu, Wang, Bao, Zhou, Ping, Han and Sherwin2019) and Aasland et al. (Reference Aasland, Pettersen, Andersson and Jiang2022a, Reference Aasland, Pettersen, Andersson and Jiang2023b) reported low-frequency periodicity of flow mode switches that are normally considered random processes for straight tandem cylinders.
The wake of convex curved tandem cylinders shares some important features with the wakes of their single cylinder counterparts (Aasland et al. Reference Aasland, Pettersen, Andersson and Jiang2022a, Reference Aasland, Pettersen, Andersson and Jiang2023b). The wakes of convex curved single cylinders are superficially similar to the wakes of straight single cylinders at the same Reynolds number, in that both wakes exhibit a von Kármán vortex street (Miliou et al. Reference Miliou, De Vecchi, Sherwin and Graham2007; Gallardo, Andersson & Pettersen Reference Gallardo, Andersson and Pettersen2014; Shang, Stone & Smits Reference Shang, Stone and Smits2018). The major difference between the two is the curvature-induced axial flow along the front and back face of the curved cylinder. There is a strong downdraft in the lower part of the near wake, and this downdraft impedes communication between the shear layers (Gallardo et al. Reference Gallardo, Andersson and Pettersen2014), so that the flow in this region resembles the swirling non-shedding flow regime reported by Ramberg (Reference Ramberg1983) for a yawed single cylinder with a free end. Vortex shedding is then re-established further downstream. The swirling vortices are weaker than the vortices in the upper part of the wake, which are nearly normal to the incoming flow. In the study of Miliou et al. (Reference Miliou, De Vecchi, Sherwin and Graham2007) for  ${{Re}} = 500$, the weakening of the lower wake vortices caused the vortex shedding to be dominated by the vortices in the upper wake, so that the Strouhal number (
 $\,f_{v}D/U_{0}$, where
  $f_{v}$ is the vortex shedding frequency) turned out to be the same along the entire span. Gallardo et al. (Reference Gallardo, Andersson and Pettersen2014) found nearly the same result, although in their study, the inclusion of a straight vertical extension on top of the curved cylinder lead to a slightly different
  $St$ along this extension. This caused vortex dislocations to develop in the wake.
When the straight vertical extension was included (Gallardo, Pettersen & Andersson Reference Gallardo, Pettersen and Andersson2013; Gallardo et al. Reference Gallardo, Andersson and Pettersen2014), a low-velocity upwelling was allowed to develop in the very near wake, along the upper part of the curved cylinder and the extension. The flow now exhibited a vertical velocity stagnation point along the curved cylinder. The wake vortices in the study of Miliou et al. (Reference Miliou, De Vecchi, Sherwin and Graham2007) were normal to the incoming flow for  ${{Re}} = 100$, but had a slight inclination for
  ${{Re}} = 500$. This lead to the hypothesis that the wake vortices would align increasingly with the local cylinder curvature with increasing Reynolds number, which was confirmed by the study of Gallardo et al. (Reference Gallardo, Andersson and Pettersen2014) for
  ${{Re}} = 3900$.
The flow features described above are recongnisable also for convex curved tandem cylinders at  ${{Re}} = 500$, though the spanwise regime variation leads to a significantly more intricate flow field. In this case, there is strong downdraft in the lower wake as well as in the lower gap along the back face of the upstream cylinder and the front face of the downstream cylinder. There is upwelling in the entire upper part of the gap, and along the upper part of the near wake. Vortex shedding is largely governed by the upper wake vortices, although bistability leads to the occurrence of several secondary frequencies, in particular, along the upper part of the curved cylinders. These frequency variations, along with the shedding of gap vortices into the lower wake, causes frequent vortex dislocations, and alterations between parallel and oblique wake vortex shedding. Because of the suppression of vortex shedding in the lower wake, true co-shedding was not observed for convex curved tandem cylinders at
  ${{Re}} = 500$ (Aasland et al. Reference Aasland, Pettersen, Andersson and Jiang2022a, Reference Aasland, Pettersen, Andersson and Jiang2023b).
To further investigate the complex flow field interaction in the gap and wake of convex curved tandem cylinders, it is natural to extend our previous work to a subcritical Reynolds number; in this case  ${{Re}} = 3900$. At this Reynolds number, transition to turbulence is expected to occur in the shear layers for straight and curved single cylinders (Dong et al. Reference Dong, Karniadakis, Ekmekci and Rockwell2006; Gallardo et al. Reference Gallardo, Andersson and Pettersen2014), and the wake is turbulent. It is of particular interest, therefore, to study the interaction between the shear layer instability and the multistable processes in the gap region. Moreover, the effect of the curvature-induced axial flow on this interaction and the effect of the shear layer instability on the near wake are investigated herein.
2. Flow problem formulation and computational aspects
The geometry consists of curved tandem cylinders of equal diameter, with a gap ratio of  $L/D = 3$. The cylinders are placed in the convex configuration, with the inflow parallel to the plane of curvature of the cylinders.
2.1. Governing equations and numerical method
In the present study, direct numerical simulations are carried out using the multi-grid large eddy turbulence (MGLET) flow solver. The MGLET is based on a finite volume formulation of the incompressible Navier–Stokes equations. The governing equations are
 $$\begin{gather} \frac{\partial u_{i}}{\partial x_{i}} = 0, \end{gather}$$
 $$\begin{gather}\frac{\partial u_{i}}{\partial t} + u_{j} \frac{\partial u_{i}}{\partial x_{j}} ={-}\frac{1}{\rho} \frac{\partial P}{\partial x_{i}} + \frac{\partial}{\partial x_{j}} \left(\nu \left[\frac{\partial u_{i}}{\partial x_{j}} + \frac{\partial u_{j}}{\partial x_{i}}\right]\right),\quad i,j = 1,2,3. \end{gather}$$
A staggered Cartesian grid is used in MGLET (Manhart Reference Manhart2004), and solid bodies are introduced through an immersed boundary method (Peller et al. Reference Peller, Le Duc, Tremblay and Manhart2006). The surface of solid bodies is discretised using a cut-cell approach (Unglehrt et al. Reference Unglehrt, Jenssen, Kurz, Schanderl, Kreuzinger, Schwertfirm and Manhart2022). A third-order low-storage explicit Runge–Kutta time integration scheme is used for time stepping, and the Poisson equation is solved using an iterative, strongly implicit procedure. Previously, MGLET has been used for convex (Gallardo et al. Reference Gallardo, Andersson and Pettersen2014; Aasland et al. Reference Aasland, Pettersen, Andersson and Jiang2022a, Reference Aasland, Pettersen, Andersson and Jiang2023b) and concave (Jiang, Pettersen & Andersson Reference Jiang, Pettersen and Andersson2018, Reference Jiang, Pettersen and Andersson2019) curved cylinder studies.
Free-slip boundary conditions are used on all computational domain boundaries except the inlet and outlet. Uniform inflow is imposed at the inlet, and a Neumann condition is imposed on the velocity components at the outlet. Neumann conditions are applied to the pressure, save at the outlet, where the pressure is set to a fixed value of zero. No-slip and impermeability conditions are enforced on the tandem cylinder surfaces.
2.2. Computational domain and grid
As shown in figure 1(a), each cylinder consists of a quarter segment of a ring, fitted with horizontal and vertical extensions in order to reduce influence from the computational domain boundaries. Based on previous computational studies (Gallardo et al. Reference Gallardo, Pettersen and Andersson2013, Reference Gallardo, Andersson and Pettersen2014; Aasland et al. Reference Aasland, Pettersen, Andersson and Jiang2023b), the chosen length of the horizontal and vertical extensions are  $L_{h} = 15D$ and
  $L_{v} = 12D$, respectively. The radius of curvature of the upstream cylinder is the same as that of Miliou et al. (Reference Miliou, De Vecchi, Sherwin and Graham2007) and Gallardo et al. (Reference Gallardo, Andersson and Pettersen2014), namely
  $r_{cu} = 12.5D$. In order to ensure a constant nominal gap ratio along the span, the curved cylinders are required to have different radii of curvature, as shown in figure 1(b). Thus, the radius of curvature of the downstream cylinder is
  $r_{cd} = 9.5D$.

Figure 1. (a) Computational domain, (b) definitions and (c) computational grid schematic. This schematic does not show the actual grid resolution, only the extent of the grid blocks. The most refined grid block contains approximately  $2365 \times 10^{6}$ cells and the second most refined block contains approximately
  $974 \times 10^{6}$ cells. The cells are cubic and the smallest cell size is
  $0.00375D$. The largest cell is
  $0.24D$. There are seven grid levels in total, where each level has half the grid cell size of the previous level. These levels are marked in (c).
The computational domain is sketched in figures 1(a) The size of the domain is  $L_{x} = 46.08 D$,
  $L_{y} = 30.72 D$ and
  $L_{z} = 47.08 D$. The distance between the inflow plane and the upstream cylinder front face is
  $18.08 D$.
The computational grid, shown in figure 1(c), consists of nested grid blocks, where each child block has half the cell size as its parent block. Grid elements have the same length in  $x$,
$x$,  $y$ and
  $z$ directions. A previous study of curved tandem cylinders showed that refinement in the curved gap region is crucial to capture the flow physics (Aasland et al. Reference Aasland, Pettersen, Andersson and Jiang2022a), due to the sensitivity of the gap shear layers, as well as the curvature-induced axial velocity. For this reason, the grid cell size in the curved gap region is the same as the cell size on the solid bodies and in the boundary layers.
A grid convergence study was carried out in three steps, and the results are listed in table 1. With each refinement, the cell size of the smallest grid element  $\varDelta _{min}/D$ was cut in half. In order to save computational hours, a start-up simulation with a very coarse grid was first run for 900 time units. This grid had the same smallest element size as the coarse grid in table 1, but with little refinement in the gap and wake. Afterwards, the simulations with each refined grid was started from the flow field of the previous grid. The time step was adjusted before sampling of statistics began, in order to ensure a maximum Courant number of 0.5. Sampling of statistics started after 100 time units
  $D/U_{0}$ for each of the three grids in table 1. For the coarse and medium grids, statistics were sampled for 800 time units. A sampling time of 815 time units was used for the finest grid, but due to a writing error in the force output that led to loss of data, the force coefficients in table 1 are only computed over 585 time units.
Table 1. Results of grid convergence study. Three Strouhal numbers are captured by the medium and fine grids, due to spanwise mode variation.

The coarsest grid is obviously insufficient, giving coefficient values that differ substantially from the medium and fine grids. This coarse grid resolution is unable to resolve the flow physics in the gap region, thereby failing to capture the mode alterations that take place therein. The differences between the medium and fine grids are much less pronounced, although there is 22% difference in the root mean square (rms) of upstream cylinder lift, with a corresponding 11% difference for the downstream cylinder. This is likely caused by insufficient refinement along the straight vertical extension for the medium grid. Since the von Kármán vortices are generally stronger along the straight vertical extension for convex curved cylinders, single or tandem (Gallardo et al. Reference Gallardo, Andersson and Pettersen2014; Aasland et al. Reference Aasland, Pettersen, Andersson and Jiang2023b) it makes sense that less refinement in this region should affect the overall lift. This is also reflected in the various profiles displayed in the Appendix. Given the discrepancies between the medium and fine grids, it may have been beneficial to test a fourth, even finer grid. However, the computational cost precludes further refinement, and it is the results from the fine grid that are used herein.
Three Strouhal numbers are captured, due to mode variations. A run time of 815 time units corresponds to approximately 138 von Kármán vortex shedding cycles, using the lowest Strouhal number. The non-dimensional time step of the present computation was  $dt = 6.6 \times 10^{-4}$.
The computations were carried out on the supercomputer Betzy, run by the Norwegian Research Infrastructure Services. One time step typically required between  $0.5$ and
  $0.6$ seconds, and the fine grid case alone required approximately 1 500 000 time steps. All in all, the required computational resources amount to nearly 10 million CPU hours.
2.3. Data sampling
Time histories of the velocity were sampled at a number of point probes within the gap and near wake, close to the shear layers. The probe locations are illustrated in figure 2(a). Probes were sampled every second time step, giving a frequency resolution of approximately  $df = 0.00128$.

Figure 2. (a) Positions of point probes at  $z/D = 5.0$. The other
  $z/D$ levels discussed have corresponding probes with the same streamwise distances from the cylinder centre and equal lateral positions. The streamwise coordinates of the probes P1–P4 with respect to the upstream cylinder centre are as follows:
  $[0.4D, 0.65D, 1.0D, 2.0D]$. Similarly, probes P6–P9 have the following streamwise coordinates, with respect to the downstream cylinder centre:
  $[0.4D, 0.65D, 1.0D, 2.0D]$. Probes P1 and P6 are located at
  $y/D = -0.6$, whereas the remaining shear layer probes are located at
  $y/D = -0.65$. Probe P5 is located
  $0.1D$ upstream of the downstream cylinder front face, at
  $y/D = 0$. (b) Spanwise locations and streamwise extent of
  $z/D$ planes used for visualisation, as well as the position of the probe line at
  $x/D = -4$, which is used to compute velocity spectra in the wake. The distance between probes in the line is
  $0.25D$.
Herein, all frequencies and spectra have been computed using discrete Fourier transform of the velocity data from the probes. Because the present geometry if fully three dimensional, spanwise averaging of spectra is inappropriate. In order to reduce spectral leakage, Welch's method with a Hamming window is employed. The data was partitioned into 4 or 8 segments, to compute spectra in the wake and shear layers, respectively.
Visualisation of the flow field in various planes (based on arrays of probes) are presented herein, and the spanwise locations of these planes are illustrated in figure 2(b), for reference.
2.4. Definitions
Herein, the  $x$,
$x$,  $y$ and
  $z$ directions are referred to as streamwise, crossflow and vertical, respectively. Vortices that align with the vertical direction are dubbed spanwise. When vortex shedding modes are discussed, ‘parallel’ means that the spanwise orientation of the vortices are parallel to the straight vertical extension, i.e. normal to the inflow direction, and ‘oblique’ in this context means the vortices have an angle in the
  $y$ plane.
Force coefficients are defined as  $C_{F} = 2F/\rho U_{0}^{2} A$, where
  $F$ is the force component in question,
  $\rho$ is the fluid density and
  $A$ is the projected frontal area. Subscripts
  $D$ and
  $L$ denote drag and lift, respectively, and subscript
  $z$ denotes vertical force. Note that ‘lift’ implies crossflow (i.e.
  $y$) direction in the present study. Subscripts
  $u$ and
  $d$ refer to the upstream and downstream cylinders, respectively.
3. Results
3.1. Flow field overview
An overview of the flow field is given in figure 3(a). The wake is turbulent, though there is a clear von Kármán vortex street, similar to the case of a single convex curved cylinder (Gallardo et al. Reference Gallardo, Andersson and Pettersen2014). In figure 3(b) we see that the von Kármán vortices have a slight backwards slant, though the shedding angles are sufficiently small so that the vortices can be considered nearly parallel to the  $z$ axis. Truly oblique shedding does occur, however, similar to the
  ${{Re}} = 500$ case (Aasland et al. Reference Aasland, Pettersen, Andersson and Jiang2022a, Reference Aasland, Pettersen, Andersson and Jiang2023b). This shedding mode is discussed in § 3.3.

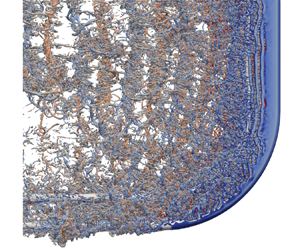
Figure 3. (a) Isosurfaces of  $Q = 0.5$ for
  $tU_{0}/D = 915$, coloured by the spanwise vorticity
  $\omega _{z} D/ U_{0}$. (b) Spanwise wake vortices marked for clarity. Solid lines have positively signed spanwise vorticity. Dashed lines have negatively signed spanwise vorticity. Vortex dislocations propagate from the midspan of the curved cylinders with an angle of
  $\gamma \approx 19^{\circ }$. (c) Close-up of the gap shear layer vortices from (a), coloured by the streamwise vorticity
  $\omega _{x} D/ U_{0}$. In the gap, these vortices are mostly parallel to the
  $z$ axis, but when convected into the near wake they align with the local axial curvature.
Transition to turbulence initiates in the gap shear layers, by the Kelvin–Helmholtz (K–H) instability. The characteristic shear layer vortices form in the gap between the cylinders, as seen in figure 3(a). These vortices subsequently become unstable and break down into a myriad of small-scale eddies that make up the bulk of the von Kármán vortices in the wake. The shear layer vortex breakdown process, shown in figure 3(c), works by vortex stretching, similar to the development of streamwise vortices in mixing layers and transitional wakes of single cylinders (Williamson Reference Williamson1995). The development of small-scale horse-shoe vortex loops during breakdown is evident in figure 3(c). We see that although the shear layer vortices are surprisingly spanwise coherent within the gap (the longest unbroken core stretching almost  $10D$ in figure 3a), the breakdown process commences within shorter spanwise cells.
In the upper part of the curved gap, as well as in the gap along the straight vertical extension, the shear layer vortices maintain an orientation parallel to the  $z$ axis. However, once these vortices have been convected past the downstream cylinder, their orientation alters to align with the spanwise vortices forming in the near wake, as shown in figure 3(c). In the lower gap, the shear layer vortices align somewhat with the local curvature of the cylinder, and are thus shed with slightly oblique angles. This result agrees quite well with the study of Prasad & Williamson (Reference Prasad and Williamson1997a), who found that the shear layer instability was mostly parallel with the cylinder axis, even when the large-scale vortex shedding itself was oblique. The shear layer instability and the associated vortices play an important role in the dynamics, and the spatial and temporal development of these flow features is discussed in detail in § 3.4.
Similar to convex curved tandem cylinders at  ${{Re}} = 500$ (Aasland et al. Reference Aasland, Pettersen, Andersson and Jiang2022a, Reference Aasland, Pettersen, Andersson and Jiang2023b), there is spanwise variation of flow regimes as the effective gap ratio widens (for decreasing
  $z/D$), from alternating overshoot/reattachment, via symmetric reattachment to vortex shedding in the gap. However, the transition between regimes is accelerated, due to the increased Reynolds number in the present study, so that these transitions occur at higher
  $z/D$ (i.e. lower effective gap ratios). The accelerated transition leads to the occurrence of co-shedding, which was not found for
  ${{Re}} = 500$. The spanwise flow regime variations are detailed in § 3.2.
The time-averaged velocity and pressure fields are presented in figure 4. Key parameters are summarized in table 2 and compared with other convex curved cylinder cases. As with convex curved tandem cylinders at  ${{Re}} = 500$, the flow is characterised by recirculation zones in the gap and wake, strong downdraft in the lower gap and wake, and a low-velocity upwelling in the upper part of the gap and wake (Aasland et al. Reference Aasland, Pettersen, Andersson and Jiang2023b).

Figure 4. (a–c) Time-averaged field in the symmetry plane. (a) Streamwise velocity. The extent of the recirculation region is marked in black. Here  $\beta _{gs}$ denotes the angle of gap shedding inception, whereas
  $\beta _{ru}$ and
  $\beta _{rd}$ refer to the angle where recirculation is suppressed in the gap and wake, respectively (defined as
  $\bar {u}/U_{0} > 0$ along the cylinder back face). (b) Vertical velocity. The black contour lines mark the boundaries between upwelling and downdraft in the gap and lower wake, where
  $\beta _{stgu}$ and
  $\beta _{stgd}$ refer to the stagnation points near the cylinder surfaces. (c) Pressure. (d) Isometric view the time-averaged pressure on the cylinder surfaces. The black contour lines mark
  $\bar {p}/\rho U_{0}^{2} = 0$.
Table 2. Comparison between main results for convex curved tandem cylinders at  ${{Re}} = 500$ (Aasland et al. Reference Aasland, Pettersen, Andersson and Jiang2022a, Reference Aasland, Pettersen, Andersson and Jiang2023b) and the present study at
  ${{Re}} = 3900$. Values from a single convex curved cylinder study at
  ${{Re}} = 3900$ (Gallardo et al. Reference Gallardo, Andersson and Pettersen2014) are included for reference. Here
  $Lrv/D$ and
  $Lrc/D$ denote the recirculation lengths in the wake along the straight vertical extension and along the curved span, respectively, measured at
  $z/D = 5$ and at
  $z/D = -1$, for the curved tandem cylinder cases, and at
  $z/D = 4$ and
  $z/D = -1$ for the single curved cylinder case. The negative value of
  $\beta _{stgd}$ for
  ${{Re}} = 3900$ implies that the stagnation point is located along the straight vertical extension.

In figure 4(a) we see that a recirculation zone bounded by the cylinders fills the entire vertical gap, and a large part of the curved gap. Within this zone, there is reattachment of the upstream cylinder shear layer onto the downstream cylinder. Reattachment causes suction in the gap, as shown in figure 4(c), which leads to a negative drag coefficient for the downstream cylinder (see table 1), similar to straight tandem cylinders. Gap shedding starts near  $z/D = -6$. Recirculation in both gap and wake is eventually suppressed by the downdraft along the curved cylinders, where the vortices attain the non-shedding, swirling characteristics discussed in § 1.
Figure 4(d) shows the surface pressure on the cylinders, seen from upstream. On the downstream cylinder, the surface pressure in the gap is predominantly negative, but a region of positive surface pressure develops for  $\beta \geq 15^{\circ }$. This is caused by increasing prevalence of symmetric reattachment or gap shedding regimes.
Non-zero vertical velocities along the entire span entails that the gap and wake vortices have a non-zero streamwise vorticity component nearly everywhere, though this component is certainly strongest along the curved cylinders. In figure 5 time-averaged streamlines coloured by the streamwise vorticity show the swirling flow in the gap and along the back face of the downstream cylinder, for the curved portion of the cylinder span. The downdraft increases near the midspan, as seen in figure 4(b), and this is also reflected in the magnitude of the vorticity.

Figure 5. Time-averaged streamlines showing the swirling flow along the curved span, coloured by the streamwise vorticity  $\omega _{x} D/U_{0}$. Panel (a) shows both cylinders, whereas (b) shows the upstream cylinder alone, for a better view of the gap flow. The scale of
  $\omega _{x}D/U_{0}$ is exaggerated for visibility.
From table 2 we see that the gap shedding inception angle, as well as recirculation suppression angles in the gap and wake, are all lower for  ${{Re}} = 3900$ than for
  ${{Re}} = 500$. The vertical velocity stagnation point in the wake is located significantly higher for
  ${{Re}} = 3900$; it now occurs along the straight vertical extension. In the gap, however, the stagnation point is moved slightly lower. This is likely due to more frequent gap shedding, where the slanted vortices induce upwelling.
The primary contribution to vertical forces comes from the curved portion of the cylinders, mainly due to the curvature-induced downdraft. If we, for instance, calculate  $\overline {C_{z}}$ on the upstream cylinder separately for all parts of the geometry, we get
  $(C_{zv}, C_{zc}, C_{zh}) = (0.0004, 0.2596, -0.0026)$ for the vertical, curved and horizontal cylinders, respectively. Sectional pressure forces have been calculated along the straight vertical extensions and the curved cylinders, based on the time-averaged surface pressure in figure 4(d). The pressure was integrated over horizontal strips with a width of
  $0.5D$, as illustrated in figure 6(b). Along the straight vertical extension, the sectional drag is nearly constant for both cylinders. When gap shedding becomes prevalent, in the lower region of the curved cylinders, drag on the downstream cylinder switches sign and becomes positive, similar to straight tandem cylinders.

Figure 6. (a) Sectional pressure force coefficients as a function of  $z/D$, computed from the time-averaged surface pressure in figure 4(d), where —
  $C_{Du}$, - - - -
  $C_{zu}$,
  ${\cdot }{\cdot }{\cdot }{\cdot } C_{Dd}$,
  $-{\cdot}-{\cdot} C_{zd}$. (b) Illustration of computational strips.
The vertical pressure force contribution is zero along the straight vertical extensions; in that region  $C_{z}$ consists solely of viscous forces. Vertical pressure forces predictably increase in relative importance along the curved part of the cylinders, though these remain small for the downstream cylinder. There is a change from negatively signed to positively signed pressure forces on the downstream cylinder in the gap shedding region. The fact that the overall
  $C_{zd}$ is negative, albeit small, indicates that viscous forces are important along the lower portion of the curved downstream cylinder.
Compared with  ${{Re}} = 500$, the recirculation lengths along both the straight vertical extension and curved cylinder are shorter in the present study. This is likely an effect of increased entrainment that follows from transition to turbulence in the shear layers. For a straight single cylinder, so-called transition waves are detectable in the shear layer approximately in the range
  $400 \leq {{Re}} \leq 1000$, though roll-up into shear layer vortices typically begins around
  $1000 \leq {{Re}} \leq 1300$ (Bloor Reference Bloor1964; Williamson Reference Williamson1996). Within the subcritical regime, the transition region moves gradually upstream in the shear layers with increasing Reynolds number. This causes a gradual reduction of the vortex formation length, owing to the entrainment balance requirements of the near wake (Gerrard Reference Gerrard1966). To the best of our knowledge, there is no systematic study on the inception and progression of the shear layer instability for straight tandem cylinders, though both likely depend on the Reynolds number and gap ratio. In a study by Ishigai, Nishikawa & Cho (Reference Ishigai, Nishikawa and Cho1972), shear layer vortices are seen at
  ${{Re}} = 2160$,
  $L/D = 1.5$, while in the study by Zhou et al. (Reference Zhou, Alam, Cao, Liao and Li2019) at
  ${{Re}} = 1000$, there is no sign of shear layer vortices for either the upstream or the downstream cylinder for gap ratios between
  $L/D = 1.25$ and
  $6$.
$6$.
Similarly, results regarding the vortex formation length or recirculation length of tandem cylinders are scarce in the literature. The study by Zhou et al. (Reference Zhou, Alam, Cao, Liao and Li2019) is one of very few works on straight tandem cylinders that explicitly report the recirculation length of the downstream cylinder. Here  $L_{r}$ seems to decrease from overshoot to reattachment, followed by an increase with the inception of co-shedding. Within the reattachment regime,
  $L_{r}$ is nearly constant for a given Reynolds number. For studies where there is transition to turbulence in the shear layer, such as that of Afgan et al. (Reference Afgan, Kahil, Benhamadouche, Ali, Alkaabi, Berrouk and Sagaut2023) for
  ${{Re}} = 3000$ (we have used streamline plots to extract an estimate of
  $L_{r}$), the trend is largely the same. Similarly, a nearly constant
  $L_{r}$ within the reattachment regime was reported by Lin, Yang & Rockwell (Reference Lin, Yang and Rockwell2002) for
  ${{Re}} = 10^{4}$. In the present study we see from figure 4(a) that the recirculation length is fairly constant along the straight vertical extension, then
  $L_{r}$ increases in the region just below the intersection between the straight and curved part. In § 3.2 we shall see that in this region both symmetric reattachment variations of gap shedding may occur. Thus, the spanwise variation of
  $L_{r}$ agrees to some extent with the gap ratio based variation of
  $L_{r}$ for straight tandem cylinders. However, in the lower wake, the gradual suppression of recirculation due to axial flow is very different from the trend of straight tandem cylinders.
Results from the literature indicate that the recirculation length within the reattachment regime decreases when the shear layer instability is triggered in the gap. In the study by Zhou et al. (Reference Zhou, Alam, Cao, Liao and Li2019),  $L_{r}/D$ lies between
  $0.72$ and
  $0.75$ for gap ratios between
  $L/D = 2$ and
  $3.5$. Similarly, the results of Wang et al. (Reference Wang, Zhou, Alam, Yang and Li2022), also at
  ${{Re}} = 1000$, show a recirculation length of approximately
  $0.75$ for a gap ratio of
  $3.5$. In studies at subcritical Reynolds numbers, such as Afgan et al. (Reference Afgan, Kahil, Benhamadouche, Ali, Alkaabi, Berrouk and Sagaut2023) and Aasland et al. (Reference Aasland, Pettersen, Andersson and Jiang2022b) (
 ${{Re}} = 10^{4}$),
  $L_{r}$ is shorter. For
  $L/D = 3$, these studies have
  $L_{r}/D = 0.46$ and
  $0.45$, respectively. This is consistent with the observations of Gerrard (Reference Gerrard1966). Our own results for
  ${{Re}} =500$ and
  ${{Re}} = 3900$ also align with the literature on straight tandem cylinders, as shown in table 2.
3.2. Spanwise development of the flow field
The spanwise development of the flow field in the gap and near wake is shown in figure 7. As seen in figure 7(a,b), alternating overshoot/reattachment persists along the straight vertical extension, even at this high Reynolds number. However, the shear layer reattchment is symmetric along the upper part of the curved cylinders (see figure 7c–e). From the flow visualizations, we see that intermittent co-shedding has commenced at  $z/D = -4$ (see supplementary movie 1 available at https://doi.org/10.1017/jfm.2024.576), though the shedding from the gap remains one sided. The same type of local regime was observed by Aasland et al. (Reference Aasland, Pettersen, Andersson and Jiang2023b), though lower into the wake, at
  $z/D = -7$. Beyond
  $z/D = -4$, the flow regime is considered to be a weak form of intermittent co-shedding where the streamwise location of roll-up in the gap meanders. Owing to the strong axial flow in the near wake, communication between the shear layers becomes increasingly inhibited, so that shedding occurs intermittently down to
  $z/D = -6$ (figure 7g) and not at all at
  $z/D = -8$ (figure 7h) and below. The wake still oscillates somewhat, due to forcing from vortices higher up in the wake, as evidenced by the wake structure (figure 7h).

Figure 7. Spanwise vorticity  $\omega _{z} D/ U_{0}$ in various
  $z/D$ planes at
  $tU_{0}/D = 915.066$ (directly after the snapshot in figure 3). The local flow regime changes from alternating overshoot/reattachment in (a,b) to symmetric reattachment in (c–e), before shedding of gap vortices begins in (f). The regimes in (f,g) can be considered bistable co-shedding regimes. Increased axial flow contributes to a considerable increase of the shear layer separation angles, with a corresponding widening of the wake, in the lower gap, in (j). The spanwise locations of the
  $z/D$ planes are illustrated in figure 1(d). Along the curved part, the effective gap spacing
  $L_{e}$ has been computed by measuring the spacing from the upstream cylinder back to the downstream cylinder front and adding
  $1D$.
$1D$.
In the lower part of the gap, the downstream cylinder is no longer in the wake of the upstream cylinder. This means that the wake of the upstream cylinder can develop more freely. The cylinders do still represent constraints within the horizontal gap, but in the vertical direction. We see from figure 7(j) that the wake is quite wide in the lower gap region. The separation angle of the shear layers is higher than within the reattachment region. This angle is quite steady, and does not change significantly in time. However, transverse motion of the shear layers due to vortex shedding, similar to what is found for straight single cylinders (Prasad & Williamson Reference Prasad and Williamson1997a), occurs intermittently. Such transverse motion is seen during time intervals when the instantaneous vortex formation region shortens, as shown in figure 8(a). During these intervals, the local flow regime resembles that of a straight elliptic cylinder with an aspect ratio of  $0.4$ (see flow visualisations by Fonesca, Mansur & Vieira (Reference Fonesca, Mansur and Vieira2013) or Durante, Giannopoulou & Colagrossi (Reference Durante, Giannopoulou and Colagrossi2021)). The shortening of the formation region is associated with a momentary weakening of the vertical velocity in the near wake of the upstream cylinder. This can be observed in figures 8(a-i) and 8(b-i). A variation of the vortex formation length also leads to a variation of the streamwise wavelength of the wake, which is clearly shown in figure 8(a,b). The variation of the vertical velocity in the gap has a significant impact on the behaviour of the gap shear layers at higher
  $z/D$, something that will be further discussed in § 3.5.

Figure 8. Snapshots of the flow field at  $z/D = -11$, showing (a) narrow and (b) wide near-wake modes. The narrow wake mode is accompanied by a shorter vortex formation region and transverse motion of the shear layers. Snapshot (b) is taken approximately one vortex shedding period after snapshot (a). The shortening of the formation length has clearly reduced the streamwise wavelength of the wake, so that
  $\lambda _{w1} > \lambda _{w2}$, and the braid regions are narrow compared with those in (a). The short formation length in (a) is associated with a slight weakening of the vertical velocities in the near wake, as seen when comparing (a-i) and (b-i).
The spanwise regime variation engenders a multistable flow field, where three independent vortex shedding frequencies are found in the wake (the same frequencies are found in the force spectra, though this is not shown here). From figure 9 we see that  $f_{v1} = 0.173 U_{0}/D$ dominates the flow along the upper part of the straight vertical extension. The secondary frequency
  $f_{v2} = 0.190 U_{0}/D$ develops as we move downwards along the straight vertical extension. At
  $z/D=0$, the third frequency
  $f_{v3}= 0.206 U_{0}/D$ has already grown to match the spectral energy of
  $f_{v2}$. At this level,
  $f_{v2}$ and
  $f_{v3}$ are almost as energetic as
  $f_{v1}$. Below
  $z/D = 0$, the higher frequencies dominate the flow, while
  $f_{v1}$ gradually diminishes. For
  $z/D \leq -2$, there is a shift of
  $f_{v3}$ towards a slightly lower frequency.

Figure 9. Spectra of the crossflow velocity  $v/U_{0}$ from a line of probes in the wake of the downstream cylinder, at
  $(x/D, y/D) = (-4,0)$. The wake contains three independent frequencies,
  $f_{v1}$,
  $f_{v2}$ and
  $f_{v3}$, which represent different flow modes. The relative importance of these frequencies shifts along the cylinder span, so that higher frequencies dominate in the lower wake.
Figure 10(a) shows the wavelet transform of the signal in probe P9 at  $z/D = 0$. We see that the broad-banded spectral peaks are generally centred on either
  $f_{v1}$,
  $f_{v2}$ or
  $f_{v3}$, though there are time intervals when neither frequency contains significant spectral energy. The three frequencies
  $f_{v1}$,
  $f_{v2}$ and
  $f_{v3}$ represent three different main flow regimes, or modes, namely alternating overshoot/reattachment, symmetric reattachment and gap shedding, sketched for in figure 10(c). Unstable and short lived, these modes interact and may trigger one another. Such interactions are further discussed in § 3.5.

Figure 10. (a) Wavelet map and (b) time trace of the crossflow velocity in the wake of the downstream cylinder at  $z/D = 0$ (probe position P9). The spectral peak in (a) shifts mainly between
  $f_{v1}$,
  $f_{v2}$ and
  $f_{v3}$ (represented by horizontal dashed lines), though there are time intervals when neither of these frequencies contain significant wavelet energy
  $S_{wl}$. The red rectangle marks such an interval, which corresponds roughly to event A in figure 11(b). (c) Sketches of the flow modes corresponding to
  $f_{v1}$,
  $f_{v2}$ and
  $f_{v3}$, superimposed on representative snapshots of the instantaneous flow field.
If we compare with previous studies of straight tandem cylinders, we see that  $f_{v1}$ corresponds with co-shedding directly after the critical spacing at a comparable Reynolds number (Xu & Zhou Reference Xu and Zhou2004). Here
  $f_{v2}$ and
  $f_{v3}$ approach the dominant frequency of a single cylinder within the subcritical Reynolds number regime, which is typical for co-shedding regimes as
  $L/D$ increases (Sumner Reference Sumner2010).
3.3. Temporal variation of the forces
In figure 11(b) we see that the downstream cylinder lift exhibits alteration between high and low amplitudes. Intervals of high amplitude lift are accompanied by an increase in  $C_{Dd}$ (i.e. decreased suction, as
  $C_{Dd}$ is exclusively negative). Two high peaks stand out in the time traces of drag and vertical force on the upstream cylinder in figure 11(a). These peaks are by no means instantaneous events, but persist over several vortex shedding cycles. The first peak occurs within the interval
  $509 \leq tU_{0}/D \leq 540$ and the second within
  $784 \leq tU_{0}/D \leq 810$. It is worth noting that both these peaks are correlated in time with a transition from low to higher amplitude lift on the downstream cylinder. However, transitions from low to high amplitude lift are not uniquely associated with local peaks in
  $C_{Du}$ and
  $C_{zu}$.

Figure 11. Time histories of the forces for the (a) upstream and (b) downstream cylinders. There is alternation between high and low-amplitude lift modes for the downstream cylinder. Intervals of significantly reduced lift are marked by red rectangles in (b). The low-amplitude lift intervals are associated with oblique wake vortex shedding and an increased number of spanwise vortex dislocations. These phenomena are closely coupled to the mode switches in the gap. Here  $C_{Du}$ and
  $C_{zu}$ exhibit two significant peaks, each lasting approximately five vortex shedding cycles, marked by dashed red rectangles in (a).
We have no direct observations of the flow field during the last, most prominent, peak. However, we have a snapshot of the flow at  $tU_{0}/D = 525$, shown in figure 12. The difference between the wake structure at
  $tU_{0}/D = 525$ and
  $915$ (figure 3a) is quite striking. While the latter exhibits a comparably more orderly wake with nearly parallel vortex shedding and coherent gap shear layer vortices, the former is significantly more chaotic. The spanwise vortices have a distinct oblique shedding angle, and there is a high number of vortex dislocations. These dislocations occur, not just in the lower wake, but also quite high up along the straight vertical extension. Also noticeable is the development of the gap shear layers, with accelerated breakdown, spanwise undulations and dislocations. The loss of coherence associated with oblique vortex shedding and spanwise dislocations leads to reduced lift on straight bluff bodies (Prasad & Williamson Reference Prasad and Williamson1997b). The same mechanisms appear to be responsible for the low-amplitude lift intervals experienced by the downstream cylinder. For example, the event marked A in figure 11(b) corresponds to a time interval of localised low periodicity in the wake at
  $z/D = 0$, as seen in figure 10. Meanwhile, at various lower
  $z/D$ locations, the wake exhibits strong quasi-periodic fluctuations at frequencies centred on
  $f_{v3}$ during the same time interval.

Figure 12. (a) Isosurfaces of  $Q = 0.5$ for
  $tU_{0}/D = 525$, coloured by the spanwise vorticity. (b) Solid lines indicate positive
  $\omega _{z}D/U_{0}$, while dashed lines indicate negative
  $\omega _{z}D/U_{0}$. The wake exhibits oblique shedding with a large amount of vortex dislocations, even along the straight vertical extension. This time instant occurs at the end of the interval of low lift on the downstream cylinder, as shown in figure 11(b), and corresponds to an interval of markedly high drag on the upstream cylinder (see figure 11a).
Figure 13 shows the instantaneous pressure field in the flow at  $tU_{0}/D = 525$ for various
  $z/D$ levels. There is substantial variation of the flow regimes along the span, even within relatively short spanwise distances. For instance, gap vortices form on opposite sides of the gap at
  $z/D = 0$ and
  $z/D = -2$, shown in figure 13(c,d), respectively. If we consider the pressure around the downstream cylinder, it is clear that the lift force on the cylinder cannot be in phase along the span, which lowers the total lift.

Figure 13. Instantaneous pressure field at various  $z/D$ levels, at
  $tU_{0}/D = 525$. The white contour line marks
  $p/\rho U_{0}^{2} = 0$. The flow regime varies substantially with
  $z/D$ and the formation of gap vortices (marked by white arrows) is clearly not in phase along the span. From the pressure distribution around the downstream cylinder, it is obvious that the lift force on the cylinder is also out of phase, which leads to low-amplitude total lift.
The above conclusion does not, however, directly explain the occurrence of the two distinctive peaks in the drag and vertical forces on the upstream cylinder, seen in figure 11(a). For straight tandem cylinders, the transition from reattachment to co-shedding is associated with a jump in the drag on the upstream cylinder (Igarashi Reference Igarashi1981). Intuitively, if co-shedding occurred along larger portions of the curved span, this would increase the drag on the upstream cylinder. At  $tU_{0}/D = 525$ there is indeed one-sided co-shedding as high as
  $z/D = -2$, as shown in figure 13(b), with
  $f_{v3}$ as the dominant frequency of the surrounding time trace envelope (not shown for brevity). Because the vortices within the gap shedding region are to some degree aligned with the local curvature, a portion of the forces exerted on the upstream cylinder by these vortices will work in the vertical direction. This may be the reason why we also see vertical force peaks on the upstream cylinder simultaneously with the drag peaks.
There is an important difference between the peaks at  $tU_{0}/D \approx 525$ and
  $tU_{0}/D \approx 800$, and that is the behaviour of the upstream cylinder lift. The former is preceded by a peak in
  $C_{Lu}$, whereas during the actual event, the lift amplitude is quite low for both cylinders. This corresponds well with the loss of spanwise coherence described above. The peak at
  $tU_{0}/D \approx 800$, however, is in phase with a significant local peak in
  $C_{Lu}$. This indicates that the two peaks may have altogether different origins.
3.4. Development of the shear layers
From figure 3(a) we see that shear layer vortices are shed along the entire straight vertical extension, and the shedding also persists along nearly the entire curved cylinder span. The inception point of the shear layer instability seems to move further upstream as we move downwards into the curved gap.
Figure 14 shows excerpts of the time history of band-pass filtered crossflow velocity fluctuations  $v'/U_{0}$ in the
  $y/D < 0$ shear layer at various
  $z/D$ levels, and these can be used to asses the behaviour of the transition region. It is well known that the shear layer transition region in a straight single cylinder near wake exhibits random streamwise meandering (Prasad & Williamson Reference Prasad and Williamson1997a), due to intermittent amplification of the shear layer instability by small-scale eddies in the recirculation region (Rai Reference Rai2010). This implies that when point measurements are made in the shear layer close to the cylinder base, the shear layer instability manifests itself as short intervals of strong velocity fluctuations, such as those seen in figure 14. These fluctuations are conventionally called ‘packets’. When the measurement point is moved downstream, the number of observed fluctuation packets increases, as well as the fluctuation amplitudes (Prasad & Williamson Reference Prasad and Williamson1997a). In figure 14 the probe has the same distance to the upstream cylinder centre for all
  $z/D$ levels. As such, an increase in the number of packets and their amplitude indicates an upstream movement of the shear layer transition region.

Figure 14. Time traces of the band-pass filtered crossflow velocity fluctuations  $v'/U_{0}$, sampled at probe P3 in the upstream cylinder shear layer, at various
  $z/D$. The increase of fluctuations with decreasing
  $z/D$ correspond to an upstream movement of the shear layer transition region in the gap. Probe P3 is quite close to the upstream cylinder base (see figure 2), so that few fluctuations are expected along the straight vertical extension. The low and high cutoff frequencies of the band-pass filter were
  $fD/U_{0} = 0.45$ and
  $3.00$, respectively.
Placing a second body in the wake of a cylinder has a stabilising effect on the shear layers. Previous studies have shown that a splitter plate (Cardell Reference Cardell1993) or a second cylinder (Aasland et al. Reference Aasland, Pettersen, Andersson and Jiang2022b) can lessen the meandering of the shear layer transition region, and move this region downstream. Oblique vortex shedding has a similar effect, and may delay the critical Reynolds number for inception of transition in the shear layers (Prasad & Williamson Reference Prasad and Williamson1997a). The stabilising effect is related to the strength of the von Kármán vortices. Both oblique shedding and interference in the formation region weaken the vortex strength, which means that the strength of small-scale eddies in the recirculation region is lowered. Thus, there are fewer perturbations with sufficient strength to trigger the shear layer instability (Rai Reference Rai2010).
In the present study, stabilising of the gap shear layers comes primarily from the presence of the downstream cylinder, whose effect is particularly strong within the reattachment region. From figure 14(a–c) we see that along the straight vertical extension, the number of strong shear layer fluctuations is quite low. The number of fluctuations, their amplitude and the duration of the packets grow into the lower gap. This effect is especially eye catching between  $z/D = -4$ and
  $z/D= -8$ (figure 14f–h), where gap shedding events gradually become more frequent.
The upstream movement of the shear layer transition region is caused in part by the widening gap, decreasing the stabilising influence of the downstream cylinder. This result is consistent with the flow visualizations by Ishigai et al. (Reference Ishigai, Nishikawa and Cho1972), where the inception point of the gap shear layer instability is seen to move upstream when the gap ratio is increased from  $L/D = 2$ to
  $L/D = 5$, for Reynolds numbers between 3400 and 4000.
However, the increase of the vertical velocity component in the recirculation region of the upstream cylinder, seen in figure 4(b), also influences the inception of the shear layer instability. The existence of a downdraft region towards the end of the gap means that shear layer vortices and other small eddies are to some degree convected downwards, where they may contribute to further amplification of the shear layer instability. A similar mechanism was observed by Gallardo et al. (Reference Gallardo, Andersson and Pettersen2014) in the lower wake of a single convex curved cylinder. Furthermore, Jordan (Reference Jordan2010) found that for an inclined cylinder (inclined away from the inlet) at  ${{Re}} = 8000$, transition to turbulence, as well as the development towards a fully turbulent shear layer after transition, was enhanced with increasing inclination.
The strongest fluctuations, in terms of amplitude and duration, are found at  $z/D = -8$. Fluctuations at
  $z/D = -11$ are not as strong, as seen in figure 14(i), though they are more plentiful. A larger number of packets at
  $z/D= -11$ makes sense, since the shear layers are no longer stabilised by the downstream cylinder at this level. At
  $z/D = -8$, there is still some influence from the downstream cylinder, which leads to more stable shear layers. The high amplitude of the fluctuations at
  $z/D = -8$, compared with
  $z/D = -11$ is likely attributed to the strength of the large-scale gap vortices at this level. These vortices are significantly stronger than the more streamwise-oriented vortices at
  $z/D = -11$.
Interestingly, some of the strongest packets at  $z/D = -8$ (marked A and B in figure 14h) are felt in both shear layers, as shown in figure 15. Shear layer amplification events are normally not in phase for a straight single cylinder (Rai Reference Rai2010). The fact that events A and B are in phase may be the result of particularly strong gap shedding events. Gap shedding increases entrainment into the recirculation region of the upstream cylinder, and may thus amplify the shear layer instability through strong small-scale eddies. At this level, the vertical velocity component is significant. Figure 15(b) shows that
  $v'/U_{0}$ and
  $w'/U_{0}$ have very similar amplitudes, and that events A and B are significant in the traces of both velocity components. Strong gap shedding events in the lower gap generally coincide with increased vertical velocity magnitudes and upstream movement of the downdraft region. It is possible that this influences the shear layer instability so that amplification occurs in phase across the gap. Event B, which is more symmetric across the gap than event A, also has stronger vertical velocity amplitudes. Unfortunately, we do not have visualisation of the flow field for events like A and B, so we cannot conclude firmly.

Figure 15. Time traces of the band-pass filtered (a) crossflow velocity fluctuations  $v'/U_{0}$ and (b) vertical velocity fluctuations
  $w'/U_{0}$, sampled at probes P
 $3'$ and P3 in the upstream cylinder shear layers, at opposite sides of the gap at
  $z/D = -8$. We see that events A and B, marked in figure 14(h), are felt in both shear layers. This is believed to be caused by strong gap shedding events.
At the same time as the transition region moves upstream in the gap shear layers, the near-wake vortices gradually weaken due to the increasing axial flow. This is reflected in the spanwise development of turbulent kinetic energy (TKE), displayed in figure 16. The maxima of TKE are found along the straight vertical extension. However, the energy quickly declines in the near wake for  $z/D \leq 2$, and the local maxima of TKE gradually move into the gap. In the gap, the highest levels of TKE are found in the vicinity of
  $z/D = -8$, as shown in figure 16(g). This agrees well with our previous observations regarding the strength of the gap vortices in this spanwise region.

Figure 16. The TKE at various  $z/D$ (a–h) and in the symmetry plane (i). The TKE is strongest in the near wake along the straight vertical extension. As the effective gap ratio widens with decreasing
  $z/D$, the local maxima of TKE move into the gap. This reflects the change of spanwise localised flow regime from reattachment to gap shedding.
Unsurprisingly, the spanwise development of the gap shear layers differs substantially from the shear layers behind a single convex curved cylinder, due to the presence of the downstream cylinder. In the study of Gallardo et al. (Reference Gallardo, Andersson and Pettersen2014), the shear layer fluctuations were strongest, and occurred most commonly, in the lower wake and, secondly, along the straight vertical extension, at the  $z/D$ values that are equivalent to
  $z/D = 3$ and
  $z/D = -10$ in the present study. The fluctuations at the
  $z/D$ values corresponding to
  $z/D = -2$ and
  $z/D = -6$ were substantially weaker. This was attributed to the local inclination of the wake vortices. In the present study, as we have seen, this region has an increase in the fluctuations compared with the straight vertical extension. The effect of local inclination of the gap vortices seems to be overshadowed by the effect of the downstream cylinder and the tandem flow regimes. It may be that the oblique shedding in the wake has an effect on the shear layers of the downstream cylinder, but this is impossible to evaluate, due to interference from the upstream cylinder shear layers.
The shear layer frequency  $f_{sl}$ of straight tandem cylinders in the reattachment regime does not differ from that of a single cylinder at the same Reynolds number (Aasland et al. Reference Aasland, Pettersen, Andersson and Jiang2022b). In the present study, however,
  $f_{sl}$ is affected by the curvature. Crossflow velocity spectra sampled in the gap shear layer, at probes P1–P4 (see figure 2), are given in figure 17. The broad-banded main peak of the shear layer frequency, centred on
  $f_{sl1}D/U_{0} \approx 1.07$, remains nearly constant along the straight vertical extension, down to
  $z/D = -1$. This value is similar to
  $f_{sl}$ in the gap of straight tandem cylinders at
  $Re = 4200$ and
  $L/D = 2$ (Xu & Zhou Reference Xu and Zhou2004). In the curved part of the gap, however, there is a gradual shift towards higher frequencies down to
  $z/D \approx -4$, with a main peak
  $f_{sl2}D/U_{0} \approx 1.3$ followed by a decrease towards
  $f_{sl1}$. At
  $z/D = -6$,
  $f_{sl1}$ and
  $f_{sl2}$ coexist, and at
  $z/D = -11$, the shear layer frequencies consist of one broad-banded peak centred on
  $f_{sl1}$.

Figure 17. Spectra of the crossflow velocity  $v/U_{0}$ sampled in the gap shear layer at various
  $z/D$, at probes P1–P4 (see figure 2). Here
  $f_{sl}$ is nearly constant along the straight vertical extension, but changes to a slightly higher value,
  $f_{slc}$, in the curved gap;
  $f_{slc}$ varies somewhat along the span. The inception point of the K–H instability moves upstream in the shear layer as we move downwards in the gap, due to an increased effective gap ratio and triggering by the vertical velocity. This is also shown by the time traces in figure 14. There is significant nonlinear interaction between the shear layer frequencies and the primary vortex shedding frequency and its harmonics.
In the study of Gallardo et al. (Reference Gallardo, Andersson and Pettersen2014), the shear layer frequency along the straight vertical extension corresponds well with results from straight single cylinder studies at a similar Reynolds numbers (Norberg Reference Norberg1987; Dong et al. Reference Dong, Karniadakis, Ekmekci and Rockwell2006). Downwards along the curved span, however, there is a gradual transition to a lower frequency. This result aligns with the observations of Jordan (Reference Jordan2010), where the shear layer frequency decreased with increasing cylinder inclination (i.e. increased axial flow). As we have just seen, the situation is very different in the present study. While  $f_{sl}$ seems to decrease with axial flow for a single convex curved cylinder, there is no obvious relation between the shear layer frequency and the axial flow in the present study. Here
  $f_{sl2}$ is first detected at a
  $z/D$ level where there is still primarily upwelling in the gap, as seen in figure 4(b). Although this frequency dominates where the vertical velocity increases rapidly, its relative importance declines again in the region of maximum downdraft. This phenomenon may be related to interaction with the primary instability in the wake, and will be further discussed in § 4.
Along the straight vertical extension, the difference frequency of the shear layer and von Kármán shedding,  $f_{\varDelta } = f_{sl1} - f_{v1}$, is large, indicating nonlinear interaction between the two (Miksad et al. Reference Miksad, Jones, Powers, Kim and Khadra1982). In figure 17(a) we see that the difference frequency grows with
  $x/D$, so that its energy is higher than that of
  $f_{sl1}$ at probe P4, towards the end of the gap. This is consistent with the findings of Kourta et al. (Reference Kourta, Boissin, Chassing and Ha Minh1987) for a single straight cylinder at subcritical Reynolds numbers. Beyond
  $z/D = -1$, nonlinear interaction is not easily discernible in the curved part of the gap.
The shear layers of the downstream cylinder are buffeted by shear layer vortices from the gap shear layers, whose strength, coherence and frequency depend on  $z/D$. Figure 18 shows the crossflow velocity spectra sampled at probes P5–P7, located in the downstream cylinder shear layer. We see that the peaks become increasingly broad banded in the lower wake, as the shear layer transition region in the gap moves further upstream. This corresponds well with the results of Khabbouchi et al. (Reference Khabbouchi, Fellouah, Ferchichi and Guellouz2014), who found that increasing the free-stream turbulence increased the bandwidth of the shear layer frequency peak. The upstream buffeting also means that there is very little difference in the spectral energy levels at the probes along the wake shear layers, as opposed to the gap shear layers where the inflow is nearly smooth.

Figure 18. Spectra of the crossflow velocity  $v/U_{0}$ sampled in the downstream cylinder shear layer (probes P6–P8, see figure 2) at various
  $z/D$.
In figure 18(a–d) we see that nonlinear interaction, indicated by the difference-frequency peak, occurs along the same range of  $z/D$ as in the gap shear layer. At
  $z/D = 5$, in figure 18(a), the subharmonic of the shear layer frequency is seen. The occurrence of the subharmonic is associated with shear layer vortex pairing (Ho & Huang Reference Ho and Huang1982). Looking at figure 7(a), it is easy to see that pairing is possible in the overshooting gap shear layer at
  $z/D = 5$, as well as at
  $z/D = 1$ (figure 7b). Here, the streamwise distance between the shear layer transition and the merging of the upstream and downstream shear layers is sufficiently long to permit pairing, in accordance with the observations of Cardell (Reference Cardell1993). This is not the case with the symmetric reattachment seen in figure 7(c–e). Intuitively, shear layer vortex pairing might also occur further down in the curved gap, when the transition region moves upstream, similar to straight tandem cylinders at a higher subcritical Reynolds number (Aasland et al. Reference Aasland, Pettersen, Andersson and Jiang2022b). However, the overall turbulence level in this region makes it hard to distinguish the subharmonic in the spectra, as seen in figure 18(f–h). Pairing events at
  $z/D= 1$ have been recorded, and some of these are shown in figure 19.

Figure 19. Temporal development of the flow field at  $z/D = 1$, visualised by the spanwise vorticity. Pairing of shear layer vortices occurs twice during the depicted time interval. First the vortices
  $slv1$ and
  $slv2$ undergo pairing between (a) and (c),
  $slv3$ and
  $slv4$ subsequently pair, between (c) and (e). The paired structures are convected into the near wake. Between (h) and (i), there is a switch from alternating to symmetric reattachment. This mode change occurs simultaneous with a decrease of the global lift force on the downstream cylinder, as shown in figure 11(b). In (b–g) we see that shear layer vortices from the upstream cylinder are fed directly into the near wake so that the forming wake vortex consists primarily of such vortices (dashed oval). This may affect the shedding frequency.
3.5. Flow modes and the interaction between them
The presence of mode switches in the flow has been established through examination of the force time traces and crossflow velocity spectra, as well as flow visualisations (for example, in the snapshots at  $z/D = -11$ in figure 8). In the following, we examine the characteristics of these mode switches and how they influence other coexisting regimes along the cylinder span.
Our flow visualisations indicate that loss of spanwise coherence discussed in § 3.3 results from one or several mode switches. At  $z/D = 1$, around
  $tU_{0}/D = 923.5$, we observe a switch from strong to weak wake vortex shedding, accompanied by a narrower wake width. This is clearly shown in figure 19(h–j), as well as in supplementary movie 2. The switch directly precedes a reduction of the global downstream lift amplitude, as shown in figure 11(b). When the weak shedding begins, the shear layers become more symmetrically reattached, and the shear layer instability in both shear layers appears to be fairly synchronized in both time and streamwise position.
Meanwhile, at other spanwise locations, different types of mode switches occur simultaneously, though none appear to be as persistent in time as the one observed at  $z/D = 1$. At
  $z/D = -1$, where the basic flow regime is symmetric reattachment there is a significant reduction of the shear layer instability (see figure 20b), around the time of the mode switch at
  $z/D = 1$. The shear layers remain laminar, and shear layer vortices only form at the very end of the gap. This scenario lasts for approximately one vortex shedding period, after which the shear layer transition region moves upstream in the gap. All simultaneous mode variations cannot be displayed herein, but supplementary movies (see movies 3–5) show the development of the flow field in additional
  $z/D$ planes. In the range
  $-4 \leq z/D \leq -1$, a temporary weakening of the wake vortex shedding is found.

Figure 20. Instantaneous spanwise vorticity (left) and vertical velocity (right) at  $z/D = -1$. The downdraft region, marked by a dashed circle, along the downstream cylinder front face meanders upstream between (a-i) and (b-i) and breaks up into smaller regions. In (c-i) some of these small downdraft regions come into contact with the shear layer near the black arrows and trigger the K–H instability. This causes the shear layer transition region to shift upstream, as seen in (d). The shown time interval covers a little more than two vortex shedding cycles.
Mode switches along the span appear to be closely related to the variations of the vertical velocity component, which gives a clue as to how modes may interact and influence each other. In the curved part of the gap, both positive and negative vertical velocities exist at all  $z/D$ levels, meaning information can be carried both upwards and downwards along the span. The mode switch described above, for instance, is directly preceded by a strong gap shedding event observed at
  $z/D = -6$ and
  $z/D = -8$, which influences the vertical velocity component
  $w/U_{0}$ in the gap region. At the same time, the near wake at
  $z/D = -11$ undergoes a massive widening. Here
  $w/U_{0}$ is generally positive in the upstream cylinder shear layers. Towards the gap centreline, however, a downdraft region develops, growing larger in the lower gap.
At  $z/D = -1$, upwelling is prevalent in the gap, except in a small region of downdraft near the front face of the downstream cylinder. Figure 20 shows a gradual upstream shift of this downdraft region, which occurs around the same time as the previously described mode switch. At the same time as moving upstream, this region slowly diffuses and breaks up into smaller regions (figure 20c-i). The gap shear layers subsequently undergo a distinct change from being relatively calm and stable to a state of strong instability, with a significant upstream shift of the transition region, shown in figure 20(d). We see that amplification of the shear layer instability occurs when smaller downdraft regions move into contact with the shear layers.
If we consider the inviscid vorticity equation
 \begin{equation} \frac{{\rm D} \boldsymbol{\omega}}{{\rm D} t} = (\boldsymbol{\omega} \boldsymbol{\cdot}\boldsymbol{\nabla}) \boldsymbol{u} \end{equation}
and its spanwise component
 \begin{equation} \frac{{\rm D} \omega_{z}}{{\rm D} t} = \underbrace{\omega_{x} \frac{\partial w}{\partial x} + \omega_{y}\frac{\partial w}{\partial y}}_{tilting} + \underbrace{\omega_{z}\frac{\partial w}{\partial z}}_{stretching}, \end{equation}
we see that the downdraft  $w$ can amplify the spanwise vorticity of the shear layer in several ways. All three vorticity components are non-zero in the majority of the gap and wake flow, so that neither of the right-hand side terms of (3.2) are zero unless the gradients of the vertical velocity are zero. As seen in figure 20(a-i), the vertical velocity is positive in the larger part of the gap region at
  $z/D = -1$, with slightly higher values towards the outer part of the shear layer. When a downdraft region comes into contact with a shear layer region with positively signed vertical velocity (such as in figure 20c-i), this creates a strong gradient of the vertical velocity in the
  $y$ direction. We also see from figure 20(c-i) that there must be a gradient of the vertical velocity in the
  $x$ direction, albeit weaker. These two vertical velocity gradients contribute to amplification of the shear layer instability through vortex tilting (first two terms of (3.2)). While the vertical velocity gradient in the
  $z$ direction may not be very strong, the spanwise vorticity certainly is, meaning that a significant contribution to the shear layer amplification can also come from vortex stretching (last term of (3.2)). This is in keeping with the results of Rai (Reference Rai2010) regarding amplification of the shear layer instability.
The slow meandering of the downdraft region observed in figure 20 corresponds with the results of Aasland et al. (Reference Aasland, Pettersen, Andersson and Jiang2023b) for curved tandem cylinders at  ${{Re}} = 500$. In that study it was suggested that a low-frequency variation of the vortex formation length in the lower part of the gap influenced the downdraft along the front face of the downstream cylinder. Such low-frequency variation in the lower gap is indicated by the flow visualizations in figure 8, as well as the spectral analysis herein. Figure 21 shows maps of the spectral density of
  $fU_{0}/D = 0.010625$, captured during the simulations by in situ fast Fourier transform analysis. At
  $z/D = -11$, the spectral energy is clustered in the vortex formation region, whereas at
  $z/D = -1$, the energy is clustered near the reattachment points and in the shear layer towards the end of the gap. We have seen that the vertical velocity in the gap impacts the stability of the gap shear layers, and that this vertical velocity is coupled with low-frequency mode variations in the lower gap. Together, these results imply that the vortex dynamics of the lower gap may influence the shear layer instability at higher
  $z/D$ levels, through modulation of the vertical velocity. Furthermore, these dynamics may influence the near wake, since an upstream shift of the transition region in the gap shear layers leads to increased fluid entrainment into the wake vortices, similar to free-stream turbulence (Khabbouchi et al. Reference Khabbouchi, Fellouah, Ferchichi and Guellouz2014).

Figure 21. Spectral energy map of  $fU_{0}/D = 0.010625$ at (a)
  $z/D = -11$ and (b)
  $z/D = -1$ (see figure 2b). A cluster of low-frequency spectral energy in the vortex formation region at
  $z/D = -11$ implies a slow variation of the formation length. This type of mode variation is visualised in figure 8. The mode variation in the lower gap causes modulation of the vertical velocity, which in turn influences the position of the shear layer transition region, as shown in figure 20.
The modulation of the vertical velocity component in the low- $Re$ study of Aasland et al. (Reference Aasland, Pettersen, Andersson and Jiang2023b) also contributed to low-frequency quasi-periodic asymmetry of the large-scale gap vortices, so that the gap recirculation region was biased towards one side for several vortex shedding periods. The bias switched with a period of some 100 time units. A similar type of asymmetry is seen in the present study, corresponding to one-sided formation and/or shedding, depending on the effective gap ratio. The obvious quasi-periodicity observed in the previous study is not present, however, due to the coexistence of several modes at the same spanwise location (such as at
  $z/D = 0$). Time traces taken at the gap centreline, directly upstream of the downstream cylinder front face (probe P5) are presented in figure 22. At
  $z/D = 1$, in figure 22(b), a similar bias as for
  ${{Re}} = 500$, with approximately the same period is observed. The behaviour is not consistent, however, as other flow modes intermittently become dominant. Gap asymmetry is most prominent in the range
  $-4 \leq \ z/D \leq -1$, as seen in figure 22(d–f). This is where one-sided co-shedding starts to occur frequently. At
  $z/D = -6$, in figure 22(g), we see longer intervals of non-biased
  $v/U_{0}$, which is indicative of roll-up of both gap shear layers. Finally, at
  $z/D = -8$, roll-up of both shear layers is the dominant flow mode in the gap, as seen in figure 22(h).

Figure 22. Time traces of the crossflow velocity  $v/U_{0}$ on the gap centreline (probe P5) at various
  $z/D$ locations. A bias of the time trace away from the centreline occurs for several vortex shedding periods along the entire gap, and indicates one-sided formation or shedding of gap vortices. Due to the coexistence of flow modes, the bias is intermittent.
4. Discussion
We have seen that the present study has several features in common with convex curved tandem cylinders at  ${{Re}} = 500$ (Aasland et al. Reference Aasland, Pettersen, Andersson and Jiang2023b), though transition to turbulence in the shear layers has a significant impact. An important difference between the gap and wake dynamics of the present and previous studies, however, is that, for
  ${{Re}} = 500$, the vortex formation is entirely dominated by the frequency of the vortices in the upper wake, so that
  $St = 0.143$ dominates along the entire span. For
  ${{Re}} = 3900$, on the other hand, there is a gradual shift of the dominant frequency along the span, and this is reflected in the instantaneous flow field. Three separate main modes have been identified, each with their distinct dominant frequency. We have seen that although these modes are localised in the sense that one will dominate along a given spanwise section, they do coexist. Given that alternating overshoot/reattachment can also be a bistable flow regime for
  $L/D = 3$, both for straight (Aasland et al. Reference Aasland, Pettersen, Andersson and Jiang2023a) and curved tandem cylinders (Aasland et al. Reference Aasland, Pettersen, Andersson and Jiang2023b), this result implies that there is no truly stable flow regime anywhere along the span.
There is communication along the span by means of the vertical velocity component, which causes local regimes to interact and influence each other. One can readily imagine that an unstable local regime might switch to its closest neighbour regime when perturbed. At  $z/D = 1$, for example, that regime is symmetric reattachment, which occurs near the transition between the straight vertical extension and the curved cylinders. Thus, a mode switch between alternating overshoot/reattachment and symmetric reattachment is observed. Such a mode switch has not previously been reported for straight tandem cylinders, nor was it seen for curved tandem cylinders at a lower Reynolds number. Since the switch seems closely related to the instability of the shear layers, it cannot be expected to occur at a Reynolds number at which the shear layers are stable. There is, however, no reason to believe that a bistable switch between alternating overshoot/reattachment and symmetric reattachment should be non-existing for straight tandem cylinders at a subcritical Reynolds number, considering the variation of mode switches already observed (Igarashi Reference Igarashi1981; Xu & Zhou Reference Xu and Zhou2004; Kitagawa & Ohta Reference Kitagawa and Ohta2008; Aasland et al. Reference Aasland, Pettersen, Andersson and Jiang2023a).
We have seen that the shear layer instability in the gap may have a profound influence on the near-wake vortex dynamics. In light of this observation, it is an interesting question whether the reverse is true, i.e. do the large-scale vortex dynamics influence the shear layer instability in the gap, and if so, in what way? Upstream feedback in shear layers has received significant attention over the years, in particular impinging shear layers; a topic that is certainly tangent to the present study. Rockwell & Knisely (Reference Rockwell and Knisely1979) showed that the organization of the shear layer was dramatically enhanced when impinging on a downstream corner, manifested in regularity of streamwise autocorrelations and less broad-banded velocity spectra. The effect is similar to that of acoustic forcing on jets or shear layers, which may enhance vortex pairing (Becker & Massaro Reference Becker and Massaro1968; Peterka & Richardson Reference Peterka and Richardson1969; Ho & Huang Reference Ho and Huang1982). It is important to note that the increased organization of the shear layer arising from impingement or external forcing does not alter the fundamental frequency of the shear layer instability (Peterka & Richardson Reference Peterka and Richardson1969; Rockwell & Knisely Reference Rockwell and Knisely1979; Ho & Huang Reference Ho and Huang1982).
For a straight single cylinder, Kourta et al. (Reference Kourta, Boissin, Chassing and Ha Minh1987) found that nonlinear interaction between the primary instability and the shear layer instability persisted even with a splitter plate in the wake. Similar to impinging shear layers, the basic shear layer frequency was not changed, contrary to the primary instability, which exhibits a lower dominant frequency when a splitter plate is introduced. This result indicated that there was no direct feedback from the von Kármán vortex shedding in the cylinder wake. The same conclusion was drawn by Aasland et al. (Reference Aasland, Pettersen, Andersson and Jiang2022a), when comparing the shear layer frequencies for straight single and tandem cylinders at  ${{Re}} = 10^{4}$. This may not be the case in the present study, however, due to the cylinder curvature.
To shed more light on this matter, we first consider possible reasons why the shear layer frequency decreased in the lower gap in the single convex curved cylinder study of Gallardo et al. (Reference Gallardo, Andersson and Pettersen2014). The results showed a slight decrease in  $f_{v}$ in the lower wake, which coincided with weakening of the wake vortices. If
  $f_{v}$ and
  $f_{sl}$ are decoupled, like in the splitter plate case, a decrease of
  $f_{v}$ cannot be the cause of a decrease in
  $f_{sl}$. The change in
  $f_{sl}$ may, however, be related to the axial flow itself, either along the cylinder front face or in the near wake. In the case of straight single cylinders,
  $f_{sl}$ decreases with decreasing Reynolds number (Bloor Reference Bloor1964; Prasad & Williamson Reference Prasad and Williamson1997a). Like Prasad & Williamson (Reference Prasad and Williamson1997a), we assume that the shear layer frequency scales with the velocity outside the boundary layer at separation
  $U_{sep}$, and the momentum thickness of the shear layer at the point where the K-H instability is first triggered
  $\delta _{kh}$, so that
 \begin{equation} f_{sl} \sim \frac{U_{sep}}{\delta_{kh}}. \end{equation}
Note that  $\delta _{kh}$ is not the momentum thickness where transition to turbulence occurs, but the thickness at the inception of the linear K-H instability, in accordance with the definition by Sato (Reference Sato1965). From (4.1), we gather that the decrease of
  $f_{sl}$ downwards along the span in the study of Gallardo et al. (Reference Gallardo, Andersson and Pettersen2014) should be related to either a decrease in the velocity outside the boundary layer, which may occur due to curvature-induced axial flow, or an increase in momentum thickness. Such data are not presented in that study however, so we cannot draw any firm conclusions.
In the present study, however, we can calculate the momentum thickness by
 \begin{equation} \delta_{kh} = \int_{0}^{\infty} \frac{u(y)}{U_{\infty}} \left(1- \frac{u(y)}{U_{\infty}}\right) {{\rm d}y}, \end{equation}
where  $U_{\infty }$ is the velocity just outside the shear layer. With the available data, we cannot accurately determine the position of inception of the linear K–H instability, so we have used probe P1 as the reference position. The drawback of this method is that the transition region moves upstream with decreasing
  $z/D$, which must necessarily have an effect on the momentum thickness at probe P1.
The time-averaged velocity outside the boundary layer of the upstream cylinder at separation and the calculated momentum thickness  $\delta _{p1}$ are shown in figure 23(a,b), respectively. We see that both variables decline with decreasing
  $z/D$. The ratio between
  $\bar {u}/U_{0}$ and
  $\delta _{p1}/D$ is plotted in figure 23(c). Apart from the dip at
  $z/D = -2$, there is a steady increase downwards into the gap. According to (4.1), there should have been an increase in the frequency. From § 3.4, however, we recall that the shear layer frequency increases between
  $z/D = -1$ and
  $z/D = -4$, and then decreases to its former value into the lower curved gap. Even with the uncertainty added from using P1, it is clear that (4.1) cannot explain the spanwise variation of the shear layer frequency in the present study. Thus, the explanation must be found elsewhere.

Figure 23. Spanwise variation of (a) the time-averaged streamwise velocity outside the boundary layer at separation on the upstream cylinder, (b) non-dimensional momentum thickness at the probe P1,  $\delta _{p1}/D$, and (c) the ratio between
  $\bar {u}/U_{0}$ and
  $\delta _{p1}/D$.
A notable feature of the shear layer frequencies herein is that they are all very close to the higher harmonics of the von Kármán vortices, and they seem to be tied to the dominant local Strouhal number. If this is the case, the mechanism of feedback is in all probability different to that which causes enhanced shear layer vortex paring by external forcing. Previous studies (Peterka & Richardson Reference Peterka and Richardson1969; Ho & Huang Reference Ho and Huang1982) showed that the forcing frequency must be close to the fundamental shear layer frequency, or a subharmonic of this frequency, for enhanced pairing to take place, while the present study indicates that the fundamental frequency of the shear layer may be altered by the wake vortex frequency. The increase of the gap shear layer frequency along the curved cylinder span follows the Strouhal number shift towards  $f_{v3}$, so that the relative importance of
  $f_{sl2}$ grows. When the strength of
  $f_{v3}$ diminishes in the more broad-banded cross-velocity spectra in the lower wake (see figure 9h), the strength of
  $f_{sl2}$ declines in favour of
  $f_{sl1}$. These observations indicate that the large-scale vortex dynamics truly may exercise an influence on the shear layer instability, possibly through fluctuations in the pressure field. One may hypothesise that the gap shear layers are more susceptible to external forcing in the present case, compared with straight tandem cylinders, because of the destabilising effect of the vertical velocity demonstrated in § 3.5.
Considering the sensitivity of the shear layers for straight tandem, the flow field of convex curved tandem will in all probability be sensitive to Reynolds number variations within the subcritical regime. Moreover, from an engineering perspective, the effect of Reynolds numbers beyond subcritical could certainly be a fruitful topic of further study, as well as parameter studies on geometrical variations (gap ratio, radius of curvature) and inflow direction. The latter, in particular, is likely important, given the sensitivity of a single curved cylinder to the incident flow direction.
5. Concluding remarks
In the present study, turbulent flow around curved tandem cylinders has been studied for the first time, by means of DNS. The convex configuration was considered, with a nominal gap ratio of  $L/D = 3$. The Reynolds number was
  ${{Re}} = 3900$.
There is spanwise variation of flow regimes, and three distinct Strouhal numbers are found in the flow, corresponding to alternating overshoot/reattachment, symmetric reattachment and co-shedding. This situation is quite different from a single convex curved cylinder and convex curved tandem cylinders at a lower Reynolds number, where the vortices in the upper wake govern the flow so that only one dominant frequency is found. An important finding is that though one of the three modes is normally dominant along a given spanwise section, a minimum of two modes coexist along the majority of the span. Given that alternating overshoot/reattachment is a bistable flow regime for  $L/D = 3$, this implies that there is no truly stable flow regime anywhere along the span. Near the transition between the curved cylinder and the straight vertical extension, all three modes coexist and have approximately equal spectral densities, indicating multistability. A mode switch between alternating overshoot/reattachment and symmetric reattachment is directly observed. This type of bistability has not been reported for straight tandem cylinders.
Random alterations between parallel and oblique shedding are found, and these are closely connected to spanwise vortex dislocations in the wake, caused by mode switches. The dislocations may occur along the entire height of the wake, and result in extended time intervals of low-amplitude lift fluctuations on the downstream cylinder.
At  ${{Re}} = 3900$, transition to turbulence initiates in the shear layers, and a key objective of the present investigation has been to characterise the effect of the shear layer instability and on this intrinsically complex flow field. Detailed numerical results reveal that there are complex interactions between the primary instability, the shear layer instability and the alterations between different tandem cylinder flow modes along the span. Amplification of the shear layer instability in the gap results in increased forcing on the downstream cylinder shear layers, which may in turn influence the wake vortex formation process and trigger an intermittent switch of tandem cylinder flow regimes. Conversely, the spectral analysis indicates that there may be direct feedback from the vortices in the near wake to the shear layer instability, so that the shear layer frequency is to some degree governed by the local dominant Strouhal number.
The axial velocity in the gap plays an integral role in the interaction between the shear layer instability and the flow modes, because it contributes to amplification of the shear layer instability through vortex tilting and stretching. In particular, the downdraft region along the front face of the downstream cylinder exhibits slow streamwise meandering, governed by the low-frequency variation of the vortex formation length in the lower gap region. When this downdraft region travels upstream in the gap, it may trigger early transition to turbulence in the shear layer, and thus, modify the gap and near-wake flow field. This means that the dynamics of the lower gap region may in fact influence the shear layer instability much higher up in the gap.
Supplementary movies
Supplementary movies are available at https://doi.org/10.1017/jfm.2024.576.
Funding
This work is supported by the Research Council of Norway through the Public Sector PhD Scheme, and the National Public Roads Administration, where T.E.A. is an employee. Computational hours were granted by the Norwegian HPC project NN9191K.
Declaration of interests
The authors report no conflict of interest.
Appendix. Grid convergence
Time-averaged velocity profiles are shown in figure 24 for various  $z/D$ levels. The profile of grid 1 (coarse) resembles the co-shedding regime, which shows quite clearly that an under-resolved gap region will fail to capture reattachment of the upstream cylinder shear layers. There is good agreement between grid 2 (medium) and grid 3 (fine), save at
  $z/D = 5$, where there is some discrepancy in the velocity deficit. This discrepancy along part of the straight vertical extension is echoed in the crossflow velocity fluctuations along a vertical line in the wake
  $(x/D = -4, y/D = 0)$, shown in figure 25, and in the profiles of TKE in figure 26. These results correspond with the difference in lift coefficients between grid 2 and grid 3, discussed in § 2.2 (see table 1). Below
  $z/D = 1$, there is good agreement between grid 2 and grid 3 in the velocity fluctuations, as well as in the TKE profiles.

Figure 24. Profiles of the time-averaged streamwise velocity in the gap and near wake at various spanwise locations;  $-$ grid 1,
  $--$ grid 2,
  $- {\cdot } -$ grid 3.

Figure 25. Spanwise profiles of the time-averaged velocity fluctuations in the wake at  $(x/D = -4, y/D = 0)$; — grid 1, - - - - grid 2,
  $-{\cdot}-{\cdot}$ grid 3.

Figure 26. Profiles of TKE in the gap and near wake at various spanwise locations; — grid 1, - - - - grid 2,  $-{\cdot}-{\cdot}$ grid 3.


 Open access