Hostname: page-component-cd9895bd7-gxg78 Total loading time: 0 Render date: 2024-12-23T15:34:06.829Z Has data issue: false hasContentIssue false

Turbulent channel flow of suspensions of neutrally buoyant particles over porous media

Published online by Cambridge University Press:  29 December 2022

Parisa Mirbod*
Affiliation:
Department of Mechanical and Industrial Engineering, University of Illinois at Chicago, 842 W. Taylor Street, Chicago, IL 60607, USA
Seyedmehdi Abtahi
Affiliation:
Department of Mechanical and Industrial Engineering, University of Illinois at Chicago, 842 W. Taylor Street, Chicago, IL 60607, USA
Abbas Moradi Bilondi
Affiliation:
Department of Mechanical and Industrial Engineering, University of Illinois at Chicago, 842 W. Taylor Street, Chicago, IL 60607, USA
Marco Edoardo Rosti
Affiliation:
Complex Fluids and Flows Unit, Okinawa Institute of Science and Technology Graduate University, 1919-1 Tancha, Onna-son, Okinawa 904-0495, Japan
Luca Brandt
Affiliation:
FLOW, Department of Engineering Mechanics, KTH Royal Institute of Technology, SE-10044 Stockholm, Sweden Department of Energy and Process Engineering, Norwegian University of Science and Technology (NTNU), NO-7491 Trondheim, Norway
*
Email address for correspondence: [email protected]

Abstract

This study discusses turbulent suspension flows of non-Brownian, non-colloidal, neutrally buoyant and rigid spherical particles in a Newtonian fluid over porous media with particles too large to penetrate and move through the porous layer. We consider suspension flows with the solid volume fraction ${{\varPhi _b}}$ ranging from 0 to 0.2, and different wall permeabilities, while porosity is constant at 0.6. Direct numerical simulations with an immersed boundary method are employed to resolve the particles and flow phase, with the volume-averaged Navier–Stokes equations modelling the flow within the porous layer. The results show that in the presence of particles in the free-flow region, the mean velocity and the concentration profiles are altered with increasing porous layer permeability because of the variations in the slip velocity and wall-normal fluctuations at the suspension-porous interface. Furthermore, we show that variations in the stress condition at the interface significantly affect the particle near-wall dynamics and migration toward the channel core, thereby inducing large modulations of the overall flow drag. At the highest volume fraction investigated here, ${{\varPhi _b}}= 0.2$, the velocity fluctuations and the Reynolds shear stress are found to decrease, and the overall drag increases due to the increase in the particle-induced stresses.

Type
JFM Papers
Copyright
© The Author(s), 2022. Published by Cambridge University Press

1. Introduction

The turbulent flow of suspensions over porous media is crucial in various environmental phenomena and industrial technologies. These include sedimentation in rivers, pyroclastic flows, flow through unconsolidated sand (Zhai et al. Reference Zhai2005), and hydraulic fracturing (Song, Jinzhou & Yongming Reference Song, Jinzhou and Yongming2014). In these applications, both inertia and the presence of a porous surface play a critical role in the suspension dynamics and fluid–solid interactions. This study therefore focuses on understanding how the permeability of a porous medium affects the dynamics of suspensions and the behaviour of particles in a turbulent channel flow with fixed porosity and porous layer thickness.

1.1. Turbulent flows over porous media

The flow over and through a porous medium with a complex structure can be examined by modelling the porous medium as a continuum with given physical properties (i.e. porosity and permeability). The porosity $\varepsilon$ of a porous medium is defined as the ratio of its void volume to its bulk volume. Fractions and percentages can be used to express this dimensionless quantity. A porous material's permeability $K$, on the other hand, determines how well fluids can pass through it. A porous material with high permeability allows fluids to flow more easily than one with low permeability. The permeability of a porous medium is related to the porosity, shape and level of connections of the pores (Bear Reference Bear1988).

One of the first studies on flow through porous media was published by Darcy (Reference Darcy1856). In his experiments, he demonstrated that the average flow rate flowing through sand (porous media) is proportional to the pressure gradient across it. Darcy's experimental data demonstrated clearly a linear relationship between average discharge rate and pressure gradient. Darcy's law consists of two terms: one term can be interpreted as an average drag felt by the fluid as it passes through the porous medium and is balanced by the second term, which is the pressure gradient term. For the low porous Reynolds number for which Darcy's law holds, i.e. $Re_p \ll 1$, the flow is governed by Stokes’ equation, in which the viscous term is responsible for the Darcy drag. A deviation from linearity is observed as $Re$ increases. A nonlinear relationship was proposed by Forchheimer, with a quadratic drag term that better fits experimental data; the equation is called Forchheimer equation (Joseph, Nield & Papanicolaou Reference Joseph, Nield and Papanicolaou1982; Whitaker Reference Whitaker1996; Giorgi Reference Giorgi1997; Lage Reference Lage1998). As a result of inertial effects in the pores, the quadratic term appears in this equation. When the flow is no longer governed by Stokes’ equation, the quadratic drag term is due to the convective term, $(u \boldsymbol {\cdot } \boldsymbol {\nabla }) u$, in the Navier–Stokes equations.

Subsequently, Brinkman (Reference Brinkman1947) suggested extending Darcy's law to high-permeability materials by adding a sort of viscous term in Stokes’ equation. The Brinkman model has been studied over the years by different researchers interested in many different applications (see, among others, Neale & Nader Reference Neale and Nader1974; Vafai & Thiyagaraja Reference Vafai and Thiyagaraja1987; Vafai & Kim Reference Vafai and Kim1990; Hahn, Je & Choi Reference Hahn, Je and Choi2002; Mirbod, Andreopoulos & Weinbaum Reference Mirbod, Andreopoulos and Weinbaum2009; Mirbod, Wu & Ahmadi Reference Mirbod, Wu and Ahmadi2017; Wu & Mirbod Reference Wu and Mirbod2018, Reference Wu and Mirbod2019; Haffner & Mirbod Reference Haffner and Mirbod2020; Kang & Mirbod Reference Kang and Mirbod2021; Hooshyar, Yoshikawa & Mirbod Reference Hooshyar, Yoshikawa and Mirbod2022). Importantly, Beavers & Joseph (Reference Beavers and Joseph1967) improved the Darcy equation to introduce interface jump conditions between liquid and porous media. In 1996, Whitaker derived the so-called volume-averaged Navier–Stokes (VANS) equations from the Navier–Stokes equations in a porous media (Whitaker Reference Whitaker1996). The VANS equations contain new terms, including the Darcy term, an average adhesion resistance, and the Forchheimer term, a second-order tensor due to the inertial effects of the resistance function of the geometric structure of the porous medium. It should be noted, however, that defining a model for the fluid-porous interface remains a challenge. In fact, the structure of a porous medium modifies rapidly within the small layer next to the fluid-porous interface, i.e. the so-called Brinkman layer (Neale & Nader Reference Neale and Nader1974); therefore, the Navier–Stokes averaging over a volume containing the interface is not consistent. To properly connect the VANS and Navier–Stokes equations, Ochoa-Tapia & Whitaker (Reference Ochoa-Tapia and Whitaker1995) introduced momentum-transfer conditions, which improved the computation of the transferred stress to both the fluid phase and the porous media. Here, in particular, we employ the Navier–Stokes equation for the free fluid flow and the VANS equations inside the porous media. These equations are connected using the interface jump condition between liquid and porous media as proposed by Ochoa-Tapia & Whitaker (Reference Ochoa-Tapia and Whitaker1995). It is worth noting that over the past 20 years, several groups have also tried to model the interface layer and control the momentum transfer (see e.g. Alazmi & Vafai Reference Alazmi and Vafai2001; Goyeau et al. Reference Goyeau, Lhuillier, Gobin and Velarde2003; Chandesris & Jamet Reference Chandesris and Jamet2006; Valdés-Parada, Goyeau & Ochoa-Tapia Reference Valdés-Parada, Goyeau and Ochoa-Tapia2007).

Both numerical and experimental works have been conducted to study the effect of isotropic and anisotropic porous materials on turbulent flows. Using a continuum approach for porous media, laminar and turbulent flows were investigated by Breugem, Boersma & Uittenbogaard (Reference Breugem, Boersma and Uittenbogaard2004). The authors showed that the permeability of the porous wall depends not only on the porosity but also on the gradient of the volume-averaged velocity inside the porous media. The same group later used direct numerical simulations (DNS) to investigate the turbulent channel flow over three-dimensional (3-D) regular cubes mimicking porous structures (Breugem & Boersma Reference Breugem and Boersma2005). They showed quantitatively that the VANS equations are able to simulate accurately the turbulent flows over and through permeable walls. They also analysed the impact of a packed-bed porous wall on the turbulent channel flow (Breugem, Boersma & Uittenbogaard Reference Breugem, Boersma and Uittenbogaard2006) and found the near-wall structures to be significantly different: streamwise-correlated streaks almost disappear, while the spanwise vorticity near the wall increases for a highly permeable surface. This is consistent with the decrease in the peak value of the streamwise root-mean-square (r.m.s.) velocity normalized by the friction velocity at the permeable wall. Furthermore, they showed that the turbulence near a highly permeable wall is dominated by relatively large vertical structures generated by a Kelvin–Helmholtz instability. Turbulent flows over porous media considering the porous layer as a continuum, without a need for knowledge of the porous media microstructure, have also been examined by Rosti, Cortelezzi & Quadrio (Reference Rosti, Cortelezzi and Quadrio2015) and Rosti, Brandt & Pinelli (Reference Rosti, Brandt and Pinelli2018). These authors also found that permeability plays a critical role and showed that porous materials with high wall-normal and low wall-parallel permeabilities are characterized by increased turbulence isotropy (Rosti et al. Reference Rosti, Brandt and Pinelli2018). In a more recent work, Rosti et al. (Reference Rosti, Pramanik, Brandt and Mitra2020) studied the flow inside a deformable porous medium for the case of a viscous fluid and an incompressible viscoelastic material. It was found that in a poroelastic medium, the flow permeability is a function of the elastic shear modulus of the deformable surface and of the imposed pressure difference, suggesting that the dynamics of the flow over such a complex medium cannot be deduced directly from studies over rigid porous walls.

While most of the previous work discussed above considered isotropic porous media, anisotropic porous layers have been found to be effective for passive control of turbulence (see e.g. Gomez-de Segura, Sharma & García-Mayoral Reference Gomez-de Segura, Sharma and García-Mayoral2017; Rosti et al. Reference Rosti, Brandt and Pinelli2018). Kuwata & Suga (Reference Kuwata and Suga2017) used multiple-relaxation-time lattice Boltzmann DNS to simulate the turbulent flow over a porous layer. Considering anisotropic permeable walls and squared pore arrays aligned with the Cartesian axes, they found that streamwise and spanwise permeabilities considerably enhance the Reynolds stresses over the porous walls when compared to the vertical permeability. The turbulent channel flow over porous layers has also been studied experimentally by Suga et al. (Reference Suga, Matsumura, Ashitaka, Tominaga and Kaneda2010) and Suga, Nakagawa & Kaneda (Reference Suga, Nakagawa and Kaneda2017); the authors showed that the spanwise scales of the measured structures can be reasonably correlated with the wall-normal distance plus the zero-plane displacement, estimated from the mean velocity profile.

1.2. Turbulent suspension flows over impermeable walls

Particle-laden turbulent flows over impermeable walls have been investigated extensively. Many earlier studies considered small heavy particles in the very dilute regime. It has been shown that inertia induces particle preferential sampling and migrations that lead to clustering in both homogeneous and inhomogeneous flows (see, among many, Bec et al. Reference Bec, Biferale, Cencini, Lanotte, Musacchio and Toschi2007; Toschi & Bodenschatz Reference Toschi and Bodenschatz2009; Sardina et al. Reference Sardina, Schlatter, Brandt, Picano and Casciola2012).

Pan & Banerjee (Reference Pan and Banerjee1996) were the first to study the effect of finite-size particles in a turbulent channel flow at very low concentrations and showed that smaller particles decrease turbulence forces and Reynolds stresses, while larger particles increase turbulence intensities and stresses. These findings were in line with the other works that considered the effect of the particles on the spectral energy distribution and the turbulent cascade (Francesco Lucci & Elghobashi Reference Francesco Lucci and Elghobashi2010; Yeo et al. Reference Yeo, Dong, Climent and Maxey2010). The appearance of different numerical algorithms has facilitated an increasing number of studies on finite-size particles in turbulence. Among these, Kidanemariam et al. (Reference Kidanemariam, Chan-Braun, Doychev and Uhlmann2013) examined open channel flow with heavy particles of finite size in the dilute regime, and showed that the solid phase is preferably assembled near the wall in low-speed regions. Later, the same approach was used by these authors to study pattern formation in turbulent channel flow over a mobile sediment bed (Kidanemariam & Uhlmann Reference Kidanemariam and Uhlmann2014). Concerning neutrally buoyant particles in channel flow, Picano, Breugem & Brandt (Reference Picano, Breugem and Brandt2015) studied neutrally buoyant spheres, while Ardekani & Brandt (Reference Ardekani and Brandt2019) considered non-spherical particles, showing a reduced drag. The effect of particles on the critical Reynolds number for turbulence onset in semi-dilute suspension flows was studied in Matas, Morris & Guazzelli (Reference Matas, Morris and Guazzelli2004), Loisel et al. (Reference Loisel, Abbas, Masbernat and Climent2013) and Yu et al. (Reference Yu, Wu, Shao and Lin2013), and the chaotic flow of relatively dense suspensions of neutrally buoyant and heavy particles in channel flows, for a volume fraction of 7 %, was examined in Shao, Wu & Yu (Reference Shao, Wu and Yu2012). Vowinckel, Kempe & Fröhlich (Reference Vowinckel, Kempe and Fröhlich2014) reported on various regimes that differ depending on the particle buoyancy. Recent studies conducted by us have examined both suspensions and solvent, and their related instabilities over and through various porous media models, in Bagheri et al. (Reference Bagheri, Moradi Bilondi, Taheri, Anand, Schatz and Mirbod2022), Haffner et al. (Reference Haffner, Kang, Shapley and Mirbod2019), Mirbod & Shapley (Reference Mirbod and Shapley2022), Bagheri, Kang & Mirbod (Reference Bagheri, Kang and Mirbod2019), Moradi Bilondi et al. (Reference Moradi Bilondi, Mastroianni, Brandt and Mirbod2022) and Kang & Mirbod (Reference Kang and Mirbod2021). However, the impact of different porous media on non-Brownian, non-colloidal, neutrally buoyant, rigid, spherical particles flowing in a channel remains unknown.

Thanks to recent developments in algorithms and computational power, suspension flows with inertia can be studied by interface-resolved DNS, with ten thousand finite-size particles. Using fully resolved DNS and the immersed boundary method (IBM) for neutrally buoyant spheres as conducted here, Lashgari et al. (Reference Lashgari, Picano, Breugem and Brandt2014) reported a transition akin to that found in the pure fluid case at low volume fractions, i.e. from the laminar base state directly to turbulence as the Reynolds number was increased. However, a ‘shear-thickening’ regime (distinct from laminar flow and turbulence) was identified when the volume fraction was sufficiently large, dominated by the particle-induced stresses. Later, Picano et al. (Reference Picano, Breugem and Brandt2015) and Costa et al. (Reference Costa, Picano, Brandt and Breugem2016) observed that under fully turbulent conditions, significant particle-induced stress first appears at lower solid volume fraction ${{\varPhi _b}}$ in a layer close to the wall of size similar to the particle diameter; with increasing ${{\varPhi _b}}$, the wall layer is characterized by large particle-induced stress and found to be responsible for the increased drag. These authors also reported that because of these non-homogeneities in concentration distribution, the increase in the overall drag cannot be explained simply by using the notion of an increased effective suspension viscosity. The study by Ardekani et al. (Reference Ardekani, Costa, Breugem, Picano and Brandt2017) considered non-spherical oblate particles and showed that the drag is reduced, as these particles do not accumulate in the particle layer but remain away from the wall, confirming the importance of the particle dynamics in the near-wall region for the global flow behaviour (Peng, Ayala & Wang Reference Peng, Ayala and Wang2019, for the role of particle rotation, see also). Numerous DNS have also been performed to examine the sediment transport of particle-laden flows over mobile and immobile beds (Herwig, Kempe & Fröhlich Reference Herwig, Kempe and Fröhlich2011; Kempe, Vowinckel & Fröhlich Reference Kempe, Vowinckel and Fröhlich2014; Vowinckel et al. Reference Vowinckel, Kempe and Fröhlich2014, Reference Vowinckel, Nikora, Kempe and Fröhlich2017, Reference Vowinckel, Biegert, Luzzatto-Fegiz and Meiburg2019a,Reference Vowinckel, Withers, Luzzatto-Fegiz and Meiburgb, Reference Vowinckel, Biegert, Meiburg, Aussillous and Guazzelli2021; Biegert, Vowinckel & Meiburg Reference Biegert, Vowinckel and Meiburg2017; Jain, Tschisgale & Fröhlich Reference Jain, Tschisgale and Fröhlich2020, Reference Jain, Tschisgale and Fröhlich2021; Köllner et al. Reference Köllner, Meredith, Nokes and Meiburg2020; Papadopoulos et al. Reference Papadopoulos, Nikora, Vowinckel, Cameron, Jain, Stewart, Gibbins and Fröhlich2020). Few studies, on the other hand, have investigated the particle flow over complex walls. Recently, Rosti, Mirbod & Brandt (Reference Rosti, Mirbod and Brandt2021) have investigated the rheology of particle suspensions flowing over porous walls in a plane Couette flow and in a laminar regime; they found that the porous walls induce a progressive decrease in the suspension effective viscosity as the wall permeability increases. This behaviour was explained by the weakening of the wall-blocking effect and by the appearance of a slip velocity at the interface of the porous medium.

1.3. Outline

This study employs DNS to simulate turbulent suspension flows of monodisperse, rigid, spherical particles over various porous media where particles interact with the porous layer but do not enter into it. The solid volume fraction ${{\varPhi _b}}$ considered varies in the range 00.2. We fully describe the solid phase dynamics via an IBM for the finite-size particles, with a ratio between the radius $a$ and the channel half-width $h$ equal to $1/10$, while solving the VANS equations for flow inside the porous media. The porous layer porosity and thickness are kept constant, while their permeability varies. The organization of the paper is as follows. Section 2 shows mathematical formulations, numerical procedures, system configuration and related parameters. The results and discussions are presented in § 3. Section 4 addresses the summary and conclusion of the study.

2. Methodology

2.1. Governing equations

We study the fully developed flow of monodispersed suspensions of rigid, spherical particles of radius $a$ suspended in a Newtonian fluid in a channel bounded by identical, rigid, homogeneous and isotropic porous media. The incompressible Navier–Stokes equations are used to describe the Eulerian fluid phase:

(2.1)\begin{gather} \boldsymbol{\nabla} \boldsymbol{\cdot} {\boldsymbol u}_f=0, \end{gather}
(2.2)\begin{gather} \frac{\partial {\boldsymbol u}_f}{\partial t}+ {\boldsymbol u}_f \boldsymbol{\cdot} \boldsymbol{\nabla} {\boldsymbol u}_f={-}\frac{1}{\rho}\,\boldsymbol{\nabla} p+\frac{\mu}{\rho}\, {\nabla}^2 {\boldsymbol u}_f+ {\boldsymbol f}. \end{gather}

Here, ${\boldsymbol u}_f$ and $p$ represent the velocity and pressure fields, respectively, and the term ${\boldsymbol f}$ is a generic force field. In addition, the parameters $\mu$ and $\rho$ are the dynamic viscosity and the density of the fluid phase, respectively, and their ratio $\nu = {\mu }/{\rho }$ indicates the kinematic viscosity of the fluid. The centroid linear and angular velocities of neutrally buoyant particles, ${\boldsymbol u}_p$ and ${\boldsymbol \omega }_p$, are governed by the Newton–Euler Lagrangian equations, defined as

(2.3)\begin{gather} \rho_{p} V_{p}\,\frac{{\rm d}{\boldsymbol u}_p}{{\rm d}t}={\oint_{\partial V_p} ({-}p{\boldsymbol I} +\mu (\boldsymbol{\nabla} {\boldsymbol u}_f+\boldsymbol{\nabla} {\boldsymbol u}_f^{\rm T}))\boldsymbol{\cdot} {\boldsymbol n}\,{\rm d}A}+{\boldsymbol F}_p, \end{gather}
(2.4)\begin{gather} I_{p}\,\frac{{\rm d}{\boldsymbol \omega}_p}{{\rm d}t}={\oint_{\partial V_p} {\boldsymbol r}\times ({-}p{\boldsymbol I} +\mu (\boldsymbol{\nabla} {\boldsymbol u}_f+\boldsymbol{\nabla} {\boldsymbol u}_f^{\rm T}))\boldsymbol{\cdot} {\boldsymbol n}\,{\rm d}A}+{\boldsymbol T}_p, \end{gather}

where $\rho _p$ indicates the particle density, and $V_p$ is the particle volume, defined as $4{\rm \pi} a^3/3$. In addition, ${\boldsymbol I}$ is the unit tensor, $I_p=\tfrac {2}{5}\rho _p V_p a^2$ is the moment of inertia, ${\boldsymbol r}$ is the distance vector from the centre of the particle, and ${\boldsymbol n}$ is the unit vector normal to the particle surface $\partial V_p$. The terms ${\boldsymbol F}_p$ and ${\boldsymbol T}_p$ represent the force and torque acting on the particles as a result of the particle–particle and particle–wall interactions. To couple the solid and fluid phases, an IBM is used. This accounts for a body force ${\boldsymbol f}$ added to the right-hand side of (2.2) to mimic the actual no-slip and no-penetration boundary conditions at the moving particle surface (Breugem Reference Breugem2012; Picano et al. Reference Picano, Breugem and Brandt2015; Ardekani et al. Reference Ardekani, Costa, Breugem and Brandt2016):

(2.5)\begin{equation} {\boldsymbol u}_f|_{\partial V_p} = {\boldsymbol u}_p + {\boldsymbol \omega}_p \times {\boldsymbol r}. \end{equation}

We denote the porous layer with the porosity $\varepsilon$ and the permeability with the tensor $K_{ij}$. When the porous medium is isotropic, the permeability reduces to a single scalar value, i.e. $K$. In this study, we employ the VANS equations to describe the fluid motion in the porous medium, as proposed by Whitaker (Reference Whitaker1969, Reference Whitaker1986). For isotropic porous media with negligible fluid inertia and large-scale separation, the VANS equations can be stated as (Kang & Mirbod Reference Kang and Mirbod2019; Rosti et al. Reference Rosti, Mirbod and Brandt2021)

(2.6)\begin{gather} \boldsymbol{\nabla} \boldsymbol{\cdot} \langle {\boldsymbol u}_f \rangle_s =0, \end{gather}
(2.7)\begin{gather} \frac{\partial \langle {\boldsymbol u}_f \rangle_s}{\partial t}={-}\frac{\varepsilon}{\rho}\, \boldsymbol{\nabla} \langle p \rangle_f +\nu\,{\nabla}^2 \langle {\boldsymbol u}_f \rangle_s-\frac{\nu \varepsilon}{K}\,\langle {\boldsymbol u}_f \rangle_s , \end{gather}

Notably, the VANS equations are based on two different averaging methods (see Ochoa-Tapia & Whitaker Reference Ochoa-Tapia and Whitaker1995), namely the superficial volume average $\langle \psi \rangle _s = ({1}/{V})\int _{V_f}\psi \,{\rm d}V_f$, and the intrinsic volume average $\langle \psi \rangle _f = ({1}/{V_f})\int _{V_f}\psi \,{\rm d}V_f$, where the superficial and intrinsic volume averages are linearly related to each other using the condition $\varepsilon$, $\langle \psi \rangle _s = ({V_f}/{V})\langle \psi \rangle _f = \varepsilon \langle \psi \rangle _f$. Here, $V_f$ is the volume occupied by the fluid within the averaging volume $V$. Note that superficial and intrinsic volume averages are employed for the velocity and pressure fields as reported by Quintard & Whitaker (Reference Quintard and Whitaker1994) and Whitaker (Reference Whitaker1996).

In our analysis, we assume pressure and velocity continuity at the suspension-porous interface, while the shear stress displays a jump that can be controlled by the parameter $\tau$ (Ochoa-Tapia & Whitaker Reference Ochoa-Tapia and Whitaker1995; Goyeau et al. Reference Goyeau, Lhuillier, Gobin and Velarde2003; Rosti et al. Reference Rosti, Mirbod and Brandt2021). The value of $\tau$ determines the stress transfer between the suspending fluid and the porous media. Consequently, the boundary conditions at the fluid-porous interface can be written as

(2.8a,b)\begin{gather} {\boldsymbol u}_f = \langle {\boldsymbol u}_f \rangle_s, \quad p = \langle p \rangle_f , \end{gather}
(2.9)\begin{gather} \sigma\left(\frac{\partial u_f}{\partial y}-\frac{1}{\varepsilon}\,\frac{\partial \langle u_f \rangle_s}{\partial y}\right) ={\pm} \tau u_f, \end{gather}
(2.10)\begin{gather} \sigma\left(\frac{\partial w_f}{\partial y}-\frac{1}{\varepsilon}\,\frac{\partial \langle w_f \rangle_s}{\partial y}\right) ={\pm} \tau w_f . \end{gather}

In (2.8a,b), ${\boldsymbol u}_f$ is the fluid flow velocity vector, while ${u_f}$ and ${w_f}$ in (2.9) and (2.10) are the streamwise and spanwise components of the fluid velocity, respectively. In (2.9) and (2.10), on the right-hand side, a positive sign indicates that the pure fluid region is above the porous media, while a negative sign indicates the opposite. The dimensionless parameter $\sigma = {\sqrt {K}}/{h}$ is the so-called Darcy number or the non-dimensional permeability parameter, where $h$ is the half-channel height. The coefficient $\tau$ represents the stress transfer between the suspending fluid and the porous media, and takes varying values (zero, positive or negative) depending on how the porous material's structure varies in the heterogeneous transition layer, and how the interface is fabricated. A detailed comparison of the different boundary conditions can be found in (Alazmi & Vafai Reference Alazmi and Vafai2001). There were also several attempts to calculate $\tau$ theoretically (Goyeau et al. Reference Goyeau, Lhuillier, Gobin and Velarde2003; Deng & Martinez Reference Deng and Martinez2005; Min & Kim Reference Min and Kim2005; Chandesris & Jamet Reference Chandesris and Jamet2006, Reference Chandesris and Jamet2007; Valdés-Parada et al. Reference Valdés-Parada, Goyeau and Ochoa-Tapia2007, Reference Valdés-Parada, Alvarez-Ramírez, Goyeau and Ochoa-Tapia2009; Carotenuto & Minale Reference Carotenuto and Minale2011). Recently, also attempts to measure the jump coefficient were carried out by Carotenuto & Minale (Reference Carotenuto and Minale2011) and by Bagheri & Mirbod (Reference Bagheri and Mirbod2022). In the present study, we assume $\tau =+1$, $0$ and $-1$. Note that $\tau = 0$ implies that the stress carried by the suspending fluid is fully transferred to the fluid flow inside the porous layer. More details can be found in § 3.3.

2.2. Numerical implementation

Our numerical simulations are based on a 3-D solver that adopts an IBM for coupling the fluid and particle phases in the pure Newtonian fluid region, $0 < y < 2h$. The IBM was first developed by Peskin (Reference Peskin1972), who simulated blood flow patterns around heart valves. Since then, it has been widely modified and improved, as reported in Mittal & Iaccarino (Reference Mittal and Iaccarino2005). Among others, Uhlmann (Reference Uhlmann2005) proposed a direct forcing IBM and showed the ability of the method to simulate large-scale configurations with many particles. Here, we use the IBM as first proposed by Breugem (Reference Breugem2012), while the various modifications introduced by this author enabled us to also reach second-order accuracy in space. It is worth noting that the IBM has first-order accuracy in the local velocity field, and may have apparent second-order accuracy in force/torque as reported by Peng & Wang (Reference Peng and Wang2020). Moreover, the particle–particle and particle–wall interaction force and torque in (2.3) and (2.4) include a lubrication correction and a soft collision model as reported in Costa et al. (Reference Costa, Boersma, Westerweel and Breugem2015). In particular, we use Brenner's asymptotic solution (Brenner Reference Brenner1961) to correct the lubrication force when the distance between solid objects is less than a certain threshold and cannot be resolved accurately by the numerical mesh. At such small distances, surface roughness is accounted for by saturating this force. When spherical particles are in contact, both the normal and tangential contact force components are obtained from the overlap and the relative velocity. It is worth noting that in this analysis, we considered that the particles do not enter the porous layer. In other words, the particles approach an impermeable wall at the suspension-porous interface where the above lubrication and collision models can be applied.

The governing differential equations are solved on a staggered grid using a second-order central finite-difference scheme, while the dispersed phase is represented by a set of Lagrangian points that are distributed uniformly on the surface of each particle. The forces were computed at each Lagrangian grid point on the particle surface based on the difference between the computed velocity at the particle surface and the first prediction velocity of the fluid at the same point in space; the first prediction velocity was obtained by time integration of the free-flow equations before imposing the continuity constraint. The forces are extrapolated on the Eulerian grid used for the momentum equations and added to the first prediction velocity, followed by the correction pressure scheme (Breugem Reference Breugem2012). For the time integration, we use the explicit fractional-step method, while all the other terms are advanced with the third-order Runge–Kutta scheme. More details in terms of the numerical procedures for both the IBM and VANS equations and the code validations can be found in Lashgari et al. (Reference Lashgari, Picano, Breugem and Brandt2014), Picano et al. (Reference Picano, Breugem and Brandt2015), Ardekani et al. (Reference Ardekani, Costa, Breugem and Brandt2016), Rosti & Brandt (Reference Rosti and Brandt2017), Izbassarov et al. (Reference Izbassarov, Rosti, Ardekani, Sarabian, Hormozi, Brandt and Tammisola2018) and Rosti et al. (Reference Rosti, Mirbod and Brandt2021).

2.3. System configuration

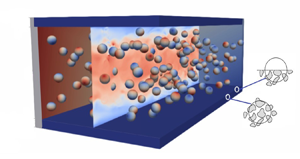
Herein, we investigate turbulent suspensions flowing in a channel between two infinite walls located at $y = -h_p$ and $y = 2h+h_p$. The two porous layers have thickness $h_p$ placed at the top and bottom of the channel, while the suspension-porous interface is located at $y = 0$ and $y = 2h$; see figure 1. Periodic boundary conditions are applied in the wall-parallel directions over a domain of size $L_x = 6h$, $L_y = 2(h + h_p)$ and $L_z = 3h$ in the streamwise, wall-normal and spanwise directions, respectively. A time-dependent pressure gradient acting in the streamwise direction imposes a constant bulk velocity $U_0$ corresponding to a constant bulk Reynolds number $Re = {2hU_0}/{\nu }=5600$. For the simulations presented here, we use 960 grid points in the streamwise direction $x$, $320+32$ grid points in the wall-normal direction $y$ (where 32 is the number of points used for the porous layers), and 480 points in the spanwise direction $z$. The non-dimensional parameters and their values are as follows. The non-dimensional permeability parameter is $\sigma \in [0.63, 6.3] \times 10^{-3}$, while the ratio between the porous and the channel height is $h_p/h=1/10$, and the porosity of the porous layers is constant at 0.6. The ratio of particle diameter to channel height is $a/h=1/10$, and the particle volume fraction ranges from $0$ to $20\,\%$. Table 1 reports all different conditions considered in this study. For the sake of comparison, the simulation parameters are chosen to be similar to those in previous works on single-phase turbulent channel flows over porous walls, and turbulent suspension flows in smooth channels, as reported in Rosti et al. (Reference Rosti, Cortelezzi and Quadrio2015), Picano et al. (Reference Picano, Breugem and Brandt2015) and Rosti & Brandt (Reference Rosti and Brandt2017). All the simulations are started from a fully developed turbulent channel flow. After the flow has reached statistical steady state, the calculations are continued for an interval $480h/U_0$ time units, during which $96$ full flow fields are stored for further statistical analysis. To verify the convergence of the statistics, we have computed them using different numbers of samples, and verified that the differences are negligible.

Figure 1. Sketch of the 3-D channel flow with 50 particles overlying porous media followed by the coordinate system adopted in this study.

Table 1. List of simulations performed. The porosity is fixed at $\varepsilon =0.6$, and the bulk Reynolds number is $Re=5600$, whereas the non-dimensional permeability parameter and the solid volume fraction vary as indicated. The parameter $N_p$ indicates the number of particles at each particle volume fraction.

3. Results

We study the turbulent suspension flow of monodispersed, neutrally buoyant, rigid, spherical particles over porous media in a channel where the particles do not enter inside the porous layers. Figure 2 compares the contours of the normalized streamwise velocity component from instantaneous snapshots for the three different volume fractions under investigation. From the qualitative results shown in the figure, it can already be seen that the suspension flow streamwise velocity is sensitive to the particle volume fraction ${{\varPhi _b}}$. In particular, the turbulence activities are greatly enhanced throughout the channel due to the disturbances from the particles inside the channel. As the particle volume fraction increases, the streamwise velocity increases at the centre of the channel; however, the velocity intensity decreases near the interface, suggesting that the slip velocity decreases when increasing the number of particles in the flow. Visualizations of the normalized streamwise velocity are shown in figure 3 for three different wall non-dimensional permeability parameters $\sigma$. The wall permeability also has a critical impact on the turbulence suspension flows. By increasing the wall permeability, the turbulence activity is greatly enhanced throughout the channel. Clearly, as the wall permeability increases, the streamwise velocity intensity increases near the interface, which suggests that the slip velocity increases by increasing the wall-normal velocity at the interface.

Figure 2. Contours of the instantaneous turbulent streamwise velocity $u$ in the $x$$y$ plane for a fixed wall non-dimensional permeability parameter $\sigma = 0.63 \times 10^{-3}$ and three different particle volume fractions: (a) ${{\varPhi _b}} = 0.05$, (b) ${{\varPhi _b}}=0.1$, and (c) ${{\varPhi _b}}= 0.2$.

Figure 3. Contours of the instantaneous turbulent streamwise velocity $u$ in the $x$$y$ plane for a fixed particle volume fraction ${{\varPhi _b}} = 0.10$ and three different wall non-dimensional permeability parameters: (a) $\sigma = 0.63 \times 10^{-3}$, (b) $\sigma = 2 \times 10^{-3}$, and (c) $\sigma = 6.3 \times 10^{-3}$.

3.1. Flow statistics

We start our quantitative analysis of the different suspension flows with the normalized pressure drop needed to drive the suspensions at a constant suspension flow rate. Figure 4 shows the friction Reynolds number $Re_{\tau }$ for all cases considered in this study as a function of both the wall non-dimensional permeability parameter $\sigma$ and the volume fraction ${{\varPhi _b}}$. The friction Reynolds number is based on the fluid viscosity that can be defined as $Re_\tau = u_\tau h / \nu$, where $u_\tau = \sqrt {\tau _{interface} / \rho }$ is the friction velocity, and $\tau _{interface}$ is the total mean shear stress at the interface. The total mean shear stress at the interface is the sum of the viscous shear stress, the Reynolds shear stress and the particle contribution (see § 3.2 for more details). In the absence of particles, i.e. ${{\varPhi _b}} = 0$, $Re_{\tau }$ increases with the wall permeability, as was also observed in previous studies, e.g. Rosti et al. (Reference Rosti, Cortelezzi and Quadrio2015). Although some works (Hahn et al. Reference Hahn, Je and Choi2002; Itoh et al. Reference Itoh, Tamano, Iguchi, Yokota, Akino, Hino and Kubo2006) showed that a surface with preferential streamwise permeability might have a drag-reducing effect, permeable surfaces have generally been reported to increase the turbulent drag (Jimenez et al. Reference Jimenez, Uhlmann, Pinelli and Kawahara2001; Breugem et al. Reference Breugem, Boersma and Uittenbogaard2006; Rosti et al. Reference Rosti, Cortelezzi and Quadrio2015; Kuwata & Suga Reference Kuwata and Suga2016). Our results are then consistent with previous works, observing a rise in turbulent drag compared to a smooth wall. Note that the skin-friction coefficient of a pure fluid flow on porous walls was first studied by Ruff & Gelhar (Reference Ruff and Gelhar1972), who showed experimentally that the skin-friction coefficient is higher than that of impermeable walls. Later, several researchers (Kong & Schetz Reference Kong and Schetz1982; Zippe & Graf Reference Zippe and Graf1983) measured the increase in the skin-friction coefficient over the porous layers and compared the results with the case of impermeable walls. These authors showed that the presence of a permeable wall reduces the turbulence intensity, Reynolds shear stress, pressure and vorticity fluctuations throughout the channel except very near the wall. The results in figure 4 also reveal that adding particles to the flow leads to a further increase in the friction Reynolds number $Re_{\tau }$. It is worth noting that the increase in drag has been associated with the appearance of Kelvin–Helmholtz-like rollers over the surface that increase both momentum transfer and the Reynolds stresses near the interface, as shown in figure 5 and reported in Jimenez et al. (Reference Jimenez, Uhlmann, Pinelli and Kawahara2001), Breugem et al. (Reference Breugem, Boersma and Uittenbogaard2006), Rosti et al. (Reference Rosti, Cortelezzi and Quadrio2015) and Kuwata & Suga (Reference Kuwata and Suga2016). This figure shows snapshots of the fluctuating streamwise velocity at the free-flow porous interface for the cases of a pure solvent and flow with ${{\varPhi _b}}=0.1$ at fixed $\sigma = 0.63 \times 10^{-3}$. The high- and low-velocity regions represent the footprints of the streaky pattern of the flow over the porous layer, shown in figure 5(a), that are similar to those observed over smooth walls. A Kelvin–Helmholtz-like pattern is indicated by these streaky patterns, which are wider and have coherence structures when pure solvent is present. When particles are added to the flow, the coherent structures appear shredded over the porous layer, while the longitudinal streamwise vortices become more twisted. The Kelvin–Helmholtz-like rollers have also been analysed for the solvent flowing over both isotropic and anisotropic porous media in Rosti et al. (Reference Rosti, Brandt and Pinelli2018). These structures can be further detected and analysed from the two-point correlation functions, as has been studied by others (Jimenez et al. Reference Jimenez, Uhlmann, Pinelli and Kawahara2001; Kuwata & Suga Reference Kuwata and Suga2016), which is the subject of our future investigations.

Figure 4. Friction Reynolds number $Re_{\tau }$ as a function of (a) wall non-dimensional permeability parameter $\sigma$, for different values of the particle volume fraction ${{\varPhi _b}}$, and (b) the particle volume fraction ${{\varPhi _b}}$ for different values of wall non-dimensional permeability parameter $\sigma$.

Figure 5. Instantaneous streamwise velocity fluctuation contours in the $x$$z$ plane at the interface $y = 0$ (flow going from bottom to top): (a) for solvent ${{\varPhi _b}}=0.0$, and (b) for suspension with the particle volume fraction ${{\varPhi _b}}=0.1$ at a fixed wall non-dimensional permeability parameter $\sigma = 0.63\times 10^{-3}$.

Figure 6 shows the mean streamwise fluid velocity profiles for different particle volume fractions ${{\varPhi _b}}$ and the non-dimensional permeability parameter $\sigma = 0.63\times 10^{-3}$, the lowest considered in this study. Here, we observe that while the mean fluid velocity is blunted in the pure turbulent flow, it increases at the channel centreline when increasing the volume fraction, leading to a more laminar-like flow. In contrast, near the wall, the fluid velocity decreases by increasing the particle volume fraction ${{\varPhi _b}}$; this effect is more pronounced for highly viscous suspension flows, as shown in Rosti et al. (Reference Rosti, Mirbod and Brandt2021). Increasing the volume fraction does not modify the velocity inside the porous layer, i.e. for $y < 0$. This is because the wall permeability is very low and constant in this case, and the particles are not moving inside the flow either; therefore, any disturbances produced by the particles vanish rapidly inside the porous layer. On the other hand, as expected and can be observed in figure 7 for a fixed particle volume fraction ${{\varPhi _b}} = 0.10$, by increasing the non-dimensional permeability parameter, the velocity inside the porous layer increases. In this case, for high wall permeability, the fluid moves easily inside the porous layer. Larger values of $\sigma$ also result in higher slip velocity at the suspension-porous interface (the velocity at $y = 0$). This increase in the slip velocity when increasing the wall non-dimensional permeability parameter from $\sigma = 0.63\times 10^{-3}$ to $\sigma = 6.3\times 10^{-3}$ (see figure 7) implies that the local shear rate decreases with $\sigma$. Nevertheless, it appears that the parameter $\sigma$ does not significantly affect the maximum velocity in the centre of the channel and, in general, the velocity profile in the fluid region, $0< y/h<1$. Similar observations can be made by examining the data for the other volume fractions.

Figure 6. Mean fluid streamwise velocity component $u_f$ normalized by the bulk velocity $U_0$ as a function of the wall-normal distance $y$ for various particle volume fractions ${{\varPhi _b}}$ at a fixed wall non-dimensional permeability parameter $\sigma = 0.63\times 10^{-3}$.

Figure 7. Mean fluid streamwise velocity component $u_f$ normalized by the bulk velocity $U_0$ as a function of the wall-normal distance $y$ for different values of the wall non-dimensional permeability parameter $\sigma$ at a fixed particle volume fraction ${{\varPhi _b}} = 0.10$.

Both the presence of particles in the flow and the existence of the porous layers alter the velocity fluctuations in the bulk as well as at the wall. The r.m.s. values of the three fluid velocity fluctuations, normalized by the bulk velocity, are displayed in figure 8 for the wall non-dimensional permeability parameter $\sigma = 0.63\times 10^{-3}$ and the different values of the particle volume fraction ${{\varPhi _b}}$. We note that a reduction in the fluid streamwise velocity fluctuations occurs with increasing volume fraction to ${{\varPhi _b}} = 0.20$. On the other hand, the intensity of the cross-stream velocity fluctuations increases by adding particles in suspensions up to ${{\varPhi _b}}=0.1$, indicating that the presence of particles creates a more isotropic flow, and then decreases at the largest ${{\varPhi _b}}$ considered, in agreement with the results for the flow over a rigid wall reported by Lashgari et al. (Reference Lashgari, Picano, Breugem and Brandt2014) and Picano et al. (Reference Picano, Breugem and Brandt2015) for smaller particles. Moreover, in the presence of particles, the Reynolds shear stress increases consistently up to ${{\varPhi _b}}=0.10$, as shown in figure 8(d). Upon further increasing the particle volume fraction to ${{\varPhi _b}} = 0.20$, the Reynolds shear stress decreases, confirming a reduction in turbulent activity as shown in Picano et al. (Reference Picano, Breugem and Brandt2015) for the case of a solid wall. This reduction, however, is not associated with a decreased drag because the larger particle stresses at higher ${{\varPhi _b}}$ more than compensate for the lower turbulence levels. The results pertaining to the flow over a porous wall confirm this picture, with some differences, as will be discussed further below.

Figure 8. Intensity of the fluid fluctuation velocity components normalized by $U_0$ and the Reynolds shear stress for different particle volume fractions and non-dimensional permeability parameter $\sigma = 0.63\times 10^{-3}$: (a) streamwise $u_{rms}$ velocity fluctuations, (b) wall-normal $v_{rms}$ velocity fluctuations, (c) spanwise $w_{rms}$ velocity fluctuations, and (d) shear stress $(uv)'$.

The variation of the r.m.s. values of the fluid velocity fluctuations with the wall non-dimensional permeability parameter $\sigma$ is depicted in figure 9 for the flows at particle volume fraction ${{\varPhi _b}} = 0.10$. The magnitude of the r.m.s. values of all the fluid velocity fluctuations increases with the wall permeability, consistent with previous studies for single-phase flows (Breugem et al. Reference Breugem, Boersma and Uittenbogaard2006; Rosti et al. Reference Rosti, Cortelezzi and Quadrio2015) where the increase in the streamwise velocity component is larger than that of the wall-normal and spanwise velocity fluctuations. In the boundary layer above the permeable wall, a sharp increase in the r.m.s. velocities is observed when compared to the layer below the permeable wall, as also seen for the spanwise and wall-normal wall fluctuations. This can be attributed to the strengthening of the viscous effects near a permeable wall (Perot & Moin Reference Perot and Moin1995). Note that due to the fact that the r.m.s. values of true local velocities inside the permeable walls are negligible, we can assume that the turbulent flow in the channel is not affected significantly either by the thickness of the porous layer or by the distance to the solid wall.

Figure 9. Intensity of the fluid fluctuation velocity components normalized by $U_0$ and the Reynolds shear stress for ${{\varPhi _b}} = 0.10$ and different values of the wall non-dimensional permeability parameter: (a) streamwise $u_{rms}$ velocity fluctuations, (b) wall-normal $v_{rms}$ velocity fluctuations, (c) spanwise $w_{rms}$ velocity fluctuations, and (d) shear stress $(uv)'$.

The results suggest that the particle dynamics is indeed modified by the wall permeability and, in turn, the particle motion modifies the flow. Figure 9(d) shows the profiles of the Reynolds stresses for different values of the wall non-dimensional permeability parameter $\sigma$, normalized by the bulk velocity, $U_0^{2}$. The maximum shear stress occurs near the interface with the permeable wall. The data also show that the Reynolds shear stress increases with the wall permeability. This confirms that for the higher wall permeability, the weakening of the wall-blocking effect causes a strong increase in the Reynolds shear stress, as reported by Breugem et al. (Reference Breugem, Boersma and Uittenbogaard2006). In other words, fluid with high streamwise momentum may penetrate inside the porous surface, while to satisfy the conservation of mass, the fluid with relatively low streamwise momentum is transported from the porous region into the channel.

The slip velocity $u_s$ at the interface $y=0$, normalized by the bulk fluid velocity, is shown in figure 10(a) for different values of the wall non-dimensional permeability parameter and the particle volume fraction. As expected, by increasing the non-dimensional permeability parameter $\sigma$, the slip velocity increases, while with increasing particle volume fraction, it decreases for all cases studied here. Interestingly, for ${{\varPhi _b}} \le 0.10$, the slip velocity is weakly dependent on the volume fraction, and it is determined mainly by the permeability under dilute conditions. Indeed, a more significant variation in the $u_s$ values is observed when further increasing the dispersed phase concentration to 0.2. These results confirm that the suspension slip velocity in turbulent flows depends on the porous permeability, and when the porous non-dimensional permeability parameter is low, i.e. of the order of $\sigma ={O}(10^{-4})$, the slip velocity depends mainly on the suspension concentration.

Figure 10. (a) Normalized interface slip velocity as a function of the wall non-dimensional permeability parameter $\sigma$ for the different particle volume fractions under investigation. (b) Normalized interface wall-normal fluctuation velocity as a function of the wall non-dimensional permeability parameter $\sigma$ for different particle volume fractions.

We then characterized the normalized wall-normal velocity fluctuations at the interface for different values of the wall non-dimensional permeability parameter $\sigma$ and the particle volume fraction ${{\varPhi _b}}$, as shown in figure 10(b). The wall-normal velocity fluctuations increase with both the particle volume fraction and the wall permeability, from zero for small wall permeability to the largest value for the highest ${{\varPhi _b}}$. Note that the velocity fluctuations at the suspension-porous interface do not change significantly with the values of $\sigma$ investigated; instead, the effect of the particle volume fraction is more pronounced with a more significant increase for ${{\varPhi _b}}=0.2$. Comparing figures 10(a,b), one can conclude that the mean slip at the wall is determined mainly by the wall permeability, while the velocity fluctuations are significantly influenced by the particle dynamics in the free-flow region.

To understand further how turbulent structures are modified by the presence of both porous media and particles, we examine some basic features of turbulent coherent structures. As shown in Rosti & Brandt (Reference Rosti and Brandt2020), the turbulent fluctuations are generally reduced and the flow is very anisotropic in the case of drag reduction. On the other hand, the presence of particles causes the opposite effect, i.e. more isotropic structures. Here, in particular, we study the effect of wall permeability on the distribution of the wall-normal and streamwise fluctuation velocity. Figure 11 shows the joint probability distribution functions (p.d.f.s) of the wall-normal and streamwise fluctuation velocity at the interface of the porous layer and suspensions between the centre of the channel and the interface, and also at the centreline of the channel for the flows at particle volume fraction ${{\varPhi _b}} = 0.10$ and the three wall non-dimensional permeability parameters under consideration. The ejection and sweep events are disrupted by increasing the wall permeability, leading to a decrease in the streamwise velocity fluctuations $u'$ and an increase of the wall-normal component $v'$. These results show that permeability creates a more isotropic flow; this has been associated with drag increase, as reported in several previous studies, e.g. Breugem et al. (Reference Breugem, Boersma and Uittenbogaard2006). Note also that the differences are minor in the channel centreline. Similarly, figure 12 shows the joint p.d.f.s of the wall-normal and streamwise fluctuation velocity at the suspension flow-porous interface, between the centre of the channel and the interface, and at the centreline of the channel, for the flows at wall non-dimensional permeability parameter $\sigma = 0.63 \times 10^{-3}$ for different particle volume fractions. As observed, the presence of particles induces a disruption of the structures in the near-wall region, resulting in a decrease in $u'$ and an increase in $v'$, leading to an overall more isotropic state. In other words, both wall permeability and the presence of dispersed particles induce a more isotropic flow. However, as discussed above, the increase in wall permeability also leads to an increase in the turbulent Reynolds stresses, while the more isotropic turbulence due to the presence of the particles is associated with less correlated motions, i.e. lower Reynolds stresses (cf. figures 8d and 9d).

Figure 11. Normalized probability distribution functions (p.d.f.s) of the streamwise fluctuation velocity $u'$ and wall-normal fluctuation velocity $v'$ for a fixed particle volume fraction ${{\varPhi _b}} = 0.10$ and various non-dimensional permeability parameters: (ac) $\sigma = 0.63\times 10^{-3}$, (df) $\sigma = 2.0\times 10^{-3}$, and (gi) $\sigma = 6.3\times 10^{-3}$. (a,d,g) At the flow-porous interface, (b,e,h) between the centre of the channel and the interface, and (cf,i) at the centreline of the channel.

Figure 12. Normalized probability distribution functions (p.d.f.s) of the streamwise fluctuation velocity $u'$ and wall-normal fluctuation velocity $v'$ at the interface for a fixed wall non-dimensional permeability parameter $\sigma = 0.63\times 10^{-3}$ and various particle volume fractions: (ac) ${{\varPhi _b}} = 0.05$, (df) ${{\varPhi _b}} = 0.10$, and (gi) ${{\varPhi _b}} = 0.20$. (a,d,g) At the flow-porous interface, (b,e,h) between the centre of the channel and the interface, and (cf,i) at the centreline of the channel.

3.2. Particle dynamics and stress budget

In this subsection, we investigate the particle dynamics in turbulent channel flow in the presence of porous walls. In the case of spherical particles, the formation of a particle wall layer and the rotation rate close to the wall are shown to have a significant impact on the turbulent global drag (Costa et al. Reference Costa, Picano, Brandt and Breugem2016, Reference Costa, Picano, Brandt and Breugem2018; Peng et al. Reference Peng, Ayala and Wang2019). Indeed, in the presence of an elastic wall, particles are shown to migrate away from the wall, which significantly reduces the overall pressure drop (Ardekani, Rosti & Brandt Reference Ardekani, Rosti and Brandt2019). Figure 13(a) shows the mean local volume fraction $\phi$ for the case of wall non-dimensional permeability parameter $\sigma = 0.63\times 10^{-3}$ and the three nominal volume fractions ${{\varPhi _b}}$ investigated, while figures 13(b,c) display how the particle distribution changes with the permeability for two different values of the particle volume fraction. Note that the oscillations in figures 13(b,c) can be attributed to particle layering close to the interface, and as the particle diameter is 0.2, these oscillations occur at one, two or three times the particle diameter.

Figure 13. Average particle concentration $\phi$ as a function of the wall-normal distance $y$ for: (a) different particle volume fractions at fixed non-dimensional permeability parameter $\sigma = 0.63\times 10^{-3}$; (b,c) various wall non-dimensional permeability parameters $\sigma$ at fixed particle volume fractions ${{\varPhi _b}} = 0.10$ and $0.20$.

Overall, we note the formation of a first local maximum close to the interface, associated with the particle-wall layers in the free-flow region. As also observed in highly dense suspensions in laminar flows (Yeo & Maxey Reference Yeo and Maxey2010), the intensity of the particle wall layer increases as the particle volume fraction increases (see figure 13a). Its formation is explained by the solid lubrication interactions when a particle reaches the wall, which stabilizes the near-wall particle position; once close to the wall, the motion of finite-size particles is influenced mainly by collisions with other particles. Consequently, it is difficult for particles belonging to the first layer to escape.

In the presence of a permeable wall, we note weak migrations of particles away from the wall and a less pronounced wall layer for ${{\varPhi _b}}=0.05$ and 0.10, with the peak value close to the wall found to decrease with the permeability, consistent with the observation of increased wall-normal fluctuations (Ardekani et al. Reference Ardekani, Rosti and Brandt2019, for the case of suspension flows over elastic walls, see also). Note that these near-wall maxima are of the order of the bulk concentrations and are not related to the turbophoretic drift observed in dilute suspensions of heavy particles (Reeks Reference Reeks1983). The same trend observed here was reported in Rosti et al. (Reference Rosti, Mirbod and Brandt2021) for laminar Couette flow of suspensions over a porous substrate. Finally, we also see an increase in the local volume fraction $\phi$ towards the channel centreline for the largest volume fraction examined, ${{\varPhi _b}}=0.20$. This migration toward the channel core was observed experimentally in turbulent flows over solid walls and related to inertial effects in Zade et al. (Reference Zade, Costa, Fornari, Lundell and Brandt2018). The accumulation towards the centreline was also associated with quenching of the turbulence fluctuations and reduced mixing (Ardekani et al. Reference Ardekani, Al Asmar, Picano and Brandt2018; Yousefi et al. Reference Yousefi, Ardekani, Picano and Brandt2021).

To examine further the global suspension behaviour, we look at the streamwise momentum budget. The total momentum budget in the free-flow region (i.e. $0 < y < 2h$) can be written as the sum of the viscous stress, the Reynolds stress, and the particle contribution (Picano et al. Reference Picano, Breugem and Brandt2015, for more details and derivations, see) as

(3.1)\begin{equation} \tau = \tau^{visc} + \tau^{reyn} + \tau^{part}. \end{equation}

Here, $\tau$ is the mean total shear stress balancing the imposed pressure gradient, $\tau ^{visc} = \mu ({{\rm d}u}/{{\rm d} y})$ is the viscous shear stress, $\tau ^{reyn} = -\rho (uv)'$ is the Reynolds shear stress associated with the fluid and particle velocity correlation, and $\tau ^{part}$ is the particle contribution, including particle collisions, which was found by subtracting the other two components from the total shear stress.

The different contributions to the total shear stress in the turbulent suspension flows are displayed for the different particle volume fractions and wall non-dimensional permeability parameter $\sigma = 0.63\times 10^{-3}$ in figure 14(a), and for $\sigma = 6.3\times 10^{-3}$ in figure 14(b). Overall, we note that the relative viscous stress varies weakly with both the volume fraction and the wall permeability, whereas the percentage contribution of turbulence decreases with ${{\varPhi _b}}$. Although the level of fluctuations increases up to ${{\varPhi _b}}=0.1$, the turbulent stress decreases because these chaotic motions are less correlated. The contribution associated with the particle stresses increases with ${{\varPhi _b}}$, differently for different permeabilities. In particular, we see a significant increase when increasing from 0.05 to 0.1 at the lowest permeability, and the most significant growth at ${{\varPhi _b}}=0.2$ at the highest permeability studied. This suggests that the weakening of the particle wall layer is responsible for the reduced turbulent transport at low values of ${{\varPhi _b}}$, which is more significant at lower values of the wall permeability. On the other hand, the particle accumulation towards the channel core by inertial collisions is responsible for the reduction of the turbulence activity at ${{\varPhi _b}}=0.2$, an effect more weakly dependent on the wall permeability; cf. figures 14(a,b). To summarize, the main contribution to the total shear stress is the particle stress at high concentrations, while the Reynolds stress contribution is higher for lower concentrations. The viscous shear stress remains constant for all the volume fractions and the different wall permeabilities considered here. The values of viscous stress are small compared to the two other components because of the turbulent flow considered here, despite the moderate Reynolds number. Focusing on the effect of permeability, the particle-stress contribution decreases with increasing wall non-dimensional permeability parameter $\sigma$, whereas the Reynolds stress shows the opposite behaviour, i.e. it decreases with the volume fraction ${{\varPhi _b}}$ and increases with the wall non-dimensional permeability parameter $\sigma$ because of the increase in fluctuations at the interface.

Figure 14. Histograms showing the different components of the mean shear stress balance as a function of the particle volume fraction ${{\varPhi _b}}$ for (a) $\sigma = 0.63\times 10^{-3}$, and (b) $\sigma = 6.3\times 10^{-3}$. Blue, red and yellow show the viscous stress, Reynolds shear stress, and particle contributions, respectively.

Figure 15 displays the spanwise component of the mean particle angular velocity for different particle volume fractions as a function of the wall permeability, where the values are averages over all the particles close to the interface, i.e. $y/h=0.05$. It can be revealed that the particle-averaged angular velocity decreases by increasing the wall non-dimensional permeability parameter $\sigma$. As expected, this is because the near-wall shear decreases with permeability, as discussed above. In addition, we note that the spanwise component of the mean particle angular velocity decreases with the particle volume fraction ${{\varPhi _b}}$, as observed in previous studies (Ardekani & Brandt Reference Ardekani and Brandt2019). However, this effect is small in comparison with the variations induced by the wall permeability. In brief, with increasing wall permeability, the particle rotation decays; consequently, this causes a reduction in particle-induced interactions. The inset of figure 15 plots the ratio of particle angular velocity with respect to the fluid shear rate as a function of bulk particle volume fraction ${{\varPhi _b}}$ for various permeability parameter $\sigma$. Interestingly, the data in the main plot of figure 15 for both ${{\varPhi _b}} = 0.05$ and $0.1$ are now collapsed onto a curve $\omega _z/[{({\rm d}u/{{\rm d} y})}_{interface}] = 0.03346 - 4.419\sigma + 313.3{\sigma }^2$ that has been determined from a polynomial data fit. There is, however, a higher ratio for ${{\varPhi _b}}=0.2$. At ${{\varPhi _b}}=0.2$, the fluid shear rate is lower, as shown in figure 6, and the induced particle velocity and angular velocity are both affected by particles gathered at the interface.

Figure 15. Spanwise component of the near-wall particle angular velocity as a function of the wall non-dimensional permeability parameter $\sigma$ for different volume fractions ${{\varPhi _b}} = 0.05$, $0.10$ and $0.20$.

Figure 16(a) shows the mean streamwise particle velocity profiles for different volume fractions ${{\varPhi _b}}$ at a fixed wall non-dimensional permeability parameter $\sigma = 0.63\times 10^{-3}$, while figure 16(b) displays the particle velocity profile for different wall non-dimensional permeability parameters and a fixed particle volume fraction ${{\varPhi _b}} = 0.10$. Comparing the mean particle velocity profiles (lines) with the mean fluid velocity values (symbols) indicates that the mean particle velocity and mean fluid velocity profiles are comparable inside the free-flow region, except near the porous wall where the mean particle velocity is larger than the mean local fluid velocity. Although the fluid velocity at the interface is almost zero, the particle velocity differs due to the lack of the no-slip condition, resulting in a greater particle velocity than the fluid velocity.

Figure 16. Mean particle streamwise velocity component $u_p$ normalized by the bulk velocity $U_0$ as a function of the wall-normal coordinate $y$ (lines): (a) for various particle volume fractions ${{\varPhi _b}}$ at a fixed wall non-dimensional permeability parameter $\sigma = 0.63\times 10^{-3}$; and (b) for various wall non-dimensional permeability parameters $\sigma$ at a fixed particle volume fraction ${{\varPhi _b}} = 0.10$. The symbols represent the mean fluid velocity profiles.

3.3. Effect of the momentum transfer coefficient $\tau$

We now investigate the modification induced on the turbulence statistics by varying the coefficient $\tau$, which is used for the momentum transfer conditions at the flow-porous interface. This coefficient can be related to the unknown structure of the suspending fluid-porous interface. As mentioned above, the value of $\tau$ determines the stress transfer between the suspending fluid and the porous media. This was first introduced by Ochoa-Tapia & Whitaker (Reference Ochoa-Tapia and Whitaker1995) as an additional boundary condition at the interface; it is order one and can be positive or negative. It was characterized further by Ochoa-Tapia & Whitaker (Reference Ochoa-Tapia and Whitaker1995), Valdés-Parada et al. (Reference Valdés-Parada, Goyeau and Ochoa-Tapia2007, Reference Valdés-Parada, Aguilar-Madera, Ochoa-Tapia and Goyeau2013), Minale (Reference Minale2014a,Reference Minaleb) and Chen, Wang & Yang (Reference Chen, Wang and Yang2016). In particular, Minale (Reference Minale2014a,Reference Minaleb) showed that a negative $\tau$ quantifies the amount of stress transferred from the free fluid to the porous matrix, while a positive $\tau$ quantifies the amount of stress transferred from the porous matrix to the free fluid, whereas $\tau = 0$ represents the case in which the stress carried by the free fluid is fully transferred to the fluid saturating the porous matrix. Here, we consider the flow of a pure fluid, ${{\varPhi _b}} = 0$, and a dense suspension, ${{\varPhi _b}} = 0.20$, for comparison; we expect that the turbulence statistics for other volume fractions fall within these two cases. The porous layer non-dimensional permeability parameter is fixed at $\sigma = 0.63\times 10^{-3}$, and the porosity is $\varepsilon = 0.6$, again with Reynolds number $Re = 5600$. We compare data from three values of $\tau$, i.e. $-1$, $0$ and $1$, chosen because the momentum transfer coefficient $\tau$ falls in this range for most of the porous media. Note that the case $\tau = 0$, as reported in the previous subsections, is used as the reference case.

Figure 17(a) shows the friction Reynolds number $Re_{\tau }$, where we observe a significant drag increase for a non-zero momentum transfer coefficient $\tau$. Note that $Re_{\tau }$ is calculated using the mean pressure gradient needed to keep $U_0$ constant. Decreasing the slip velocity and particle rotation causes a decrease in the particle concentration near the interface, as shown in figure 17(b), where we note that the particle wall layer is significantly less pronounced when there is a net stress transferred from the porous matrix to the free fluid ($\tau \ne 0$). The data in the figure also show that for non-zero values of $\tau$, the local maximum of the particle distribution near the channel centreline increases considerably.

Figure 17. (a) Friction Reynolds number $Re_{\tau }$ as a function of $\tau$, for different particle volume fractions ${{\varPhi _b}}=0$ and 0.2. (b) Average particle concentration $\phi$ as a function of the wall-normal distance $y$ for different $\tau$ at a fixed non-dimensional permeability parameter $\sigma = 0.63 \times 10^{-3}$.

Figure 18 shows the mean velocity profiles for the three momentum transfer coefficients considered. Figure 18(a) shows the velocity profile pertaining to the single-phase flow over porous media, ${{\varPhi _b}} = 0$, whereas figure 18(b) reports the data for ${{\varPhi _b}} = 0.20$. The dashed line represents the case with positive $\tau$, the dash-dot-dotted line shows the case with negative $\tau$, and the solid line shows our reference case where the momentum transfer coefficient is $\tau = 0$. The effects of the momentum transfer coefficient $\tau$ on the mean velocity profile are clear, especially at the suspension-porous interface: a non-zero value of $\tau$ induces a significant decrease in the velocity at the suspension-porous interface for both the highly dense case (${{\varPhi _b}} =0.20$) and the single-phase case (${{\varPhi _b}} =0$), while a different behaviour is observed at the centreline for the two cases. For the pure fluid ${{\varPhi _b}} =0$, the non-zero $\tau$ induces an increase in the velocity at the centreline. However, for the highly-dense case, a velocity decrease can be observed at the centreline for the non-zero values of the momentum transfer coefficient. The results for the pure fluid flow over the porous layer are in agreement with previous works (Tilton & Cortelezzi Reference Tilton and Cortelezzi2008; Rosti et al. Reference Rosti, Cortelezzi and Quadrio2015).

Figure 18. Mean fluid streamwise velocity component $u_f$ normalized by the bulk velocity $U_0$ as a function of the wall-normal distance $y$ for different values of momentum transfer coefficient $\tau$ and wall non-dimensional permeability parameter $\sigma = 0.63 \times 10^{-3}$: (a) pure fluid (${{\varPhi _b}} = 0$), (b) ${{\varPhi _b}} = 0.20$.

The normalized slip velocities for different cases studied here are shown in figure 19(a). This figure shows that the slip velocities for non-zero momentum transfer coefficient $\tau$ are much smaller than for the case $\tau =0$ in both single-phase flow, i.e. ${{\varPhi _b}} = 0$, and ${{\varPhi _b}} = 0.20$. Note also that even for larger permeabilities, previous works observed the same trend for the slip velocity for both positive and negative $\tau$; see, for example, the results for a single-phase flow over porous media in Rosti et al. (Reference Rosti, Cortelezzi and Quadrio2015). Figure 19(b) displays the normalized spanwise component of the mean particle angular velocity for the different momentum transfer coefficients $\tau$ under consideration. Note that the values have been averaged over all particles close to the interface. These data reveal that the particle average angular velocity decreases significantly for values of the momentum transfer coefficient $\tau$ different from zero, consistent with the trend exhibited by the slip velocity.

Figure 19. (a) Normalized interface slip velocity as a function of $\tau$ for different particle volume fractions under investigation at wall non-dimensional permeability parameter $\sigma = 0.63 \times 10^{-3}$. (b) Normalized spanwise component of the particle angular velocity as a function of $\tau$ for particle volume fractions ${{\varPhi _b}} = 0.20$.

The variations in the r.m.s. values of the fluid velocity fluctuations with the momentum transfer coefficient $\tau$ are depicted in figure 20 for the flows at particle volume fraction ${{\varPhi _b}} = 0.20$. The magnitude of the r.m.s. values of the streamwise fluid velocity fluctuations decreases for non-zero $\tau$. The same can be seen for the wall-normal and spanwise velocity fluctuations, although the reduction appears to be less pronounced and more evident outside the viscous wall layer. The results therefore confirm the reduction in turbulent transport observed from the momentum budget shown in figure 21.

Figure 20. Intensity of the fluid fluctuation velocity components normalized by $U_0$ and the Reynolds shear stress for different $\tau$ and a fixed particle volume fraction ${{\varPhi _b}} = 0.20$ and non-dimensional permeability parameter $\sigma = 0.63\times 10^{-3}$: (a) streamwise $u_{rms}$ velocity fluctuation; (b) wall-normal $v_{rms}$ velocity fluctuation; (c) spanwise $w_{rms}$ velocity fluctuation; and (d) shear stress $(uv)'$.

Figure 21. Histograms showing the different components of the mean shear stress balance as a function of $\tau$ for (a) ${{\varPhi _b}} = 0.0$ and (b) ${{\varPhi _b}} = 0.20$. Blue, red and yellow show the viscous stress, Reynolds shear stress and particle contributions, respectively.

To better understand the modifications on the dynamics and on the overall drag induced by a different stress condition at the wall, we also performed the momentum budget analysis; see (3.1) and relative discussion. The results of this analysis are displayed in figure 21. For the pure fluid, ${{\varPhi _b}} = 0$, by changing the momentum transfer coefficient from zero to ${-1}$ and $1$, $\tau ^{visc}$ increases and $\tau ^{reyn}$ decreases. As a result, despite the attenuation of the turbulence, the overall drag increases due to the increase in the viscous stresses. For the case of a dense suspension, ${{\varPhi _b}} = 0.20$, we see that the attenuation of the turbulence is relatively more important, which can be explained by the increased particle migration towards the channel core region (see figure 17b). However, the formation of a relatively densely packed region causes an increase in the particle stresses that more than balances the decrease in turbulent transport. As a consequence, the drag increase at ${{\varPhi _b}} = 0.20$ is more pronounced for $\tau = \pm 1$. These results indicate that the condition at the suspension-porous interface has a significant impact on the flow and particle dynamics for the permeability of the porous medium considered here.

4. Conclusion

We employed direct numerical simulations to study turbulent suspension flows in a channel covered with isotropic porous media on the top and bottom surfaces. The VANS equations are used to describe the volume-averaged flow inside the porous layer, with the permeable wall characterized by permeability and porosity. We then coupled VANS with the IBM to resolve particle–particle and particle–fluid interactions. Here, we have kept the Reynolds number $Re = {U_0h}/{\nu } = 5600$ and investigated the effect of particle volume fraction ${{\varPhi _b}}$, non-dimensional permeability parameter $\sigma$, and the momentum transfer coefficient $\tau$ of the porous layer for spherical and neutrally buoyant rigid particles.

Using the Reynolds turbulent friction number $Re_{\tau }$, i.e. the response to determining the turbulent drag based on the friction velocity, we show quantitatively that turbulent stress increases with both particle volume fraction ${{\varPhi _b}}$ and wall non-dimensional permeability parameter $\sigma$. Overall, we observed that wall permeability is associated with higher drag due to increased turbulence activity compared to pure solvent. Turbulent suspension flows over hyperelastic materials have also been reported in Rosti & Brandt (Reference Rosti and Brandt2017). Although some experiments for pure fluid flowing over porous surfaces show that wall permeability causes an increase in skin friction in the turbulent-flow regime (Zagni & Smith Reference Zagni and Smith1976; Zippe & Graf Reference Zippe and Graf1983), others reveal a decrease in the skin friction in the laminar-flow regime (e.g. Beavers & Joseph Reference Beavers and Joseph1967).

Because the channel top and bottom walls have an isotropic porous medium, the velocity profile in the free-flow region remains the same as if the walls were smooth, as reported in Picano et al. (Reference Picano, Breugem and Brandt2015), but a slip velocity $u_s$ is generated at the suspension-porous interface. In our study, we found that the slip velocity $u_s$ decreases with increasing particle volume fraction ${{\varPhi _b}}$. By contrast, when the permeability of the wall increases, the slip velocity increases. In general, the decrease in particle–particle interaction results from increasing the slip velocity $u_s$ with the wall permeability parameter $\sigma$.

Our analysis of the flow streamwise momentum balance showed that as particle volume fraction increases, the additional stress due to particles increases. For instance, at ${{\varPhi _b}}=0.20$, the particle stress dominates the flow, while Reynolds transport dominates at ${{\varPhi _b}}=0$ and ${{\varPhi _b}} < 0.2$. It is also shown that adding more particles increases particle-induced stresses, which causes drag to increase. While turbulent stresses decay rapidly with increasing particle volume fractions, viscous stresses remain nearly constant.

A final analysis was performed on the statistics of turbulence caused by momentum transfer coefficients $\tau$. Slip velocity decreases noticeably when momentum transfer coefficient $\tau$ is changed. Based on our studies, we found that for a non-zero momentum transfer coefficient, the average particle angular velocity near the wall is lower than $\tau = 0$. The other noticeable effect of the momentum transfer coefficient $\tau$ on the concentration profile is where non-zero $\tau$ leads to the migration of particles to the centre of the channel, which means that fewer particles gather near the free flow and porous interface compared to $\tau = 0$. Increasing particle contribution also decreases Reynolds shear stress, thereby reducing total shear stress. The results also show that $\tau$ has a considerable effect on the behaviour of turbulent suspension flow over porous media; therefore, we need to consider the momentum transfer coefficient as an essential factor in future studies.

To improve this study further, other important factors can be considered. We should certainly pay attention to the effect of particle size (Lashgari et al. Reference Lashgari, Picano, Costa, Breugem and Brandt2017), shape (Bellani et al. Reference Bellani, Byron, Collignon, Meyer and Variano2012) and deformability (Alghalibi, Rosti & Brandt Reference Alghalibi, Rosti and Brandt2019) as new insights to our current study. In addition, experiments are needed to verify our results. We assumed that particles in this study would not be able to enter the porous layer due to their size. Understanding whether the same behaviour occurs when particles move inside the porous media, and the impact of anisotropic porous media, will be the subjects of our future investigations.

Funding

P.M. was supported by the National Science Foundation (award no. 1854376) and by the Army Research Office (award no. W911NF-18-1-0356). The work of S.M.A. and A.M.B. was funded by the National Science Foundation (award no. 1854376). L.B. acknowledges financial support from the Swedish Research Council (VR) through the INTERFACE research environment (grant no. VR 2016-06119). MER was supported by the Okinawa Institute of Science and Technology Graduate University (OIST) with subsidy funding from the Cabinet Office, Government of Japan.

Declaration of interests

The authors report no conflict of interest.

References

REFERENCES

Alazmi, B. & Vafai, K. 2001 Analysis of fluid flow and heat transfer interfacial conditions between a porous medium and a fluid layer. Intl J. Heat Mass Transfer 44 (9), 17351749.CrossRefGoogle Scholar
Alghalibi, D., Rosti, M.E. & Brandt, L. 2019 Inertial migration of a deformable particle in pipe flow. Phys. Rev. Fluids 4 (10), 104201.CrossRefGoogle Scholar
Ardekani, M.N., Al Asmar, L., Picano, F. & Brandt, L. 2018 Numerical study of heat transfer in laminar and turbulent pipe flow with finite-size spherical particles. Intl J. Heat Fluid Flow 71, 189199.CrossRefGoogle Scholar
Ardekani, M.N. & Brandt, L. 2019 Turbulence modulation in channel flow of finite-size spheroidal particles. J. Fluid Mech. 859, 887901.CrossRefGoogle Scholar
Ardekani, M.N., Costa, P., Breugem, W.P. & Brandt, L. 2016 Numerical study of the sedimentation of spheroidal particles. Intl J. Multiphase Flow 87, 1634.CrossRefGoogle Scholar
Ardekani, M.N., Costa, P., Breugem, W.-P., Picano, F. & Brandt, L. 2017 Drag reduction in turbulent channel flow laden with finite-size oblate spheroids. J. Fluid Mech. 816, 4370.CrossRefGoogle Scholar
Ardekani, M.N., Rosti, M.E. & Brandt, L. 2019 Turbulent flow of finite-size spherical particles in channels with viscous hyper-elastic walls. J. Fluid Mech. 873, 410440.CrossRefGoogle Scholar
Bagheri, M., Kang, C. & Mirbod, P. 2019 Suspension flows in a pipe covered with permeable surfaces. In APS Division of Fluid Dynamics Meeting Abstract no. NP05.020.Google Scholar
Bagheri, M. & Mirbod, P. 2022 Effect of porous media models on rheological properties of suspensions. J. Non-Newtonian Fluid Mech. 307, 104876.CrossRefGoogle Scholar
Bagheri, M., Moradi Bilondi, A., Taheri, E., Anand, A., Schatz, M.F. & Mirbod, P. 2022 An experimental analysis of flow transitions in a periodically grooved channel. In APS Division of Fluid Dynamics Meeting Abstract no. J32.00009.Google Scholar
Bear, J. 1988 Dynamics of Fluids in Porous Media. Courier Corporation.Google Scholar
Beavers, G.S. & Joseph, D.D. 1967 Boundary conditions at a naturally permeable wall. J. Fluid Mech. 30 (1), 197207.CrossRefGoogle Scholar
Bec, J., Biferale, L., Cencini, M., Lanotte, A., Musacchio, S. & Toschi, F. 2007 Heavy particle concentration in turbulence at dissipative and inertial scales. Phys. Rev. Lett. 98 (8), 084502.CrossRefGoogle ScholarPubMed
Bellani, G., Byron, M.L., Collignon, A.G., Meyer, C.R. & Variano, E.A. 2012 Shape effects on turbulent modulation by large nearly neutrally buoyant particles. J. Fluid Mech. 712, 4160.CrossRefGoogle Scholar
Biegert, E., Vowinckel, B. & Meiburg, E. 2017 A collision model for grain-resolving simulations of flows over dense, mobile, polydisperse granular sediment beds. J. Comput. Phys. 340, 105127.CrossRefGoogle Scholar
Brenner, H. 1961 The slow motion of a sphere through a viscous fluid towards a plane surface. Chem. Engng Sci. 16 (3–4), 242251.Google Scholar
Breugem, W.-P. 2012 A second-order accurate immersed boundary method for fully resolved simulations of particle-laden flows. J. Comput. Phys. 231 (13), 44694498.CrossRefGoogle Scholar
Breugem, W.-P. & Boersma, B.-J. 2005 Direct numerical simulations of turbulent flow over a permeable wall using a direct and a continuum approach. Phys. Fluids 17 (2), 025103.CrossRefGoogle Scholar
Breugem, W.P., Boersma, B.J. & Uittenbogaard, R.E. 2004 Direct numerical simulations of plane channel flow over a 3D Cartesian grid of cubes. In Proc. Intl Conf. on Applications of Porous Media (ed. A.H. Reis & A.F. Miguel), pp. 27–34.Google Scholar
Breugem, W.P., Boersma, B.J. & Uittenbogaard, R.E. 2006 The influence of wall permeability on turbulent channel flow. J. Fluid Mech. 562, 3572.CrossRefGoogle Scholar
Brinkman, H.C. 1947 Fluid flow in a porous medium. Appl. Sci. Res. A 27 (143149), 42.Google Scholar
Carotenuto, C. & Minale, M. 2011 Shear flow over a porous layer: velocity in the real proximity of the interface via rheological tests. Phys. Fluids 23 (6), 063101.CrossRefGoogle Scholar
Chandesris, M. & Jamet, D. 2006 Boundary conditions at a planar fluid–porous interface for a Poiseuille flow. Intl J. Heat Mass Transfer 49 (13–14), 21372150.CrossRefGoogle Scholar
Chandesris, M. & Jamet, D. 2007 Boundary conditions at a fluid–porous interface: an a priori estimation of the stress jump coefficients. Intl J. Heat Mass Transfer 50 (17–18), 34223436.CrossRefGoogle Scholar
Chen, H., Wang, J. & Yang, K. 2016 Analysis of the momentum transport boundary conditions at a fluid-porous interface. In Heat Transfer Summer Conference, vol. 50329, p. V001T03A006. American Society of Mechanical Engineers.Google Scholar
Costa, P., Boersma, B.J., Westerweel, J. & Breugem, W.-P. 2015 Collision model for fully resolved simulations of flows laden with finite-size particles. Phys. Rev. E 92 (5), 053012.CrossRefGoogle ScholarPubMed
Costa, P., Picano, F., Brandt, L. & Breugem, W.-P. 2016 Universal scaling laws for dense particle suspensions in turbulent wall-bounded flows. Phys. Rev. Lett. 117 (13), 134501.CrossRefGoogle ScholarPubMed
Costa, P., Picano, F., Brandt, L. & Breugem, W.-P. 2018 Effects of the finite particle size in turbulent wall-bounded flows of dense suspensions. J. Fluid Mech. 843, 450478.CrossRefGoogle Scholar
Darcy, H.P.G. 1856 Les Fontaines publiques de la ville de Dijon. Exposition et application des principes à suivre et des formules à employer dans les questions de distribution d'eau, etc.. V. Dalamont.Google Scholar
Deng, C. & Martinez, D.M. 2005 Viscous flow in a channel partially filled with a porous medium and with wall suction. Chem. Engng Sci. 60 (2), 329336.CrossRefGoogle Scholar
Francesco Lucci, A.F. & Elghobashi, S. 2010 Modulation of isotropic turbulence by particles of Taylor length-scale size. J. Fluid Mech. 650, 555.CrossRefGoogle Scholar
Giorgi, T. 1997 Derivation of the Forchheimer law via matched asymptotic expansions. Transp. Porous Media 29 (2), 191206.CrossRefGoogle Scholar
Gomez-de Segura, G., Sharma, A. & García-Mayoral, R. 2017 Turbulent drag reduction by anisotropic permeable coatings. In 10th International Symposium on Turbulence and Shear Flow Phenomena – TSFP10.Google Scholar
Goyeau, B., Lhuillier, D., Gobin, D. & Velarde, M.G. 2003 Momentum transport at a fluid–porous interface. Intl J. Heat Mass Transfer 46 (21), 40714081.CrossRefGoogle Scholar
Haffner, E., Kang, C., Shapley, N. & Mirbod, P. 2019 Experimental and numerical studies of particle-laden fluid flows over a porous media model. In APS Division of Fluid Dynamics Meeting Abstract no. B04.005.Google Scholar
Haffner, E.A. & Mirbod, P. 2020 Velocity measurements of dilute particulate suspension over and through a porous medium model. Phys. Fluids 32 (8), 083608.CrossRefGoogle Scholar
Hahn, S., Je, J. & Choi, H. 2002 Direct numerical simulation of turbulent channel flow with permeable walls. J. Fluid Mech. 450, 259285.CrossRefGoogle Scholar
Herwig, A., Kempe, T. & Fröhlich, J. 2011 Phase resolved DNS of the turbulent flow over a sediment bed and analysis of the erosion process. Proc. Appl. Maths Mech. 11 (1), 611612.Google Scholar
Hooshyar, S., Yoshikawa, H.N. & Mirbod, P. 2022 The impact of imposed Couette flow on the stability of pressure-driven flows over porous surfaces. J. Engng Maths 132 (1), 122.CrossRefGoogle Scholar
Itoh, M., Tamano, S., Iguchi, R., Yokota, K., Akino, N., Hino, R. & Kubo, S. 2006 Turbulent drag reduction by the seal fur surface. Phys. Fluids 18 (6), 065102.CrossRefGoogle Scholar
Izbassarov, D., Rosti, M.E., Ardekani, M.N., Sarabian, M., Hormozi, S., Brandt, L. & Tammisola, O. 2018 Computational modeling of multiphase viscoelastic and elastoviscoplastic flows. Intl J. Numer. Meth. Fluids 88 (12), 521543.CrossRefGoogle Scholar
Jain, R., Tschisgale, S. & Fröhlich, J. 2020 Effect of particle shape on bedload sediment transport in case of small particle loading. Meccanica 55 (2), 299315.CrossRefGoogle Scholar
Jain, R., Tschisgale, S. & Fröhlich, J. 2021 Impact of shape: DNS of sediment transport with non-spherical particles. J. Fluid Mech. 916, A38.CrossRefGoogle Scholar
Jimenez, J., Uhlmann, M., Pinelli, A. & Kawahara, G. 2001 Turbulent shear flow over active and passive porous surfaces. J. Fluid Mech. 442, 89117.CrossRefGoogle Scholar
Joseph, D.D., Nield, D.A. & Papanicolaou, G. 1982 Nonlinear equation governing flow in a saturated porous medium. Water Resour. Res. 18 (4), 10491052.CrossRefGoogle Scholar
Kang, C. & Mirbod, P. 2019 Porosity effects in laminar fluid flow near permeable surfaces. Phys. Rev. E 100 (1), 013109.CrossRefGoogle ScholarPubMed
Kang, C. & Mirbod, P. 2021 Pressure-driven pipe flow of semi-dilute and dense suspensions over permeable surfaces. Rheol. Acta 60 (11), 711718.CrossRefGoogle Scholar
Kempe, T., Vowinckel, B. & Fröhlich, J. 2014 On the relevance of collision modeling for interface-resolving simulations of sediment transport in open channel flow. Intl J. Multiphase Flow 58, 214235.CrossRefGoogle Scholar
Kidanemariam, A.G., Chan-Braun, C., Doychev, T. & Uhlmann, M. 2013 Direct numerical simulation of horizontal open channel flow with finite-size, heavy particles at low solid volume fraction. New J. Phys. 15 (2), 025031.CrossRefGoogle Scholar
Kidanemariam, A.G. & Uhlmann, M. 2014 Direct numerical simulation of pattern formation in subaqueous sediment. J. Fluid Mech. 750, R2.CrossRefGoogle Scholar
Köllner, T., Meredith, A., Nokes, R. & Meiburg, E. 2020 Gravity currents over fixed beds of monodisperse spheres. J. Fluid Mech. 901, A32.CrossRefGoogle Scholar
Kong, F. & Schetz, J. 1982 Turbulent boundary layer over porous surfaces with different surface geometries. In 20th Aerospace Sciences Meeting, p. 30.Google Scholar
Kuwata, Y. & Suga, K. 2016 Lattice Boltzmann direct numerical simulation of interface turbulence over porous and rough walls. Intl J. Heat Fluid Flow 61, 145157.CrossRefGoogle Scholar
Kuwata, Y. & Suga, K. 2017 Direct numerical simulation of turbulence over anisotropic porous media. J. Fluid Mech. 831, 4171.CrossRefGoogle Scholar
Lage, J. 1998 The fundamental theory of flow through permeable media from Darcy to turbulence. Transp. Phenom. Porous Media 1.Google Scholar
Lashgari, I., Picano, F., Breugem, W.-P. & Brandt, L. 2014 Laminar, turbulent, and inertial shear-thickening regimes in channel flow of neutrally buoyant particle suspensions. Phys. Rev. Lett. 113 (25), 254502.CrossRefGoogle ScholarPubMed
Lashgari, I., Picano, F., Costa, P., Breugem, W.-P. & Brandt, L. 2017 Turbulent channel flow of a dense binary mixture of rigid particles. J. Fluid Mech. 818, 623645.CrossRefGoogle Scholar
Loisel, V., Abbas, M., Masbernat, O. & Climent, E. 2013 The effect of neutrally buoyant finite-size particles on channel flows in the laminar–turbulent transition regime. Phys. Fluids 25 (12), 123304.CrossRefGoogle Scholar
Matas, J.-P., Morris, J.F. & Guazzelli, É. 2004 Inertial migration of rigid spherical particles in Poiseuille flow. J. Fluid Mech. 515, 171195.CrossRefGoogle Scholar
Min, J.Y. & Kim, S.J. 2005 A novel methodology for thermal analysis of a composite system consisting of a porous medium and an adjacent fluid layer. Trans. ASME J. Heat Transfer 127 (6), 648656.CrossRefGoogle Scholar
Minale, M. 2014 a Momentum transfer within a porous medium. I. Theoretical derivation of the momentum balance on the solid skeleton. Phys. Fluids 26, 123101.CrossRefGoogle Scholar
Minale, M. 2014 b Momentum transfer within a porous medium. II. Stress boundary condition. Phys. Fluids 26, 123102.CrossRefGoogle Scholar
Mirbod, P., Andreopoulos, Y. & Weinbaum, S. 2009 On the generation of lift forces in random soft porous media. J. Fluid Mech. 619, 147166.Google Scholar
Mirbod, P. & Shapley, N.C. 2022 Particle migration of suspensions in a pressure-driven flow over and through a porous structure. J. Rheol. arXiv:2212.02550.Google Scholar
Mirbod, P., Wu, Z. & Ahmadi, G. 2017 Laminar flow drag reduction on soft porous media. Sci. Rep. 7 (1), 110.CrossRefGoogle ScholarPubMed
Mittal, R. & Iaccarino, G. 2005 Immersed boundary methods. Annu. Rev. Fluid Mech. 37, 239261.CrossRefGoogle Scholar
Moradi Bilondi, A., Mastroianni, N., Brandt, L. & Mirbod, P. 2022 Turbulent flow of polymer solutions in a square duct roughened with transverse ribs. In APS Division of Fluid Dynamics Meeting Abstract no. S01.0020.Google Scholar
Neale, G. & Nader, W. 1974 Practical significance of Brinkman's extension of Darcy's law: coupled parallel flows within a channel and a bounding porous medium. Can. J. Chem. Engng 52 (4), 475478.CrossRefGoogle Scholar
Ochoa-Tapia, J.A. & Whitaker, S. 1995 Momentum transfer at the boundary between a porous medium and a homogeneous fluid – I. Theoretical development. Intl J. Heat Mass Transfer 38 (14), 26352646.CrossRefGoogle Scholar
Pan, Y. & Banerjee, S. 1996 Numerical simulation of particle interactions with wall turbulence. Phys. Fluids 8 (10), 27332755.CrossRefGoogle Scholar
Papadopoulos, K., Nikora, V., Vowinckel, B., Cameron, S., Jain, R., Stewart, M., Gibbins, C. & Fröhlich, J. 2020 Double-averaged kinetic energy budgets in flows over mobile granular beds: insights from DNS data analysis. J. Hydraul. Res. 58 (4), 653672.CrossRefGoogle Scholar
Peng, C., Ayala, O.M. & Wang, L.-P. 2019 A direct numerical investigation of two-way interactions in a particle-laden turbulent channel flow. J. Fluid Mech. 875, 10961144.CrossRefGoogle Scholar
Peng, C. & Wang, L.-P. 2020 Force-amplified, single-sided diffused-interface immersed boundary kernel for correct local velocity gradient computation and accurate no-slip boundary enforcement. Phys. Rev. E 101 (5), 053305.CrossRefGoogle ScholarPubMed
Perot, B. & Moin, P. 1995 Shear-free turbulent boundary layers. Part 1. Physical insights into near-wall turbulence. J. Fluid Mech. 295, 199228.CrossRefGoogle Scholar
Peskin, C.S. 1972 Flow patterns around heart valves: a numerical method. J. Comput. Phys. 10 (2), 252271.CrossRefGoogle Scholar
Picano, F., Breugem, W.-P. & Brandt, L. 2015 Turbulent channel flow of dense suspensions of neutrally buoyant spheres. J. Fluid Mech. 764, 463487.CrossRefGoogle Scholar
Quintard, M. & Whitaker, S. 1994 Transport in ordered and disordered porous media II: generalized volume averaging. Transp. Porous Media 14 (2), 179206.CrossRefGoogle Scholar
Reeks, M.W. 1983 The transport of discrete particles in inhomogeneous turbulence. J. Aerosol. Sci. 14 (6), 729739.CrossRefGoogle Scholar
Rosti, M.E. & Brandt, L. 2017 Numerical simulation of turbulent channel flow over a viscous hyper-elastic wall. J. Fluid Mech. 830, 708735.CrossRefGoogle Scholar
Rosti, M.E. & Brandt, L. 2020 Increase of turbulent drag by polymers in particle suspensions. Phys. Rev. Fluids 5 (4), 041301.CrossRefGoogle Scholar
Rosti, M.E., Brandt, L. & Pinelli, A. 2018 Turbulent channel flow over an anisotropic porous wall-drag increase and reduction. J. Fluid Mech. 842, 381394.CrossRefGoogle Scholar
Rosti, M.E., Cortelezzi, L. & Quadrio, M. 2015 Direct numerical simulation of turbulent channel flow over porous walls. J. Fluid Mech. 784, 396442.Google Scholar
Rosti, M.E., Mirbod, P. & Brandt, L. 2021 The impact of porous walls on the rheology of suspensions. Chem. Engng Sci., 116178.CrossRefGoogle Scholar
Rosti, M.E., Pramanik, S., Brandt, L. & Mitra, D. 2020 The breakdown of Darcy's law in a soft porous material. Soft Matt. 16 (4), 939944.CrossRefGoogle Scholar
Ruff, J.F. & Gelhar, L.W. 1972 Turbulent shear flow in porous boundary. J. Engng Mech. ASCE 504 (98), 975.Google Scholar
Sardina, G., Schlatter, P., Brandt, L., Picano, F. & Casciola, C.M. 2012 Wall accumulation and spatial localization in particle-laden wall flows. J. Fluid Mech. 699 (1), 5078.CrossRefGoogle Scholar
Shao, X., Wu, T. & Yu, Z. 2012 Fully resolved numerical simulation of particle-laden turbulent flow in a horizontal channel at a low Reynolds number. J. Fluid Mech. 693, 319.CrossRefGoogle Scholar
Song, W., Jinzhou, Z. & Yongming, L. 2014 Hydraulic fracturing simulation of complex fractures growth in naturally fractured shale gas reservoir. Arabian J. Sci. Engng 39 (10), 74117419.CrossRefGoogle Scholar
Suga, K., Matsumura, Y., Ashitaka, Y., Tominaga, S. & Kaneda, M. 2010 Effects of wall permeability on turbulence. Intl J. Heat Fluid Flow 31 (6), 974984.CrossRefGoogle Scholar
Suga, K., Nakagawa, Y. & Kaneda, M. 2017 Spanwise turbulence structure over permeable walls. J. Fluid Mech. 822, 186201.CrossRefGoogle Scholar
Tilton, N. & Cortelezzi, L. 2008 Linear stability analysis of pressure-driven flows in channels with porous walls. J. Fluid Mech. 604, 411445.CrossRefGoogle Scholar
Toschi, F. & Bodenschatz, E. 2009 Lagrangian properties of particles in turbulence. Annu. Rev. Fluid Mech. 41, 375404.CrossRefGoogle Scholar
Uhlmann, M. 2005 An immersed boundary method with direct forcing for the simulation of particulate flows. J. Comput. Phys. 209 (2), 448476.CrossRefGoogle Scholar
Vafai, K. & Kim, S.J. 1990 Fluid mechanics of the interface region between a porous medium and a fluid layer – an exact solution. Intl J. Heat Fluid Flow 11 (3), 254256.CrossRefGoogle Scholar
Vafai, K. & Thiyagaraja, R. 1987 Analysis of flow and heat transfer at the interface region of a porous medium. Intl J. Heat Mass Transfer 30 (7), 13911405.CrossRefGoogle Scholar
Valdés-Parada, F.J., Aguilar-Madera, C.G., Ochoa-Tapia, J.A. & Goyeau, B. 2013 Velocity and stress jump conditions between a porous medium and a fluid. Adv. Water Resour. 62, 327339.CrossRefGoogle Scholar
Valdés-Parada, F.J., Alvarez-Ramírez, J., Goyeau, B. & Ochoa-Tapia, J.A. 2009 Computation of jump coefficients for momentum transfer between a porous medium and a fluid using a closed generalized transfer equation. Transp. Porous Media 78 (3), 439457.Google Scholar
Valdés-Parada, F.J., Goyeau, B. & Ochoa-Tapia, J.A. 2007 Jump momentum boundary condition at a fluid–porous dividing surface: derivation of the closure problem. Chem. Engng Sci. 62 (15), 40254039.CrossRefGoogle Scholar
Vowinckel, B., Biegert, E., Luzzatto-Fegiz, P. & Meiburg, E. 2019 a Consolidation of freshly deposited cohesive and noncohesive sediment: particle-resolved simulations. Phys. Rev. Fluids 4 (7), 074305.CrossRefGoogle Scholar
Vowinckel, B., Biegert, E., Meiburg, E., Aussillous, P. & Guazzelli, É. 2021 Rheology of mobile sediment beds sheared by viscous, pressure-driven flows. J. Fluid Mech. 921, A20.CrossRefGoogle Scholar
Vowinckel, B., Kempe, T. & Fröhlich, J. 2014 Fluid–particle interaction in turbulent open channel flow with fully-resolved mobile beds. Adv. Water Resour. 72, 3244.CrossRefGoogle Scholar
Vowinckel, B., Nikora, V., Kempe, T. & Fröhlich, J. 2017 Momentum balance in flows over mobile granular beds: application of double-averaging methodology to DNS data. J. Hydraul. Res. 55 (2), 190207.CrossRefGoogle Scholar
Vowinckel, B., Withers, J., Luzzatto-Fegiz, P. & Meiburg, E. 2019 b Settling of cohesive sediment: particle-resolved simulations. J. Fluid Mech. 858, 544.CrossRefGoogle Scholar
Whitaker, S. 1969 Advances in theory of fluid motion in porous media. Ind. Engng Chem. 61 (12), 1428.CrossRefGoogle Scholar
Whitaker, S. 1986 Flow in porous media I: a theoretical derivation of Darcy's law. Transp. Porous Media 1 (1), 325.CrossRefGoogle Scholar
Whitaker, S. 1996 The Forchheimer equation: a theoretical development. Transp. Porous Media 25 (1), 2761.CrossRefGoogle Scholar
Wu, Z. & Mirbod, P. 2018 Experimental analysis of the flow near the boundary of random porous media. Phys. Fluids 30 (4), 047103.CrossRefGoogle Scholar
Wu, Z. & Mirbod, P. 2019 Instability analysis of the flow between two parallel plates where the bottom one coated with porous media. Adv. Water Resour. 130, 221228.CrossRefGoogle Scholar
Yeo, K., Dong, S., Climent, E. & Maxey, M.R. 2010 Modulation of homogeneous turbulence seeded with finite size bubbles or particles. Intl J. Multiphase Flow 36 (3), 221233.CrossRefGoogle Scholar
Yeo, K. & Maxey, M.R. 2010 Dynamics of concentrated suspensions of non-colloidal particles in Couette flow. J. Fluid Mech. 649, 205231.CrossRefGoogle Scholar
Yousefi, A., Ardekani, M.N., Picano, F. & Brandt, L. 2021 Regimes of heat transfer in finite-size particle suspensions. Intl J. Heat Mass Transfer 177, 121514.Google Scholar
Yu, Z., Wu, T., Shao, X. & Lin, J. 2013 Numerical studies of the effects of large neutrally buoyant particles on the flow instability and transition to turbulence in pipe flow. Phys. Fluids 25 (4), 043305.CrossRefGoogle Scholar
Zade, S., Costa, P., Fornari, W., Lundell, F. & Brandt, L. 2018 Experimental investigation of turbulent suspensions of spherical particles in a square duct. J. Fluid Mech. 857, 748783.CrossRefGoogle Scholar
Zagni, A.F.E. & Smith, K.V.H. 1976 Channel flow over permeable beds of graded spheres. J. Hydraul. Div. ASCE 102 (2), 207222.CrossRefGoogle Scholar
Zhai, Z., et al. 2005 A new approach to modeling hydraulic fractures in unconsolidated sands. In SPE Annual Technical Conference and Exhibition. Society of Petroleum Engineers.CrossRefGoogle Scholar
Zippe, H.J. & Graf, W.H. 1983 Turbulent boundary-layer flow over permeable and non-permeable rough surfaces. J. Hydraul. Res. 21 (1), 5165.CrossRefGoogle Scholar
Figure 0

Figure 1. Sketch of the 3-D channel flow with 50 particles overlying porous media followed by the coordinate system adopted in this study.

Figure 1

Table 1. List of simulations performed. The porosity is fixed at $\varepsilon =0.6$, and the bulk Reynolds number is $Re=5600$, whereas the non-dimensional permeability parameter and the solid volume fraction vary as indicated. The parameter $N_p$ indicates the number of particles at each particle volume fraction.

Figure 2

Figure 2. Contours of the instantaneous turbulent streamwise velocity $u$ in the $x$$y$ plane for a fixed wall non-dimensional permeability parameter $\sigma = 0.63 \times 10^{-3}$ and three different particle volume fractions: (a) ${{\varPhi _b}} = 0.05$, (b) ${{\varPhi _b}}=0.1$, and (c) ${{\varPhi _b}}= 0.2$.

Figure 3

Figure 3. Contours of the instantaneous turbulent streamwise velocity $u$ in the $x$$y$ plane for a fixed particle volume fraction ${{\varPhi _b}} = 0.10$ and three different wall non-dimensional permeability parameters: (a) $\sigma = 0.63 \times 10^{-3}$, (b) $\sigma = 2 \times 10^{-3}$, and (c) $\sigma = 6.3 \times 10^{-3}$.

Figure 4

Figure 4. Friction Reynolds number $Re_{\tau }$ as a function of (a) wall non-dimensional permeability parameter $\sigma$, for different values of the particle volume fraction ${{\varPhi _b}}$, and (b) the particle volume fraction ${{\varPhi _b}}$ for different values of wall non-dimensional permeability parameter $\sigma$.

Figure 5

Figure 5. Instantaneous streamwise velocity fluctuation contours in the $x$$z$ plane at the interface $y = 0$ (flow going from bottom to top): (a) for solvent ${{\varPhi _b}}=0.0$, and (b) for suspension with the particle volume fraction ${{\varPhi _b}}=0.1$ at a fixed wall non-dimensional permeability parameter $\sigma = 0.63\times 10^{-3}$.

Figure 6

Figure 6. Mean fluid streamwise velocity component $u_f$ normalized by the bulk velocity $U_0$ as a function of the wall-normal distance $y$ for various particle volume fractions ${{\varPhi _b}}$ at a fixed wall non-dimensional permeability parameter $\sigma = 0.63\times 10^{-3}$.

Figure 7

Figure 7. Mean fluid streamwise velocity component $u_f$ normalized by the bulk velocity $U_0$ as a function of the wall-normal distance $y$ for different values of the wall non-dimensional permeability parameter $\sigma$ at a fixed particle volume fraction ${{\varPhi _b}} = 0.10$.

Figure 8

Figure 8. Intensity of the fluid fluctuation velocity components normalized by $U_0$ and the Reynolds shear stress for different particle volume fractions and non-dimensional permeability parameter $\sigma = 0.63\times 10^{-3}$: (a) streamwise $u_{rms}$ velocity fluctuations, (b) wall-normal $v_{rms}$ velocity fluctuations, (c) spanwise $w_{rms}$ velocity fluctuations, and (d) shear stress $(uv)'$.

Figure 9

Figure 9. Intensity of the fluid fluctuation velocity components normalized by $U_0$ and the Reynolds shear stress for ${{\varPhi _b}} = 0.10$ and different values of the wall non-dimensional permeability parameter: (a) streamwise $u_{rms}$ velocity fluctuations, (b) wall-normal $v_{rms}$ velocity fluctuations, (c) spanwise $w_{rms}$ velocity fluctuations, and (d) shear stress $(uv)'$.

Figure 10

Figure 10. (a) Normalized interface slip velocity as a function of the wall non-dimensional permeability parameter $\sigma$ for the different particle volume fractions under investigation. (b) Normalized interface wall-normal fluctuation velocity as a function of the wall non-dimensional permeability parameter $\sigma$ for different particle volume fractions.

Figure 11

Figure 11. Normalized probability distribution functions (p.d.f.s) of the streamwise fluctuation velocity $u'$ and wall-normal fluctuation velocity $v'$ for a fixed particle volume fraction ${{\varPhi _b}} = 0.10$ and various non-dimensional permeability parameters: (ac) $\sigma = 0.63\times 10^{-3}$, (df) $\sigma = 2.0\times 10^{-3}$, and (gi) $\sigma = 6.3\times 10^{-3}$. (a,d,g) At the flow-porous interface, (b,e,h) between the centre of the channel and the interface, and (cf,i) at the centreline of the channel.

Figure 12

Figure 12. Normalized probability distribution functions (p.d.f.s) of the streamwise fluctuation velocity $u'$ and wall-normal fluctuation velocity $v'$ at the interface for a fixed wall non-dimensional permeability parameter $\sigma = 0.63\times 10^{-3}$ and various particle volume fractions: (ac) ${{\varPhi _b}} = 0.05$, (df) ${{\varPhi _b}} = 0.10$, and (gi) ${{\varPhi _b}} = 0.20$. (a,d,g) At the flow-porous interface, (b,e,h) between the centre of the channel and the interface, and (cf,i) at the centreline of the channel.

Figure 13

Figure 13. Average particle concentration $\phi$ as a function of the wall-normal distance $y$ for: (a) different particle volume fractions at fixed non-dimensional permeability parameter $\sigma = 0.63\times 10^{-3}$; (b,c) various wall non-dimensional permeability parameters $\sigma$ at fixed particle volume fractions ${{\varPhi _b}} = 0.10$ and $0.20$.

Figure 14

Figure 14. Histograms showing the different components of the mean shear stress balance as a function of the particle volume fraction ${{\varPhi _b}}$ for (a) $\sigma = 0.63\times 10^{-3}$, and (b) $\sigma = 6.3\times 10^{-3}$. Blue, red and yellow show the viscous stress, Reynolds shear stress, and particle contributions, respectively.

Figure 15

Figure 15. Spanwise component of the near-wall particle angular velocity as a function of the wall non-dimensional permeability parameter $\sigma$ for different volume fractions ${{\varPhi _b}} = 0.05$, $0.10$ and $0.20$.

Figure 16

Figure 16. Mean particle streamwise velocity component $u_p$ normalized by the bulk velocity $U_0$ as a function of the wall-normal coordinate $y$ (lines): (a) for various particle volume fractions ${{\varPhi _b}}$ at a fixed wall non-dimensional permeability parameter $\sigma = 0.63\times 10^{-3}$; and (b) for various wall non-dimensional permeability parameters $\sigma$ at a fixed particle volume fraction ${{\varPhi _b}} = 0.10$. The symbols represent the mean fluid velocity profiles.

Figure 17

Figure 17. (a) Friction Reynolds number $Re_{\tau }$ as a function of $\tau$, for different particle volume fractions ${{\varPhi _b}}=0$ and 0.2. (b) Average particle concentration $\phi$ as a function of the wall-normal distance $y$ for different $\tau$ at a fixed non-dimensional permeability parameter $\sigma = 0.63 \times 10^{-3}$.

Figure 18

Figure 18. Mean fluid streamwise velocity component $u_f$ normalized by the bulk velocity $U_0$ as a function of the wall-normal distance $y$ for different values of momentum transfer coefficient $\tau$ and wall non-dimensional permeability parameter $\sigma = 0.63 \times 10^{-3}$: (a) pure fluid (${{\varPhi _b}} = 0$), (b) ${{\varPhi _b}} = 0.20$.

Figure 19

Figure 19. (a) Normalized interface slip velocity as a function of $\tau$ for different particle volume fractions under investigation at wall non-dimensional permeability parameter $\sigma = 0.63 \times 10^{-3}$. (b) Normalized spanwise component of the particle angular velocity as a function of $\tau$ for particle volume fractions ${{\varPhi _b}} = 0.20$.

Figure 20

Figure 20. Intensity of the fluid fluctuation velocity components normalized by $U_0$ and the Reynolds shear stress for different $\tau$ and a fixed particle volume fraction ${{\varPhi _b}} = 0.20$ and non-dimensional permeability parameter $\sigma = 0.63\times 10^{-3}$: (a) streamwise $u_{rms}$ velocity fluctuation; (b) wall-normal $v_{rms}$ velocity fluctuation; (c) spanwise $w_{rms}$ velocity fluctuation; and (d) shear stress $(uv)'$.

Figure 21

Figure 21. Histograms showing the different components of the mean shear stress balance as a function of $\tau$ for (a) ${{\varPhi _b}} = 0.0$ and (b) ${{\varPhi _b}} = 0.20$. Blue, red and yellow show the viscous stress, Reynolds shear stress and particle contributions, respectively.