


1. Introduction
Richtmyer–Meshkov instability (RMI) occurs when a perturbed interface separating two fluids of different densities is accelerated by a shock wave (Richtmyer Reference Richtmyer1960; Meshkov Reference Meshkov1969). It plays a critical role in various engineering applications and natural phenomena (Zhou Reference Zhou2017 a,b, Reference Zhou2024; Zhou, Sadler & Hurricane Reference Zhou, Sadler and Hurricane2025), such as inertial confinement fusion (ICF) (Zylstra et al. Reference Zylstra2022), supersonic combustion ramjet (Urzay Reference Urzay2018) and supernova explosion (Abarzhi et al. Reference Abarzhi, Bhowmick, Naveh, Pandian, Swisher, Stellingwerf and Arnett2019).
As a foundation for research related to shock-driven interface instability, the RMI on a single-mode light–heavy interface with a small dimensionless initial amplitude (
 $ka_0$
, where
$ka_0$
, where
 $k$
and
$k$
and
 $a_0$
are perturbation wavenumber and initial amplitude, respectively) has garnered significant attention. Theoretically, Richtmyer (Reference Richtmyer1960) first proposed an incompressible model (impulsive model), which empirically describes the influence of flow compressibility by using post-shock Atwood number and amplitude instead of their pre-shock counterparts, to predict the linear RMI evolution. Additionally, Richtmyer (Reference Richtmyer1960) constructed a compressible theory (Richtmyer theory) to describe the linear evolution of RMI in flows with arbitrary compressibility. For the nonlinear evolution period, several empirical models (Zhang & Sohn Reference Zhang and Sohn1997; Sadot et al. Reference Sadot, Erez, Alon, Oron, Levin, Erez, Ben-Dor and Shvarts1998; Mikaelian Reference Mikaelian2003; Dimonte & Ramaprabhu Reference Dimonte and Ramaprabhu2010; Zhang & Guo Reference Zhang and Guo2016) were constructed by matching the compressible linear and incompressible nonlinear solutions.
$a_0$
are perturbation wavenumber and initial amplitude, respectively) has garnered significant attention. Theoretically, Richtmyer (Reference Richtmyer1960) first proposed an incompressible model (impulsive model), which empirically describes the influence of flow compressibility by using post-shock Atwood number and amplitude instead of their pre-shock counterparts, to predict the linear RMI evolution. Additionally, Richtmyer (Reference Richtmyer1960) constructed a compressible theory (Richtmyer theory) to describe the linear evolution of RMI in flows with arbitrary compressibility. For the nonlinear evolution period, several empirical models (Zhang & Sohn Reference Zhang and Sohn1997; Sadot et al. Reference Sadot, Erez, Alon, Oron, Levin, Erez, Ben-Dor and Shvarts1998; Mikaelian Reference Mikaelian2003; Dimonte & Ramaprabhu Reference Dimonte and Ramaprabhu2010; Zhang & Guo Reference Zhang and Guo2016) were constructed by matching the compressible linear and incompressible nonlinear solutions.
Experimentally, previous studies primarily utilized shock-tube facilities to investigate the RMI induced by a weak shock (weak-shock RMI) with the Mach number (
 $M$
) typically less than 1.5. Meshkov (Reference Meshkov1969) first conducted shock-tube experiments on weak-shock RMI with
$M$
) typically less than 1.5. Meshkov (Reference Meshkov1969) first conducted shock-tube experiments on weak-shock RMI with
 $M\approx 1.5$
using interfaces formed by nitrocellulose membrane. The experimental linear amplitude growth was found to be slower than the impulsive model prediction, which may be attributed to the effects of nonlinearity and wire support. Afterwards, Jacobs & Krivets (Reference Jacobs and Krivets2005) studied the late-time development of RMI on a membraneless light–heavy interface accelerated by a shock wave with
$M\approx 1.5$
using interfaces formed by nitrocellulose membrane. The experimental linear amplitude growth was found to be slower than the impulsive model prediction, which may be attributed to the effects of nonlinearity and wire support. Afterwards, Jacobs & Krivets (Reference Jacobs and Krivets2005) studied the late-time development of RMI on a membraneless light–heavy interface accelerated by a shock wave with
 $M$
of 1.3. It was found that the nonlinear model proposed by Zhang & Sohn (Reference Zhang and Sohn1997) (ZS model) fails to accurately predict the experimental results, while that constructed by Sadot et al. (Reference Sadot, Erez, Alon, Oron, Levin, Erez, Ben-Dor and Shvarts1998) (SEA model) offers better predictions. Subsequently, Liu et al. (Reference Liu, Liang, Ding, Liu and Luo2018) performed shock-tube experiments on the evolution of a soap-film single-mode light–heavy interface accelerated by a shock with
$M$
of 1.3. It was found that the nonlinear model proposed by Zhang & Sohn (Reference Zhang and Sohn1997) (ZS model) fails to accurately predict the experimental results, while that constructed by Sadot et al. (Reference Sadot, Erez, Alon, Oron, Levin, Erez, Ben-Dor and Shvarts1998) (SEA model) offers better predictions. Subsequently, Liu et al. (Reference Liu, Liang, Ding, Liu and Luo2018) performed shock-tube experiments on the evolution of a soap-film single-mode light–heavy interface accelerated by a shock with
 $M \approx 1.22$
, and verified the validity of the impulsive model in predicting the linear RMI evolution in weakly compressible flows. Additionally, it was observed that the models proposed by Mikaelian (Reference Mikaelian2003) (MIK model) and Zhang & Guo (Reference Zhang and Guo2016) (ZG model) reasonably predict the nonlinear evolution.
$M \approx 1.22$
, and verified the validity of the impulsive model in predicting the linear RMI evolution in weakly compressible flows. Additionally, it was observed that the models proposed by Mikaelian (Reference Mikaelian2003) (MIK model) and Zhang & Guo (Reference Zhang and Guo2016) (ZG model) reasonably predict the nonlinear evolution.
Currently, weak-shock RMI has been studied extensively through shock-tube experiments. However, high-intensity shocks are commonly encountered in practical applications involving RMI. Therefore, investigating RMI driven by a strong shock wave (strong-shock RMI) is highly desirable. Laser-driven experiments on strong-shock RMI have been widely conducted (Zhou et al. Reference Zhou, Sadler and Hurricane2025). Nevertheless, the perturbation evolution in these experiments would be influenced by processes such as material phase transition and plasma diffusion, making it challenging to isolate the contribution of RMI to the perturbation growth. Besides the laser-driven experiments, there are a few shock-tube experiments on RMI at a light–heavy interface with
 $M \ge 2.0$
. Using a solid membrane with wire support to separate different gases, Sadot et al. (Reference Sadot, Rikanati, Oron, Ben-Dor and Shvarts2003) investigated the evolution of an air–
$M \ge 2.0$
. Using a solid membrane with wire support to separate different gases, Sadot et al. (Reference Sadot, Rikanati, Oron, Ben-Dor and Shvarts2003) investigated the evolution of an air–
 $\mathrm {SF}_6$
interface impacted by a shock wave with
$\mathrm {SF}_6$
interface impacted by a shock wave with
 $M=2$
. However, the wire support may affect the perturbation evolution. Additionally, Motl et al. (Reference Motl, Oakley, Ranjan, Weber, Anderson and Bonazza2009) studied the development of membraneless quasi-single-mode light–heavy interfaces accelerated by shock waves with
$M=2$
. However, the wire support may affect the perturbation evolution. Additionally, Motl et al. (Reference Motl, Oakley, Ranjan, Weber, Anderson and Bonazza2009) studied the development of membraneless quasi-single-mode light–heavy interfaces accelerated by shock waves with
 $M$
up to 2.86. They observed bubble flattening, slip line generation, and a reduction in the linear amplitude growth rate compared with the impulsive model prediction. This reduction was attributed to the effect of the diffusion layer. There are other experiments with
$M$
up to 2.86. They observed bubble flattening, slip line generation, and a reduction in the linear amplitude growth rate compared with the impulsive model prediction. This reduction was attributed to the effect of the diffusion layer. There are other experiments with
 $M\sim 3$
that have been conducted by the Wisconsin team (Puranik et al. Reference Puranik, Oakley, Anderson and Bonazza2004; Ranjan et al. Reference Ranjan, Anderson, Oakley and Bonazza2005, Reference Ranjan, Niederhaus, Motl, Anderson, Oakley and Bonazza2007). For instance, they investigated the evolution of soap-film gas bubbles (Ranjan et al. Reference Ranjan, Anderson, Oakley and Bonazza2005, Reference Ranjan, Niederhaus, Motl, Anderson, Oakley and Bonazza2007) and quasi-single-mode heavy-light interfaces (Puranik et al. Reference Puranik, Oakley, Anderson and Bonazza2004). While these studies provide valuable insights, desirable experimental research on strong-shock RMI at a single-mode light–heavy interface remains lacking until now.
$M\sim 3$
that have been conducted by the Wisconsin team (Puranik et al. Reference Puranik, Oakley, Anderson and Bonazza2004; Ranjan et al. Reference Ranjan, Anderson, Oakley and Bonazza2005, Reference Ranjan, Niederhaus, Motl, Anderson, Oakley and Bonazza2007). For instance, they investigated the evolution of soap-film gas bubbles (Ranjan et al. Reference Ranjan, Anderson, Oakley and Bonazza2005, Reference Ranjan, Niederhaus, Motl, Anderson, Oakley and Bonazza2007) and quasi-single-mode heavy-light interfaces (Puranik et al. Reference Puranik, Oakley, Anderson and Bonazza2004). While these studies provide valuable insights, desirable experimental research on strong-shock RMI at a single-mode light–heavy interface remains lacking until now.
Richtmyer–Meshkov instability at a small-amplitude single-mode light–heavy interface is the basic RMI scenario: free from high-order initial modes, phase inversion, and high-initial-amplitude effect. Furthermore, although the evolution of weak-shock RMI has been widely explored previously, whether and how strong flow compressibility affects the RMI evolution remains unclear. Therefore, investigating the strong-shock RMI at a small-amplitude single-mode light–heavy interface is of great significance. The present study aims to explore the evolution law of this phenomenon and the underlying mechanisms through fine shock-tube experiments, thereby establishing the foundation for related research and paving the way toward understanding the underlying physics of strong-shock RMI in real scenarios such as ICF.
2. Experimental methods
Richtmyer–Meshkov instability is highly sensitive to initial conditions (Zhou Reference Zhou2017
a,b, Reference Zhou2024). Therefore, to conduct a desirable RMI experiment, both the shock and interface generation methods are crucial. The experiments are conducted in a shock-tube facility with a length of approximately 16 m, as illustrated in figure 1(a). This facility is capable of generating planar shocks with
 $M \gt 3.0$
while maintaining a ‘clean’ experimental flow. The fundamental mechanism used in the facility to generate a strong shock is that the shock intensity increases with the reduction of the shock cross-sectional area (Zhai et al. Reference Zhai, Liu, Qin, Yang and Luo2010; Zhan et al. Reference Zhan, Li, Yang, Zhu and Yang2018). The contraction of the shock cross-sectional area is realized through the convergence section, whose wall profile is designed using geometrical shock dynamics. The convergence section can smoothly transform a planar shock wave into a cylindrical convergent shock and then back again into a planar shock, as shown in figure 1(b). During this process, the shock cross-sectional area decreases continuously, thus realizing the generation of strong shock waves with
$M \gt 3.0$
while maintaining a ‘clean’ experimental flow. The fundamental mechanism used in the facility to generate a strong shock is that the shock intensity increases with the reduction of the shock cross-sectional area (Zhai et al. Reference Zhai, Liu, Qin, Yang and Luo2010; Zhan et al. Reference Zhan, Li, Yang, Zhu and Yang2018). The contraction of the shock cross-sectional area is realized through the convergence section, whose wall profile is designed using geometrical shock dynamics. The convergence section can smoothly transform a planar shock wave into a cylindrical convergent shock and then back again into a planar shock, as shown in figure 1(b). During this process, the shock cross-sectional area decreases continuously, thus realizing the generation of strong shock waves with
 $M = 3.20\pm 0.05$
.
$M = 3.20\pm 0.05$
.
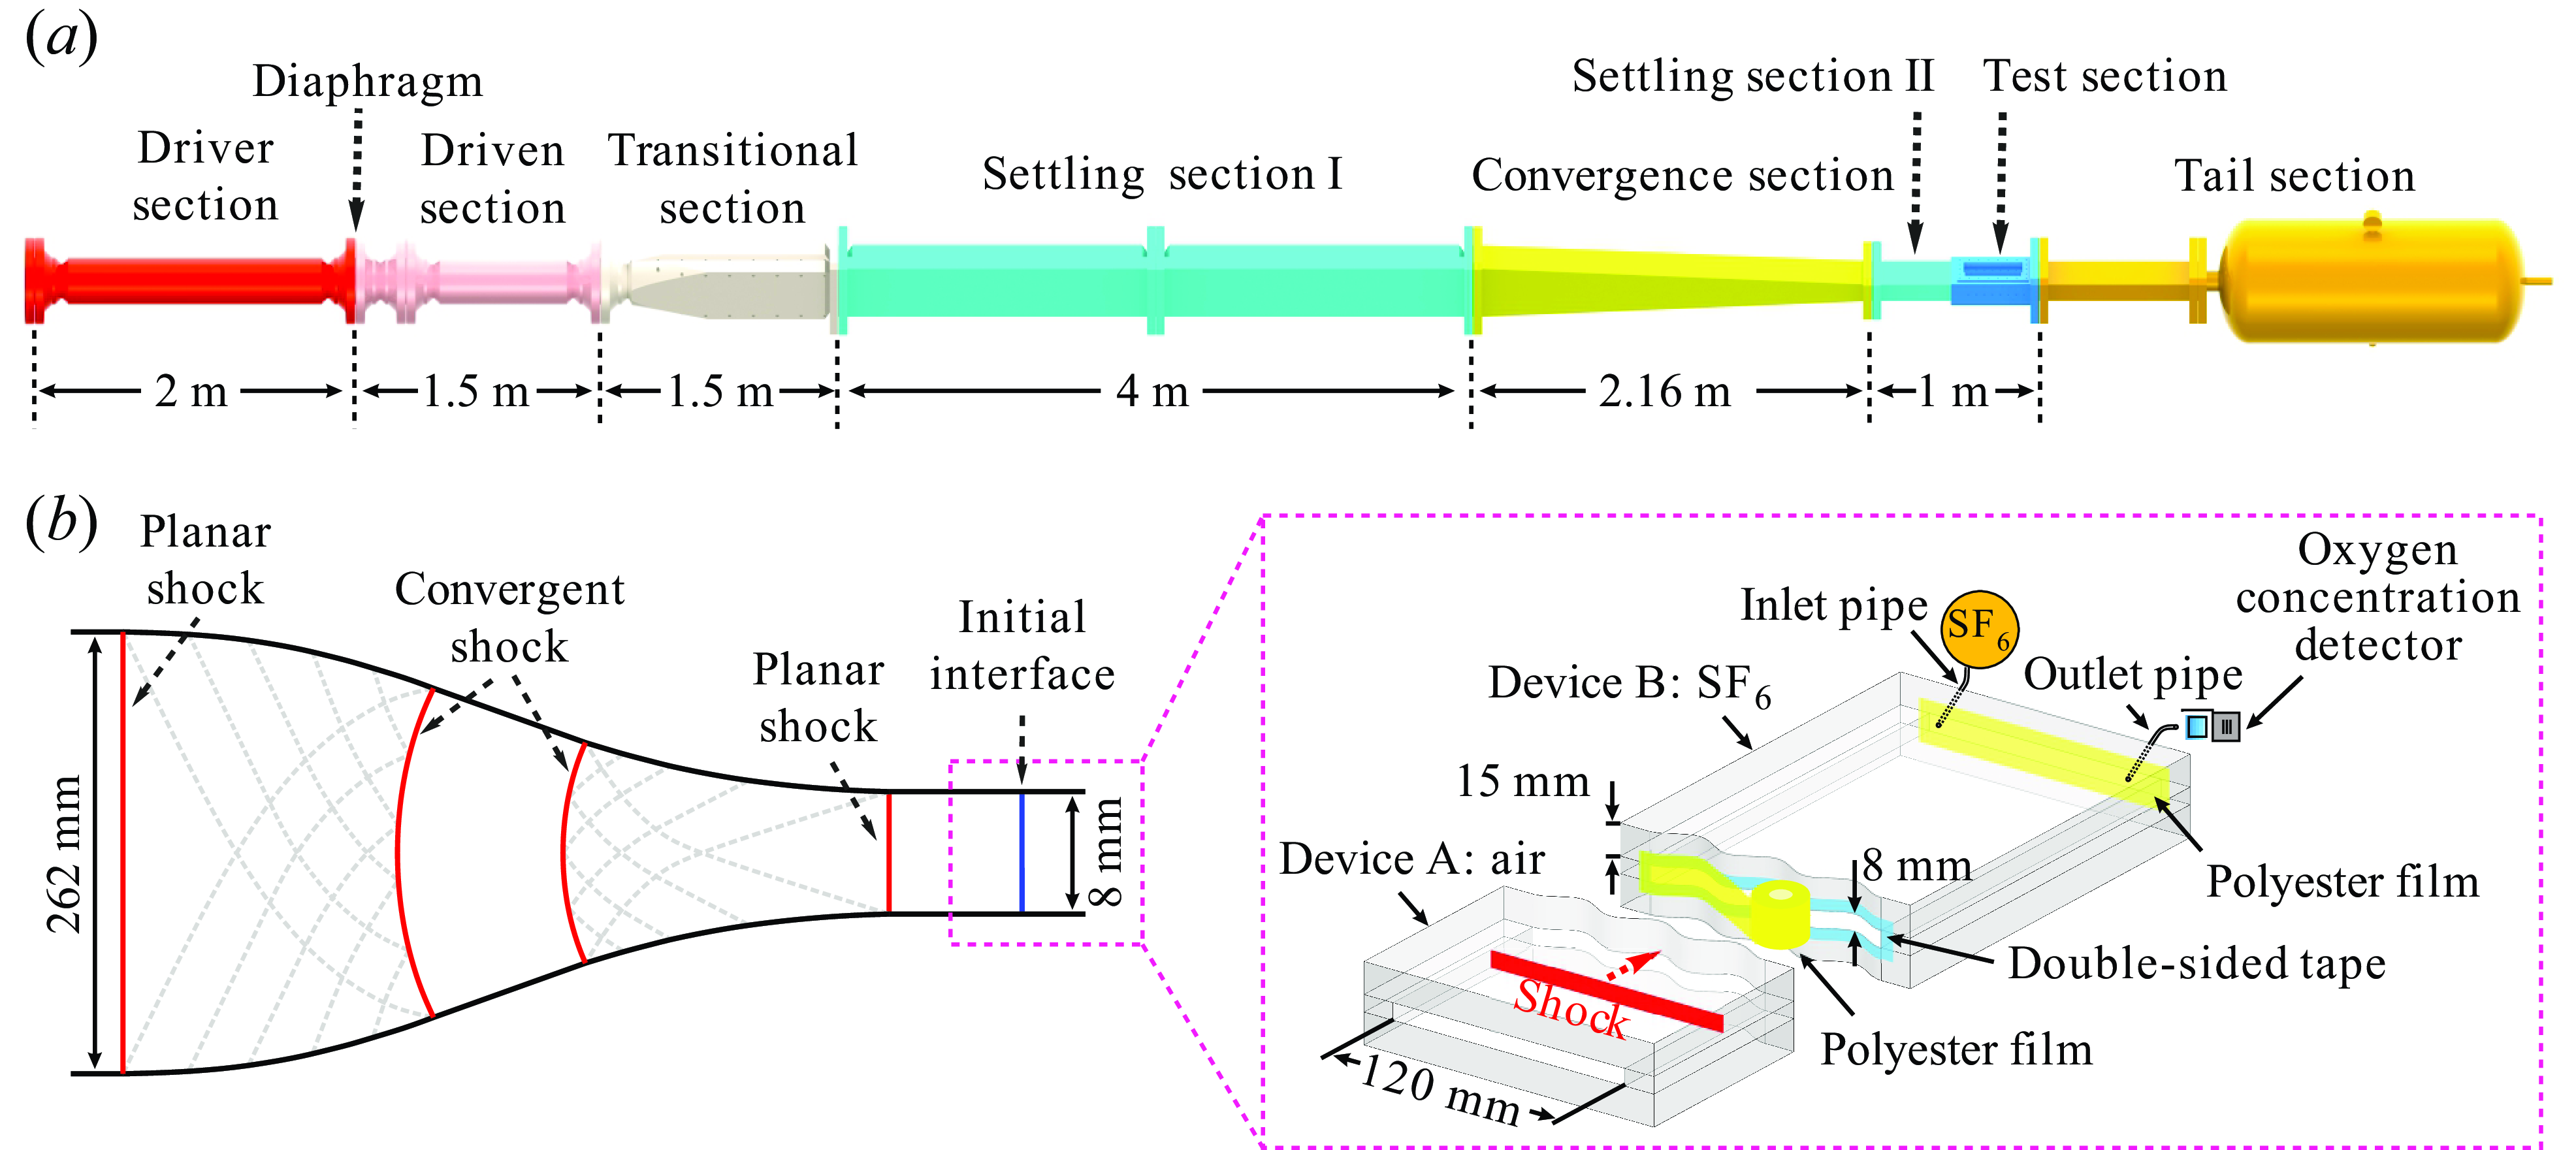
Figure 1. Sketches of the shock-tube facility (a), the shock convergence process and the interface formation process (b). The inner cross-section of the test section is 120 mm
 $\times$
8 mm.
$\times$
8 mm.
In our previous studies on weak-shock RMI (Liu et al. Reference Liu, Liang, Ding, Liu and Luo2018; Chen et al. Reference Chen, Xing, Wang, Zhai and Luo2023), the volume capacity of the driver section is small (1850 cm
 $^3$
) and the gas pressure when the diaphragm separating the driver and driven sections ruptures is low (304 kPa, for example). Accordingly, the inflation time it takes from the start of gas inflation to the generation of shock wave is short (less than 1 min). This allows the use of the soap film, which is free of grid support and diffusion layer but has a short maintainable time (generally less than 5 min), to form well-defined desirable initial interfaces. In contrast, the current shock-tube facility has a driver section with a large volume capacity (62 800 cm
$^3$
) and the gas pressure when the diaphragm separating the driver and driven sections ruptures is low (304 kPa, for example). Accordingly, the inflation time it takes from the start of gas inflation to the generation of shock wave is short (less than 1 min). This allows the use of the soap film, which is free of grid support and diffusion layer but has a short maintainable time (generally less than 5 min), to form well-defined desirable initial interfaces. In contrast, the current shock-tube facility has a driver section with a large volume capacity (62 800 cm
 $^3$
), and the gas pressure when the diaphragm ruptures exceeds 6080 kPa. Accordingly, the inflation time is long (more than 10 min). Thus, the soap-film technique is not available for present experiments. In this work, the initial single-mode air–SF
$^3$
), and the gas pressure when the diaphragm ruptures exceeds 6080 kPa. Accordingly, the inflation time is long (more than 10 min). Thus, the soap-film technique is not available for present experiments. In this work, the initial single-mode air–SF
 $_6$
interface is generated through polyester film, as illustrated in figure 1(b). Note that the solid membrane employed in previous works (Meshkov Reference Meshkov1969; Sadot et al. Reference Sadot, Rikanati, Oron, Ben-Dor and Shvarts2003) is made of nitrocellulose, which is brittle and susceptible to cracking under strain. As a result, grid support, which can significantly influence the flow evolution, was required to form the initial interface. In contrast, the polyester employed in the present study exhibits superior mechanical properties (such as tensile strength, elasticity and flexibility) compared with nitrocellulose. Moreover, the low height of the interface (8 mm) allows the profile of the polyester film to be well maintained through the constraints of the upper and lower boundaries (Jiang et al. Reference Jiang, Cai, Xie, He, Wang, Si and Luo2024), thus eliminating the need for a grid support. The thickness of the polyester film employed is 2
$_6$
interface is generated through polyester film, as illustrated in figure 1(b). Note that the solid membrane employed in previous works (Meshkov Reference Meshkov1969; Sadot et al. Reference Sadot, Rikanati, Oron, Ben-Dor and Shvarts2003) is made of nitrocellulose, which is brittle and susceptible to cracking under strain. As a result, grid support, which can significantly influence the flow evolution, was required to form the initial interface. In contrast, the polyester employed in the present study exhibits superior mechanical properties (such as tensile strength, elasticity and flexibility) compared with nitrocellulose. Moreover, the low height of the interface (8 mm) allows the profile of the polyester film to be well maintained through the constraints of the upper and lower boundaries (Jiang et al. Reference Jiang, Cai, Xie, He, Wang, Si and Luo2024), thus eliminating the need for a grid support. The thickness of the polyester film employed is 2
 $\unicode {x03BC}\rm m$
, a choice made after carefully balancing the success rate of experiments and the potential impact of polyester film on interface evolution.
$\unicode {x03BC}\rm m$
, a choice made after carefully balancing the success rate of experiments and the potential impact of polyester film on interface evolution.
The ambient pressure and temperature are 101.3
 $\pm$
0.1 kPa and 295.2
$\pm$
0.1 kPa and 295.2
 $\pm$
1.7 K, respectively. The flow evolution is diagnosed using a high-speed shadowgraph system. In comparison with the schlieren imaging method widely used in RMI studies, the shadowgraph imaging method can provide images with better contrast and higher distinguishability for the present experiments where strong pressure perturbations exist near the interface. The arrangement of the shadowgraph imaging system is identical to that in our previous work (Jiang et al. Reference Jiang, Cai, Xie, He, Wang, Si and Luo2024), involving a light source (CEL-PF300-T10), a slit to shape the light emitted from the source, one optical lens to collimate the beam, two concave mirrors with a diameter of 400 mm to convert a spherical beam to a parallel one or vice versa, two planar mirrors to direct the light vertically through the test section, and a high-speed camera (Phantom V2012). The frame rate of the high-speed video camera is set to 100 000 frames per second, with an exposure time of 1
$\pm$
1.7 K, respectively. The flow evolution is diagnosed using a high-speed shadowgraph system. In comparison with the schlieren imaging method widely used in RMI studies, the shadowgraph imaging method can provide images with better contrast and higher distinguishability for the present experiments where strong pressure perturbations exist near the interface. The arrangement of the shadowgraph imaging system is identical to that in our previous work (Jiang et al. Reference Jiang, Cai, Xie, He, Wang, Si and Luo2024), involving a light source (CEL-PF300-T10), a slit to shape the light emitted from the source, one optical lens to collimate the beam, two concave mirrors with a diameter of 400 mm to convert a spherical beam to a parallel one or vice versa, two planar mirrors to direct the light vertically through the test section, and a high-speed camera (Phantom V2012). The frame rate of the high-speed video camera is set to 100 000 frames per second, with an exposure time of 1
 $\unicode {x03BC}\rm s$
. The spatial resolution of the shadowgraphs is approximately 0.57 mm pixel
$\unicode {x03BC}\rm s$
. The spatial resolution of the shadowgraphs is approximately 0.57 mm pixel
 $^{-1}$
.
$^{-1}$
.
Table 1. Significant parameters for four experimental cases labelled by
 $ka_0$
-
$ka_0$
-
 $\lambda$
:
$\lambda$
:
 $VF$
, volume fraction of
$VF$
, volume fraction of
 $\mathrm {SF_6}$
downstream of the initial interface;
$\mathrm {SF_6}$
downstream of the initial interface;
 $A$
, post-shock Atwood number;
$A$
, post-shock Atwood number;
 $M$
, incident shock Mach number;
$M$
, incident shock Mach number;
 $v^e_{is}$
and
$v^e_{is}$
and
 $v^e_{ts}$
, experimental velocities of the incident and transmitted shocks, respectively;
$v^e_{ts}$
, experimental velocities of the incident and transmitted shocks, respectively;
 $u^e_{si}$
and
$u^e_{si}$
and
 $u^t_{si}$
, velocities of shocked interface obtained from experiments and predicted by one-dimensional gas dynamics theory, respectively.
$u^t_{si}$
, velocities of shocked interface obtained from experiments and predicted by one-dimensional gas dynamics theory, respectively.

Four sets of experiments on single-mode strong-shock RMI with different
 $ka_0$
and wavelength (
$ka_0$
and wavelength (
 $\lambda$
) combinations, referred to as cases
$\lambda$
) combinations, referred to as cases
 $ka_0$
-
$ka_0$
-
 $\lambda$
for clarity, are performed. The significant parameters for these experiments are presented in table 1. For the cases with
$\lambda$
for clarity, are performed. The significant parameters for these experiments are presented in table 1. For the cases with
 $ka_0=0.157$
, the small-amplitude criterion (
$ka_0=0.157$
, the small-amplitude criterion (
 $ka\ll1$
, where a denotes the perturbation amplitude) is sufficiently satisfied, ensuring accurate capture of the linear perturbation evolution and effective examination of linear models. In contrast, for the case 0.314-40, a relatively large
$ka\ll1$
, where a denotes the perturbation amplitude) is sufficiently satisfied, ensuring accurate capture of the linear perturbation evolution and effective examination of linear models. In contrast, for the case 0.314-40, a relatively large
 $ka_0$
enables a comprehensive capture of the perturbation evolution from the linear to nonlinear stages and an effective evaluation of the nonlinear models. The volume fraction of
$ka_0$
enables a comprehensive capture of the perturbation evolution from the linear to nonlinear stages and an effective evaluation of the nonlinear models. The volume fraction of
 $\mathrm {SF_6}$
downstream of the initial interface is determined by matching the velocities of transmitted shock obtained from experiments and predicted by one-dimensional gas dynamics theory (
$\mathrm {SF_6}$
downstream of the initial interface is determined by matching the velocities of transmitted shock obtained from experiments and predicted by one-dimensional gas dynamics theory (
 $v^e_{ts}$
and
$v^e_{ts}$
and
 $v^t_{ts}$
). When
$v^t_{ts}$
). When
 $v^t_{ts}$
matches
$v^t_{ts}$
matches
 $v^e_{ts}$
, the maximum discrepancy between the experimental and theoretical velocities of the shocked interface is less than 3 % across all four cases, indicating that the polyester film employed for interface generation has a limited effect on the experimental flow.
$v^e_{ts}$
, the maximum discrepancy between the experimental and theoretical velocities of the shocked interface is less than 3 % across all four cases, indicating that the polyester film employed for interface generation has a limited effect on the experimental flow.
To estimate the thickness of the boundary layer developing along the wall at the interface region, the following formula proposed by Mirels (Reference Mirels1956) is used:
 \begin{equation} \delta ^*=\sqrt {\frac {2 \mu _w x}{\rho _w v_w}} \sqrt {\frac {2}{\pi }}\left (\frac {v_{ts}}{v_w}-1\right ), \end{equation}
where
 $\delta ^*$
represents the boundary-layer displacement thickness at the interface;
$\delta ^*$
represents the boundary-layer displacement thickness at the interface;
 $\mu _w$
and
$\mu _w$
and
 $\rho _w$
are the viscosity and density of the shocked gas, respectively;
$\rho _w$
are the viscosity and density of the shocked gas, respectively;
 $x$
is the distance between the interface and the transmitted shock;
$x$
is the distance between the interface and the transmitted shock;
 $v_{ts}$
and
$v_{ts}$
and
 $v_w$
are the velocity of the transmitted shock and its relative velocity with respect to the interface, respectively. Here,
$v_w$
are the velocity of the transmitted shock and its relative velocity with respect to the interface, respectively. Here,
 $M$
and the ambient temperature are taken as 3.20 and 295.0 K, respectively. The gases upstream and downstream of the initial interface are regarded as pure air and pure
$M$
and the ambient temperature are taken as 3.20 and 295.0 K, respectively. The gases upstream and downstream of the initial interface are regarded as pure air and pure
 $\mathrm {SF}_6$
, respectively. Accordingly,
$\mathrm {SF}_6$
, respectively. Accordingly,
 $\mu _w$
and
$\mu _w$
and
 $\rho _w$
for the shocked air (
$\rho _w$
for the shocked air (
 $\mathrm {SF}_6$
) are 4.4107
$\mathrm {SF}_6$
) are 4.4107
 $\times 10^{-5}\, \rm Pa\, s$
(
$\times 10^{-5}\, \rm Pa\, s$
(
 $2.77\times 10^{-5}\, \rm Pa\, s$
) and 7.39
$2.77\times 10^{-5}\, \rm Pa\, s$
) and 7.39
 $\rm kg {\, m}^{-3}$
(66.31
$\rm kg {\, m}^{-3}$
(66.31
 $\rm kg {\, \rm m}^{-3}$
), respectively. The values of
$\rm kg {\, \rm m}^{-3}$
), respectively. The values of
 $v_{ts}$
and
$v_{ts}$
and
 $v_w$
calculated using one-dimensional gas dynamics are 616.91
$v_w$
calculated using one-dimensional gas dynamics are 616.91
 $\rm m\, {s}^{-1}$
and 56.14
$\rm m\, {s}^{-1}$
and 56.14
 $\rm m\, {s}^{-1}$
, respectively. For
$\rm m\, {s}^{-1}$
, respectively. For
 $x$
, its maximum value in experiments (30 mm) is used for calculation. Under such conditions,
$x$
, its maximum value in experiments (30 mm) is used for calculation. Under such conditions,
 $\delta ^*$
in air and
$\delta ^*$
in air and
 $\mathrm { SF}_6$
are calculated to be approximately 0.64 and 0.17 mm, respectively, which are significantly smaller than the width and height of the flow cross-section (120 and 8 mm). This indicates that the effect of the boundary layer on the interface evolution is limited.
$\mathrm { SF}_6$
are calculated to be approximately 0.64 and 0.17 mm, respectively, which are significantly smaller than the width and height of the flow cross-section (120 and 8 mm). This indicates that the effect of the boundary layer on the interface evolution is limited.
3. Flow features under strong-shock conditions
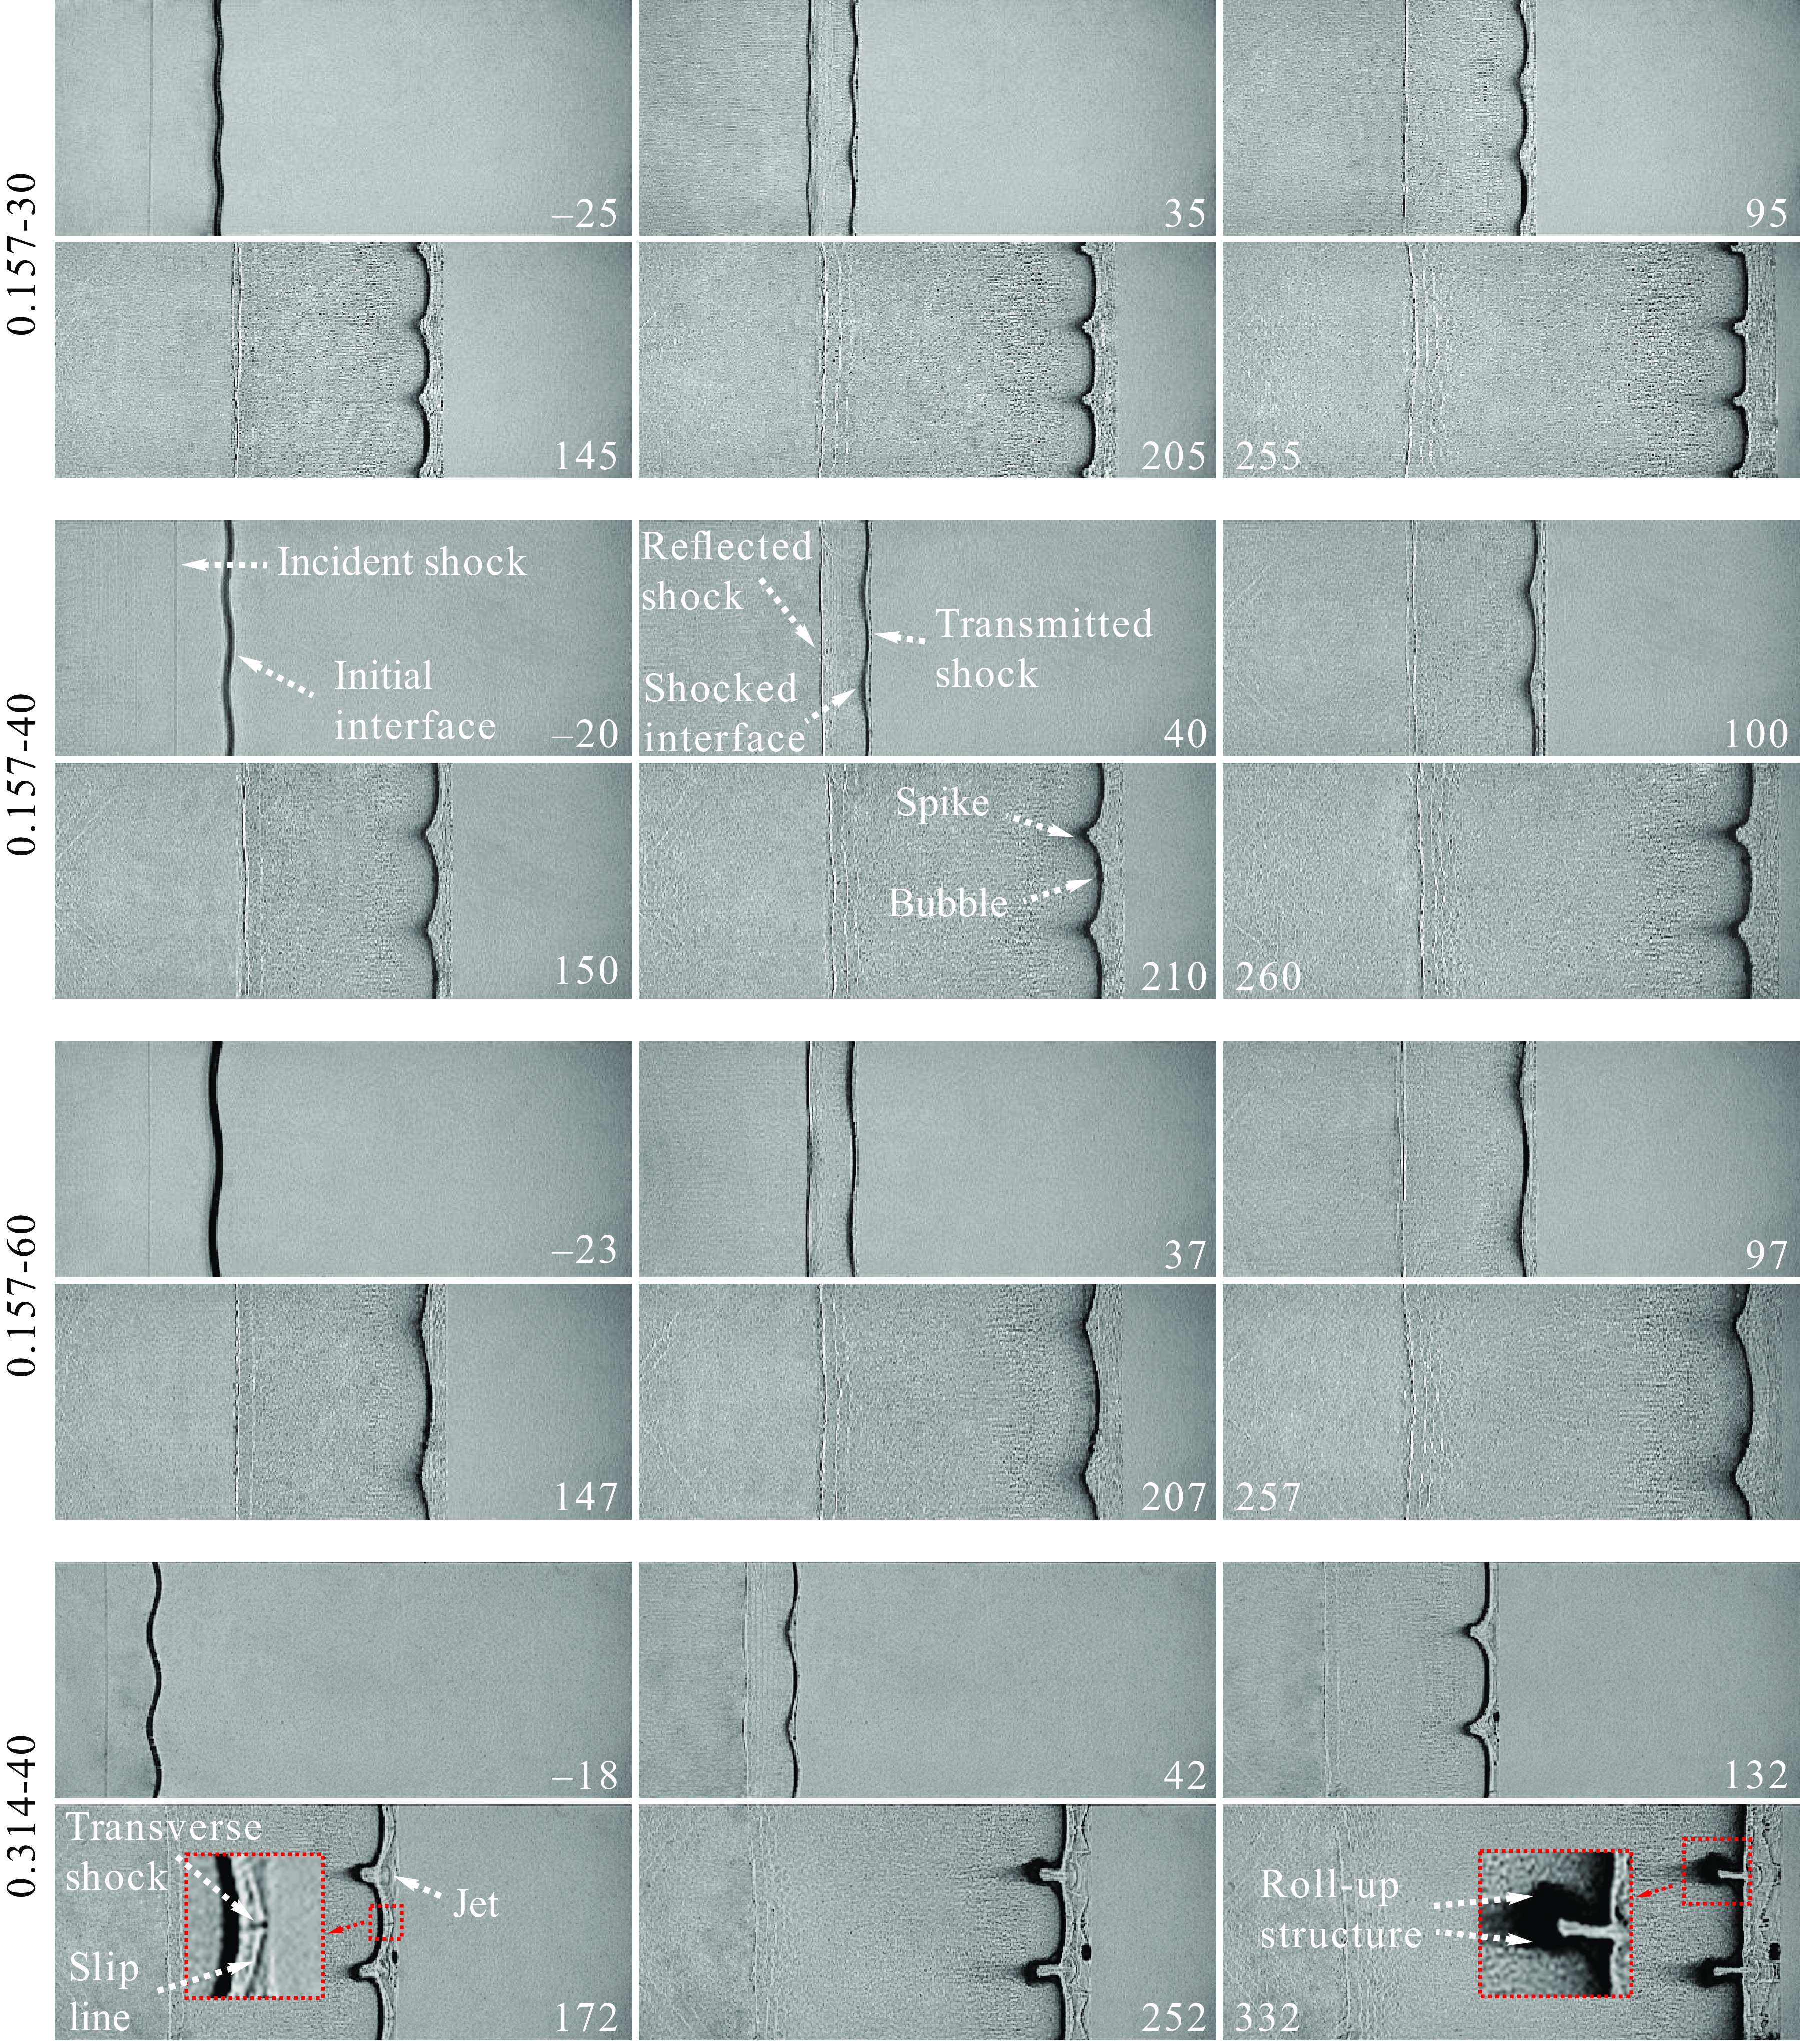
Figure 2. Experimental shadowgraphs of the evolution of single-mode air–SF
 $_6$
interfaces accelerated by a strong shock wave. Numbers represent time in
$_6$
interfaces accelerated by a strong shock wave. Numbers represent time in
 $\mu$
s.
$\mu$
s.
Experimental shadowgraphs of the evolution of single-mode air–
 $\mathrm {SF}_6$
interfaces accelerated by a strong shock wave are shown in figure 2. The temporal origin (
$\mathrm {SF}_6$
interfaces accelerated by a strong shock wave are shown in figure 2. The temporal origin (
 $t= 0$
 $\unicode{x03BC}\rm s$
) is defined as the moment when the incident shock reaches the mean position of the initial interface. Note that the observation area (97 mm in width) is narrower than the flow field (120 mm in width), i.e. the boundary of the shadowgraphs is not that of the flow field. Moreover, since the air upstream of the post-shock polyester-film interface is at a high temperature (1030 K) and oxygen-rich, the pyrolysis and combustion of the polyester occur instantaneously (Martín-Gullón et al. Reference Martín-Gullón, Esperanza and Font2001). Therefore, instead of breaking into ‘flaps’ like the nitrocellulose in weak-shock RMI experiments, the polyester film transforms into various gases in the present experiments. Due to the small thickness of the polyester film (2
$\unicode{x03BC}\rm s$
) is defined as the moment when the incident shock reaches the mean position of the initial interface. Note that the observation area (97 mm in width) is narrower than the flow field (120 mm in width), i.e. the boundary of the shadowgraphs is not that of the flow field. Moreover, since the air upstream of the post-shock polyester-film interface is at a high temperature (1030 K) and oxygen-rich, the pyrolysis and combustion of the polyester occur instantaneously (Martín-Gullón et al. Reference Martín-Gullón, Esperanza and Font2001). Therefore, instead of breaking into ‘flaps’ like the nitrocellulose in weak-shock RMI experiments, the polyester film transforms into various gases in the present experiments. Due to the small thickness of the polyester film (2
 $\unicode {x03BC}\rm m$
), the effect of the reaction products on the flow evolution is negligible.
$\unicode {x03BC}\rm m$
), the effect of the reaction products on the flow evolution is negligible.
To illustrate the general flow evolution process of the cases with
 $ka_0=0.157$
, the case 0.157-40 is detailed as an example. When the incident shock interacts with the initial interface, a transmitted shock and a reflected shock are generated. In contrast to weak-shock RMI (Liu et al. Reference Liu, Liang, Ding, Liu and Luo2018), the transmitted shock remains close to the shocked interface throughout the experiment, and the reflected shock also moves downstream as the flow Mach number of the region ahead (1.42) exceeds the shock’s Mach number (1.31). After the shock-interface interaction, the shocked interface starts to evolve, initially maintaining a single-mode shape (40
$ka_0=0.157$
, the case 0.157-40 is detailed as an example. When the incident shock interacts with the initial interface, a transmitted shock and a reflected shock are generated. In contrast to weak-shock RMI (Liu et al. Reference Liu, Liang, Ding, Liu and Luo2018), the transmitted shock remains close to the shocked interface throughout the experiment, and the reflected shock also moves downstream as the flow Mach number of the region ahead (1.42) exceeds the shock’s Mach number (1.31). After the shock-interface interaction, the shocked interface starts to evolve, initially maintaining a single-mode shape (40
 $\unicode{x03BC}\rm s$
) and gradually becoming asymmetric (100
$\unicode{x03BC}\rm s$
) and gradually becoming asymmetric (100
 $\unicode {x03BC}\rm s$
). Subsequently, apparent spike and bubble structures emerge (210
$\unicode {x03BC}\rm s$
). Subsequently, apparent spike and bubble structures emerge (210
 $\unicode {x03BC}$
s), with the bubbles flattening and the spikes sharpening. At
$\unicode {x03BC}$
s), with the bubbles flattening and the spikes sharpening. At
 $t= 260$
 $\unicode {x03BC}\rm s$
, no roll-up structure forms at the spikes, indicating that the shocked interface remains in the weakly nonlinear evolution phase.
$\unicode {x03BC}\rm s$
, no roll-up structure forms at the spikes, indicating that the shocked interface remains in the weakly nonlinear evolution phase.
For the case 0.314-40, the shocked interface evolves fast and deviates from a single-mode profile rapidly. The disturbed transmitted shock evolves to form Mach reflection structures containing transverse shocks and slip lines (172
 $\unicode {x03BC}\rm s$
). The transverse shocks sweep through the interface and interact with each other at the heads of bubbles, causing further flattening of the bubbles. Additionally, downstream-directed jets resulting from the interactions of slip lines are formed (172
$\unicode {x03BC}\rm s$
). The transverse shocks sweep through the interface and interact with each other at the heads of bubbles, causing further flattening of the bubbles. Additionally, downstream-directed jets resulting from the interactions of slip lines are formed (172
 $\unicode {x03BC}\rm s$
), which is a typical phenomenon of strong Mach reflection (Henderson et al. Reference Henderson, Vasilev, Ben-Dor and Elperin2003). In the late stage (332
$\unicode {x03BC}\rm s$
), which is a typical phenomenon of strong Mach reflection (Henderson et al. Reference Henderson, Vasilev, Ben-Dor and Elperin2003). In the late stage (332
 $\unicode {x03BC}\rm s$
), after multiple impacts from transverse shocks, the bubble heads become nearly flat and their connections to the other parts of the shocked interface become sharp. Furthermore, significant roll-up structures form at the spike heads, with their overall profile being distinguishable. However, the detailed vortices are difficult to identify due to intense mixing. At this stage, the interface profile becomes highly irregular, markedly different from that observed in weak-shock RMI (Liu et al. Reference Liu, Liang, Ding, Liu and Luo2018) where the profile of the shocked interface remains smooth and the bubble front maintains a curved shape.
$\unicode {x03BC}\rm s$
), after multiple impacts from transverse shocks, the bubble heads become nearly flat and their connections to the other parts of the shocked interface become sharp. Furthermore, significant roll-up structures form at the spike heads, with their overall profile being distinguishable. However, the detailed vortices are difficult to identify due to intense mixing. At this stage, the interface profile becomes highly irregular, markedly different from that observed in weak-shock RMI (Liu et al. Reference Liu, Liang, Ding, Liu and Luo2018) where the profile of the shocked interface remains smooth and the bubble front maintains a curved shape.
4. Linear, nonlinear and modal evolutions of perturbations
4.1. Linear amplitude growth
In the present experiments,
 $M$
reaches
$M$
reaches
 $3.20\pm 0.05$
and the gas on one side of the interface (SF
$3.20\pm 0.05$
and the gas on one side of the interface (SF
 $_6$
) is highly compressible. According to previous studies (Mikaelian Reference Mikaelian1994; Yang, Zhang & Sharp Reference Yang, Zhang and Sharp1994), these experiments are suitable for evaluating the validity of the impulsive model and Richtmyer theory to predict the linear amplitude growth rate (
$_6$
) is highly compressible. According to previous studies (Mikaelian Reference Mikaelian1994; Yang, Zhang & Sharp Reference Yang, Zhang and Sharp1994), these experiments are suitable for evaluating the validity of the impulsive model and Richtmyer theory to predict the linear amplitude growth rate (
 $\dot {a}_l$
) in highly compressible flows.
$\dot {a}_l$
) in highly compressible flows.
The experimental
 $\dot {a}_l$
(
$\dot {a}_l$
(
 $\dot {a}_l^e$
) is obtained by linearly fitting the early-time amplitude variation extracted from experiments. The impulsive model can be written as
$\dot {a}_l^e$
) is obtained by linearly fitting the early-time amplitude variation extracted from experiments. The impulsive model can be written as
 \begin{equation} \dot {a}_l^i = ka_1Au^e_{si}. \end{equation}
Here,
 $a_1=a_0[1 - (u^e_{si}/v^e_{is})]$
is the post-shock amplitude, with
$a_1=a_0[1 - (u^e_{si}/v^e_{is})]$
is the post-shock amplitude, with
 $u^e_{si}$
and
$u^e_{si}$
and
 $v^e_{is}$
representing the experimental velocities of the shocked interface and incident shock, respectively, and
$v^e_{is}$
representing the experimental velocities of the shocked interface and incident shock, respectively, and
 $A$
is the post-shock Atwood number. The Richtmyer theory lacks an analytical solution and involves a number of nonlinear equations requiring to be solved numerically. Details on this theory can be found in the pioneering works of Richtmyer (Reference Richtmyer1960) and Yang et al. (Reference Yang, Zhang and Sharp1994). The values of
$A$
is the post-shock Atwood number. The Richtmyer theory lacks an analytical solution and involves a number of nonlinear equations requiring to be solved numerically. Details on this theory can be found in the pioneering works of Richtmyer (Reference Richtmyer1960) and Yang et al. (Reference Yang, Zhang and Sharp1994). The values of
 $\dot {a}_l^e$
,
$\dot {a}_l^e$
,
 $\dot {a}_l^i$
and
$\dot {a}_l^i$
and
 $\dot {a}_l$
predicted by the Richtmyer theory (
$\dot {a}_l$
predicted by the Richtmyer theory (
 $\dot {a}_l^{R}$
) for different cases are provided in table 2 for comparison. The results indicate that the impulsive model significantly overestimates
$\dot {a}_l^{R}$
) for different cases are provided in table 2 for comparison. The results indicate that the impulsive model significantly overestimates
 $\dot {a}_l^e$
even when
$\dot {a}_l^e$
even when
 $ka_0$
adequately satisfies the small-amplitude criterion. In contrast, the Richtmyer theory provides reasonable predictions for all cases. To the best of our knowledge, this is the first direct experimental confirmation of the validity of the Richtmyer theory and the failure of the impulsive model for predicting the linear amplitude evolution in highly compressible flows.
$ka_0$
adequately satisfies the small-amplitude criterion. In contrast, the Richtmyer theory provides reasonable predictions for all cases. To the best of our knowledge, this is the first direct experimental confirmation of the validity of the Richtmyer theory and the failure of the impulsive model for predicting the linear amplitude evolution in highly compressible flows.
Table 2. Comparison of experimental linear amplitude growth rates (
 $\dot {a}_l^e$
) with corresponding impulsive model predictions (
$\dot {a}_l^e$
) with corresponding impulsive model predictions (
 $\dot {a}_l^i$
) and Richtmyer theory predictions (
$\dot {a}_l^i$
) and Richtmyer theory predictions (
 $\dot {a}_l^R$
). Here,
$\dot {a}_l^R$
). Here,
 $E^{i/R}=(\dot {a}_{l}^{i/R}-\dot {a}_{l}^{e})/\dot {a}_{l}^{e}$
is the relative error between
$E^{i/R}=(\dot {a}_{l}^{i/R}-\dot {a}_{l}^{e})/\dot {a}_{l}^{e}$
is the relative error between
 $\dot {a}_{l}^{i/R}$
and
$\dot {a}_{l}^{i/R}$
and
 $\dot {a}_{l}^{e}$
.
$\dot {a}_{l}^{e}$
.

4.2. Nonlinear amplitude evolution
As the perturbation evolves into the nonlinear stage, the interface becomes markedly asymmetric, and the bubble and spike exhibit significantly different evolution behaviours. The overall interface amplitude
 $a$
is determined by extracting the horizontal coordinates of the tips of the spike and bubble. To extract the amplitudes of the bubble and spike (
$a$
is determined by extracting the horizontal coordinates of the tips of the spike and bubble. To extract the amplitudes of the bubble and spike (
 $a_{b}$
and
$a_{b}$
and
 $a_{s}$
), the mean positions of the shocked interface in the early stages and
$a_{s}$
), the mean positions of the shocked interface in the early stages and
 $u^e_{si}$
are first obtained through Fourier analysis. On this basis, the mean positions of the shocked interface in the latter stages are computed, thus realizing the determination of
$u^e_{si}$
are first obtained through Fourier analysis. On this basis, the mean positions of the shocked interface in the latter stages are computed, thus realizing the determination of
 $a_{b}$
and
$a_{b}$
and
 $a_{s}$
throughout the interface evolution. Since nonlinear models are generally initialized with
$a_{s}$
throughout the interface evolution. Since nonlinear models are generally initialized with
 $\dot {a}_l$
, the experimental data within the start-up period (i.e. amplitude growth rate rises from zero and gradually reaches
$\dot {a}_l$
, the experimental data within the start-up period (i.e. amplitude growth rate rises from zero and gradually reaches
 $\dot {a}_l$
under the drive of pressure perturbations) (Lombardini & Pullin Reference Lombardini and Pullin2009) needs to be excluded to facilitate comparison with nonlinear model predictions. The temporal variations of
$\dot {a}_l$
under the drive of pressure perturbations) (Lombardini & Pullin Reference Lombardini and Pullin2009) needs to be excluded to facilitate comparison with nonlinear model predictions. The temporal variations of
 $a$
and
$a$
and
 $a_{b/s}$
in dimensionless form are illustrated in figures 3(a) and 3(b), respectively. Here,
$a_{b/s}$
in dimensionless form are illustrated in figures 3(a) and 3(b), respectively. Here,
 $t$
,
$t$
,
 $a$
and
$a$
and
 $a_{b/s}$
are normalized as
$a_{b/s}$
are normalized as
 $\tau=k \dot {a}_{l}^{e}(t - t^*)$
,
$\tau=k \dot {a}_{l}^{e}(t - t^*)$
,
 $\alpha=k(a - a^*)$
, and
$\alpha=k(a - a^*)$
, and
 $\alpha _{b/s}=k(a_{b/s} - a^*_{b/s})$
, respectively, in which
$\alpha _{b/s}=k(a_{b/s} - a^*_{b/s})$
, respectively, in which
 $t^*$
is the duration of the start-up period, with
$t^*$
is the duration of the start-up period, with
 $a^*$
and
$a^*$
and
 $a^*_{b/s}$
being the corresponding
$a^*_{b/s}$
being the corresponding
 $a$
and
$a$
and
 $a_{b/s}$
at
$a_{b/s}$
at
 $t$
=
$t$
=
 $t^*$
, respectively. Note that
$t^*$
, respectively. Note that
 $t^*$
is obtained via visual observations of the extracted experimental amplitude evolution. This scaling approach, widely adopted in studies on weak-shock RMI (Zhou Reference Zhou2017
a,b), collapses the results of all four cases, indicating that strong-shock RMI at a small-amplitude single-mode interface follows a similar evolution law.
$t^*$
is obtained via visual observations of the extracted experimental amplitude evolution. This scaling approach, widely adopted in studies on weak-shock RMI (Zhou Reference Zhou2017
a,b), collapses the results of all four cases, indicating that strong-shock RMI at a small-amplitude single-mode interface follows a similar evolution law.

Figure 3. Temporal variations of perturbation amplitude in dimensionless form: (a) overall interface, (b) bubble and spike.
Typical nonlinear models, including the ZS, SEA, MIK, DR (Dimonte & Ramaprabhu Reference Dimonte and Ramaprabhu2010), and ZG models, are considered for evaluation. These models have been examined widely in research on weak-shock RMI (Zhou Reference Zhou2017a,b, Reference Zhou2024). However, their applicability to RMI in highly compressible flow remains unclear. Each model considered exhibits similar predictions across different cases. Accordingly, for each model, only three theoretical lines, corresponding to the overall interface, bubble and spike, respectively, are presented in figure 3 for comparison. For the overall interface, the ZS, SEA and DR models overestimate its amplitude growth, whereas the MIK and ZG models offer reasonable predictions. For the bubble, its early-time growth is slower than the model predictions due to the shock proximity effect (Sadot et al. Reference Sadot, Rikanati, Oron, Ben-Dor and Shvarts2003): the transmitted shock remains close to the shocked interface for a relatively long duration, inhibiting the evolution of the bubbles and flattening them. Subsequently, under the effect of the pressure perturbations introduced by transverse shocks, i.e. the secondary compression effect, the bubble growth saturates. All considered nonlinear models overestimate the bubble evolution since they do not consider these two effects. For the spike, the amplitude growth rate is relatively high due to the spike acceleration effect (Dimonte & Ramaprabhu Reference Dimonte and Ramaprabhu2010): high-order harmonics concentrate on the spike under high
 $A$
conditions (
$A$
conditions (
 $A\approx 0.8$
in present work), promoting its evolution. The MIK and ZG models significantly underestimate the spike growth because they do not account for the spike acceleration effect. Therefore, the seemingly reasonable prediction of the MIK and ZG models for the overall amplitude evolution results from compensating errors in their overestimation of bubble growth and underestimation of spike evolution. The SEA model overestimates the spike evolution due to its significant overestimation of the spike acceleration effect (Dimonte & Ramaprabhu Reference Dimonte and Ramaprabhu2010; Chen et al. Reference Chen, Xing, Wang, Zhai and Luo2023). For the ZS model, it slightly overestimates the spike evolution at late stage because its spike acceleration term is overly sensitive to
$A\approx 0.8$
in present work), promoting its evolution. The MIK and ZG models significantly underestimate the spike growth because they do not account for the spike acceleration effect. Therefore, the seemingly reasonable prediction of the MIK and ZG models for the overall amplitude evolution results from compensating errors in their overestimation of bubble growth and underestimation of spike evolution. The SEA model overestimates the spike evolution due to its significant overestimation of the spike acceleration effect (Dimonte & Ramaprabhu Reference Dimonte and Ramaprabhu2010; Chen et al. Reference Chen, Xing, Wang, Zhai and Luo2023). For the ZS model, it slightly overestimates the spike evolution at late stage because its spike acceleration term is overly sensitive to
 $ka_1$
(Dimonte & Ramaprabhu Reference Dimonte and Ramaprabhu2010). In contrast, the DR model provides a reasonable prediction as it properly describes the spike acceleration (Chen et al. Reference Chen, Xing, Wang, Zhai and Luo2023).
$ka_1$
(Dimonte & Ramaprabhu Reference Dimonte and Ramaprabhu2010). In contrast, the DR model provides a reasonable prediction as it properly describes the spike acceleration (Chen et al. Reference Chen, Xing, Wang, Zhai and Luo2023).
It is challenging to rigorously describe the shock proximity and secondary compression effects on bubble evolution. Therefore, we attempt to propose an empirical model for bubble growth in highly compressible flows based on current experimental findings. The DR model effectively describes the early-time spike evolution behaviour, the dependence on
 $ka_0$
, and also the late-time amplitude growth behaviour that has been validated in previous works (Dimonte & Ramaprabhu Reference Dimonte and Ramaprabhu2010; Mansoor et al. Reference Mansoor, Dalton, Martinez, Desjardins, Charonko and Prestridge2020). Therefore, we construct an empirical bubble model (the mDR bubble model) based on the DR model. The mDR bubble model can be expressed as
$ka_0$
, and also the late-time amplitude growth behaviour that has been validated in previous works (Dimonte & Ramaprabhu Reference Dimonte and Ramaprabhu2010; Mansoor et al. Reference Mansoor, Dalton, Martinez, Desjardins, Charonko and Prestridge2020). Therefore, we construct an empirical bubble model (the mDR bubble model) based on the DR model. The mDR bubble model can be expressed as
 \begin{align} \dot {a}_{b}^{mdr}&=N_b\dot {a}_l^{e} \frac {1+\left (1 - A\right ) N_b\tau }{1+C_{b} N_b\tau +\left (1 - A\right ) F_{b}(N_b\tau )^2}K_b, \nonumber \\[5pt] \text {in which} \ \tau &=k \dot {a}_l^{e} (t-t^*), \ C_{b}=[4.5 + A+\left (2 - A\right ) k a_1 ]/4, \ F_{b}=\ 1 + A, \nonumber \\[5pt] \ N_b&=1.4e^{-M}+0.45, K_b=\frac {1}{1+e^{3[\tau -f(M)]}} \ \text {and} \ f(M)=\frac {0.6M+1}{M-1}.\end{align}
Here,
 $C_b$
and
$C_b$
and
 $F_b$
have the same expressions to those in the DR model. The ideas leading to such a model are elaborated as follows. According to the above discussions, a model capable of describing the bubble evolution under strong-shock conditions should well capture both the effects of the shock proximity and secondary compression. To describe the shock proximity effect that mainly affects the early-time amplitude evolution and is expected to be more significant when
$F_b$
have the same expressions to those in the DR model. The ideas leading to such a model are elaborated as follows. According to the above discussions, a model capable of describing the bubble evolution under strong-shock conditions should well capture both the effects of the shock proximity and secondary compression. To describe the shock proximity effect that mainly affects the early-time amplitude evolution and is expected to be more significant when
 $M$
is higher,
$M$
is higher,
 $\dot {a}_l^{e}$
adopted in the DR model is replaced by
$\dot {a}_l^{e}$
adopted in the DR model is replaced by
 $N_b\dot {a}_l^{e}$
, in which
$N_b\dot {a}_l^{e}$
, in which
 $N_b$
is a coefficient that is always smaller than 1 in magnitude and decreases with increasing
$N_b$
is a coefficient that is always smaller than 1 in magnitude and decreases with increasing
 $M$
. Then, to capture the secondary compression effect that manifests mainly at the period when interactions of transverse shocks occur, a time-dependent function
$M$
. Then, to capture the secondary compression effect that manifests mainly at the period when interactions of transverse shocks occur, a time-dependent function
 $K_b$
is incorporated into the DR model. Here,
$K_b$
is incorporated into the DR model. Here,
 $\tau$
is the dimensionless time whose origin (
$\tau$
is the dimensionless time whose origin (
 $\tau = 0$
) corresponds to the moment when the start-up evolution phase terminates and
$\tau = 0$
) corresponds to the moment when the start-up evolution phase terminates and
 $f(M)$
describes the characteristic time of the interactions of transverse shocks occurring at the bubble tips. The value of
$f(M)$
describes the characteristic time of the interactions of transverse shocks occurring at the bubble tips. The value of
 $K_b$
converges to 1 as
$K_b$
converges to 1 as
 $\tau -f(M) \rightarrow -\infty$
and to 0 as
$\tau -f(M) \rightarrow -\infty$
and to 0 as
 $\tau -f(M) \rightarrow +\infty$
, but its value changes significantly only when
$\tau -f(M) \rightarrow +\infty$
, but its value changes significantly only when
 $\tau -f(M)$
is close to 0. In other words, at approximately
$\tau -f(M)$
is close to 0. In other words, at approximately
 $\tau = f(M)$
,
$\tau = f(M)$
,
 $K_b$
varies from 1 to 0 rapidly, thus realizing the description of the secondary compression effect. The determination of
$K_b$
varies from 1 to 0 rapidly, thus realizing the description of the secondary compression effect. The determination of
 $f(M)$
is based on the observation of previous RMI research (Zhou Reference Zhou2017
a,b, Reference Zhou2024) that the secondary compression effect is negligible in the weak-shock limit and the transverse wave intersection occurs earlier when the shock intensity is higher. This indicates that
$f(M)$
is based on the observation of previous RMI research (Zhou Reference Zhou2017
a,b, Reference Zhou2024) that the secondary compression effect is negligible in the weak-shock limit and the transverse wave intersection occurs earlier when the shock intensity is higher. This indicates that
 $f(M)$
should tend to infinity as
$f(M)$
should tend to infinity as
 $M \rightarrow 1$
, and decrease as
$M \rightarrow 1$
, and decrease as
 $M$
increases. Based on these conditional restrictions on function and also the present experimental results,
$M$
increases. Based on these conditional restrictions on function and also the present experimental results,
 $f(M)$
is fitted as
$f(M)$
is fitted as
 $(0.6M+1)/(M-1)$
. As illustrated in figure 3(b), the mDR bubble model predicts the experimental results well from the early to late periods.
$(0.6M+1)/(M-1)$
. As illustrated in figure 3(b), the mDR bubble model predicts the experimental results well from the early to late periods.
4.3. Modal evolution
Modal analysis is performed to explore the modal evolution of RMI in highly compressible flows. Among the cases with
 $ka_0=0.157$
, only the case 0.157-30 is considered for clarity. The interface contours, before the roll-up structures appear, are first extracted from the experimental shadowgraphs. Then, the fast Fourier transform is applied to obtain the modal information. The modal model proposed by Zhang & Sohn (Reference Zhang and Sohn1997) (ZSM model), which has been validated for describing the modal evolution of weak-shock RMI (Liu et al. Reference Liu, Liang, Ding, Liu and Luo2018), is considered for evaluation.
$ka_0=0.157$
, only the case 0.157-30 is considered for clarity. The interface contours, before the roll-up structures appear, are first extracted from the experimental shadowgraphs. Then, the fast Fourier transform is applied to obtain the modal information. The modal model proposed by Zhang & Sohn (Reference Zhang and Sohn1997) (ZSM model), which has been validated for describing the modal evolution of weak-shock RMI (Liu et al. Reference Liu, Liang, Ding, Liu and Luo2018), is considered for evaluation.

Figure 4. Modal evolutions obtained from experiments and predicted by ZSM model. Here,
 $\alpha _1$
,
$\alpha _1$
,
 $\alpha _2$
and
$\alpha _2$
and
 $\alpha _3$
are the dimensionless amplitudes of the first three harmonics; Exp-
$\alpha _3$
are the dimensionless amplitudes of the first three harmonics; Exp-
 $\alpha _1$
, Exp-
$\alpha _1$
, Exp-
 $\alpha _2$
and Exp-
$\alpha _2$
and Exp-
 $\alpha _3$
(ZSM-
$\alpha _3$
(ZSM-
 $\alpha _1$
, ZSM-
$\alpha _1$
, ZSM-
 $\alpha _2$
and ZSM-
$\alpha _2$
and ZSM-
 $\alpha _3$
) are
$\alpha _3$
) are
 $\alpha _1$
,
$\alpha _1$
,
 $\alpha _2$
and
$\alpha _2$
and
 $\alpha _3$
obtained from experiments (predicted by ZSM model), respectively.
$\alpha _3$
obtained from experiments (predicted by ZSM model), respectively.
The temporal variations of the amplitudes of the first three harmonics (
 $a_{m1}$
,
$a_{m1}$
,
 $a_{m2}$
and
$a_{m2}$
and
 $a_{m3}$
) in dimensionless form, obtained from experiments and predicted by the ZSM model, are shown in figure 4. Here,
$a_{m3}$
) in dimensionless form, obtained from experiments and predicted by the ZSM model, are shown in figure 4. Here,
 $a_{m1}$
,
$a_{m1}$
,
 $a_{m2}$
and
$a_{m2}$
and
 $a_{m3}$
are normalized as
$a_{m3}$
are normalized as
 $\alpha _1$
=
$\alpha _1$
=
 $k(a_{m1} - a^*_{m1}$
),
$k(a_{m1} - a^*_{m1}$
),
 $\alpha _2$
=
$\alpha _2$
=
 $k(a_{m2} - a^*_{m2}$
) and
$k(a_{m2} - a^*_{m2}$
) and
 $\alpha _3$
=
$\alpha _3$
=
 $k(a_{m3} - a^*_{m3}$
), respectively, in which
$k(a_{m3} - a^*_{m3}$
), respectively, in which
 $a^*_{m1}$
,
$a^*_{m1}$
,
 $a^*_{m2}$
and
$a^*_{m2}$
and
 $a^*_{m3}$
are the corresponding
$a^*_{m3}$
are the corresponding
 $a_{m1}$
,
$a_{m1}$
,
 $a_{m2}$
and
$a_{m2}$
and
 $a_{m3}$
at
$a_{m3}$
at
 $t$
=
$t$
=
 $t^*$
, respectively. In previous work on weak-shock RMI (Liu et al. Reference Liu, Liang, Ding, Liu and Luo2018), it was found that the ZSM model reasonably describes the evolution of
$t^*$
, respectively. In previous work on weak-shock RMI (Liu et al. Reference Liu, Liang, Ding, Liu and Luo2018), it was found that the ZSM model reasonably describes the evolution of
 $\alpha _1$
(
$\alpha _1$
(
 $\alpha _2$
and
$\alpha _2$
and
 $\alpha _3$
) until
$\alpha _3$
) until
 $\tau =0.6$
(1.5). In contrast, the results for strong-shock RMI, as shown in figure 4, show that the model overestimates
$\tau =0.6$
(1.5). In contrast, the results for strong-shock RMI, as shown in figure 4, show that the model overestimates
 $\alpha _1$
while underestimating
$\alpha _1$
while underestimating
 $\alpha _2$
and
$\alpha _2$
and
 $\alpha _3$
when
$\alpha _3$
when
 $\tau \gt 0.15$
, as the interface shape is altered by the shock proximity and secondary compression effects. Specifically, these effects influence the modal amplitude variations via squeezing the bubbles. The flattening and widening of the bubbles simultaneously result in variations in the shape of the spikes, making them sharper and narrower. Note that the shape variation of the spikes does not significantly affect the positions of their tips, thus the spike amplitude evolution is less affected. The flattening of bubbles inhibits the growth of the first-order mode and results in the generation of the second-order mode that has opposite phase to the first-order mode at positions close to the bubble tips. Additionally, the sharpening of spikes results in the generation of the second- and third-order modes that have the same phase as the first-order mode at positions close to the spike tips. As a result, the ZSM model, which is proposed for RMI in incompressible flows, overestimates the development of the basic mode and underestimates the evolution of higher-order harmonics.
$\tau \gt 0.15$
, as the interface shape is altered by the shock proximity and secondary compression effects. Specifically, these effects influence the modal amplitude variations via squeezing the bubbles. The flattening and widening of the bubbles simultaneously result in variations in the shape of the spikes, making them sharper and narrower. Note that the shape variation of the spikes does not significantly affect the positions of their tips, thus the spike amplitude evolution is less affected. The flattening of bubbles inhibits the growth of the first-order mode and results in the generation of the second-order mode that has opposite phase to the first-order mode at positions close to the bubble tips. Additionally, the sharpening of spikes results in the generation of the second- and third-order modes that have the same phase as the first-order mode at positions close to the spike tips. As a result, the ZSM model, which is proposed for RMI in incompressible flows, overestimates the development of the basic mode and underestimates the evolution of higher-order harmonics.
5. Conclusions
Richtmyer–Meshkov instability at a single-mode light–heavy interface accelerated by a strong shock wave is studied experimentally in a newly developed shock-tube facility. The Mach numbers of the shock waves reach up to 3.2. Under the proximity effect of the transmitted shock and its induced secondary compression effect, the bubble development is greatly inhibited. In contrast, the spikes sharpen rapidly due to the spike acceleration occurring under high post-shock Atwood number conditions and the secondary compression. Due to the distinct evolution behaviours of bubbles and spikes, the interface becomes highly irregular as nonlinearity grows.
For the linear evolution period, the impulsive model (Richtmyer Reference Richtmyer1960) fails to accurately predict the experimental growth rate due to its inadequacy in describing the effect of compressibility on the interface evolution. In contrast, the Richtmyer theory (Richtmyer Reference Richtmyer1960) offers reasonable predictions. For the nonlinear evolution period, the shock proximity effect inhibits the early-time bubble amplitude development, while the secondary compression effect results in the late-time saturation of bubble amplitude growth. None of the nonlinear models considered accurately predict the bubble evolution, as they do not account for these two effects. Based on current experimental findings and existing nonlinear models, an empirical model, considering the shock proximity and secondary compression effects on early-time and later evolution, respectively, is proposed to predict the bubble evolution in highly compressible flows. For the spike evolution, the amplitude growth rate is relatively high due to the spike acceleration effect, and the DR model, which properly describes this effect, provides reasonable predictions. Furthermore, modal analysis shows that the shock proximity and secondary compression effects inhibit the fundamental mode growth while resulting in the generation of high-order harmonics, which leads to the failure of the modal model proposed for incompressible flows (Zhang & Sohn Reference Zhang and Sohn1997).
In future studies, the effects of mode coupling/competition, high initial amplitude, and phase inversion on strong-shock RMI will be investigated based on the findings of the present work. Furthermore, experiments with different
 $M$
will be conducted by varying the component and pressure of the driver gas, in order to evaluate and develop the newly proposed empirical model. Moreover, we are currently developing a novel shock-tube facility capable of generating shock waves with
$M$
will be conducted by varying the component and pressure of the driver gas, in order to evaluate and develop the newly proposed empirical model. Moreover, we are currently developing a novel shock-tube facility capable of generating shock waves with
 $M \gt 6.0$
, in which the shock waves are contracted twice successively in two orthogonal directions. Under these conditions, real gas effects become significant, thus providing an opportunity to investigate their influence on the instability evolution.
$M \gt 6.0$
, in which the shock waves are contracted twice successively in two orthogonal directions. Under these conditions, real gas effects become significant, thus providing an opportunity to investigate their influence on the instability evolution.
Funding
This work is supported by the National Natural Science Foundation of China (nos. 12027801, 12102425, 12472228 and 12388101), the Chinese Academy of Sciences Project for Young Scientists in Basic Research (YSBR-087), the Fundamental Research Funds for the Central Universities, and the Young Elite Scientists Sponsorship Program by CAST (no. 2023QNRC001).
Declaration of interests
The authors report no conflict of interest.


 Open access