Hostname: page-component-cd9895bd7-8ctnn Total loading time: 0 Render date: 2025-01-04T05:29:38.119Z Has data issue: false hasContentIssue false

Regimes in rotating Rayleigh–Bénard convection over rough boundaries

Published online by Cambridge University Press:  04 March 2024
Vinay Kumar Tripathi
Affiliation:
Fluid and Thermal Systems Laboratory, Department of Mechanical Engineering, Indian Institute of Technology Kanpur, Kanpur 208016, India
Pranav Joshi*
Affiliation:
Fluid and Thermal Systems Laboratory, Department of Mechanical Engineering, Indian Institute of Technology Kanpur, Kanpur 208016, India
*
Email address for correspondence: [email protected]

Abstract

The present work focuses on the effect of rough horizontal boundaries on the heat transfer in rotating Rayleigh–Bénard convection. We measure the non-dimensional heat transfer, the Nusselt number $Nu$, for various strengths of the buoyancy forcing characterized by the Rayleigh number $Ra$ (${10^5}\mathrm{\ \mathbin{\lower.3ex\hbox{$\buildrel< \over {\smash{\scriptstyle\sim}\vphantom{_x}}$}}\ }Ra\mathrm{\ \mathbin{\lower.3ex\hbox{$\buildrel< \over {\smash{\scriptstyle\sim}\vphantom{_x}}$}}\ }5 \times {10^8}$), and rotation rates characterized by the Ekman number E ($1.4 \times {10^{ - 5}}\mathrm{\ \mathbin{\lower.3ex\hbox{$\buildrel< \over {\smash{\scriptstyle\sim}\vphantom{_x}}$}}\ }E\mathrm{\ \mathbin{\lower.3ex\hbox{$\buildrel< \over {\smash{\scriptstyle\sim}\vphantom{_x}}$}}\ }7.6 \times {10^{ - 4}}$) for aspect ratios $\varGamma \approx 1$, $2.8$ and $6.7$. Similar to rotating convection with smooth horizontal boundaries, the so-called rotationally constrained (RC), rotation-affected (RA) and rotation-unaffected (RuA) regimes of heat transfer seem to persist for rough horizontal boundaries. However, the transition from the RC regime to RA regime occurs at a lower Rayleigh number for rough boundaries. For all experiments with rough boundaries in this study, the thermal and Ekman boundary layers are in a perturbed state, leading to a significant enhancement in the heat transfer as compared with that for smooth walls. However, the enhancement in heat transfer due to wall roughness is observed to attain a maximum in the RC regime. We perform companion direct numerical simulations of rotating convection over smooth walls to suggest a phenomenology explaining this observation. We propose that the heat transfer enhancement due to wall roughness reaches a maximum when the strength and coherence of the columnar structures are both significant, which enables efficient vertical transport of the additional thermal anomalies generated by the roughness at the top and bottom walls.

Type
JFM Papers
Copyright
© The Author(s), 2024. Published by Cambridge University Press

1. Introduction

Rotating natural convection frequently occurs on rough boundaries, e.g. atmospheric flows over undulating topography of mountains and plateaus, and ocean circulations in the presence of long chains of seamounts (Maxworthy Reference Maxworthy1994). The cellular convection in the Earth's outer core (Turcotte & Oxburgh Reference Turcotte and Oxburgh1967; Aurnou et al. Reference Aurnou, Calkins, Cheng, Julien, King, Nieves, Soderlund and Stellmach2015) is also likely to be affected by its undulating boundary with the mantle (Bloxham & Gubbins Reference Bloxham and Gubbins1987). In some industrial applications, rotating convection may occur in the presence of boundary roughness, e.g. solidification in the presence of dendrites or crystals in spin casting (Kumar et al. Reference Kumar, Chakraborty, Srinivasan and Dutta2002; Rana Reference Rana2023). Towards understanding such flows, the present work focuses on the effect of rough horizontal boundaries on the heat transfer in rotating Rayleigh–Bénard convection (RBC), a canonical system used to study rotating natural convection. There has been only one prior study on rotating RBC (RRBC) with rough walls, that of Joshi et al. (Reference Joshi, Rajaei, Kunnen and Clercx2017), in which heat transfer data at moderately high Rayleigh number and Prandtl number 6.2 are used to propose a dependence of the enhancement in heat transfer due to rotation on the thickness of the Ekman boundary layer (the special form a boundary layer takes on rotating surfaces), ${\delta _E}$, relative to the height of the roughness elements ($k$). In the present study, we focus on the heat transfer behaviour in RRBC with rough boundaries at low to moderate Rayleigh number and Prandtl number 5.7. Based on our results, we propose that in addition to ${\delta _E}/k$, the heat transfer is significantly modulated by the strength and coherence of the structures that characterize rotating convection.

1.1. RBC without rotation

The RBC system consists of a fluid layer that is heated from below and cooled from the top. The system is characterized by the Rayleigh number ($Ra = \alpha g\mathrm{\Delta }T{H^3}/\nu \kappa $) that indicates the strength of the buoyancy forcing, the Prandtl number ($Pr = \nu /\kappa $), which is a fluid property, and the aspect ratio ($\varGamma = D/H$). The non-dimensional heat transfer is represented by the Nusselt number, $Nu = qH/\lambda \mathrm{\Delta }T$. Here, $\mathrm{\Delta }T$ is the temperature difference between the bottom and top boundaries, H is the height, $D$ is the lateral dimension of the RBC cell, q is the heat flux, g is the acceleration due to gravity, and $\nu $, $\alpha $, $\lambda $ and $\kappa $ are the kinematic viscosity, the isobaric thermal expansion coefficient, the thermal conductivity and the thermal diffusivity of the fluid, respectively. The onset of convection over smooth walls occurs at the critical Rayleigh number $R{a_c}$. Near the onset, the domain is filled with steady convection cells (Assenheimer & Steinberg Reference Assenheimer and Steinberg1996). As the Rayleigh number is increased, these cells evolve into mushroom-shaped plumes, which re-organize into large-scale circulation (LSC) (Bodenschatz, Pesch & Ahlers Reference Bodenschatz, Pesch and Ahlers2000; Xi, Lam & Xia Reference Xi, Lam and Xia2004; Puthenveettil & Arakeri Reference Puthenveettil and Arakeri2005). After the onset of convection, initially ($Ra\mathrm{\ \mathbin{\lower.3ex\hbox{$\buildrel< \over {\smash{\scriptstyle\sim}\vphantom{_x}}$}}\ }{10^5}$), the Nusselt number increases rapidly as the Rayleigh number is increased (Rossby Reference Rossby1969; Charlson & Sani Reference Charlson and Sani1975) and then follows a power law with the scaling exponent $\gamma = 0.30$ in the relation $Nu\sim R{a^\gamma }$ for low to moderately high $Ra$ (${10^5} - {10^9}$) (Shraiman et al. Reference Shraiman, Avenue, Hill and Siggia1990; Chilla et al. Reference Chilla, Ciliberto, Innocenti and Pampaloni1993; Cioni, Ciliberto & Sommeria Reference Cioni, Ciliberto and Sommeria1997; Liu & Ecke Reference Liu and Ecke1997; Ahlers & Xu Reference Ahlers and Xu2001; Funfschilling et al. Reference Funfschilling, Brown, Nikolaenko and Ahlers2005; Verma et al. Reference Verma, Mishra, Pandey and Paul2012; Cheng et al. Reference Cheng, Stellmach, Ribeiro, Grannan, King and Aurnou2015, Reference Cheng, Madonia, Aguirre Guzmán and Kunnen2020; Hawkins et al. Reference Hawkins, Cheng, Abbate, Pilegard, Stellmach, Julien and Aurnou2023).

Numerous studies have investigated the effect of roughness on non-rotating RBC using both experiments and simulations, mostly for $5 < Pr < 9$, which is also the Prandtl number relevant for the present study. The heat transfer is unaffected by wall roughness when the thermal boundary layer (BL) thickness, ${\delta _\theta }$, is greater than the height of the boundary roughness, k (deemed regime I by Xie & Xia Reference Xie and Xia2017). As the thermal boundary layer thickness decreases with an increase in $Ra$ or as k is increased, the flow enters regime II when ${\delta _\theta } < k < {\delta _\nu }$, where ${\delta _\nu }$ is the viscous boundary layer thickness. In this regime, enhancement in $Nu$ of up to $100\%$ with respect to smooth walls has been reported along with a higher scaling exponent in the relation $Nu\sim R{a^\gamma }$ (Shen, Tong & Xia Reference Shen, Tong and Xia1996; Du & Tong Reference Du and Tong1998; Qiu, Xia & Tong Reference Qiu, Xia and Tong2005; Salort et al. Reference Salort, Liot, Rusaouen, Seychelles, Tisserand, Creyssels, Castaing and Chillà2014; Wei et al. Reference Wei, Chan, Ni, Zhao and Xia2014; Xie & Xia Reference Xie and Xia2017; Zhang et al. Reference Zhang, Sun, Bao and Zhou2018; Dong et al. Reference Dong, Wang, Dong, Huang, Jiang, Liu, Lu, Qiu, Tang and Zhou2020; Yang et al. Reference Yang, Zhang, Jin, Dong, Wang and Zhou2021). When k becomes larger than both ${\delta _\theta }$ and ${\delta _\nu }$, i.e. in regime III, the exponent becomes equal to that for RBC with smooth walls, although with a larger pre-factor (Wei et al. Reference Wei, Chan, Ni, Zhao and Xia2014; Tummers & Steunebrink Reference Tummers and Steunebrink2019).

1.2. Rotating RBC

Rotation introduces Coriolis and centrifugal forces into the system, and hence, additional non-dimensional parameters: the Ekman number ($E = \nu /2\varOmega {H^2}$) and the Rossby number ($Ro = \sqrt {(g\alpha \mathrm{\Delta }T/H)} /2\varOmega $) indicate the strength of the Coriolis force in comparison to viscous and inertial forces, respectively, whereas the Froude number, $Fr = {\varOmega ^2}D/2g$, represents the strength of the centrifugal force relative to gravity. Here, $\varOmega $ is the rotation rate. Rotation delays the onset of convection, i.e. increases $R{a_c}$ (for laterally unbounded domains, $R{a_c} \approx 8.7{E^{ - 4/3}}$ for shear-free boundaries (Chandrasekhar Reference Chandrasekhar1961) and $R{a_c} \approx (8.7 - 9.6{E^{1/6}})\; {E^{ - 4/3}}$ for no-slip boundaries (Niiler & Bisshopp Reference Niiler and Bisshopp1965; Kunnen Reference Kunnen2021; Ecke & Shishkina Reference Ecke and Shishkina2023)). As $Ra$ is increased beyond $R{a_c}$ for a given E, various regimes based on the heat transfer behaviour are observed: rotationally constrained (RC) regime, rotation-affected (RA) regime and rotation-unaffected (RuA) regime (King, Stellmach & Aurnou Reference King, Stellmach and Aurnou2012; Julien et al. Reference Julien, Aurnou, Calkins, Knobloch, Marti, Stellmach and Vasil2016; Cheng et al. Reference Cheng, Aurnou, Julien and Kunnen2018; Kunnen Reference Kunnen2021; Hartmann et al. Reference Hartmann, Yerragolam, Verzicco, Lohse and Stevens2023). The RC regime is characterized by an exponent $\beta $ in the relation $Nu\sim R{a^\beta }$ significantly larger than that for non-rotating convection. The transition between the RC and the RA regimes occurs at the transition Rayleigh number, $R{a_t}$, which has been defined in previous studies in multiple ways: based on the crossing of the boundary layer thicknesses (${\delta _\theta }/{\delta _E} \approx 1$) (Kunnen Reference Kunnen2021; Hartmann et al. Reference Hartmann, Yerragolam, Verzicco, Lohse and Stevens2023), $Nu/Nu\; (\varOmega = 0) = 1$ (King et al. Reference King, Stellmach and Aurnou2012; Cheng et al. Reference Cheng, Stellmach, Ribeiro, Grannan, King and Aurnou2015; Hawkins et al. Reference Hawkins, Cheng, Abbate, Pilegard, Stellmach, Julien and Aurnou2023) and maximum $Nu/Nu\; (\varOmega = 0)$ (Hartmann et al. Reference Hartmann, Yerragolam, Verzicco, Lohse and Stevens2023). Note that these definitions do not necessarily yield the same $R{a_t}$ and not all definitions can be applied for all $Pr$ and for free-slip boundaries. In the RA regime, the Nusselt number deviates from the power law relation characterizing the RC regime. Depending on the system parameters such as $Ra$, $Pr$ and E, an enhancement in the heat transfer compared with non-rotating convection may or may not be observed before the heat transfer becomes equal to that without rotation in the RuA regime. Note that the boundaries of the above regimes depend on the parameters $Ra$, $Pr$ and E (Ecke & Shishkina Reference Ecke and Shishkina2023).

As the Rayleigh number is increased above $R{a_c}$ for a constant Ekman number, the flow morphology undergoes significant changes; however, these changes may not be in sync with the transitions between various regimes discussed above (Kunnen Reference Kunnen2021; Hawkins et al. Reference Hawkins, Cheng, Abbate, Pilegard, Stellmach, Julien and Aurnou2023; Madonia et al. Reference Madonia, Aguirre Guzmán, Clercx and Kunnen2023). As Ra is increased, the flow structures within the RC and RA regimes change from cellular convection to convective Taylor columns to plumes to geostrophic turbulence (Sprague et al. Reference Sprague, Julien, Knobloch and Werne2006; Zhong et al. Reference Zhong, Stevens, Clercx, Verzicco, Lohse and Ahlers2009; Stellmach et al. Reference Stellmach, Lischper, Julien, Vasil, Cheng, Ribeiro, King and Aurnou2014; Kunnen Reference Kunnen2021; Hartmann et al. Reference Hartmann, Yerragolam, Verzicco, Lohse and Stevens2023; Madonia et al. Reference Madonia, Aguirre Guzmán, Clercx and Kunnen2023), although these features may not be observed for all Pr and E. The cellular convection cells and the convective Taylor columns are vortical columnar structures that may span the height of the domain and are aligned with the axis of rotation (Kunnen Reference Kunnen2021; Hartmann et al. Reference Hartmann, Yerragolam, Verzicco, Lohse and Stevens2023). With further increase in the buoyancy forcing, the vertical coherence of the Taylor columns is partially lost, leading to the formation of plumes (Kunnen Reference Kunnen2021). These plumes eventually give way to geostrophic turbulence that consists of a turbulent field devoid of vertical coherence. The boundary layer on the horizontal walls in the RC and RA regimes of rotating convection takes on a special character and is known as the Ekman layer (e.g. Greenspan Reference Greenspan1968; Stellmach et al. Reference Stellmach, Lischper, Julien, Vasil, Cheng, Ribeiro, King and Aurnou2014) that transitions to the Prandtl–Blasius boundary layer in the RuA regime (Stevens et al. Reference Stevens, Zhong, Clercx, Ahlers and Lohse2009; Rajaei et al. Reference Rajaei, Joshi, Alards, Kunnen, Toschi and Clercx2016; Ecke & Shishkina Reference Ecke and Shishkina2023), the transition occurring at $Ro\sim O(1)$. In the presence of the vortical columns, the radial pressure gradient associated with the columns is impressed upon the fluid in the Ekman boundary layer. This pressure gradient draws more near-wall hot/cold fluid into the vortical columns or plumes and tends to increase the heat transfer; this phenomenon is known as Ekman pumping (Zhong et al. Reference Zhong, Stevens, Clercx, Verzicco, Lohse and Ahlers2009; Julien et al. Reference Julien, Aurnou, Calkins, Knobloch, Marti, Stellmach and Vasil2016).

As discussed earlier, for infinite domains, $R{a_c} \approx 8.7{E^{ - 4/3}}$ for free-slip top and bottom boundaries (Chandrasekhar Reference Chandrasekhar1961), and $R{a_c} \approx (8.7 - 9.6{E^{1/6}}){E^{ - 4/3}}$ for no-slip top and bottom boundaries (Niiler & Bisshopp Reference Niiler and Bisshopp1965; Homsy & Hudson Reference Homsy and Hudson1971; Kunnen Reference Kunnen2021; Ecke, Zhang & Shishkina Reference Ecke, Zhang and Shishkina2022). However, it has been observed both experimentally (Rossby Reference Rossby1969; Zhong, Ecke & Steinberg Reference Zhong, Ecke and Steinberg1991; Ecke & Shishkina Reference Ecke and Shishkina2023) and numerically (Herrmann & Busse Reference Herrmann and Busse1993; Zhang & Liao Reference Zhang and Liao2009; Favier & Knobloch Reference Favier and Knobloch2020; Ecke et al. Reference Ecke, Zhang and Shishkina2022) that rotating convection in confined domains begins at $Ra = R{a_{wm}}$ much lower than the critical $Ra$ for unconfined domains. Close to the onset ($Ra\mathrm{\ \mathbin{\lower.3ex\hbox{$\buildrel> \over {\smash{\scriptstyle\sim}\vphantom{_x}}$}}\ }R{a_{wm}}$), convection only occurs close to the side walls in the form of alternating hot and cold fluid blobs that are known as ‘wall modes’ (Zhang & Liao Reference Zhang and Liao2009; Favier & Knobloch Reference Favier and Knobloch2020; Lu et al. Reference Lu, Ding, Shi, Xia and Zhong2021; Ecke et al. Reference Ecke, Zhang and Shishkina2022; De Wit et al. Reference De Wit, Boot, Madonia, Aguirre Guzmán and Kunnen2023). These wall modes precess along the side walls in a direction opposite to that of the system rotation (Favier & Knobloch Reference Favier and Knobloch2020; De Wit et al. Reference De Wit, Boot, Madonia, Aguirre Guzmán and Kunnen2023; Ecke & Shishkina Reference Ecke and Shishkina2023). While these wall modes appear at $R{a_{wm}} \approx {{\rm \pi} ^2}\sqrt {6\sqrt 3 } {E^{ - 1}}$ for free slip top and bottom boundaries (De Wit et al. Reference De Wit, Boot, Madonia, Aguirre Guzmán and Kunnen2023; Ecke & Shishkina Reference Ecke and Shishkina2023), they appear at $R{a_{wm}} = {{\rm \pi} ^2}\sqrt {6\sqrt 3 } {E^{ - 1}} + 46.55{E^{ - 2/3}}$ for no-slip top and bottom walls (Zhang & Liao Reference Zhang and Liao2009). The heat transfer occurs predominantly through these wall modes for $R{a_{wm}} \le Ra\mathrm{\ \mathbin{\lower.3ex\hbox{$\buildrel< \over {\smash{\scriptstyle\sim}\vphantom{_x}}$}}\ }R{a_{bulk}}$, whereafter convection in the bulk gradually becomes dominant, while that through the wall modes weakens. Although $R{a_{bulk}}\sim R{a_c}$ (Favier & Knobloch Reference Favier and Knobloch2020; Kunnen Reference Kunnen2021), $R{a_{bulk}}$ depends on the aspect ratio (Zhong, Ecke & Steinberg Reference Zhong, Ecke and Steinberg1993; Ecke et al. Reference Ecke, Zhang and Shishkina2022) of the confined domain.

Investigations of the effect of boundary roughness on RRBC have been rare. In the only study known to the authors, Joshi et al. (Reference Joshi, Rajaei, Kunnen and Clercx2017) showed for $Pr = 6.2$ and $Ra = 2.2 \times {10^9}$ that the enhancement in the heat transfer by rotation is unaffected by wall roughness so long as the roughness elements are buried deep inside the Ekman boundary layer ($k \ll {\delta _E}$). As the rotation rate is increased (i.e. $Ro$ is lowered), and consequently ${\delta _E}$ decreased, the roughness starts increasing the heat transfer enhancement when the roughness elements protrude into the interior of the Ekman boundary layer (i.e. $k\mathrm{\ \mathbin{\lower.3ex\hbox{$\buildrel< \over {\smash{\scriptstyle\sim}\vphantom{_x}}$}}\ }{\delta _E}$), where the radial inflow into the base of the vortical columns is stronger. As the Ekman boundary layer thickness decreases further, they hypothesized a weakening of Ekman pumping when $k \approx {\delta _E}$ that leads to a decrease in the heat transfer, and its reestablishment when $k \gg {\delta _E}$. They observed for rough wall convection a maximum enhancement in $Nu$ of approximately 30 % over its value for non-rotating RBC, whereas the same was approximately 10 % for smooth walls.

While Joshi et al. (Reference Joshi, Rajaei, Kunnen and Clercx2017) presented results for $Ra = 2.2 \times {10^9}$, the primary focus of the present study is the effect of boundary roughness on RRBC at low $Ra$, including its effect on the onset of convection. Towards this end, tetrahedral roughness elements arranged in a hexagonal grid having wavelength approximately equal to that of the expected unstable modes (Nakagawa & Frenzen Reference Nakagawa and Frenzen1955; Chandrashekhar Reference Chandrasekhar1961) are used in the present experiments. However, sufficiently accurate measurements close to $Nu = 1$ were not achieved using the present set-up. Thus, experimental results are presented only for ${10^5}\mathrm{\ \mathbin{\lower.3ex\hbox{$\buildrel< \over {\smash{\scriptstyle\sim}\vphantom{_x}}$}}\ }Ra\mathrm{\ \mathbin{\lower.3ex\hbox{$\buildrel< \over {\smash{\scriptstyle\sim}\vphantom{_x}}$}}\ }{10^8}$. The Nusselt number is measured for $Pr = 5.7$ as the Rayleigh number is varied in the above range with the Ekman number held constant at four different values ($E = 7.55 \times {10^{ - 4}},\;1.2 \times {10^{ - 4}},\;\; 5.9 \times {10^{ - 5}}$ and $1.4 \times {10^{ - 5}}$). Heat transfer measurements have been performed for rotating and non-rotating RBC over both smooth and rough walls. Due to the limitations of our direct numerical simulation (DNS) solver, simulations are performed only with smooth walls at the same $Pr$ and E as those for the experiments. The DNS data are used to validate the experimental data for smooth walls and to obtain data at low $Ra$ for which reliable data from experiments could not be obtained. The DNS data for RRBC with smooth walls are also used to examine the flow structures in detail. The same were used, assuming the broad features to be similar over smooth and rough walls, to propose a phenomenology explaining the present observations for RRBC with rough walls.

We present the details of the experimental set-up and the measurement procedures in § 2 and the numerical simulations in § 3. In § 4, we present our results that show an enhancement in the heat transfer by wall roughness for all parameters investigated, the enhancement reaching a maximum in the RC regime. In § 5, we show that this trend is likely a result of the varying strength and coherence of the columnar structures as $Ra$ is changed. We finally conclude in § 6.

2. Experimental set-up and measurement procedure

The RBC cell is mounted on a rotating table having an 800 mm diameter tabletop that can be levelled horizontal using levelling screws at the bottom of the table. Electrical power and cooling fluids are transferred into and out of the rotating system using a combined slip ring and rotary union. The tabletop is driven using a step servo motor BHSS 600 W and controller BH-SDC-01 & 02 from Bholanath Precision Engineering Pvt. Ltd. Motion is transferred from the motor to the tabletop using a Fenner HTD 800–5M timing belt and pullies with a gear ratio of 4 (which was further increased to 12 to accommodate the greater torque required by the rotary union after repairs). The maximum motor speed is 2000 rpm; as a result, the maximum achievable table speed is 167 rpm (after rework on the rotary union).

The RBC cell is a cuboid with a cross-section in the horizontal plane of size 100 mm × 100 mm. It is bounded by two copper plates, each approximately 40 mm thick, at the top and the bottom, while the acrylic sidewalls are 8 mm thick. Plates with both rough and smooth wetted surfaces have been used in the present study. Roughness elements in the form of 4 mm tall tetrahedrons with triangular bases of 10 mm sides are machined onto the wetted surfaces of both rough plates. The height of the roughness element is chosen so that it is not comparable to the height of the RBC cell. The tetrahedrons are arranged such that their peaks form a regular hexagonal pattern (see figure 1c). The bottom plate is heated by supplying electrical power from an 800 W programmable DC power supply DCX160M10 (Scientific Mes-Technik Pvt. Ltd) to a nichrome (80 % nickel, 20 % chromium) resistor having a resistance ${R_0} = 155$ ohm attached to the plate's bottom face. The bottom plate is maintained at temperature ${T_b}$ by using an in-house PID control algorithm. The top plate is maintained at temperature ${T_t}$ by circulating chilled water through 8 mm wide and 30 mm deep spiral channels machined in it, which were covered using a 10 mm thick acrylic sheet. Deionized and degassed water is used as the working fluid. To minimize heat transfer between the RBC cell and the surrounding, both the bottom plate and the sidewalls are covered with layers of insulation and aluminium shields that are maintained at temperatures ${T_b} \pm 0.1$ K and ${T_m} \pm 0.1$ K, respectively, where ${T_m} = ({T_b} + {T_t})/2$. Care is taken to prevent leakage of the working fluid by using O-rings between the acrylic sidewalls and each of the copper plates. Following earlier studies (Wei et al. Reference Wei, Chan, Ni, Zhao and Xia2014; Joshi et al. Reference Joshi, Rajaei, Kunnen and Clercx2017; Zhu et al. Reference Zhu, Stevens, Verzicco and Lohse2017; Tummers & Steunebrink Reference Tummers and Steunebrink2019), the effective vertical location of a rough wall is assumed to coincide with the mid-height of the roughness elements. For both rough and smooth plates, three different effective RBC cell heights have been used by changing the height of the sidewalls: $15$, $36$ and $96$ mm, yielding aspect ratios of $\varGamma \; \simeq \; 6.67,\;2.78$ and $1.04$, respectively.

Figure 1. (a) Schematic of the experimental set-up (not to scale): 1, rotating tabletop; 2, intermediate aluminium plate; 3, insulation for the bottom copper plate; 4, aluminium shield for bottom copper plate; 5, bottom copper plate; 6, top copper plate; 7, heating resistor; 8, working fluid; 9, acrylic side walls; 10, insulation for the sidewalls; 11, aluminium shield for the side walls. (b) Top view of the top copper plate showing the channels for the cooling fluid and the holes used for accommodating the temperature sensors. (c) Wetted side of the top copper plate. Crests of the tetrahedral roughness elements form a hexagonal pattern, as highlighted. (d) Side view of the top copper plate with an enlarged view of the roughness elements. Note that roughness elements with the same geometry are provided on the bottom copper plate.

Each plate is provided with a four-wire Pt100 sensor in the form of M6 screws and four 4-wire bead-shaped thermistors approximately 2.5 mm in diameter. The Pt100 sensors are mounted at the plate centres, while the thermistors are inserted into 3 mm diameter holes with centres along the diagonals of the plates and located 35 mm from the plate centres. The tips of all the sensors are located either underneath the troughs and 2 mm from the base of the roughness elements (in case of rough walls) or 2 mm from the wetted surface (in case of smooth walls). All sensors are calibrated in the laboratory using a temperature-controlled bath in the temperature range 5–45 °C and a master RTD traceable to the temperature calibration labs certified by National Accreditation Board for Testing and Calibration Laboratories. Data from the sensors are acquired using an NI cDAQ-9289 chassis and the modules NI-9216 (for RTDs) and NI-9219 (for thermistors) placed on the rotating table. Data are transferred wirelessly to a computer in the laboratory frame using a TP-Link router. All the data acquisition and control algorithms are programmed in $\textrm{LabVIE}{\textrm{W}^{\textrm{TM}}}$ from National Instruments.

All experiments are performed for isothermal boundary conditions and ${T_m} = 29\,^\circ \textrm{C}$ ($Pr = 5.7$), and all fluid properties are evaluated at ${T_m}$. Figure 2(a) shows the variation of the temperature measured by all the sensors in the bottom plate with time, whereas figure 2(b) shows similar data for the top plate. The temporal variations are determined to be approximately ${\pm} 0.02$ K for the bottom plate and ${\pm} 0.1$ K for the top plate (figure 2). The maximum spatial variation of the temperature recorded by the sensors in the bottom plate is smaller than 14 %. Similar spatial variations of temperature in the bottom plate have been reported earlier, e.g. Cioni et al. (Reference Cioni, Ciliberto and Sommeria1997), and have been attributed to the effects of thermal conduction within the plate. However, as shown in § 4, the measured values of the Nusselt number in the present study agree very well with those obtained from the present DNS and those reported by earlier studies (see figure 4). Thus, these spatial temperature variations are expected to not affect the conclusions of the present study. The spatial temperature variations in the top copper plate are smaller than $2\,\%$ of $\mathrm{\Delta }T$ (not shown).

Figure 2. Variation of the temperature measured by the sensors in the (a) bottom plate and the (b) top plate with time. P1 and P2 are the Pt100 sensors in the bottom and top plates, while T1–T4 and T5–T8 are the thermistors in the bottom and top plates, respectively. Here, $\mathrm{\Delta }T = 6.06\; \textrm{K}$, $Ra = 6.79 \times {10^6}$.

All temperature and heat flux data are recorded at a sampling rate of 1 Hz. For any experiment, data recorded for 3–4 h (2500$\tau $–7000$\tau $, where $\tau = \sqrt {H/g\alpha \mathrm{\Delta }T} \; $) in the steady state, are averaged to calculate the mean quantities $\mathrm{\Delta }T$ and $q = \langle {V^2}\; \rangle /({R_0}A)$, which in turn are used to calculate $Ra$ and the average Nusselt number ($Nu$). Here, V is the instantaneous voltage across the resistor, A is the projected wetted area of the top and bottom plates, and $\langle \;\rangle $ denotes time averaging. Figure 3 shows the variation of the instantaneous Nusselt number with time for one of the experiments and the extent of the data used for averaging in the statistically steady state. The highest rotation rate used in the present study is ${\rm \pi} $ rad s−1, resulting in Froude number $Fr = 0.07$, where $Fr = ({\varOmega ^2}d)/2g$ and d is the length of the diagonal of the wetted area of the plates. Since $F{r_{max}} < \varGamma /2$ for all our experimental data, the effect of the centrifugal acceleration is negligible in the present study (Horn & Aurnou Reference Horn and Aurnou2018, Reference Horn and Aurnou2019).

Figure 3. Variation of the instantaneous Nusselt number ($\widetilde {Nu}$) with time. The horizontal line indicates the data considered to calculate $Nu$. Here, $Ra = 5.8 \times {10^6}$, $E = \infty $, $Pr = 5.7$.

3. Numerical simulations

Direct numerical simulations are performed only for convection over smooth walls. We use a GPU-accelerated (Anas & Joshi Reference Anas and Joshi2023) version of the finite difference code Saras (Verma et al. Reference Verma, Samuel, Chatterjee, Bhattacharya and Asad2020; Samuel et al. Reference Samuel, Bhattacharya, Asad, Chatterjee, Verma, Samtaney and Anwer2021) to solve the incompressible Navier–Stokes equations on a collocated grid, and the pressure Poisson equation using a multigrid solver. The code is used to simulate an RBC cell of non-dimensional height ${L_z} = 1$ in Cartesian space providing aspect ratios ($\varGamma = 1,\;2.5$) approximately equal to those used in the experiments. The Prandtl number is $5.7$ for all simulations. Under the Boussinesq approximation, we solve the following equations for rotating Rayleigh–Bénard convection (Verma Reference Verma2018):

(3.1)\begin{gather}\frac{{\partial \boldsymbol{u}}}{{\partial t}} + (\boldsymbol{u}\boldsymbol{\cdot }\boldsymbol{\nabla })\boldsymbol{u} =- \boldsymbol{\nabla }p + \left( {\sqrt {\frac{{Pr}}{{Ra}}} } \right){\nabla ^2}\boldsymbol{u} + \theta {\hat{\boldsymbol{e}}_{\boldsymbol{z}}} + \left( {\sqrt {\frac{{Pr}}{{Ra{E^2}}}} } \right)\boldsymbol{u} \times {\hat{\boldsymbol{e}}_{\boldsymbol{z}}},\end{gather}
(3.2)\begin{gather}\frac{{\partial \theta }}{{\partial t}} + (\boldsymbol{u}\boldsymbol{\cdot }\boldsymbol{\nabla })\theta = \frac{1}{{\sqrt {RaPr} }}{\nabla ^2}\theta \end{gather}

and

(3.3)\begin{equation}\boldsymbol{\nabla }\boldsymbol{\cdot }\textbf{u} = 0.\end{equation}

In these equations, $\boldsymbol{u}(\boldsymbol{x},t)$ is the velocity field, $p(\boldsymbol{x},t)$ is the pressure field, $\theta (\boldsymbol{x},t)$ is the temperature field relative to the reference temperature ${T_m}$, t is time and ${\hat{\boldsymbol{e}}_{\boldsymbol{z}}}$ is a unit vector along the z direction. The above equations are non-dimensionalized using the free fall velocity $U = \sqrt {g\alpha \mathrm{\Delta }TH} $, $H$ and $\mathrm{\Delta }T$. In all simulations, the number of grid points in the vertical (or horizontal) direction varies between $64$ (or $128$) and $256$ such that a minimum of five grid points lie within the thinnest boundary layer on the horizontal walls. The no-slip boundary condition is used at all the boundaries. Horizontal boundaries are isothermal, while the side walls are adiabatic.

4. Results

4.1. Heat transfer with smooth horizontal boundaries

The variation of $Nu$ with $Ra$ over the range $Ra = 6.6 \times {10^5} - 3 \times {10^8}$ for non-rotating RBC with smooth boundaries is shown in figure 4(a). The data include results from experiments as well as simulations. The length of the error bars represents $4{\mathrm{\Delta }_\phi }$, where ${\mathrm{\Delta }_\phi } = {\sigma _\phi }/\sqrt {({t_0}/{\tau _0})} \; $ is the standard error in the mean value $\bar{\phi }$ of the variable $\phi $. Here, ${\sigma _\phi }$ denotes the standard deviation of $\phi $, ${t_0}$ denotes the length of the time series for $\phi (t)$ used to calculate $\bar{\phi }$ and ${\tau _0}$ is estimated as the time $\tau $ at which the temporal autocorrelation of $\phi $, ${C_\phi }(\tau ) = \langle \phi (t)\phi (t + \tau )\rangle /\sigma _\phi ^2$, decays to $1/e$ (Acton 1966; Joshi et al. Reference Joshi, Rajaei, Kunnen and Clercx2017). Note that for some data points, the length of the error bars is smaller than the size of the symbols. Three RBC cell heights: $H = 15$ mm, 36 mm and 96 mm have been used in the experiments, resulting in aspect ratio $1.04 \le \varGamma \le 6.67$. The present data, from both experiments and DNS, agree well with those of Rossby (Reference Rossby1969) and Liu & Ecke (Reference Liu and Ecke1997). Fitting the data for $\varGamma = 2.78$ and $6.67$ together, and the data for $\varGamma = 1.04$ separately, to $Nu \approx aR{a^{{\gamma _S}}}$ using least squares yields the exponent ${\gamma _S} \approx 0.3$ for all aspect ratios, in agreement with several prior studies (Shraiman et al. Reference Shraiman, Avenue, Hill and Siggia1990; Chilla et al. Reference Chilla, Ciliberto, Innocenti and Pampaloni1993; Cioni et al. Reference Cioni, Ciliberto and Sommeria1997; Liu & Ecke Reference Liu and Ecke1997; Ahlers & Xu Reference Ahlers and Xu2001; Funfschilling et al. Reference Funfschilling, Brown, Nikolaenko and Ahlers2005; Verma et al. Reference Verma, Mishra, Pandey and Paul2012; Cheng et al. Reference Cheng, Stellmach, Ribeiro, Grannan, King and Aurnou2015, Reference Cheng, Madonia, Aguirre Guzmán and Kunnen2020; Hawkins et al. Reference Hawkins, Cheng, Abbate, Pilegard, Stellmach, Julien and Aurnou2023), see table 1. Whereas $a \approx 0.12$ for $\varGamma = 6.67$ and $2.78$ combined, the trend line for $\varGamma = 1.04$ lies above that for $\varGamma = 2.78$ and $6.67$, i.e. yields a slightly higher value of $a \approx 0.14$. Such dependence of $Nu$ on $\varGamma $ has been observed in prior studies, e.g. Funfschilling et al. (Reference Funfschilling, Brown, Nikolaenko and Ahlers2005), Wagner & Shishkina (Reference Wagner and Shishkina2013), Shishkina (Reference Shishkina2021), Xia et al. (Reference Xia, Huang, Xie and Zhang2023). However, it can also be a result of the changes in the large-scale structure of the flow as $Ra$ is increased (Grossmann & Lohse Reference Grossmann and Lohse2003).

Figure 4. Variation of $Nu$ with $Ra$ for (a) non-rotating RBC with smooth boundaries (green downward triangles: $\varGamma = 6.35$, $Pr = 6.8$, Rossby (Reference Rossby1969); blue circles: $\varGamma = 0.78$, $Pr = 6.3$, Liu & Ecke Reference Liu and Ecke1997). (b) Rotating RBC with smooth boundaries. For all present data, $Pr = 5.7$. The black solid and dashed lines in panels (a) and (b) are the same. Note that all the dashed trend lines in panel (b) denote the power law $Nu\sim R{a^\beta }$ that is fitted to the data falling on the respective trend lines using least square method. Blue, $\beta = 0.87$; red, $\beta = 1.2$; cyan, $\beta = 1.13$; magenta, $\beta = 1.22$. Error bars in panel (a) are smaller than the symbol size and are not shown.

Table 1. Values of $\gamma $ in the scaling law $Nu\sim aR{a^\gamma }$ for non-rotating convection. Uncertainty in $\gamma $ is represented as $\gamma \pm 2{\mathrm{\Delta }_\gamma }$, where ${\mathrm{\Delta }_\gamma }$ is the estimated standard error in $\gamma $, $\mathrm{\Delta }_\gamma ^2 = ({S_{\phi \phi }}\; {S_{\psi \psi }} - S_{\phi \psi }^2)/[(n - 2)S_{\phi \phi }^2\; ]$, n is the number of data points ($Ra,Nu$) used for linear regression, $\phi = \textrm{ln}\,Ra$, $\psi = \textrm{ln}\,Nu$, and ${S_{\phi \psi }} = \sum\nolimits_{i = 1}^n {({\phi _i} - \bar{\phi })({\psi _i} - \bar{\psi })} $ is the covariance of $\phi $ and $\psi $ (Acton 1966). $\overline {()} $ denotes the mean of the data set. For rough walls, H is calculated from the middle of the valleys.

Results for rotating RBC with smooth walls are presented in figure 4(b) for different values of the Ekman number: $E = 7.55 \times {10^{ - 4}},\;1.2 \times {10^{ - 4}}$ for $\varGamma \approx 2.78$ and $E = 5.9 \times {10^{ - 5}},$ and $1.4 \times {10^{ - 5}}$ for $\varGamma \approx 1.04$ for simulations and experiments. The data for non-rotating RBC are represented using the solid black line from figure 4(a), i.e. $Nu\sim 0.12R{a^{0.3}}$. In agreement with the results from King et al. (Reference King, Stellmach and Aurnou2012) and Rossby (Reference Rossby1969), for a constant Ekman number and low $Ra$, $Nu$ is lower than that for non-rotating RBC at the same $Ra$ and increases rapidly as $Ra$ increases in the RC regime (King, Stellmach & Buffett Reference King, Stellmach and Buffett2013; Cheng et al. Reference Cheng, Stellmach, Ribeiro, Grannan, King and Aurnou2015; Julien et al. Reference Julien, Aurnou, Calkins, Knobloch, Marti, Stellmach and Vasil2016; Kunnen Reference Kunnen2021; Lu et al. Reference Lu, Ding, Shi, Xia and Zhong2021; Ecke & Shishkina Reference Ecke and Shishkina2023). A power law fit to the data in this regime provides the exponent in the relation $Nu\sim R{a^\beta }$ in the range 0.87–1.22 (see table 2). Note that in agreement with several previous studies (e.g. King et al. Reference King, Stellmach and Aurnou2012; Kunnen Reference Kunnen2021; Lu et al. Reference Lu, Ding, Shi, Xia and Zhong2021; Ecke & Shishkina Reference Ecke and Shishkina2023), the data for $Nu\sim O(1)$, except for the largest E, do not follow these relations and have not been considered for obtaining the scaling parameters. The onset of convection occurs through wall modes at $Ra$ ($= R{a_{wm}}$) lower than $R{a_c}$, resulting in this deviation of the data from the power law for low $Ra$ (Rossby Reference Rossby1969; King et al. Reference King, Stellmach, Noir, Hansen and Aurnou2009; Ecke Reference Ecke2023). This effect seems to become stronger as the Ekman number decreases. As $Ra$ is increased, the wall modes start diffusing into the bulk (Favier & Knobloch Reference Favier and Knobloch2020; Ecke et al. Reference Ecke, Zhang and Shishkina2022; De Wit et al. Reference De Wit, Boot, Madonia, Aguirre Guzmán and Kunnen2023, also see § 5) and the Nusselt number follows the power law for $Ra\mathrm{\ \mathbin{\lower.3ex\hbox{$\buildrel> \over {\smash{\scriptstyle\sim}\vphantom{_x}}$}}\ }R{a_{bulk}}$.

Table 2. Values of the exponent $\beta $ in the scaling law $Nu\sim R{a^\beta }$ in the RC regime. The values of $\beta $ are calculated using least squares fit to the data falling on the trend line in the RC regime. Subscripts S and R for $\beta $ denote smooth and rough boundaries, respectively. ${\sim} $ denotes insufficient data to estimate the exponent. For $E = 1.2 \times {10^{ - 4}}$ and $\varGamma = 2.78$, both experiments and simulations separately yield ${\beta _S} \approx 1.2$.

As $Ra$ is increased beyond the transition Rayleigh number $R{a_t} = R{a_t}(E)$, defined as the lowest $Ra$ for a given E at which $Nu = Nu(E = \infty )$ (King et al. Reference King, Stellmach and Aurnou2012; Cheng et al. Reference Cheng, Stellmach, Ribeiro, Grannan, King and Aurnou2015; Kunnen Reference Kunnen2021; Hawkins et al. Reference Hawkins, Cheng, Abbate, Pilegard, Stellmach, Julien and Aurnou2023), the Nusselt number increases beyond the corresponding values for non-rotating convection in the RA regime (King et al. Reference King, Stellmach and Buffett2013; Kunnen et al. Reference Kunnen, Ostilla-Mónico, van der Poel, Verzicco and Lohse2016; Ecke & Shishkina Reference Ecke and Shishkina2023), and eventually conforms to the trend for non-rotating convection in the RuA regime (King et al. Reference King, Stellmach and Buffett2013; Cheng et al. Reference Cheng, Stellmach, Ribeiro, Grannan, King and Aurnou2015; Julien et al. Reference Julien, Aurnou, Calkins, Knobloch, Marti, Stellmach and Vasil2016; Kunnen Reference Kunnen2021). Note that the transition from the RC regime to the RA regime (and then to the RuA regime) occurs over a range of $Ra$. Thus, $R{a_t}$ is merely indicative of the range of $Ra$ over which the transition is expected to occur (Cheng et al. Reference Cheng, Madonia, Aguirre Guzmán and Kunnen2020; Kunnen Reference Kunnen2021; Ecke & Shishkina Reference Ecke and Shishkina2023). Note that the data for $E = 7.55 \times {10^{ - 4}}$ cover all three regimes: RC, RA and RuA, while those for $E = 1.2 \times {10^{ - 4}}$, $5.9 \times {10^{ - 5}}$ and $1.4 \times {10^{ - 5}}$ fall only in the regimes RC and RA. The present data are in close agreement with those from the studies cited above for comparable values of the Ekman number. Following King et al. (Reference King, Stellmach and Aurnou2012), we estimate $R{a_t}$ for a given Ekman number by finding the intersection of the trend line $Nu\sim 0.12R{a^{0.3}}$ with the line joining two data points, each point on either side of the same trend line. For $E = 1.2 \times {10^{ - 4}}$, the data from both experiments and simulations yield $R{a_t} \approx 4.6 \times {10^6}$, in agreement with King et al. (Reference King, Stellmach and Aurnou2012). The values of $R{a_t}$ at other E obtained from simulations are tabulated in table 3 and are in broad agreement with prior studies, e.g. King et al. (Reference King, Stellmach and Aurnou2012), Cheng et al. (Reference Cheng, Stellmach, Ribeiro, Grannan, King and Aurnou2015), Kunnen (Reference Kunnen2021) and Hawkins et al. (Reference Hawkins, Cheng, Abbate, Pilegard, Stellmach, Julien and Aurnou2023).

Table 3. Summary of $R{a_t}$ for various E for smooth and rough boundaries. Note that at $E = 1.2 \times {10^{ - 4}}$, $R{a_t}$ is approximately the same from simulations and experimental data, separately. Note that, due to insufficient data for rough walls, $R{a_t}$ is not calculated at $E = 7.55 \times {10^{ - 4}}$ and $5.9 \times {10^{ - 5}}$.

4.2. Heat transfer with rough horizontal boundaries

The variation of $Nu$ with $Ra$ for non-rotating convection is shown in figure 5(a) for both smooth and rough walls. Note that three RBC cell heights $H = 15$, 36 and 96 mm have been used to span the range $7 \times {10^4} \le Ra \le 3 \times {10^8}$, resulting in aspect ratio $1.04 \le \varGamma \le 6.67$. The presence of rough boundaries increases the heat transfer significantly in comparison to those over smooth walls: an increase of 20 %–65 % in $Nu$ is observed in the present study. Fitting the data for $\varGamma = 2.78$ and $6.67$ to a single power law $Nu \approx aR{a^{{\gamma _R}}}$, we obtain ${\gamma _R} = 0.33$. The value of this exponent increases substantially to $0.39$ with a decrease in aspect ratio to $\varGamma = 1.04$ (see table 1). In the present work, since only one aspect ratio ($\varGamma = 1.04$) is used for $Ra\mathrm{\ \mathbin{\lower.3ex\hbox{$\buildrel> \over {\smash{\scriptstyle\sim}\vphantom{_x}}$}}\ }{10^7}$, the increase in the scaling exponent cannot be attributed with certainty to the effect of aspect ratio, large $Ra$ or a combination of both. The present trends of higher $Nu$ and higher $\gamma $ for rough walls compared to smooth walls are in agreement with several prior studies, e.g. Qiu et al. (Reference Qiu, Xia and Tong2005), Wei et al. (Reference Wei, Chan, Ni, Zhao and Xia2014), Xie & Xia (Reference Xie and Xia2017), Zhang et al. (Reference Zhang, Sun, Bao and Zhou2018) and Tummers & Steunebrink (Reference Tummers and Steunebrink2019). Using ${\delta _\theta }/H \approx 1/2Nu$, we estimate $2 < k/{\delta _\theta } < 6$ for the present data. For our range of $Ra$, the viscous BL thickness for non-rotating RBC with smooth walls is found from DNS to be $3\ \textrm{mm}\mathrm{\ \mathbin{\lower.3ex\hbox{$\buildrel< \over {\smash{\scriptstyle\sim}\vphantom{_x}}$}}\ }{\delta _\nu }\mathrm{\ \mathbin{\lower.3ex\hbox{$\buildrel< \over {\smash{\scriptstyle\sim}\vphantom{_x}}$}}\ }4.5\ \textrm{mm}$. Since, the viscous boundary layer thickness is expected to be larger for rough boundaries (Liot et al. Reference Liot, Salort, Kaiser, du Puits and Chillà2016), we estimate $k/{\delta _v}\mathrm{\ \mathbin{\lower.3ex\hbox{$\buildrel< \over {\smash{\scriptstyle\sim}\vphantom{_x}}$}}\ }1$. This indicates that the data likely lie in the so-called ‘regime II’ (Shen et al. Reference Shen, Tong and Xia1996; Du & Tong Reference Du and Tong1998; Qiu et al. Reference Qiu, Xia and Tong2005; Salort et al. Reference Salort, Liot, Rusaouen, Seychelles, Tisserand, Creyssels, Castaing and Chillà2014; Wei et al. Reference Wei, Chan, Ni, Zhao and Xia2014), which is observed when ${\delta _\theta } < k < {\delta _\nu }$. Note that the increase in $Nu$ due to roughness is lower for $\varGamma = 1.04$ and is believed to be a consequence of a smaller $k/H = 0.04$ compared with that for other aspect ratios ($k/H = 0.1$ and $0.2$).

Figure 5. Variation of $Nu$ as a function of $Ra$ for (a) non-rotating RBC with rough boundaries and (b) rotating RBC with rough boundaries. In both panels (a) and (b), black solid line, $Nu = 0.12R{a^{0.30}}$ (smooth wall non-rotating RBC for $\varGamma = 2.78$, $6.67$); black dashed line, $Nu = 0.14R{a^{0.30}}$ (smooth wall non-rotating RBC for $\varGamma = 1.04$); green solid line, $Nu = 0.13R{a^{0.33}}$ (rough wall non-rotating RBC for $\varGamma = 2.78$, $6.67$); black dash-dotted line, $Nu = 0.04R{a^{0.39}}$ (rough wall non-rotating RBC for $\varGamma = 1.04$). Note that error bars are much smaller than the symbol size. In panel b, colour indicates the Ekman number. Open symbols: EXP; filled symbols: DNS; squares: smooth; diamonds: rough.

Figure 5(b) shows the variation of $Nu$ with $Ra$ for rotating convection over both smooth and rough walls. Data for rough-wall rotating convection have been obtained only for $\varGamma \le 2.78$. Accordingly, lines representing the power-law fit to the non-rotating convection data for $\varGamma \le 2.78$ are included in the figure for comparison. Similar to the case of smooth walls, rotating convection over rough walls exhibits the heat transfer regimes RC, RA and RuA with corresponding characteristics: a rapid increase of $Nu$ with $Ra$ in regime RC, an overshoot of $Nu$ above the trend line for non-rotating convection in regime RA and the eventual collapse of data onto those for non-rotating convection in the regime RuA. Note that the present rough-wall data for any given Ekman number do not cover all three regimes. Similar to the case of non-rotating convection, wall roughness increases the heat transfer in both regimes RC and RA of rotating convection in the present study. However, the trend of $Nu$ with $Ra$ in the RC regime for rough walls has a larger exponent than that for smooth walls, refer to table 2. Note that this conclusion is based only on data sets at $E = 1.2 \times {10^{ - 4}}$ and $1.4 \times {10^{ - 5}}$. In the RC regime, the difference between the value of $Nu$ for rough and smooth walls decreases with a decrease in $Ra$. However, in the absence of data at very low $Ra$, the effect of boundary roughness on the Rayleigh number for the onset of convection remains inconclusive.

Figure 6(a) shows the ratio of the heat transfer with rotation to that without rotation, i.e. $Nu(\varOmega )/Nu(\varOmega = 0)$, for different Ekman numbers. Here, $Nu(\varOmega = 0)$ is evaluated at the same $Ra$ as for $Nu(\varOmega )$ using interpolation of the respective data for $\varOmega = 0$ from both experiments and DNS (both agree well with each other) for smooth walls and the experimental data for rough walls. In figure 6(a), the horizontal dashed line $Nu(\varOmega )/Nu(\varOmega = 0)\; = 1$ shows the demarcation between the RC and RA regimes. Except at very low $Ra$, $Nu(\varOmega )/Nu(\varOmega = 0)\;$for rough walls in the RC regime is significantly higher in comparison to that for smooth walls, suggesting that wall roughness increases the heat transfer efficiency of Ekman pumping in the RC regime (details are discussed in § 5). As the Rayleigh number is increased beyond $R{a_t}$, $Nu(\varOmega )/Nu(\varOmega = 0)$ for rough walls approaches that for smooth walls and eventually tends to decrease below the latter as the transition to the RuA regime is approached. Note that for very large $Ra$, $Nu(\varOmega )/Nu(\varOmega = 0)$ is expected to asymptotically approach 1 for both rough and smooth walls. Thus, for a given Ekman number, we observe both an increase in the efficiency of Ekman pumping at low $Ra$ (mostly in the RC regime) and a weakening of the same at higher $Ra$ (in the RA regime). Such weakening or ‘disruption’ of the Ekman pumping mechanism was reported by Joshi et al. (Reference Joshi, Rajaei, Kunnen and Clercx2017) and proposed to occur when ${\delta _E}\mathrm{\ \mathbin{\lower.3ex\hbox{$\buildrel< \over {\smash{\scriptstyle\sim}\vphantom{_x}}$}}\ }k$. However, depending on the Rayleigh number (or the regime), we observe both an increase and a decrease in the heat transfer efficiency of Ekman pumping for a constant ${\delta _E}\mathrm{\ \mathbin{\lower.3ex\hbox{$\buildrel< \over {\smash{\scriptstyle\sim}\vphantom{_x}}$}}\ }k$. We discuss this further in § 5. As expected, the effect of roughness on the heat transfer also changes the transitions between regimes that are based on heat transfer characteristics: for a given Ekman number, the transition Rayleigh number $R{a_t}$ is lowered for rough-wall convection in comparison to that over smooth walls.

Figure 6. (a) Variation of $Nu(\varOmega )/Nu(\varOmega = 0)$ with $Ra$. (b) Variation of $N{u_R}/N{u_S}$ with $Ra$. The vertical dash-dotted lines in panel (b) denote $R{a_t}$ (see table 3) for rough walls for the corresponding Ekman number. The blue and cyan dash-dotted lines are only indicative since $R{a_t}$ could not be measured: the rough-wall data for $E = 7.55 \times {10^{ - 4}}$ (blue diamonds) and $E = 5.9 \times {10^{ - 5}}$ (cyan diamonds) lie entirely in the RA regime. In both panels, colour indicates the Ekman number. Open symbols: EXP; filled symbols: DNS; squares: smooth; diamonds: rough.

Figure 6(b) shows the variation of $N{u_R}/N{u_S}$ with $Ra$, where $N{u_R}$ and $N{u_S}$ are the Nusselt numbers for rough and smooth walls, respectively. While $N{u_R}$ represents the actual values recorded for rough walls, $N{u_S}$ at the corresponding values of $Ra$ is estimated using interpolation of the data. As discussed earlier, for $E = \infty $, the maximum enhancement in heat transfer caused by the wall roughness is approximately $65\,\%$ for $\varGamma = 2.78$ and $Ra \approx {10^7}$. However, for rotating convection, this enhancement in $Nu$ by roughness increases substantially and peaks in the RC regime: the maximum enhancement being approximately 180 % for $E = 1.2 \times {10^{ - 4}}$ and $1.4 \times {10^{ - 5}}$. This enhancement decreases on the one hand as $Ra$ is lowered towards convection onset and on the other as $Ra$ is increased beyond $R{a_t}$. Although we do not have data in the RC regime for $E = 7.55 \times {10^{ - 4}}$ and $E = 5.9 \times {10^{ - 5}}$, the data in the RA regime show a similar trend: increasing $N{u_R}/N{u_S}$ as $R{a_t}$ is approached. As expected, for RRBC, $N{u_R}/N{u_S}$ approaches that for RBC for the same $\varGamma $ as the regime RuA is approached.

5. Discussion

It is known that the dynamics of the boundary layers affect the heat transfer significantly in rotating convection (e.g. King et al. Reference King, Stellmach, Noir, Hansen and Aurnou2009; Stevens, Clercx & Lohse Reference Stevens, Clercx and Lohse2010; Kunnen et al. Reference Kunnen, Ostilla-Mónico, van der Poel, Verzicco and Lohse2016; Hartmann et al. Reference Hartmann, Yerragolam, Verzicco, Lohse and Stevens2023). Specifically, for rotating convection over rough walls, the effect of roughness on the heat transfer enhancement is expected to be significant when the boundary layer thicknesses are comparable to or smaller than the size of the roughness elements (Joshi et al. Reference Joshi, Rajaei, Kunnen and Clercx2017). Over smooth walls, we define the thermal BL thickness ($\delta _\theta ^S$) as the distance from the wall to the point of intersection of the lines tangent to the temperature profile in the bulk and at the wall (see figure 7a). The vertical temperature profile represents the horizontally and temporally averaged temperature. To calculate the thermal boundary layer thickness over rough walls ($\delta _\theta ^R$), we assume the same temperature gradient in the bulk as that over smooth walls at the same $Ra$, while the slope of the line representing the temperature gradient at the wall is $1/N{u_R}$. This definition is likely to slightly underestimate $\delta _\theta ^R$ since lower $\partial T/\partial z$ in the bulk (i.e. greater mixing) would be expected for rough walls as compared with smooth walls at the same $Ra$. Figure 7(b) shows the variation of the thermal boundary layer thickness with $Ra$ for both smooth-wall and rough-wall rotating convection. As expected, the thermal boundary layer thickness decreases as $Nu$ increases with $Ra$ for both rough and smooth walls. Except at $Ra$ for which $Nu\sim O(1)$, for all E, $\delta _\theta ^R < k$, i.e. the thermal boundary layer over rough walls is in a perturbed state. We estimate the thickness of the Ekman boundary layer over rough walls using $\delta _E^R = \delta _E^S\sqrt {\textrm{sec}\,\beta } $, where $\delta _E^S = 2.284\sqrt {\nu /\varOmega } $ is the Ekman boundary layer thickness on a smooth horizontal wall (Rajaei et al. Reference Rajaei, Joshi, Alards, Kunnen, Toschi and Clercx2016), ${\rm \pi} /2 - \beta $ is the angle made by the surface with the rotation axis and the term $\sqrt {\textrm{sec}\,\beta } $ has been introduced to account for the thickening of the boundary layer over a sloping wall (Pedlosky Reference Pedlosky1987). For the present roughness geometry, $\beta = 54.2^\circ $, i.e. $\delta _E^R \approx 1.3\delta _E^S$. For all the cases presented, $0.4\mathrm{\ \mathbin{\lower.3ex\hbox{$\buildrel< \over {\smash{\scriptstyle\sim}\vphantom{_x}}$}}\ }\delta _E^R/k\mathrm{\ \mathbin{\lower.3ex\hbox{$\buildrel< \over {\smash{\scriptstyle\sim}\vphantom{_x}}$}}\ }1$. Thus, both thermal and Ekman boundary layers are perturbed by roughness, leading to a greater incursion of the near-wall hot/cold fluid into the vortical columns. Thus, $N{u_R}/N{u_S}$ is greater than 1 at all $Ra$ and E in this study. The variation of the ratio of the thermal and Ekman boundary layer thicknesses with the Rayleigh number is shown in figure 7(c). The vertical dashed (or dash-dotted) lines indicate $R{a_t}$ for the respective values of E (see table 3). In line with several prior studies (King et al. Reference King, Stellmach, Noir, Hansen and Aurnou2009; Hartmann et al. Reference Hartmann, Yerragolam, Verzicco, Lohse and Stevens2023), ${\delta _\theta }/{\delta _E} \approx 1$ occurs close to $R{a_t}$, except at $E = 1.2 \times {10^{ - 4}}$ for rough walls. The peak of $N{u_R}/N{u_S}$ observed in figure 6(b) for $E = 1.2 \times {10^{ - 4}}$ and $1.4 \times {10^{ - 5}}$ occurs near $R{a_t}$.

Figure 7. (a) Temperature profile in RRBC with smooth boundaries for $Ra = {10^6}$, $E = 1.2 \times {10^{ - 4}}$, $\varGamma = 2.5$. Here, red and blue dashed lines are the tangents to the temperature profile in the bulk and at the wall, respectively, while the magenta dashed line represents the temperature gradient at the wall, $\partial T/\partial z{ |_{wall}} = 1/N{u_R}$, for rough boundaries. (b) Variation of the thermal BL thickness with $Ra$ at various $E$. The horizontal black dashed line denotes the height of the roughness elements, $k = 4$ mm. (c) Variation of $\delta _\theta ^S/\delta _E^S$ and $\delta _\theta ^R/\delta _E^R$ with $Ra$ at various values of the Ekman number. Superscripts S and R denote smooth and rough boundaries, respectively. Vertical dashed lines and dash-dotted lines denote the $R{a_t}$ (see table 3) for smooth and rough boundaries, respectively, corresponding to that Ekman number. In both panels (b) and (c), colour indicates the Ekman number; squares: smooth; diamonds: rough. Magenta, $E = 7.55 \times {10^{ - 4}}$; red, $E = 1.2 \times {10^{ - 4}}$; cyan, $E = 5.9 \times {10^{ - 5}}$; blue, $E = 1.4 \times {10^{ - 5}}$. Cyan and blue, $\varGamma = 1.04$; red and magenta, $\varGamma \approx 2.78$. To avoid clutter, estimates of ${\delta _\theta }$ for smooth-wall experiments are not shown since they agree well with those based on the DNS data.

As discussed earlier in context to figure 6(b), for a fixed E, the enhancement in $Nu$ due to wall roughness reaches a maximum in the RC regime, say at $Ra = R{a_{peak}}$, and decreases as $Ra$ is either increased or decreased. We propose that this variation in the enhancement is a result of the changing coherence and strength of the columnar structures that are known to play an important role in the heat transfer in rotating convection (Zhong et al. Reference Zhong, Stevens, Clercx, Verzicco, Lohse and Ahlers2009; Stevens et al. Reference Stevens, Clercx and Lohse2010, King et al. Reference King, Stellmach and Aurnou2012; Stevens, Clercx & Lohse Reference Stevens, Clercx and Lohse2013; Julien et al. Reference Julien, Aurnou, Calkins, Knobloch, Marti, Stellmach and Vasil2016; Ecke & Shishkina Reference Ecke and Shishkina2023). A vertically coherent columnar structure would be more efficient in transporting to the opposite wall the additional hot (or cold) plumes that the wall roughness injects into the column. However, a column that loses its coherence away from the walls will result in greater dissipation of the temperature anomaly in the bulk, leading to a smaller increase in heat transfer due to wall roughness. Similarly, weaker columnar structures may also lead to a lower heat transfer enhancement, as will be discussed shortly.

We use the DNS data for smooth walls to get insight into the broad features of the flow. Based on the assumption that these broad flow features are similar over rough walls, we propose an explanation for the observed heat transfer behaviour in RRBC over rough walls. Using the data from DNS for smooth walls, we calculate the normalized cross-correlation coefficient r between the temperature fields at $z/{\delta _\theta } = 1$ and $z/H = 0.5$,

(5.1)\begin{equation}r = \frac{{\displaystyle\sum\limits_{i = 1}^n {{N_i}} }}{{n\sqrt {\displaystyle\sum\limits_{i = 1}^n {{D_i}} } }},\end{equation}

where

(5.2)\begin{gather}{N_i} = \sum\limits_{x,y} {[T(x,y,{\delta _\theta }) - \bar{T}({\delta _\theta })] \cdot [T(x,y,H/2) - \bar{T}(H/2)]} ,\end{gather}
(5.3)\begin{gather}{D_i} = \frac{1}{{{n^2}}}\sum\limits_{i = 1}^n {\sum\limits_{x,y} {{{[T(x,y,{\delta _\theta }) - \bar{T}({\delta _\theta })]}^2}} } \cdot \sum\limits_{i = 1}^n {\sum\limits_{x,y} {{{[T(x,y,H/2) - \bar{T}(H/2)]}^2}} } \end{gather}

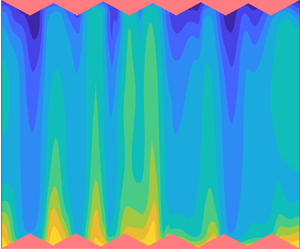
and the overbar indicates the spatial mean of a quantity in a horizontal plane. The value of i varies from 1 to n, where $n = 5$ represents the number of independent realizations (five instantaneous data sets, consecutive sets separated by 100 non-dimensional time units, i.e. free fall time $\tau = \sqrt {H/g\alpha \mathrm{\Delta }T} $) used to calculate the value of r at a given $Ra$. The cross-correlation coefficient for $E = 1.2 \times {10^{ - 4}}$ and $1.4 \times {10^{ - 5}}$, shown in figure 8, peaks close to $Ra = 4 \times {10^6}$ and $Ra = 8 \times {10^7}$, respectively. To relate the changes in r to the corresponding changes in the flow structure, we present in figure 9 the instantaneous distributions of the temperature obtained from DNS at $z/{\delta _\theta } = 1$ and $z/H = 0.5$ at $Ra = 1 \times {10^6}$, $4 \times {10^6}$ and $2 \times {10^7}$ for $E = 1.2 \times {10^{ - 4}}$ (trends are qualitatively similar for $E = 1.4 \times {10^{ - 5}}$). At $Ra = 4 \times {10^6}$ (see figure 9c,d), i.e. close to the maximum of r, the contours show a high degree of coherence between the temperature fields at the edge of the thermal boundary layer and in the bulk. As $Ra$ is increased, this coherence seems to decrease (see figure 9e,f), in accordance with the decay in r observed in figure 8. We propose that as the buoyancy forcing that competes with the Coriolis force increases as $Ra$ is increased, the vortical columns lose their coherence away from the bottom and top walls. However, as the Rayleigh number is decreased, the vortical columns become weaker and eventually seem to disappear completely in the region away from the side walls. Figure 9(a,b) for $Ra = 1 \times {10^6}$ shows no columnar structures in the bulk but only wall modes adjacent to the side walls in agreement with earlier studies (Zhong et al. Reference Zhong, Ecke and Steinberg1991; Favier & Knobloch Reference Favier and Knobloch2020; Ecke et al. Reference Ecke, Zhang and Shishkina2022). The coherent structures, i.e. wall modes, are present only near the side walls, leading to a lower value of r. Due to the absence of any structures away from the side walls, the role of conduction in the heat transfer through this region can be expected to become more important (the vertical velocity in this region is nearly zero, not shown).

Figure 8. Variation of the normalized cross-correlation coefficient r (see (5.1)) with $Ra$.

Figure 9. Snapshots of the temperature fields at $E = 1.2 \times {10^{ - 4}}$ and $\varGamma = 2.5$ spanning the entire horizontal extent of the domain. In all the snapshots, the colour bar shows the non-dimensional temperature field, i.e. $T = (T - {T_t})/({T_b} - {T_t}\; )$.

Although the details may be different, similar changes in the overall flow structure may be expected to persist for rough walls: the optimum combination of the coherence and strength of the columnar structures occurring in the RC regime at a particular $Ra = R{a_{peak}}$, leading to a maximum in the heat transfer enhancement due to roughness. For smooth walls, the cross-correlation coefficient attains its maximum at $Ra = 4 \times {10^6}$ (for $E = 1.2 \times {10^{ - 4}}$) and $Ra = 8 \times {10^7}$ (for $E = 1.4 \times {10^{ - 5}}$), i.e. close to $R{a_t}$. If the maximum of r for rough wall convection also occurs close to $R{a_t}$, then the heat transfer enhancement due to roughness may also be expected to occur in the vicinity of $R{a_t}$. Note that for rough walls, $R{a_{peak}}$ for $E = 1.2 \times {10^{ - 4}}$ and $E = 1.4 \times {10^{ - 5}}$ indeed lies close to $R{a_t}$ for the respective cases. For $Ra > R{a_{peak}}$, the lower vertical coherence of the structures, as discussed earlier, may be expected to decrease the heat transfer enhancement due to the wall roughness. Eventually, as the vertical coherence continues to decay with a further increase in $Ra$, the enhancement in heat transfer due to Ekman pumping ($Nu(\varOmega )/Nu(\varOmega = 0)$) for rough walls becomes weaker than that for smooth walls (see figure 6a), i.e. a weakening or ‘disruption’ (Joshi et al. Reference Joshi, Rajaei, Kunnen and Clercx2017) of the Ekman pumping mechanism is observed. However, as these columnar structures weaken for $Ra < R{a_{peak}}$ and the contribution of conduction to the heat transfer through the bulk increases (convection still dominates in the wall modes), the effect of the wall roughness there may be expected to be smaller, again leading to a decrease in $N{u_R}/N{u_S}$. Eventually, at a low enough $Ra$, $Nu(\varOmega )/Nu(\varOmega = 0)$ for rough walls is seen to approach that for smooth walls (figure 6a). Since the proposed explanation for rough wall RRBC is based on smooth-wall DNS, further DNS with rough walls or optical measurements of velocity and temperature fields are required to corroborate the proposed phenomenology.

As hypothesized by Joshi et al. (Reference Joshi, Rajaei, Kunnen and Clercx2017), Ekman pumping weakens or is disrupted when $\delta _E^R\mathrm{\ \mathbin{\lower.3ex\hbox{$\buildrel< \over {\smash{\scriptstyle\sim}\vphantom{_x}}$}}\ }k$ and is again reestablished when $\delta _E^R \ll k$. However, in the present study, for a given $Ra$, both the enhancement and weakening of the effect of Ekman pumping are observed at a constant $\delta _E^R\mathrm{\ \mathbin{\lower.3ex\hbox{$\buildrel< \over {\smash{\scriptstyle\sim}\vphantom{_x}}$}}\ }k$. The present observations, thus, do not support the hypothesis of Joshi et al. (Reference Joshi, Rajaei, Kunnen and Clercx2017) and suggest that once the Ekman boundary layer thickness becomes comparable to the roughness scale, the enhancement and weakening of Ekman pumping are the result of the varying vertical coherence and strength of the vortical columns. Note that the ‘reestablishment’ of Ekman pumping observed by Joshi et al. (Reference Joshi, Rajaei, Kunnen and Clercx2017) occurs close to the transition to regime III for smooth walls, which is marked by the maximum of $Nu(\varOmega )/Nu(\varOmega = 0)$, when the coherence of the columns is expected to be high.

6. Conclusion

The present study is the first to report on the effect of rough walls on the heat transfer at low $Ra$ in rotating Rayleigh–Bénard convection (RRBC). The present results suggest that this effect is modulated by the strength and coherence of the vortical columnar structures. This modulation also leads to a lowering of $R{a_t}$, which is an indicator of the transition between the heat transfer regimes RC and RA. Since the lowest $Ra$ attained in the present study is an order of magnitude higher than the expected $Ra$ for the onset of convection, the effect of boundary roughness on the onset of convection remains unclear. The present work delineates the path for future investigations using numerical simulations for rough-wall convection and optical measurements to explore the flow structure and its impact on the heat transfer in rough-wall RRBC.

Acknowledgments

We performed our numerical simulations on PARAM Sanganak, the supercomputing facility at IIT Kanpur. We also thank Prof. M.K. Verma for allowing the use of the finite difference code SARAS developed by his group, and Mohammad Anas for developing a GPU-accelerated version of the same.

Funding

This work was funded by Science and Engineering Research Board (SERB), Department of Science & Technology, Government of India, project no. SRG/2019/001037.

Declaration of Interests

The authors report no conflict of interest.

Appendix

All the data included in the present study are presented in the tables that follow: data from experiments in table 4 and those from DNS in table 5. The uncertainty in the Nusselt number is presented in the form $Nu \pm 4{\mathrm{\Delta }_{Nu}}$ (see § 4.1 for its definition).

Table 4. Experimental data for Rayleigh–Bénard convection over smooth and rough walls for $\varGamma \approx 6.67$, $2.78$ and $1.04$. Note that ${T_m} = 29 \pm 0.05$, i.e. $Pr = 5.7 \pm 0.007$.

Table 5. DNS data for Rayleigh–Bénard convection over smooth walls for $\varGamma = 2.5$ and 1.

References

Acton. 1966 Analysis of Straight-Line Data. John Wiley & Sons.Google Scholar
Ahlers, G. & Xu, X. 2001 Prandtl-number dependence of heat transport in turbulent Rayleigh–Bénard convection. Phys. Rev. Lett. 86, 3320.Google Scholar
Anas, M. & Joshi, P. 2023 Critical Prandtl number for heat transfer enhancement in rotating convection. arXiv:2307.12525.CrossRefGoogle Scholar
Assenheimer, M. & Steinberg, V. 1996 Observation of coexisting upflow and downflow hexagons in Boussinesq Rayleigh–Bénard convection. Phys. Rev. Lett. 76 (5), 756759.CrossRefGoogle ScholarPubMed
Aurnou, J.M., Calkins, M.A., Cheng, J.S., Julien, K., King, E.M., Nieves, D., Soderlund, K.M. & Stellmach, S. 2015 Rotating convective turbulence in earth and planetary cores. Phys. Earth Planet. Inter. 246, 5271.CrossRefGoogle Scholar
Bloxham, J. & Gubbins, D. 1987 Thermal core–mantle interactions. Nature 325 (6104), 511–113.CrossRefGoogle Scholar
Bodenschatz, E., Pesch, W. & Ahlers, G. 2000 Recent developments in Rayleigh–Bénard convection. Annu. Rev. Fluid Mech. 32 (1), 709778.CrossRefGoogle Scholar
Chandrasekhar, S. 1961 Hydrodynamic and Hydromagnetic Stability. Dover.Google Scholar
Charlson, G.S. & Sani, R.L. 1975 Finite amplitude axisymmetric thermoconvective flows in a bounded cylindrical layer of fluid. J. Fluid Mech. 71 (2), 209229.CrossRefGoogle Scholar
Cheng, J.S., Aurnou, J.M., Julien, K. & Kunnen, R.P.J. 2018 A heuristic framework for next-generation models of geostrophic convective turbulence. Geophys. Astrophys. Fluid Dyn. 112 (4), 277300.CrossRefGoogle Scholar
Cheng, J.S., Madonia, M., Aguirre Guzmán, A.J. & Kunnen, R.P.J. 2020 Laboratory exploration of heat transfer regimes in rapidly rotating turbulent convection. Phys. Rev. Fluids 5 (11), 113501.CrossRefGoogle Scholar
Cheng, J.S., Stellmach, S., Ribeiro, A., Grannan, A., King, E.M. & Aurnou, J.M. 2015 Laboratory-numerical models of rapidly rotating convection in planetary cores. Geophys. J. Intl 201 (1), 117.CrossRefGoogle Scholar
Chilla, F., Ciliberto, S., Innocenti, C. & Pampaloni, E. 1993 Boundary layer and scaling properties in turbulent thermal convection. Il Nuovo Cimento D 15, 12291249.CrossRefGoogle Scholar
Cioni, S., Ciliberto, S. & Sommeria, J. 1997 Strongly turbulent Rayleigh–Bénard convection in mercury: comparison with results at moderate Prandtl number. J. Fluid Mech. 335, 111140.CrossRefGoogle Scholar
De Wit, X.M., Boot, W.J.M., Madonia, M., Aguirre Guzmán, A.J. & Kunnen, R.P.J. 2023 Robust wall modes and their interplay with bulk turbulence in confined rotating Rayleigh–Bénard convection. Phys. Rev. Fluids 8 (7), 073501.CrossRefGoogle Scholar
Dong, D.-L., Wang, B.-F., Dong, Y.-H., Huang, Y.-X., Jiang, N., Liu, Y.-L., Lu, Z.-M., Qiu, X., Tang, Z.-Q. & Zhou, Q. 2020 Influence of spatial arrangements of roughness elements on turbulent Rayleigh–Bénard convection. Phys. Fluids 32 (4), 045114.CrossRefGoogle Scholar
Du, Y.B. & Tong, P. 1998 Enhanced heat transport in turbulent convection over a rough surface. Phys. Rev. Lett. 81 (5), 987990.CrossRefGoogle Scholar
Ecke, R.E. 2023 Rotating Rayleigh–Bénard convection: bits and pieces. Physica D: Nonlinear Phenom. 444, 133579.CrossRefGoogle Scholar
Ecke, R.E. & Shishkina, O. 2023 Turbulent rotating Rayleigh–Bénard convection. Annu. Rev. Fluid Mech. 55 (1), 603638.CrossRefGoogle Scholar
Ecke, R.E., Zhang, X. & Shishkina, O. 2022 Connecting wall modes and boundary zonal flows in rotating Rayleigh–Bénard convection. Phys. Rev. Fluids 7 (1), L011501.CrossRefGoogle Scholar
Favier, B. & Knobloch, E. 2020 Robust wall states in rapidly rotating Rayleigh–Bénard convection. J. Fluid Mech. 895, R1.CrossRefGoogle Scholar
Funfschilling, D., Brown, E., Nikolaenko, A. & Ahlers, G. 2005 Heat transport by turbulent Rayleigh–Bénard convection in cylindrical samples with aspect ratio one larger. J. Fluid Mech. 536, 145154.CrossRefGoogle Scholar
Greenspan, H. 1968 The Theory of Rotating Fluids, 1st edn. Cambridge University Press.Google Scholar
Grossmann, S. & Lohse, D. 2003 On geometry effects in Rayleigh–Bénard convection. J. Fluid Mech. 486, 105114.CrossRefGoogle Scholar
Hartmann, R., Yerragolam, G.S., Verzicco, R., Lohse, D. & Stevens, R.J.A.M. 2023 Optimal heat transport in rotating Rayleigh–Bénard convection at large Rayleigh numbers. Phys. Rev. Fluids 8, 083501.Google Scholar
Hawkins, E.K., Cheng, J.S., Abbate, J.A., Pilegard, T., Stellmach, S., Julien, K. & Aurnou, J.M. 2023 Laboratory models of planetary core-style convective turbulence. Fluids 8 (4), 106.CrossRefGoogle Scholar
Herrmann, J. & Busse, F.H. 1993 Asymptotic theory of wall-attached convection in a rotating fluid layer. J. Fluid Mech. 255 (1), 183.CrossRefGoogle Scholar
Homsy, G.M. & Hudson, J.L. 1971 The asymptotic stability of a bounded rotating fluid heated from below: conductive basic state. J. Fluid Mech. 45 (2), 353.CrossRefGoogle Scholar
Horn, S. & Aurnou, J.M. 2018 Regimes of Coriolis-centrifugal convection. Phys. Rev. Lett. 120 (20), 204502.CrossRefGoogle ScholarPubMed
Horn, S. & Aurnou, J.M. 2019 Rotating convection with centrifugal buoyancy: numerical predictions for laboratory experiments. Phys. Rev. Fluids 4 (7), 073501.CrossRefGoogle Scholar
Joshi, P., Rajaei, H., Kunnen, R.P.J. & Clercx, H.J.H. 2017 Heat transfer in rotating Rayleigh–Bénard convection with rough plates. J. Fluid Mech. 830, 112.CrossRefGoogle Scholar
Julien, K., Aurnou, J.M., Calkins, M.A., Knobloch, E., Marti, P., Stellmach, S. & Vasil, G.M. 2016 A nonlinear model for rotationally constrained convection with Ekman pumping. J. Fluid Mech. 798, 5087.CrossRefGoogle Scholar
King, E.M., Stellmach, S. & Aurnou, J. M. 2012 Heat transfer by rapidly rotating Rayleigh–Bénard convection. 691, 568582.Google Scholar
King, E.M., Stellmach, S. & Buffett, B. 2013 Scaling behaviour in Rayleigh–Bénard convection with and without rotation. 717, 449471.Google Scholar
King, E.M., Stellmach, S., Noir, J., Hansen, U. & Aurnou, J.M. 2009 Boundary layer control of rotating convection systems. Nature 457 (7227), 301304.CrossRefGoogle ScholarPubMed
Kumar, P., Chakraborty, S., Srinivasan, K. & Dutta, P. 2002 Rayleigh–Bénard convection during solidification of an eutectic solution cooled from the top. Metall. Mater. Trans. B 33 (4), 605612.CrossRefGoogle Scholar
Kunnen, R.P.J. 2021 The geostrophic regime of rapidly rotating turbulent convection. J. Turbul. 22 (4–5), 267296.CrossRefGoogle Scholar
Kunnen, R.P.J., Ostilla-Mónico, R., van der Poel, E.P., Verzicco, R. & Lohse, D. 2016 Transition to geostrophic convection: the role of the boundary conditions. J. Fluid Mech. 799, 413432.CrossRefGoogle Scholar
Liot, O., Salort, J., Kaiser, R., du Puits, R. & Chillà, F. 2016 Boundary layer structure in a rough Rayleigh–Bénard cell filled with air. J. Fluid Mech. 786, 275293.CrossRefGoogle Scholar
Liu, Y. & Ecke, R.E. 1997 Heat transport scaling in turbulent Rayleigh–Bénard convection: effects of rotation and Prandtl number. Phys. Rev. Lett. 79 (12), 22572260.CrossRefGoogle Scholar
Lu, H.-Y., Ding, G.-Y., Shi, J.-Q., Xia, K.-Q. & Zhong, J.-Q. 2021 Heat-transport scaling and transition in geostrophic rotating convection with varying aspect ratio. Phys. Rev. Fluids 6 (7), L071501.CrossRefGoogle Scholar
Madonia, M., Aguirre Guzmán, A.J., Clercx, H.J.H. & Kunnen, R.P.J. 2023 Reynolds number scaling and energy spectra in geostrophic convection. J. Fluid Mech. 962, A36.CrossRefGoogle ScholarPubMed
Maxworthy, N. 1994 Unsteady, turbulent convection into a homogeneous, rotating fluid, with oceanographic applications. J. Phys. Oceanogr. 24.2.0.CO;2>CrossRefGoogle Scholar
Nakagawa, Y. & Frenzen, P. 1955 A theoretical and experimental study of cellular convection in rotating fluids. Tellus 7 (1), 121.CrossRefGoogle Scholar
Niiler, P.P. & Bisshopp, F.E. 1965 On the influence of coriolis force on onset of thermal convection. J. Fluid Mech. 22 (4), 753.CrossRefGoogle Scholar
Pedlosky, J. 1987 Geophysical Fluid Dynamics, 2nd edn. Springer.CrossRefGoogle Scholar
Puthenveettil, B.A. & Arakeri, J.H. 2005 Plume structure in high-Rayleigh-number convection. J. Fluid Mech. 542 (1), 217.CrossRefGoogle Scholar
Qiu, X.L., Xia, K.Q. & Tong, P. 2005 Experimental study of velocity boundary layer near a rough conducting surface in turbulent natural convection. J. Turbul. 6, 113.CrossRefGoogle Scholar
Rajaei, H., Joshi, P., Alards, K.M.J., Kunnen, R.P.J., Toschi, F. & Clercx, H.J.H. 2016 Transitions in turbulent rotating convection: a Lagrangian perspective. Phys. Rev. E 93 (4), 043129.CrossRefGoogle ScholarPubMed
Rana, B.K. 2023 Mixed convection heat transfer from swirling open spherical cavity. ASME J. Heat Mass Transfer 145 (6), 062601.CrossRefGoogle Scholar
Rossby, H.T. 1969 A study of Bénard convection with and without rotation. J. Fluid Mech. 36 (2), 309335.CrossRefGoogle Scholar
Salort, J., Liot, O., Rusaouen, E., Seychelles, F., Tisserand, J.C., Creyssels, M., Castaing, B. & Chillà, F. 2014 Thermal boundary layer near roughnesses in turbulent Rayleigh–Bénard convection: flow structure and multistability. Phys. Fluids 26 (1), 015112.CrossRefGoogle Scholar
Samuel, R., Bhattacharya, S., Asad, A., Chatterjee, S., Verma, M., Samtaney, R. & Anwer, S. 2021 SARAS: a general-purpose PDE solver for fluid dynamics. J. Open Source Softw. 6 (64), 2095.CrossRefGoogle Scholar
Shen, Y., Tong, P. & Xia, K.Q. 1996 Turbulent convection over rough surfaces. Phys. Rev. Lett. 76 (6), 908911.CrossRefGoogle ScholarPubMed
Shishkina, O. 2021 Rayleigh–Bénard convection: the container shape matters. Phys. Rev. Fluids 6 (9), 090502.CrossRefGoogle Scholar
Shraiman, B.I., Avenue, M., Hill, M. & Siggia, E.D. 1990 Heat transport in high-Rayleigh number convection. Phys. Rev. A 42 (6), 36503653.CrossRefGoogle ScholarPubMed
Sprague, M., Julien, K., Knobloch, E. & Werne, J. 2006 Numerical simulation of an asymptotically reduced system for rotationally constrained convection. J. Fluid Mech. 551 (1), 141.CrossRefGoogle Scholar
Stellmach, S., Lischper, M., Julien, K., Vasil, G., Cheng, J.S., Ribeiro, A., King, E.M. & Aurnou, J.M. 2014 Approaching the asymptotic regime of rapidly rotating convection: boundary layers versus interior dynamics. Phys. Rev. Lett. 113 (25), 254501.CrossRefGoogle ScholarPubMed
Stevens, R.J.A.M., Clercx, H.J.H. & Lohse, D. 2010 Boundary layers in rotating weakly turbulent Rayleigh–Bénard convection. Phys. Fluids 22 (8), 085103.CrossRefGoogle Scholar
Stevens, R.J.A.M., Clercx, H.J.H. & Lohse, D. 2013 Heat transport and flow structure in rotating Rayleigh–Bénard convection. Eur. J. Mech. B/Fluids 40, 4149.CrossRefGoogle Scholar
Stevens, R.J.A.M., Zhong, J.-Q., Clercx, H.J.H., Ahlers, G. & Lohse, D. 2009 Transitions between turbulent states in rotating Rayleigh–Bénard convection. Phys. Rev. Lett. 103 (2), 024503.CrossRefGoogle ScholarPubMed
Tummers, M.J. & Steunebrink, M. 2019 Effect of surface roughness on heat transfer in Rayleigh–Bénard convection. Intl J. Heat Mass Transfer 139, 10561064.CrossRefGoogle Scholar
Turcotte, D.L. & Oxburgh, E.R. 1967 Finite amplitude convective cells and continental drift. J. Fluid Mech. 28 (1), 2942.CrossRefGoogle Scholar
Verma, M.K. 2018 Physics of Buoyant Flows: From Instabilities to Turbulence, vol. 3, pp. 39155. World Scientific.CrossRefGoogle Scholar
Verma, M.K., Mishra, P.K., Pandey, A. & Paul, S. 2012 Scalings of field correlations and heat transport in turbulent convection. Phys. Rev. E 85 (1), 016310.CrossRefGoogle ScholarPubMed
Verma, M.K., Samuel, R., Chatterjee, S., Bhattacharya, S. & Asad, A. 2020 Challenges in fluid flow simulations using exascale computing. SN Comput. Sci. 1 (3), 178.CrossRefGoogle Scholar
Wagner, S. & Shishkina, O. 2013 Aspect-ratio dependency of Rayleigh–Bénard convection in box-shaped containers. Phys. Fluids 25 (8), 085110.CrossRefGoogle Scholar
Wei, P., Chan, T.S., Ni, R., Zhao, X.Z. & Xia, K.Q. 2014 Heat transport properties of plates with smooth and rough surfaces in turbulent thermal convection. J. Fluid Mech. 740, 2846.CrossRefGoogle Scholar
Xi, H.-D., Lam, S. & Xia, K.-Q. 2004 From laminar plumes to organized flows: the onset of large-scale circulation in turbulent thermal convection. J. Fluid Mech. 503, 4756.CrossRefGoogle Scholar
Xia, K.-Q., Huang, S.-D., Xie, Y.-C. & Zhang, L. 2023 Tuning heat transport via coherent structure manipulation: recent advances in thermal turbulence. Natl Sci. Rev. 10 (6), nwad012.CrossRefGoogle ScholarPubMed
Xie, Y.C. & Xia, K.Q. 2017 Turbulent thermal convection over rough plates with varying roughness geometries. J. Fluid Mech. 825, 573599.CrossRefGoogle Scholar
Yang, J.-L., Zhang, Y.-Z., Jin, T., Dong, Y.-H., Wang, B.-F. & Zhou, Q. 2021 The dependence of the critical roughness height in two-dimensional turbulent Rayleigh–Bénard convection. J. Fluid Mech. 911, A52.CrossRefGoogle Scholar
Zhang, K. & Liao, X. 2009 The onset of convection in rotating circular cylinders with experimental boundary conditions. J. Fluid Mech. 622, 6373.CrossRefGoogle Scholar
Zhang, Y.-Z., Sun, C., Bao, Y. & Zhou, Q. 2018 How surface roughness reduces heat transport for small roughness heights in turbulent Rayleigh–Bénard convection. J. Fluid Mech. 836, R2.CrossRefGoogle Scholar
Zhong, F., Ecke, R. & Steinberg, V. 1991 Asymmetric modes and the transition to vortex structures in rotating Rayleigh–Bénard convection. Phys. Rev. Lett. 67 (18), 24732476.CrossRefGoogle ScholarPubMed
Zhong, F., Ecke, R.E. & Steinberg, V. 1993 Rotating Rayleigh–Bénard convection: asymmetric modes and vortex states. J. Fluid Mech. 249 (1), 135.CrossRefGoogle Scholar
Zhong, J.-Q., Stevens, R.J.A.M., Clercx, H.J.H., Verzicco, R., Lohse, D. & Ahlers, G. 2009 Prandtl-, Rayleigh-, and Rossby-number dependence of heat transport in turbulent rotating Rayleigh–Bénard convection. Phys. Rev. Lett. 102 (4), 044502.CrossRefGoogle ScholarPubMed
Zhu, X., Stevens, R.J.A.M., Verzicco, R. & Lohse, D. 2017 Roughness-facilitated local 1/2 scaling does not imply the onset of the ultimate regime of thermal convection. Phys. Rev. Lett. 119 (15), 154501.CrossRefGoogle Scholar
Figure 0

Figure 1. (a) Schematic of the experimental set-up (not to scale): 1, rotating tabletop; 2, intermediate aluminium plate; 3, insulation for the bottom copper plate; 4, aluminium shield for bottom copper plate; 5, bottom copper plate; 6, top copper plate; 7, heating resistor; 8, working fluid; 9, acrylic side walls; 10, insulation for the sidewalls; 11, aluminium shield for the side walls. (b) Top view of the top copper plate showing the channels for the cooling fluid and the holes used for accommodating the temperature sensors. (c) Wetted side of the top copper plate. Crests of the tetrahedral roughness elements form a hexagonal pattern, as highlighted. (d) Side view of the top copper plate with an enlarged view of the roughness elements. Note that roughness elements with the same geometry are provided on the bottom copper plate.

Figure 1

Figure 2. Variation of the temperature measured by the sensors in the (a) bottom plate and the (b) top plate with time. P1 and P2 are the Pt100 sensors in the bottom and top plates, while T1–T4 and T5–T8 are the thermistors in the bottom and top plates, respectively. Here, $\mathrm{\Delta }T = 6.06\; \textrm{K}$, $Ra = 6.79 \times {10^6}$.

Figure 2

Figure 3. Variation of the instantaneous Nusselt number ($\widetilde {Nu}$) with time. The horizontal line indicates the data considered to calculate $Nu$. Here, $Ra = 5.8 \times {10^6}$, $E = \infty $, $Pr = 5.7$.

Figure 3

Figure 4. Variation of $Nu$ with $Ra$ for (a) non-rotating RBC with smooth boundaries (green downward triangles: $\varGamma = 6.35$, $Pr = 6.8$, Rossby (1969); blue circles: $\varGamma = 0.78$, $Pr = 6.3$, Liu & Ecke 1997). (b) Rotating RBC with smooth boundaries. For all present data, $Pr = 5.7$. The black solid and dashed lines in panels (a) and (b) are the same. Note that all the dashed trend lines in panel (b) denote the power law $Nu\sim R{a^\beta }$ that is fitted to the data falling on the respective trend lines using least square method. Blue, $\beta = 0.87$; red, $\beta = 1.2$; cyan, $\beta = 1.13$; magenta, $\beta = 1.22$. Error bars in panel (a) are smaller than the symbol size and are not shown.

Figure 4

Table 1. Values of $\gamma $ in the scaling law $Nu\sim aR{a^\gamma }$ for non-rotating convection. Uncertainty in $\gamma $ is represented as $\gamma \pm 2{\mathrm{\Delta }_\gamma }$, where ${\mathrm{\Delta }_\gamma }$ is the estimated standard error in $\gamma $, $\mathrm{\Delta }_\gamma ^2 = ({S_{\phi \phi }}\; {S_{\psi \psi }} - S_{\phi \psi }^2)/[(n - 2)S_{\phi \phi }^2\; ]$, n is the number of data points ($Ra,Nu$) used for linear regression, $\phi = \textrm{ln}\,Ra$, $\psi = \textrm{ln}\,Nu$, and ${S_{\phi \psi }} = \sum\nolimits_{i = 1}^n {({\phi _i} - \bar{\phi })({\psi _i} - \bar{\psi })} $ is the covariance of $\phi $ and $\psi $ (Acton 1966). $\overline {()} $ denotes the mean of the data set. For rough walls, H is calculated from the middle of the valleys.

Figure 5

Table 2. Values of the exponent $\beta $ in the scaling law $Nu\sim R{a^\beta }$ in the RC regime. The values of $\beta $ are calculated using least squares fit to the data falling on the trend line in the RC regime. Subscripts S and R for $\beta $ denote smooth and rough boundaries, respectively. ${\sim} $ denotes insufficient data to estimate the exponent. For $E = 1.2 \times {10^{ - 4}}$ and $\varGamma = 2.78$, both experiments and simulations separately yield ${\beta _S} \approx 1.2$.

Figure 6

Table 3. Summary of $R{a_t}$ for various E for smooth and rough boundaries. Note that at $E = 1.2 \times {10^{ - 4}}$, $R{a_t}$ is approximately the same from simulations and experimental data, separately. Note that, due to insufficient data for rough walls, $R{a_t}$ is not calculated at $E = 7.55 \times {10^{ - 4}}$ and $5.9 \times {10^{ - 5}}$.

Figure 7

Figure 5. Variation of $Nu$ as a function of $Ra$ for (a) non-rotating RBC with rough boundaries and (b) rotating RBC with rough boundaries. In both panels (a) and (b), black solid line, $Nu = 0.12R{a^{0.30}}$ (smooth wall non-rotating RBC for $\varGamma = 2.78$, $6.67$); black dashed line, $Nu = 0.14R{a^{0.30}}$ (smooth wall non-rotating RBC for $\varGamma = 1.04$); green solid line, $Nu = 0.13R{a^{0.33}}$ (rough wall non-rotating RBC for $\varGamma = 2.78$, $6.67$); black dash-dotted line, $Nu = 0.04R{a^{0.39}}$ (rough wall non-rotating RBC for $\varGamma = 1.04$). Note that error bars are much smaller than the symbol size. In panel b, colour indicates the Ekman number. Open symbols: EXP; filled symbols: DNS; squares: smooth; diamonds: rough.

Figure 8

Figure 6. (a) Variation of $Nu(\varOmega )/Nu(\varOmega = 0)$ with $Ra$. (b) Variation of $N{u_R}/N{u_S}$ with $Ra$. The vertical dash-dotted lines in panel (b) denote $R{a_t}$ (see table 3) for rough walls for the corresponding Ekman number. The blue and cyan dash-dotted lines are only indicative since $R{a_t}$ could not be measured: the rough-wall data for $E = 7.55 \times {10^{ - 4}}$ (blue diamonds) and $E = 5.9 \times {10^{ - 5}}$ (cyan diamonds) lie entirely in the RA regime. In both panels, colour indicates the Ekman number. Open symbols: EXP; filled symbols: DNS; squares: smooth; diamonds: rough.

Figure 9

Figure 7. (a) Temperature profile in RRBC with smooth boundaries for $Ra = {10^6}$, $E = 1.2 \times {10^{ - 4}}$, $\varGamma = 2.5$. Here, red and blue dashed lines are the tangents to the temperature profile in the bulk and at the wall, respectively, while the magenta dashed line represents the temperature gradient at the wall, $\partial T/\partial z{ |_{wall}} = 1/N{u_R}$, for rough boundaries. (b) Variation of the thermal BL thickness with $Ra$ at various $E$. The horizontal black dashed line denotes the height of the roughness elements, $k = 4$ mm. (c) Variation of $\delta _\theta ^S/\delta _E^S$ and $\delta _\theta ^R/\delta _E^R$ with $Ra$ at various values of the Ekman number. Superscripts S and R denote smooth and rough boundaries, respectively. Vertical dashed lines and dash-dotted lines denote the $R{a_t}$ (see table 3) for smooth and rough boundaries, respectively, corresponding to that Ekman number. In both panels (b) and (c), colour indicates the Ekman number; squares: smooth; diamonds: rough. Magenta, $E = 7.55 \times {10^{ - 4}}$; red, $E = 1.2 \times {10^{ - 4}}$; cyan, $E = 5.9 \times {10^{ - 5}}$; blue, $E = 1.4 \times {10^{ - 5}}$. Cyan and blue, $\varGamma = 1.04$; red and magenta, $\varGamma \approx 2.78$. To avoid clutter, estimates of ${\delta _\theta }$ for smooth-wall experiments are not shown since they agree well with those based on the DNS data.

Figure 10

Figure 8. Variation of the normalized cross-correlation coefficient r (see (5.1)) with $Ra$.

Figure 11

Figure 9. Snapshots of the temperature fields at $E = 1.2 \times {10^{ - 4}}$ and $\varGamma = 2.5$ spanning the entire horizontal extent of the domain. In all the snapshots, the colour bar shows the non-dimensional temperature field, i.e. $T = (T - {T_t})/({T_b} - {T_t}\; )$.

Figure 12

Table 4. Experimental data for Rayleigh–Bénard convection over smooth and rough walls for $\varGamma \approx 6.67$, $2.78$ and $1.04$. Note that ${T_m} = 29 \pm 0.05$, i.e. $Pr = 5.7 \pm 0.007$.

Figure 13

Table 5. DNS data for Rayleigh–Bénard convection over smooth walls for $\varGamma = 2.5$ and 1.