Hostname: page-component-cd9895bd7-gxg78 Total loading time: 0 Render date: 2024-12-22T20:35:16.018Z Has data issue: false hasContentIssue false

Parametric study and scaling of a minijet-manipulated supersonic jet

Published online by Cambridge University Press:  05 December 2024
Changhao Tan*
Affiliation:
Center for Turbulence Control, Harbin Institute of Technology, Shenzhen 518055, PR China
Arun Kumar Perumal
Affiliation:
Jet Acoustics and Flow-Control Laboratory, Department of Aerospace Engineering, Indian Institute of Technology Kanpur, Kanpur 208016, India
Yu Zhou*
Affiliation:
Center for Turbulence Control, Harbin Institute of Technology, Shenzhen 518055, PR China School of Mechanics and Mechanical Engineering, College of Engineering, Eastern Institute of Technology, 315000 Ningbo, PR China
*
Email addresses for correspondence: [email protected], [email protected]

Abstract

This work aims to perform a parametric study on a round supersonic jet with a design Mach number Md = 1.8, which is manipulated using a single steady radial minijet with a view to enhancing its mixing. Four control parameters are examined, i.e. the mass flow rate ratio Cm and diameter ratio d/D of the minijet to main jet, and exit pressure ratio Pe/Pa and fully expanded jet Mach number Mj, where Pe and Pa are the nozzle exit and atmospheric pressures, respectively. Extensive pressure and schlieren flow visualization measurements are conducted on the natural and manipulated jets. The supersonic jet core length Lc/D exhibits a strong dependence on the four control parameters. Careful scaling analysis of experimental data reveals that Lc/D = f1(Cm, d/D, Pe/Pa, Mj) may be reduced to Lc/D = f2(ξ), where f1 and f2 are different functions. The scaling factor $\xi = J({d_i}/{D_j})/(\gamma M_j^2{P_e}/{P_a})$ is physically the penetration depth of the minijet into the main jet, where $J({d_i}/{D_j})$ is the square root of the momentum ratio of the minijet to main jet (di and Dj are the fully expanded diameters of d and D, respectively), γ is the specific heat ratio and $\gamma M_j^2{P_e}/{P_a}$ is the non-dimensional exit pressure ratio. Important physical insight may be gained from this scaling law into the optimal choice of control parameters such as d/D and Pe/Pa for practical applications. It has been found for the first time that the minijet may induce a street of quasi-periodical coherent structures once Cm exceeds a certain level for a given ${P_e}/{P_a}$. Its predominant dimensionless frequency Ste (≡ feDj/Uj) scales with a factor $\zeta = J({d_i}/{D_j})\; \sqrt {\gamma M_j^2{P_e}/{P_a}} $, which is physically the ratio of the minijet momentum thrust to the ambient pressure thrust. The formation mechanism of the street and its role in enhancing jet mixing are also discussed.

Type
JFM Papers
Copyright
© The Author(s), 2024. Published by Cambridge University Press

1. Introduction

Control of high-speed jets has been extensively studied over the past few decades due to its wide range of engineering applications, such as mixing enhancement, noise suppression, infrared reduction, ejector-thrust augmentation and thrust vectoring (Gutmark, Schadow & Yu Reference Gutmark, Schadow and Yu1995; Knowles & Saddington Reference Knowles and Saddington2006; Cattafesta & Sheplak Reference Cattafesta and Sheplak2011). Various techniques for manipulating supersonic jets have been developed in the past and can be passive and active. Passive methods, e.g. non-circular nozzles, modified lips and tabs, are widely used due to their easy implementation and high cost-effectiveness (Gutmark et al. Reference Gutmark, Schadow and Yu1995; Knowles & Saddington Reference Knowles and Saddington2006). However, being characterized by permanent fixtures, they are often only effective in a limited range of operating conditions and may not always produce desirable effects. For example, the passive control optimized to reduce noise during aircraft take-off and landing may lead to thrust loss during cruise (Seifert, Theofilis & Joslin Reference Seifert, Theofilis and Joslin2004). On the other hand, active techniques can be applied when needed, thus limiting thrust loss only during their activation, and may produce a drastic effect on manipulated jets (Cattafesta & Sheplak Reference Cattafesta and Sheplak2011).

One of the frequently used active techniques for the manipulation of high-speed jets is fluidic injection, also referred to as minijets, secondary jets and air tabs. This technique has been demonstrated to be quite successful in controlling high subsonic and supersonic jets (e.g. Krothapalli, Strykowski & King Reference Krothapalli, Strykowski and King1998; Ibrahim, Kunimura & Nakamura Reference Ibrahim, Kunimura and Nakamura2002; Coderoni, Lyrintzis & Blaisdell Reference Coderoni, Lyrintzis and Blaisdell2018; Semlitsch et al. Reference Semlitsch, Cuppoletti, Gutmark and Mihăescu2019), thus attracting a great deal of attention in the literature. There are many parameters associated with minijets, which may produce a profound influence on control performance, including the operating nozzle pressure ratio (NPR) (= P 0s/Pa, where P 0s and Pa are the stagnation pressure at the nozzle inlet and atmospheric pressure, respectively), the minijet injection angle $\theta $ with respect to main stream, the number N of minijets, the injection pressure ratio (IPR) (= P 0s,i/Pa, where P 0s,i is the stagnation pressure at the minijet inlet), the diameter ratio d/D, velocity ratio Ui/Uj and mass flow rate ratio Cm of the minijet to main jet. In his pioneering work, Davis (Reference Davis1982) studied the effect of d/D (= 1/8 and 1/16) on the mixing characteristics of a Mach number (M) 0.8 jet manipulated using two minijets. He discovered that, given Cm, a minijet of a smaller d/D may penetrate deeper into main jet, thus being more effective in manipulating the jet. To study the effect of IPR on jet mixing, Cuppoletti & Gutmark (Reference Cuppoletti and Gutmark2014) experimentally manipulated a design Mach number (Md) 1.56 jet in the over-expanded (NPR = 2.5) and under-expanded (NPR = 4.5) regimes using 24 minijets at IPR = 2.5–4.5. For a given NPR, jet mixing was enhanced with increasing IPR or Ui/Uj, which was accompanied by increasing Cm. Semlitsch et al. (Reference Semlitsch, Cuppoletti, Gutmark and Mihăescu2019) extended this work to a larger IPR range (2–8) using 12 minijets and found that an increase in IPR was associated with a deep penetration of the minijet into the main jet. Despite numerous previous investigations, there is a lack of systematic study on various control parameters such as Ui/Uj, d/D, IPR and Cm, which interweave and influence each other.

Recently, Perumal & Rathakrishnan (Reference Perumal and Rathakrishnan2022) manipulated a jet of Md = 2 via N = 2 minijets (d/D = 1/13) and found empirically that supersonic core length $L_c^\ast = {L_c}/D$, a quantitative indicator of jet mixing, scales with $\sqrt {\textit{MR}} /(\gamma M_j^2{P_e}/{P_a})$, where $\textit{MR}$ is the total momentum ratio of the minijet to main jet and $\gamma $, ${M_j}$ and Pe/Pa are the specific heat ratio, fully expanded jet Mach number and exit pressure ratio, respectively. In this paper, an asterisk denotes normalization by D. Khan et al. (Reference Khan, Nageswara Rao, Baghel, Perumal and Kumar2022) extended this scaling law to N = 3, 4, 6 minijets on a jet of Md = 1.5, and proposed a revised scaling factor, i.e. $\sqrt {{M}{{R}_N}} /(\gamma M_j^2{P_e}/{P_a})$, where ${M}{{R}_N}$ is the momentum ratio of the individual minijet to main jet. However, neither Perumal & Rathakrishnan (Reference Perumal and Rathakrishnan2022) nor Khan et al. (Reference Khan, Nageswara Rao, Baghel, Perumal and Kumar2022) studied supersonic jets manipulated by a single minijet notwithstanding the fact that the control performance of N = 1 may be better than that of N ≥ 2 (Perumal & Zhou Reference Perumal and Zhou2021). Then, whether their developed scaling laws could be valid for the case of N = 1 has yet to be confirmed. Furthermore, previous studies on the effect of d/D on jet mixing are focused on the manipulation of subsonic jets (Davis Reference Davis1982; Perumal, Verma & Rathakrishnan Reference Perumal, Verma and Rathakrishnan2015, Perumal & Zhou Reference Perumal and Zhou2018, Perumal et al. Reference Perumal, Wu, Fan and Zhou2022). To the authors’ best knowledge, this effect has never been documented for supersonic jet manipulation. Naturally, one may raise a question as to the robustness of the developed scaling laws for varying d/D. For a practical device such as an aircraft jet engine, the minijet would be drawn probably from the flow entering the nozzle, implying an IPR would not exceed the NPR (Henderson Reference Henderson2010). Thus, can we predict the optimal d/D from the scaling law for maximized jet mixing given the limiting scenario of IPR = NPR?

This study sets out to address the issues raised above, along with associated flow physics. Thus, the present work embarks on the systematic experimental study of an Md = 1.8 jet manipulated by a single minijet with various d/D and Pe/Pa, covering the over-expanded and perfectly expanded states. The jet mixing quantification is done through detailed Pitot pressure measurement and the flow structure of the manipulated jet is analysed through high-speed schlieren images captured along the injection and non-injection planes of the jet. The paper is organized as follows. Section 2 presents experimental details. The flow characteristics of the natural jet are briefly discussed in § 3, which is then followed by documenting the effect of Cm and d/D at various Pe/Pa and Mj on jet mixing in § 4. A new scaling law is proposed based on experimental data. The effect of the minijet on thrust vectoring is also investigated in § 5. Section 6 presents the finding of a street of quasi-periodical structures and scaling of its predominant frequency. This work is concluded in § 7.

2. Experimental details

2.1. Supersonic jet rig and control minijet

A schematic of the supersonic jet rig is given in figure 1. Air is compressed by a compressor and stored in three air tanks connected in series, with a total storage capacity of 8 m3 at a pressure of 12 bar. The compressed air from the storage tanks passes through pressure regulators and control valves before entering a plenum chamber. The chamber consists of a diffuser with a half-angle of 15° and a cylindrical settling chamber of 114 mm in diameter and 400 mm in length. The contraction section from 114 mm at the end of the settling chamber to 20 mm is the same as used in Perumal & Zhou (Reference Perumal and Zhou2018), whose contour is given by $D/2 = 57 - 47\,\textrm{si}{\textrm{n}^{1.5}}[{\rm \pi} /2 - 9(x+L)/8*\varPi/180]$, where L (= 30.68 mm) is the nozzle length. The required pressure in the settling chamber is achieved via a pressure regulating valve and is measured using a gauge transducer (MEAS M3234) with a pressure range of 0–7 bar. Two wire-mesh screens are placed at the diffuser and the settling chamber, respectively, to reduce the turbulence intensity. The nozzle mounted at the end of the contraction section can be replaced to obtain different design conditions.

Figure 1. Schematics of (a) supersonic jet facility and (b) schlieren flow visualization measurement. All lengths are in mm.

An axisymmetric converging–diverging nozzle is used to generate a jet of Md = 1.8. The converging section contracts from D 1 = 20 mm at the end of the contraction section to Dth = 8.34 mm at the throat, following a fifth-order polynomial function, i.e. $({D(x)} - {D_{th}})/(D_{1} - {D_{th}}) = 1\unicode{x2013} 10{[(x + L)/{L_1}]^3} + 15{[(x + L)/{L_1}]^4} - 6{[(x + L)/{L_1}]^5}$ (Zhang & Fan Reference Zhang and Fan2003), where L 1 (= 18 mm) is the length of the converging section. The diverging section is designed based on the method of characteristics presented in Zucrow & Hoffman (Reference Zucrow and Hoffman1976) from Dth to the nozzle exit diameter D = 10 mm.

A control minijet is issued from a stainless steel tube with an inner diameter d, whose axis is 0.15–0.25 mm downstream of the nozzle exit. Following Davis (Reference Davis1982), the tube exit is 2 mm away from the nozzle lip along the z direction so that the interference between the issuing minijet and the spreading shear layer of main jet can be minimized. Six different tubes are used, resulting in d/D = 1/20, 1/9.5, 1/7.7, 1/6.5, 1/5.3 and 1/4.1. The minijet comes from another chamber where the required pressure is separately maintained.

2.2. Flow conditions

The stagnation temperature T 0 of main jet and minijet is as ambient temperature Ta (= 300 K), i.e. T 0/Ta = 1. The NPR is from 3 to 6 for both natural and manipulated jets. The nozzle is calibrated following Akram, Perumal & Rathakrishnan (Reference Akram, Perumal and Rathakrishnan2021), and the design NPR, i.e. NPRd, as determined from the isentropic equation is 5.75 for the jet of Md = 1.8. Then, NPR < NPRd and NPR > NPRd correspond to the over- and under-expanded states, respectively. Parameters Mj and Pe/Pa are related via the isentropic relations:

(2.1)\begin{gather}{M_j} = {\left[ {({NP}{{R}^{(\gamma - 1)/\gamma }} - 1)\frac{2}{{\gamma - 1}}} \right]^{0.5}},\end{gather}
(2.2)\begin{gather}\frac{{{P_e}}}{{{P_a}}} = {\left( {\frac{{1 + \dfrac{{\gamma - 1}}{2}M_j^2}}{{1 + \dfrac{{\gamma - 1}}{2}M_d^2}}} \right)^{\gamma /(\gamma - 1)}},\end{gather}

where $\; \gamma = 1.4$ for air. From (2.1)–(2.2), the over- and under-expanded states of the jet correspond to Mj < Md or Pe/Pa < 1 and Mj > Md or Pe/Pa > 1, respectively. The velocity of the main jet may be calculated from the following equation:

(2.3)\begin{equation}{U_j} = \sqrt {\frac{{2\gamma }}{{\gamma - 1}}R{T_0}\left[ {1 - {{\left( {\frac{1}{{\textit{NPR}}}} \right)}^{(\gamma - 1)/\gamma }}} \right]} ,\end{equation}

where $R = 287\;\textrm{J}\;\textrm{k}{\textrm{g}^{ - 1}}\;{\textrm{K}^{ - 1}}$ is the gas constant for air. The Reynolds numbers $Re = {\rho _j}D{U_j}/{\mu _j}$ of the jet at the minimum and maximum NPR or Mj are 4.5 × 105 and 8.0 × 105, respectively, where the jet density ρj is determined from

(2.4)\begin{equation}{\rho _j} = {\left.{\left( {\frac{{\textit{NPR} \times {P_a}}}{{R{T_0}}}} \right)} \right/ {{{\left( {1 + \frac{{\gamma - 1}}{2}M_j^2} \right)}^{1/(\gamma - 1)}}}},\end{equation}

and μj is the viscosity calculated based on Sutherland's formula (Anderson, Tannehill & Pletcher Reference Anderson, Tannehill and Pletcher1984). Table 1 lists NPR, Mj, Uj, Pe/Pa and other parameters of interest.

Table 1. Flow conditions for the natural jet of design Mach number Md = 1.8.

The IPR varies from 2 to 8 and ${C_m} = {\dot{m}_i}/{\dot{m}_j}$ is between 0.18 % and 11.87 % for various d/D (table 2), where ${\dot{m}_i}$ and ${\dot{m}_j}$ are the minijet and main jet mass flow rates, respectively. Both ${\dot{m}_i}$ and ${\dot{m}_j}$ are calculated from the isentropic equations:

(2.5)\begin{gather}{\dot{m}_i} = 0.6847\frac{{{P_{0s,i}}{A_i}}}{{\sqrt {R{T_0}} }},\end{gather}
(2.6)\begin{gather}{\dot{m}_j} = 0.6847\frac{{{P_{0s}}{A_j}}}{{\sqrt {R{T_0}} }},\end{gather}

where ${A_i} = {\rm \pi}{d^2}/4$ and ${A_j} = {\rm \pi}D_{th}^2/4$. The mass flow rate of a jet calculated from inviscid compressible flow theory would be close to its actual mass flow rate if the nozzle diameter exceeds 0.35 mm (Jindra Reference Jindra1970). The present minimum d is 0.5 mm. Furthermore, both minijet and main jet are choked (IPR > 1.89 and NPR > 1.89) so that (2.5)–(2.6) can be used to calculate ${\dot{m}_i}$ and ${\dot{m}_j}$. The velocity Ui and fully expanded Mach number Mi of the minijet can be estimated from

(2.7)\begin{gather}{U_i} = \sqrt {\frac{{2\gamma }}{{\gamma - 1}}R{T_0}\left[ {1 - {{\left( {\frac{1}{{\textit{IPR}}}} \right)}^{(\gamma - 1)/\gamma }}} \right]} ,\end{gather}
(2.8)\begin{gather}{M_i} = {\left[ {({IP}{{R}^{(\gamma - 1)/\gamma }} - 1)\frac{2}{{\gamma - 1}}} \right]^{0.5}}.\end{gather}

Table 2. Mass flow rate ratio Cm of minijet to main jet for various IPRs at exit pressure ratio Pe/Pa = 0.70 (NPR = 4).

2.3. Pressure measurement and flow visualization

The total pressure of the main jet is measured using a Pitot tube with inner and outer diameters of 0.6 and 0.9 mm, respectively, which is connected to a miniature pressure transducer (MEAS XPM4-5BA-/ET1) with a measurement range of 0–5 bar and linearity up to a maximum departure of 0.25 %. During measurements, the Pitot probe induces a bow shock wave ahead of its head (figure 2). Therefore, the measured total pressure could be less than the actual total pressure due to the pressure loss associated with the shock wave. The total pressure loss is negligibly small since the shock strength is impaired as the Pitot probe is moved downstream and the flow upstream of the bow shock wave is virtually undisturbed (Katanoda et al. Reference Katanoda, Miyazato, Masuda and Matsuo2000). As such, no correction is made for the pressure measurement. Rathakrishnan (Reference Rathakrishnan2016) advocated that, when the ratio of the nozzle exit area to the probe projected area is greater than 64, the probe interference to the flow is negligibly small. This view is reinforced by numerous investigations. Miller et al. (Reference Miller, Veltin, Morris and Mclaughlin2009) compared the total pressure measured using a Pitot probe and that calculated from the Reynolds-averaged Navier–Stokes (RANS) simulation of Mj = 1.3 and 1.5 jets. Their blockage ratio was 161. The two sets of data show excellent agreement (their figure 10) even at x* = 0–2, where a strong shock occurred due to the presence of the Pitot probe (figure 2). Miller & Veltin (Reference Miller and Veltin2011) compared the velocity profiles of an Mj = 1.5 jet at various x* (up to 8), measured from a rake of five Pitot probes, with that of the RANS simulation. Their blockage ratio was about 90. The comparison was very good (their figures 3 and 4), especially when the total temperature ratio was less than 3.6 (the present ratio is about 1). A similar observation was also made by André, Castelain & Bailly (Reference André, Castelain and Bailly2013) for Mj = 1.15 and 1.5 jets where the Pitot-probe-measured velocities were compared with laser Doppler velocimetry data (their probe blockage ratio was 652). As a matter of fact, the Pitot probe blockage effects are insignificant even when the probe blockage ratio is smaller than 64. For example, Katanoda et al. (Reference Katanoda, Miyazato, Masuda and Matsuo2000) observed in an ${M_j} = 2$ jet that the total pressure, measured using a Pitot probe with a blockage ratio of 42, agreed well with numerical simulation based on the Euler equation. Phalnikar, Kumar & Alvi (Reference Phalnikar, Kumar and Alvi2008) showed that the shock-cell spacing measured using a Pitot probe with a blockage ratio of 16 was in excellent agreement with the estimate from shadowgraph images (their figures 7 and 8). The present probe blockage ratio is 123, and the probe interference to the flow should be negligibly small.

Figure 2. Schlieren images of supersonic natural jets, NPR = 4.0 (${P_e}/{P_a} = 0.70$). Pitot tube at various x* locations.

The Pitot tube is traversed within the range of (x*, y*, z*) = (0–20, −2–2, −2–2). As noted by Perumal & Rathakrishnan (Reference Perumal and Rathakrishnan2022), the measured pressure P 0t can be used to determine $L_c^\ast $, which is currently used to quantify jet mixing. The Re based on the inner diameter of the Pitot tube is 104, well above 200, and therefore the viscous effect on the measured total pressure can be safely neglected (Chue Reference Chue1975). The raw data are recorded at a sampling frequency of 2000 Hz for a duration of 2 s by a PC through a 16-bit National Instruments DAQ board (6361) and then fed into LabVIEW for data processing.

A conventional Z-type schlieren system is used for flow visualization (figure 1b). Two concave mirrors, each with a diameter of 200 mm and a focal length of 2000 mm, have a surface finish of λ/10, where λ denotes the light wavelength. Illumination is provided by a white-light source that passes through two condenser lenses before reaching one of the concave mirrors. A parallel beam from the first mirror passes through the test section before being projected on another mirror and is then focused on a knife edge before being projected on a screen. The time-averaged and instantaneous images are recorded at a sampling frequency of 300–1000 Hz with an exposure of 1000 μs and 30–90 kHz with an exposure of 1–3 μs, respectively, using a Dantec camera (2560 × 1600 pixels), and then processed using PCC 2.12 software.

3. Natural jet

The schlieren images of the natural jet at NPR = 4–6 (figure 3) display the familiar periodic shock-cell structure for a supersonic jet (e.g. Munday et al. Reference Munday, Gutmark, Liu and Kailasanath2011; Perumal et al. Reference Perumal, Aravindh Kumar, Surya Mitra and Rathakrishnan2019). At NPR = 4 (Pe/Pa = 0.70, Mj = 1.56), the jet is over-expanded, and two oblique shock waves are formed at the lip of the nozzle exit, as marked with arrows in figure 3(a), which act to increase the nozzle exit pressure to ambient pressure. The oblique shock waves intersect at the jet axis and cross each other, resulting in either a regular reflection or Mach reflection that depends on the magnitude of Pe/Pa (Zhang et al. Reference Zhang, Aubry, Chen, Wu and Sha2019). In the present case, a regular reflection is observed. Further, the oblique shock waves downstream of the regular reflection reflect as Prandtl–Meyer expansion fans from the jet boundary. These fans are further reflected as shock waves from the jet boundary and cross each other at the jet axis or the so-called crossover point. This cycle continues until the flow finally reaches the subsonic state. A similar flow structure is also observed at NPR = 5 and 6.

Figure 3. (ac) Time-averaged schlieren images for various fully expanded jets with Mach number ${M_j}$. Parameter ${L_s}$ is the shock-cell length.

The variation in P 0t/P 0s along the jet centreline for NPR = 4–6 is compared in figure 4 with that reported by Phanindra & Rathakrishnan (Reference Phanindra and Rathakrishnan2010) at the same Md and NPR. The two measurements agree well qualitatively despite an appreciable departure which is ascribed to a difference in the nozzle geometry between the two studies. As shown in the inset of figure 4(a), the divergent section is a straight line with a semi-divergent angle of 7° in Phanindra & Rathakrishnan (Reference Phanindra and Rathakrishnan2010) but not in the present case. It is well known that a jet issuing from a straight nozzle is characterized by stronger shock/expansion waves (Cuppoletti et al. Reference Cuppoletti, Gutmark, Hafsteinsson and Eriksson2014). This is indeed confirmed in the present case. As indicated by the lower trough of ${P_{0t}}/{P_{0s}}$, their shock wave is stronger than the present one.

Figure 4. Time-averaged centreline pressure ratio at NPR of (a) 4, (b) 5 and (c) 6. The data of Phanindra & Rathakrishnan (Reference Phanindra and Rathakrishnan2010), whose nozzle is given in red in the inset of (a), from an Md = 1.8 jet with the same $\textit{NPR}$ are included for comparison. The horizontal broken line indicates the cutoff ${P_{0t}}/{P_{0s}}$ for sonic Mach number as given by Perumal & Rathakrishnan (Reference Perumal and Rathakrishnan2022).

Length Lc is defined as the longitudinal distance from the nozzle exit to where M reaches unity, which scales with the mass entrainment of ambient fluid into the jet stream (Zaman, Reeder & Samimy Reference Zaman, Reeder and Samimy1994). Perumal & Rathakrishnan (Reference Perumal and Rathakrishnan2022) demonstrated a correlation between Lc and jet mixing. We may estimate Lc from the measured ${P_{0t}}/{P_{0s}}$ data along the centreline (Khan et al. Reference Khan, Nageswara Rao, Baghel, Perumal and Kumar2022; Perumal & Rathakrishnan Reference Perumal and Rathakrishnan2022). For example, the cutoff ratio ${P_{0t}}/{P_{0s}}$ for M = 1 is given by the ratio of 1.89 (Anderson Reference Anderson1982) to the operating NPR:

(3.1)\begin{equation}{\left( {\frac{{{P_{0t}}}}{{{P_{0s}}}}} \right)_{M = 1}} = \frac{{{P_{0t}}/{P_a}}}{{{P_{0s}}/{P_a}}} = \frac{{1.89}}{{\textit{NPR}}}.\end{equation}

For NPR = 4 or Mj = 1.56, the cutoff P 0t/P 0s is 1.89/4 = 0.472, and the present $L_c^\ast $ and that of Phanindra & Rathakrishnan (Reference Phanindra and Rathakrishnan2010) are 9.1 and 10.7, respectively, with a deviation of 18 % (figure 5), which diminishes for higher Mj: 12.6 % and 3.5 % for Mj = 1.71 and 1.83, respectively. This deviation is not unexpected in view of the difference in the measured ${P_{0t}}/{P_{0s}}$ between the two studies (figure 4). The relationship between $L_c^\ast $ and ${M_j}$ can be obtained using the least squares fitting to the data:

(3.2)\begin{equation}L_c^\ast = {\textrm{e}^{3.4({M_j} - 1.05)}} + 4.2.\end{equation}

Figure 5. Variation with fully expanded jet Mach number ${M_j}$ in the supersonic core length $L_c^\ast $. The data from Phanindra & Rathakrishnan (Reference Phanindra and Rathakrishnan2010) for design Mach number ${M_d} = 1.8$ are included for comparison. The curve is a least-squares fitting to experimental data.

Jet spread in the radial direction is illustrated by the variation in the distribution of ${P_{0t}}/{P_{0s}}$ (NPR = 4) against ${z^\ast }$ or ${y^\ast }$ from x* = 1 to 20 (figure 6), which appears to be axisymmetric. At x* = 1, ${P_{0t}}/{P_{0s}}$ exhibits a flat-top-hat distribution, implying a uniform Mach number around the jet axis. This is then followed by a steep decrease over $ - 0.4 > {y^\ast } > 0.4$ and $ - 0.4 > {z^\ast } > 0.4$ due to rapid mixing. For x* = 7 and 11, ${P_{0t}}/{P_{0s}}$ exhibits a rapid drop in its centreline value and a radial growth. The jet appears fully developed at ${x^\mathrm{\ast }} = 20$, as noted by Phanindra & Rathakrishnan (Reference Phanindra and Rathakrishnan2010).

Figure 6. (ad) Radial pressure ratio distributions of natural jet at exit pressure ratio ${P_e}/{P_a} = 0.70$.

4. Jet mixing of manipulated jet

4.1. Effects of the control parameters on jet mixing

It is well known that a jet manipulated using a single minijet may deflect, referred to as thrust vectoring. As a result, jet mixing quantified based on a change in the centreline velocity or pressure may be artificially exaggerated. Following Perumal & Rathakrishnan (Reference Perumal and Rathakrishnan2021), we may estimate $L_c^\ast $ from the actual position of the measured maximum P 0t/P 0s. Note that the minijet injection is along the positive z direction. Figure 7 presents the contours of time-averaged P 0t/P 0s measured in the injection and non-injection planes or xz and xy planes for various Cm (d/D = 1/9.5, Pe/Pa = 0.70) along with those of the natural jet (Pe/Pa = 0.70). The contours are symmetric about the centreline ($\kern 1.5pt {y^\ast } = {z^\ast } = 0$) for the natural jet (figure 7a) but asymmetric in the xz plane under manipulation (figure 7bd), where the maximum P 0t/P 0s occurs at a negative ${z^\ast }$, suggesting a deflected jet. This deflection becomes more obvious with increasing Cm. In the xy plane, the contours show slight asymmetry about ${y^\mathrm{\ast }} = 0$ (figure 7eg). Therefore, we determine $L_c^\ast $ directly from the P 0t/P 0s contours based on the cutoff level of M = 1 (Anderson Reference Anderson1982) (figure 7ag). Note that the estimated $L_c^\ast $ in the xy plane (figure 7eg) is shorter than in the xz plane (figure 7bd). This observation is internally consistent with the fact that the xy plane cuts through the xz plane where the sonic Mach number is not a maximum. Similar observations are also made at other Pe/Pa.

Figure 7. Iso-contours of time-averaged pressure ratio ${P_{0t}}/{P_{0s}}$. (a) Natural jet (${P_e}/{P_a} = 0.70$). Manipulated jet ($d/D = 1/9.5$): (bd) injection plane; (eg) non-injection plane. The red thick curve denotes the cutoff pressure ratio (0.472) for the sonic Mach number.

There are two factors that may contribute to the asymmetry of the pressure contours about y* = 0 in the xy plane. One is ascribed to experimental uncertainties, which could be eliminated if the sample size is infinitely large. The present sampling rate and duration of the pressure data were limited, 2000 Hz and 2 s, respectively. The choice of the 2 s sampling duration is based on a convergence test. The variation in the pressure data obtained at (x*, y*, z*) = (0.5, 0, 0) of the natural jet (NPR = 4) is converged to within 1 % once the sampling duration exceeds 1.8 s (not shown). Another factor could be linked to the part of the L-shape Pitot tube (figure 2), which is normal to the flow and located downstream of the pressure data obtained. When the Pitot tube is traversed across the jet, this part may interfere with the pressure data obtained upstream at y* = −1.5–0. This interference retreats at y* = 0–1.5, where the blockage produced by the Pitot tube is smaller. Note that the jet asymmetry is appreciable only downstream of the cutoff pressure (see the red-coloured contour in figure 7eg) that is used to estimate $L_c^\ast $. That is, the jet asymmetry takes place downstream of the supersonic potential core, where the flow is subsonic, thus being more susceptible to downstream disturbance. It is worth pointing out that this asymmetry of the pressure data in the xy plane produces essentially no effect on the estimate of $L_c^\ast $, which is determined only from the pressure data measured in the xz plane as described before.

One can see a pressure dip at y* = 0 in figure 7(g) for ${C_m} \ge 1.98\,\%$ at (Pe/Pa, d/D) = (0.70, 1/9.5) when the IPR is quite large (= 5). This is because at very large Cm or IPR, the penetration depth of the minijet is also large, causing the cross-section of the main jet to deform into a kidney-shaped structure, as observed by Zaman et al. (Reference Zaman, Reeder and Samimy1994) in a supersonic jet manipulated by a single tab. Note that the injection is along the positive z* direction. This kidney-shaped structure produces a double peak in the pressure profile, thus causing the dip at y* = 0 in the xy plane.

Figure 8 presents the variation in $L_c^\ast $ with Cm for d/D = 1/20–1/5.3 and Pe/Pa = 0.70 and 1.05. The control is considered to be effective once $L_c^\ast $ falls below that of the natural jet (Cm = 0). Several observations can be made. First, for d/D ≥ 1/9.5, $L_c^\ast $ retreats with increasing Cm, regardless of Pe/Pa. At Pe/Pa = 0.70, $L_c^\ast $ is larger than that of the natural jet for Cm < 1.8 % but smaller for Cm ≥ 1.8 %. The minijet injection at small Cm is unable to penetrate the main jet core (figure 7bd) and may be swept away downstream (Davis Reference Davis1982). In their manipulation of an Md = 1.1 jet using 16 minijets at d/D = 1/33 (Cm = 0.9 %), Callender, Gutmark & Martens (Reference Callender, Gutmark and Martens2007) also observed an increased jet core length with respect to the natural jet. They argued, based on particle image velocimetry data, that the minijets acted as a shield for the main jet and impeded the shear-layer growth, resulting in a prolonged jet core. On the other hand, the minijet injection penetrates the main jet core given a larger Cm, resulting in a reduced $L_c^\ast $. Second, for d/D = 1/20, $L_c^\ast $ increases with increasing Cm until reaching a local maximum, which may vary with Pe/Pa, and then drops with a further increase in Cm. The value of $L_c^\ast $ exceeds that of the natural jet for the range of Cm examined. The present P 0t/P 0s contours (not shown) of the manipulated jet for d/D = 1/20 do not show any sign of minijet penetration into the shear layer of the main jet. Third, for a given Cm, an increase in d/D leads to a significant increase in $L_c^\ast $, suggesting that small d/D promotes jet mixing, though d/D cannot be too small, say below 1/20 in the present case. Evidently, a smaller d/D for a given Cm leads to a higher Ui/Uj, and hence deeper penetration into the main jet. Finally, given d/D and Cm, the manipulated jet at Pe/Pa = 1.05 experiences a more significant contraction in $L_c^\ast $ than at Pe/Pa = 0.70. For example, given d/D = 1/5.3 and Cm = 3.2 %, $L_c^\ast $ drops from 17.1 without control to 10.6 at Pe/Pa = 1.05, a decrease of 38 %. At Pe/Pa = 0.70, however, $L_c^\ast $ reduces by only 22 % for the same d/D and Cm. This suggests a more effective manipulation under the design condition (Pe/Pa = 1) than under off-design conditions (Pe/Pa ≠ 1). In their manipulation of a NPRd = 4 (Md = 1.56) jet at NPR = 2.5–4.5 using 24 minijets, Cuppoletti & Gutmark (Reference Cuppoletti and Gutmark2014) reported a more pronounced noise reduction at NPRd = 4 than at other NPR values. Their particle image velocimetry measurements showed that the strength of normalized streamwise vortices and shear-layer thickness under the design condition exceeded those of the off-design condition due to deeper penetration, even though the design condition corresponded to smaller Cm. It may be inferred that the perfectly expanded jet (Pe/Pa = 1.05) may experience a deeper minijet penetration into the main jet, thus weakening the shock cells more substantially, than under the off-design condition (Pe/Pa = 0.70).

Figure 8. Dependence of the supersonic core length $L_c^\ast $ on mass flow rate ratio ${C_m}$ and correlation between velocity ratio ${U_i}/{U_j}$ and ${C_m}$: (a) ${P_e}/{P_a} = 0.70$, (b) 1.05. The dotted line represents $L_c^\ast $ of natural jet.

4.2. Scaling law of control

As discussed in § 4.1, $L_c^\ast $ depends strongly on Cm, d/D and Pe/Pa, and jet mixing is correlated with the penetration depth of the minijet into the main jet (Perumal & Zhou Reference Perumal and Zhou2018). The ratios Ui/Uj and d/D are related via Cm, where Uj and Ui are calculated from (2.3) and (2.7), respectively (figure 8). Apparently, for a given Cm, Ui/Uj increases with decreasing d/D, which is consistent with our earlier discussion that jet mixing is enhanced as d/D reduces. Further, Cm required to achieve the same Ui/Uj drops given a smaller d/D. Note that either Ui/Uj or Cm may affect directly the penetration depth (Davis Reference Davis1982; Semlitsch et al. Reference Semlitsch, Cuppoletti, Gutmark and Mihăescu2019) that scales with MRN (Henderson Reference Henderson2010). Khan et al. (Reference Khan, Nageswara Rao, Baghel, Perumal and Kumar2022) and Perumal & Rathakrishnan (Reference Perumal and Rathakrishnan2022) performed empirical scaling analysis based on experimental data of jets of Md = 1.5 and 2.0, manipulated using N (= 2–6) minijets, and found indeed that jet mixing scales with the square root of MRN (= Cm ,NUi/Uj), where Cm ,N is the mass flow rate ratio of an individual minijet to the main jet. Their scaling law involves only a fixed d/D. Then one question arises: can we find a scaling law that incorporates varying d/D?

Let us consider $L_c^\ast = {f_1}({C_m},d/D,{P_e}/{P_a},{M_j})$. A supersonic jet is characterized by Pe/Pa and Mj (Driftmyer Reference Driftmyer1972). Thus, a developed scaling law with both Pe/Pa and Mj incorporated may be applied for varying Md (Werle, Shaffer & Driftmyer Reference Werle, Shaffer and Driftmyer1970). To further accommodate different gas species, we may include γ in the scaling law to be developed. Then we have $L_c^\ast = {f_2}({C_m},d/D,{P_e}/{P_a},{M_j},\gamma )$. Tam, Seiner & Yu (Reference Tam, Seiner and Yu1986) introduced a new parameter Dj, i.e. the fully expanded diameter, accounting for the jet contracting and expanding at the nozzle exit due to off-design conditions, and Dj is related to D through mass conservation:

(4.1)\begin{equation}\frac{{{D_j}}}{D} = {\left[ {\frac{{1 + {\textstyle{1 \over 2}}(\gamma - 1)M_j^2}}{{1 + {\textstyle{1 \over 2}}(\gamma - 1)M_d^2}}} \right]^{(\gamma + 1)/4(\gamma - 1)}}{\left( {\frac{{{M_d}}}{{{M_j}}}} \right)^{1/2}}.\end{equation}

Under the design condition, Mj = Md, implying Dj = D; under the off-design condition, Mj ≠ Md and Dj ≠ D. Similarly, we may introduce the fully expanded diameter di for the minijet:

(4.2)\begin{equation}\frac{{{d_i}}}{d} = {\left[ {\frac{{1 + {\textstyle{1 \over 2}}(\gamma - 1)M_i^2}}{{1 + {\textstyle{1 \over 2}}(\gamma - 1)}}} \right]^{(\gamma + 1)/4(\gamma - 1)}}{\left( {\frac{1}{{{M_i}}}} \right)^{1/2}},\end{equation}

where Md is 1 since the nozzle of the minijet is a simple constant-diameter tube. As such, we have $L_c^\ast = {f_3}({C_m},{d_i}/{D_j},{P_e}/{P_a},{M_j},\gamma )$, which accounts for the contracting and expanding of both minijet and main jet.

Since Cm is related to d/D, di/Dj is implicitly included in Cm. To explicitly retain di/Dj, following Muppidi & Mahesh (Reference Muppidi and Mahesh2005) one may rewrite $L_c^\ast = {f_3}({C_m},{d_i}/{D_j},{P_e}/{P_a},{M_j},\gamma )$ as $L_c^\ast = {f_4}(J,{d_i}/{D_j},{P_e}/{P_a},{M_j},\gamma )$, where $J = \sqrt {{\rho _i}U_i^2/({\rho _j}U_j^2)} $ is the momentum flux ratio of the minijet to the main jet, ${\rho _i}$ and ${\rho _j}$ are calculated from (4.3) and (2.4), respectively, and Ui/Uj is implicitly included in Cm:

(4.3)\begin{equation}{\rho _i} = {\left.{\left( {\frac{{\textit{IPR} \times {P_a}}}{{R{T_0}}}} \right)}\right/ {{{\left( {1 + \frac{{\gamma - 1}}{2}M_i^2} \right)}^{1/(\gamma - 1)}}}}.\end{equation}

Following Werle et al. (Reference Werle, Shaffer and Driftmyer1970), we may further simplify $L_c^\ast = {f_4}(J,{d_i}/{D_j},{P_e}/{P_a},{M_j},\gamma )$ as $L_c^\ast = {f_5}(J{d_i}/{D_j},\gamma M_j^2{P_e}/{P_a})$, where $\gamma M_j^2{P_e}/{P_a}$ is a standard dimensionless pressure ratio in compressible flow theory and in the present case is the non-dimensional exit pressure ratio. Those authors and also Driftmyer (Reference Driftmyer1972) developed a scaling law to predict the terminal shock position h with respect to the nozzle exit of a highly under-expanded jet and postulated that h/be scales with $\gamma M_j^2{P_e}/{P_a}$, where be is the width of the nozzle exit. Then following Perumal & Rathakrishnan (Reference Perumal and Rathakrishnan2022), we may rewrite $L_c^\ast = {f_5}(J{d_i}/{D_j},\gamma M_j^2{P_e}/{P_a})$ as

(4.4)\begin{equation}L_c^\ast \propto \frac{{J{d_i}/{D_j}}}{{\gamma M_j^2{P_e}/{P_a}}}.\end{equation}

As a matter of fact, the data in figure 8 collapse reasonably well provided $(J{d_i}/{D_j})/(\gamma M_j^2{P_e}/{P_a})$ is used as the abscissa (figure 9), which may be least-squares-fitted to

(4.5)\begin{equation}L_c^\ast = 20.9\,{\textrm{e}^{ - 34\xi }} + 5.1.\end{equation}

That is, $L_c^\ast = {f_2}({C_m},d/D,{P_e}/{P_a},{M_j},\gamma )$ may be reduced to $L_c^\ast = {f_6}(\xi )$, where the scaling factor $\xi = (J{d_i}/{D_j})/(\gamma M_j^2{P_e}/{P_a})$. The data above the horizontal dashed line in figure 8 are not included in figure 9 since the scaling law is developed for jet mixing enhancement.

Figure 9. Dependence of the supersonic core length $L_c^\ast $ on the scaling factor $\xi = \sqrt {{C_m}{U_i}/{U_j}} /(\gamma M_j^2{P_e}/{P_a}) = J({d_i}/{D_j})/(\gamma M_j^2{P_e}/{P_a})$, where the momentum flux ratio $J = \sqrt {{\rho _i}U_i^2/({\rho _j}U_j^2)} $. The solid curve is the least-squares fitting to experimental data and the broken curves indicate the confidence levels of +10 % and −10 %.

Several points can be made from the scaling equation (4.5). Firstly, to our surprise, Perumal & Rathakrishnan's (Reference Perumal and Rathakrishnan2022) data from a jet of Md = 2.0 manipulated with two oppositely placed minijets also collapse reasonably well about the scaling law (not shown). Since the two investigations differ in Md as well as N, it seems plausible that the scaling law is valid for varying Md. Secondly, Perumal & Rathakrishnan (Reference Perumal and Rathakrishnan2022) found that $L_c^\ast $ scales with $\sqrt {{M}{{R}_N}} /(\gamma M_j^2{P_e}/{P_a})$, implying an analogy between $(J{d_i}/{D_j})/(\gamma M_j^2{P_e}/{P_a})$ and $\sqrt {{M}{{R}_N}} /(\gamma M_j^2{P_e}/{P_a})$ due to $J{d_i}/{D_j} = \sqrt {{M}{{R}_N}} $. Apparently, the present scaling law includes one additional parameter di/Dj. It may be inferred that $J{d_i}/{D_j}$ is the square root of the momentum ratio of minijet to main jet. Lastly, in order to confirm the robustness of the scaling law, we have performed additional experiments for d/D = 1/4.1 and Cm = 2.88 %–7.91 % (Mj = 1.56, Pe/Pa = 0.70). Figure 10 shows that the data obtained at d/D = 1/4.1 agree reasonably well with the prediction from scaling law (4.5) for the same Cm, d/D and Pe/Pa. Similar observation has also been made for other Pe/Pa. The results suggest the robustness of the scaling law.

Figure 10. Dependence of predicted supersonic core length $L_c^\ast $ on mass flow rate ratio ${C_m}$ from the scaling law (4.5) (${P_e}/{P_a} = 1.05$, $d/D = 4.1$), as compared with measured $L_c^\ast $ under identical conditions.

4.3. Interesting aspects of the scaling law

An attempt is made to understand the physical meaning of $\xi $. Perumal & Zhou (Reference Perumal and Zhou2018, Reference Perumal and Zhou2021) quantified the penetration depth of the minijet into the main jet based on the root-mean-square values of the streamwise velocity at the nozzle exit and observed a strong correlation between the penetration depth and Cm. This depth has never been quantified in the context of a supersonic jet. As shown in figure 11, the minijet injection induces a bow shock. The bow shock angle β with respect to the streamwise direction and the distance Lp between the nozzle lip (z* = 0.5) and the intersection point of the bow shock and minijet centreline, as defined in figure 11(h), are apparently correlated with Cm. An increase in Cm is associated with an increase in β and also Lp. It seems plausible that either Lp or β may provide a measure for the minijet penetration into the main jet. Figure 12 presents the dependences of $L_c^\ast $ and $\xi $ on $L_p^\mathrm{\ast }$ and $\beta $, respectively, for various Cm, Pe/Pa and d/D. Obviously, $L_c^\mathrm{\ast }$ decreases with increasing $L_p^\mathrm{\ast }$ and $\beta $, corresponding to enhanced jet mixing. Furthermore, $\xi $ is positively correlated with $L_p^\mathrm{\ast }$ and $\beta $. The results suggest that the scaling factor $\xi $ may be physically interpreted as the penetration depth of the minijet into the main jet, which may determine the level of jet mixing measured through $L_c^\ast $.

Figure 11. (ag,in) Time-averaged schlieren images of manipulated jet at ${P_e}/{P_a} = 0.70$ for various ${C_m}$ along with (e,h) the definitions of the shock wave angle β and the distance ${L_p}$ from the nozzle lip (z* = 0.5) to the point where the induced bow shock and the minijet centreline intersect.

Figure 12. Dependence of the scaling factor $\xi$ and supersonic core length $L_c^\ast $ on (a) the penetration depth $L_p^\ast $ and (b) shock wave angle $\beta $.

One of the important applications of the scaling law is to predict the optimal d/D at which the required jet mixing is achieved with a minimal consumption of Cm and IPR < NPR. In practice, there are two factors to be considered when we employ minijets for jet manipulation. One is to have an IPR less than the operating NPR. The other is to make Cm as small as possible, achieving the desired performance with the minimum consumption of injection mass flow rate. It is not uncommon to bleed a maximum of 5 % of air flow entering an engine for the purpose of minijet injection as the bleed is associated with an engine thrust loss (Smith, Cain & Chenault Reference Smith, Cain and Chenault2001).

As noted earlier, jet mixing benefits from small d/D, at which the required Cm is small in achieving a given $L_c^\ast $ as long as d/D > 1/20. For example, to achieve a predefined $L_c^\ast = 8.0$ at Pe/Pa = 0.70 (NPR = 4), the required Cm and IPR for d/D = 1/9.5 are 3 % (figure 8) and 7.5 (table 2), respectively. In this case, IPR > NPR. When d/D is increased to 1/5.3, the IPR drops to 3.25 (table 2) so that IPR < NPR, whereas the required Cm increases to 4 % (figure 8). The result suggests the presence of an optimal d/D at which IPR < NPR and Cm ≤ 5 %. The optimal d/D may be predicted based on the scaling law for a given Mj. Assume IPR = NPR and the predefined $\Delta L_c^\ast = 15\,\%$ and 25 %, where $\Delta L_c^\ast $ is the desired jet mixing enhancement defined by

(4.6)\begin{equation}\Delta L_c^\ast = \frac{{{{(L_c^\ast )}_{natural}} - {{(L_c^\ast )}_{manipulated}}}}{{{{(L_c^\ast )}_{natural}}}} \times 100.\end{equation}

In (4.6), subscripts ‘manipulated’ and ‘natural’ denote the manipulated and natural jets, respectively. To predict the optimal d/D, we first determine the required ${(L_c^\ast )_{manipulated}}$ for given $\Delta L_c^\ast $ and Mj from (3.2) and (4.6) and then calculate d/D from (4.1)–(4.5). The obtained optimal d/D is presented in figure 13(a), from which several observations can be made. The optimal d/D decreases with increasing Mj, which is not feasible for practical applications. To avoid this, we may choose the optimal d/D based on the minimum operating Mj. If the choice of the optimal d/D is based on the maximum operating Mj, then the required IPR at the other operating Mj would exceed NPR. For example, if the optimal d/D = 0.08 is chosen based on Mj = 1.83, then for Mj = 1.69 (NPR = 4.9) the required IPR is about 7 (figure 13a), greater than the operating NPR = 4.9. On the other hand, the required IPR at the other operating Mj will be less than NPR provided the optimal d/D is determined from the minimum operating Mj.

Figure 13. (a) Dependence of $\textit{IPR}$ on diameter ratio $d/D$ and fully expanded jet Mach number ${M_j}$ ($\Delta L_c^\ast = 15\,\%$), where the square symbols correspond to $d/D$ at which $\textit{IPR} = \textit{NPR}$ ($\textit{IPR} < \textit{NPR}$ and $\textit{IPR} > \textit{NPR}$ occur above and below the symbols, respectively). (b) Dependence of ${C_m}$ and $d/D$ on ${M_j}$.

With the optimal d/D known, we may calculate the required Cm from (2.5)–(2.6). As shown in figure 13(b), the required Cm drops with increasing Mj and reaches the minimum at the design Mach number, suggesting an efficient jet manipulation, which is internally consistent with the observation from figure 8. Obviously, the choice of the optimal d/D depends on the minimum operating Mj as well as available Cm. One may also wonder how the optimal d/D would vary if $\Delta L_c^\ast = 15\,\%$ increases to 25 %. As shown in figure 13(b), the optimal d/D becomes in general larger at $\mathrm{\Delta }L_c^\ast = 25\,\%$ than at 15 %. For example, at Mj = 1.56, the optimal d/D is 0.11 for $\mathrm{\Delta }L_c^\ast = 15\,\%$ and 0.13 for $\mathrm{\Delta }L_c^\ast = 25\,\%$. Further, the optimal d/D may increase with increasing $\mathrm{\Delta }L_c^\ast $, as is evident in figure 14 (Mj = 1.56). The required Cm exceeds 5 % once $\mathrm{\Delta }L_c^\ast > 40\,\%$. Therefore, it can be inferred from the above discussion that the optimal d/D is a trade-off between $\mathrm{\Delta }L_c^\ast $, the minimum operating Mj or NPR and available Cm.

Figure 14. Dependence of the optimal $d/D$ and ${C_m}$ on $\Delta L_c^\ast $ at ${M_j} = 1.56$. The curve is the least-squares fitting to the optimal diameter ratios.

5. Thrust vectoring of manipulated jet

It is of interest to examine thrust vectoring, which can improve aircraft manoeuvrability (Zigunov et al. Reference Zigunov, Song, Sellappan and Alvi2022). As discussed in § 4.1, minijet injection may display a thrust vectoring phenomenon, where the main jet deflects away from the jet centreline. This phenomenon can be quantified in terms of thrust vector angle δ based on the deviation of the maximum Pitot pressure from the centreline for 3 ≤ x* ≤ 15 (Zigunov et al. Reference Zigunov, Song, Sellappan and Alvi2022). The uncertainty in δ, estimated using the propagation of errors (Moffat Reference Moffat1985), is within ${\pm} 0.1^\circ $. Alternatively, we may identify a series of shock crossover locations, as illustrated in figure 16(d), in the schlieren images based on the pixel level and then estimate δ using a linear fit to these crossover locations. Following Athira et al. (Reference Athira, Rajesh, Mohanan and Parthasarathy2020), the images were calibrated to 0.11 mm pixel−1 so that the maximum spatial uncertainty in determining these crossover locations is 0.5 mm, producing an uncertainty in δ within ${\pm} 0.2^\circ $. The two estimates in δ agree reasonably well with each other (figure 15). Hereinafter, we present δ estimated from schlieren images.

Figure 15. Dependence on mass flow rate ratio ${C_m}$ of thrust vector angle $\delta $ estimated from schlieren images and Pitot pressure ratio data for various ${P_e}/{P_a}$ and $d/D$.

The dependence of δ on Cm is presented in figure 15. In general, δ increases almost linearly with increasing Cm. For d/D = 1/20, δ is negligibly small probably because of small Cm (<1 %). Recall our observation in figure 8 that jet mixing is enhanced little at d/D = 1/20. It may be inferred that the jet perturbation is insignificant if d/D is very small, i.e. d/D ≤ 1/20. On the other hand, δ can be markedly larger for d/D = 1/5.3 than for other d/D as Cm is quite large.

One interesting observation is that, given d/D and Cm, δ is smaller at Pe/Pa = 1.05 than at Pe/Pa = 0.70 or 0.87. For example, δ is 3.5° at Pe/Pa = 0.70 but only 1.8° at Pe/Pa = 1.05 despite the same d/D (= 1/9.5) and Cm (= 1.98 %). This suggests jet vectoring is more appreciable under the off-design condition than under the design condition, in distinct contrast to jet mixing that is more readily enhanced under the design condition than under the off-design condition (figure 8). We present in figure 16 the time-averaged schlieren images of the manipulated jet at Pe/Pa = 0.70 and 1.05 (d/D = 1/9.5) along the xz and xy planes for Cm = 0.79 %–1.98 %. Several observations can be made. Firstly, the minijet injection along the z direction makes the jet deflect towards the negative z direction (figure 16b,d,f), producing thrust vectoring in addition to enhancing jet mixing. As one may expect, there is no appreciable jet deflection in the xy plane (figure 16c,e,g). Secondly, as the IPR exceeds 2 (table 2), the minijet is supersonic and choked (Perumal & Zhou Reference Perumal and Zhou2018). This minijet penetrates into the main jet and modifies the shock structure near the nozzle exit, as indicated by the induced oblique shock (figure 16h) towards the negative z* direction (figure 16b,d,f,h). However, the oblique shock wave from the other side of the nozzle lip (figure 16b) remains similar to that of the natural jet, suggesting that the minijet fails to penetrate through the main jet. Thirdly, a close-up examination of the first shock cell reveals a potential source for jet deflection, i.e. the oblique shock wave, which is then reflected as expansion fans from the jet shear layer (Perumal & Rathakrishnan Reference Perumal and Rathakrishnan2013). It is well known that a supersonic flow may be turned away from the centreline due to the presence of expansion fans, resulting in jet vectoring (Anderson Reference Anderson1982). This implies a correlation between δ and expansion fans, which depends on β. As noted from figure 11, β is enlarged with increasing Cm; so is δ. Finally, β decreases from Pe/Pa = 0.70 to 1.05 given Cm = 1.98 % (figure 16f,h). The smaller β at Pe/Pa = 1.05 leads to a small deflection angle or δ from the expansion fans (figure 16a). As a result, the main jet is forced to swing towards the centreline, thus reducing δ at Pe/Pa = 1.05 (figure 16a). A similar observation on jet turning towards its axis was also reported by Neely, Gesto & Young (Reference Neely, Gesto and Young2007).

Figure 16. (a) Sketch of induced shocks and expansion fans; blue and red correspond to ${P_e}/{P_a} = 0.70$ and 1.05, respectively. (bg) Time-averaged schlieren images of the manipulated jet (d/D = 1/9.5) captured in two orthogonal planes at ${P_e}/{P_a} = 0.70$ and (h) at ${P_e}/{P_a} = 1.05$.

It is of interest to compare how β and $L_c^\ast $ vary with δ. As shown in figure 17(a), β is in general positively correlated to δ since β is primarily responsible for jet deflection. The dependence of β on δ displays two branches. The value of β increases gradually with δ at Pe/Pa = 0.70 but rather rapidly for Pe/Pa = 0.87–1.05. Further, $L_c^\ast $ decreases with an increase in δ and again shows two branches, slowly decreasing at Pe/Pa = 0.70 but more rapidly for Pe/Pa = 0.87–1.05 in figure 17(b). Evidently, while enhancing jet mixing, the minijet injection may also induce jet vectoring, which may be undesirable for some applications, e.g. during a certain phase of flight.

Figure 17. Dependence on thrust vector angle $\delta $ of (a) shock wave angle $\beta $ and (b) supersonic core length ${L_c}/D$ for ${P_e}/{P_a} = 0.70\unicode{x2013} 1.05$ and $d/D = 1/20\unicode{x2013} 1/5.3$.

It has been well established that the penetration depth of the minijet into the main jet dictates the vectoring angle (Neely et al. Reference Neely, Gesto and Young2007; Warsop & Crowther Reference Warsop and Crowther2018; Wu, Kim & Kim Reference Wu, Kim and Kim2020). Chandra Sekar et al. (Reference Chandra Sekar, Jaiswal, Arora, Sundararaj, Kushari and Acharya2021) investigated jet thrust vectoring via secondary fluidic injection and proposed that δ may scale with ${\rho _i}U_i^2/({\rho _j}U_j^2)$. Their investigation did not consider the possible effects of Pe/Pa and d/D. In view of $L_c^\ast = {f_6}\;(\xi )$ and also the correlation between $L_c^\ast $ and δ (figure 17b), one may wonder whether δ is also correlated with $\xi $ ($ = (J{d_i}/{D_j})/(\gamma M_j^2{P_e}/{P_a})$). To our surprise, the δ data in figure 15 fall about one curve once $\xi $ is used as abscissa, as shown in figure 18(a), irrespective of ${P_e}/{P_a}$, $d/D$ and ${C_m}$. The curve may be divided into two zones, namely the dead and linear zones, corresponding to $\xi \le 0.02$ and $\xi > 0.02$, respectively. In the dead zone, δ ≈ 0 and the jet is not deflected, as illustrated in figure 18(b). On the other hand, the data may be fitted in the linear zone to

(5.1)\begin{equation}\delta = 88\xi - 1.76,\end{equation}

and the jet is deflected, as shown in figure 18(c). Evidently, $\delta $ is linearly correlated to $\xi $.

Figure 18. (a) Dependence of $\delta $ on $\xi $ (${C_m} = 0.18\unicode{x2013} 10.38\,\%$). (b,c) Schlieren images for $\xi = 0.021$ in the dead zone (${P_e}/{P_a} = 0.70$, $d/D = 1/9.5$, ${C_m} = 0.27\,\%$) and 0.15 in the linear region (0.70, 1/5.3, 10.38 %).

6. Flow structure of manipulated jet

To understand the minijet-generated flow structure, we present instantaneous schlieren images of the manipulated jet for NPR = 1.9–4.0 given IPR = 7.0 and $d/D = 1/6.5$, corresponding to Cm = 12.73 % − 6.04 %, in figure 19(ae). Note that NPR is the only parameter that changes, which causes Cm $({\sim} (\textit{IPR}/\textit{NPR}){(d/D)^2})$ to vary as given in (2.5)–(2.6). Interestingly, the images show unequivocally the occurrence of a quasi-periodical vortex street. The vortices, as indicated by the shadows, grow in size and their trajectory may cross over the centreline further downstream. Furthermore, the minijet penetration depth, as indicated by the trajectory of the vortices, retreats with decreasing Cm. However, the vortex street disappears once ${C_m} = 0$. Figure 19f) shows the schlieren image from the jet (Pe/Pa = 0.70, d/D = 1/6.5) manipulated by a dummy minijet, that is, a minijet nozzle with an outer diameter dout/D = 1/4.8 is placed in the jet, whose lower end is at x* = 0.2 and z* = 0.3, the same as in figure 19(ae), though without injecting any fluid (Cm = 0). The NPR is the same as in figure 19(e). The dummy minijet produces similar shock-cell structures in the near field to those in figure 19(e). However, the vortex street is absent in figure 19f). Apparently, the minijet injection is essential for the street to take place.

Figure 19. Instantaneous schlieren images captured at 43 kHz: (ae) manipulated jet at $d/D = 1/6.5$ and $\textit{IPR} = 7.0$; ( f) ${C_m} = 0$ with the minijet nozzle protruding into the jet (${x^\ast } = 0.2$, ${z^\ast } = 0.3$). The broken curve indicates the trajectory of the organized structures.

To understand the flow structure captured in the time-resolved schlieren images, we employ the proper orthogonal decomposition (POD) technique to analyse the organized and energetic structures. The snapshot POD method proposed by Sirovich (Reference Sirovich1987) is used to obtain the POD modes. Briefly, given r snapshots of the flow field with an equal time interval Δt, the spatiotemporal field may be divided into time-dependent coefficients and the optimal basis functions. Snapshot POD satisfies the following condition:

(6.1)\begin{equation}\boldsymbol{X} = [{\boldsymbol{x}_1}{\boldsymbol{x}_2} \ldots {\boldsymbol{x}_r}] \in {{\mathbb R}^{n \times r}},\quad n \gg r.\end{equation}

The data of r (= 500) snapshots are stacked into a matrix X, and ${\boldsymbol{x}_{\boldsymbol{k}}}$ ($k = 1,\; 2, \ldots ,r$) in the vector space ${\mathrm{\mathbb{R}}^n}$ corresponds to the grey value of all pixels in one schlieren image (Taira et al. Reference Taira, Brunton, Dawson, Rowley, Colonius, Mckeon, Schmidt, Gordeyev, Theofilis and Ukeiley2017). There are presently 512 × 128 pixels, i.e. $n = 65\,536$ grey values per image. The autocovariance matrix is then created as ${\boldsymbol{X}^{\boldsymbol{T}}}\boldsymbol{X} \in {{\mathbb R}^{r \times r}}$, and the corresponding eigenvalue problem $\boldsymbol{X}^{\boldsymbol{T}}\boldsymbol{X}\boldsymbol{\psi }_{\boldsymbol{j}} = {\lambda _j}\boldsymbol{\psi }_{\boldsymbol{j}}$ yields the eigenvalues ${\lambda _j}$ (${\lambda _1} > {\lambda _2} > \cdots > {\lambda _r}$, for $j = 1,2, \ldots ,r$) and eigenvectors $\boldsymbol{\psi }_{\boldsymbol{j}} \in {\mathrm{\mathbb{R}}^r}$ from which the spatial POD modes are constructed as

(6.2)\begin{equation}\boldsymbol{\phi }_{\boldsymbol{j}} = \boldsymbol{X}\boldsymbol{\psi }_{\boldsymbol{j}}\frac{1}{{\sqrt {{\lambda _j}} }} \in {\mathrm{\mathbb{R}}^n},\quad j = 1,2, \ldots ,r.\end{equation}

The temporal coefficient a is determined by projecting X onto the spatial POD modes ${\boldsymbol{\phi }_{\boldsymbol{j}}}$ and can be expressed at time k for each mode j as

(6.3)\begin{equation}{a_j}(k) = {\boldsymbol{\phi }_{\boldsymbol{j}}}{\boldsymbol{x}_{\boldsymbol{k}}}.\end{equation}

The eigenvalues ${\lambda _j}$ of the POD modes are arranged in the order of importance in terms of the fluctuating energy of the flow field, and can be calculated as

(6.4)\begin{equation}\frac{{{\lambda _j}}}{{\sum_1^r {{\lambda _j}} }}.\end{equation}

Finally, to describe the coherent structures more accurately, the snapshots are de-averaged before being assembled into matrix X. Then the POD method is applied to analyse the remaining data (Rao, Kushari & Mandal Reference Rao, Kushari and Mandal2020). Note that the input matrix X is composed of the grey values of the entire ensemble of instantaneous schlieren images.

Figure 20 shows typical instantaneous and time-averaged schlieren images along with the reconstructed images of the first eight POD modes (Pe/Pa = 0.87, d/D = 1/5.3, Cm = 5.19 %) calculated from 300 schlieren images captured at a sampling rate of 43 kHz. The white- and black-coloured regions result from a variation in the density of flow. The low-density regions correspond to high grey values and hence white colour, while the high-density regions result in a grey value of near zero and hence black colour. The minijet-induced oblique shock and its reflections are evident, as indicated by the arrows in figure 20(ai,aii). A series of quasi-periodical structures are visible downstream of the minijet in the instantaneous image, as highlighted by ellipses in figure 20(ai). Mode 1 displays apparently the distorted shock cells, which is evident in both instantaneous and time-averaged schlieren images (figure 20ai,aii). The structures shown in modes 2–3 appear to be quasi-periodical and do not change significantly in topology, which is different from those in modes 1 and 4–8. These quasi-periodical structures obviously correspond to those noted in the instantaneous schlieren image. Modes 4–8 are distinct from modes 2–3 and do not correspond to quasi-periodical structures. The cumulative energies of modes 1–3 and 2–3 account for more than 40 % and 6 %, respectively, of the total energy (not shown). When advected downstream, these quasi-periodical structures grow gradually in size and interact with the shock waves, distorting the shock cells and contributing to rapid jet mixing. The observations are confirmed by the power spectral density (PSD) functions of the POD coefficients; a pronounced peak is evident at Ste = feDj/Uj = 0.12 for modes 2–3 but absent for modes 4–8 (figure 21a), where fe is the frequency of quasi-periodical structures. Note that this peak is also observed in the PSD function of the grey values taken at ($({x^\ast },{z^\ast }) = (1,{\textstyle{1 \over 4}})$ (figure 20ai), pointing to the correspondence between this peak and the quasi-periodical structures. The phase plot of the POD coefficients a 2 and a3 of modes 2 and 3 may provide us with the information on the temporal correlation between the two modes, where the data points fall approximately within a circle (figure 21b). Along with their similar topology as shown in figure 20(b), the result indicates their collective representation of an oscillatory process for the quasi-periodical structures. As such, we present the data of only mode 2 for further discussion.

Figure 20. (a) (i) Instantaneous and (ii) averaged schlieren images of the manipulated jet for ${P_e}/{P_a} = 0.87$, $d/D = 1/5.3$ and ${C_m} = 5.19\,\%$ when the minijet is placed at $x/D = 0.2$. (b) Reconstructed images of the first eight POD modes calculated from 300 schlieren images captured at a sampling rate of 43 kHz. Arrows in (ai,aii) point to the induced shocks or expansion fans, and the ellipses in (ai) highlight the flow structures that occur downstream of the minijet.

Figure 21. (a) The PSD function of POD coefficients for modes 2–8 and PSD function of grey values for location $({x^\ast },{z^\ast }) = (1,{\textstyle{1 \over 4}})$, as shown in figure 20(ai). (b) Phase plot of the POD coefficients of modes 2–3.

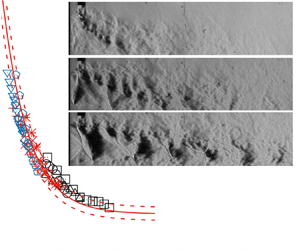
The predominant frequency Ste exhibits a significant dependence on Cm, d/D and Pe/Pa. As illustrated in figure 22, Ste decreases with increasing Cm, regardless of Pe/Pa and d/D. For a given Ui/Uj, an increase in d/D leads to a significant decrease in Ste. For example, at Pe/Pa = 0.70 and Ui/Uj = 1.1, Ste is 0.2 for d/D = 1/6.5 but 0.1 for d/D = 1/5.3. On the other hand, given d/D and Cm, Ste declines from Pe/Pa = 0.87 to 0.70. One important question arises. Can we find a dimensionless parameter with which Ste scales? Note that both $L_c^\ast $ and δ scale with $(J{d_i}/{D_j})/(\gamma M_j^2{P_e}/{P_a})$. After careful analysis of the experimental data in figure 22 along with numerous trial-and-error attempts, we find that, once the abscissa in figure 22 is replaced by $\zeta = J({d_i}/{D_j})\; \sqrt {\gamma M_j^2{P_e}/{P_a}} $, the Ste data collapse reasonably well about one curve, as shown in figure 23:

(6.5)\begin{equation}S{t_e} = 3.60{\textrm{e}^{ - 8\zeta}} + 0.02.\end{equation}

As noted earlier, ${(J({d_i}/{D_j}))^2} = {C_m}{U_i}/{U_j}$ is the momentum ratio of the minijet to the main jet. On the other hand, ${P_e}/{P_a}$ (see (2.2)) provides a measure for the degree of departure from the design condition. Apparently, ${P_e}/{P_a} \to 0$ implies $\zeta \to 0$ for given $J({d_i}/{D_j})$. Recall the inference in § 4.1 that the manipulated jet at Pe/Pa ≈ 1 experiences a more pronounced reduction in $L_c^\ast $ than at smaller Pe/Pa, which suggests a less effective manipulation under off-design conditions (Pe/Pa → 0) than under the design condition (Pe/Pa → 1) for given Cm or $J({d_i}/{D_j})$. Noting $J({d_i}/{D_j}) = \sqrt {{M}{{R}_N}} $, $\zeta \!=\! \sqrt {{M}{{R}_N}} \sqrt {\gamma M_j^2{P_e}/{P_a}} = \sqrt {{\rho _i}U_i^2/{\rho _j}U_j^2} ({d_i}/{D_j})\sqrt {{\rho _j}U_j^2/{P_a}}$ $= \sqrt {{\rho _i}U_i^2/{P_a}} ({d_i}/{D_j}) = \sqrt {{\rho _i}U_i^2({\rm \pi} d_i^2/4)} /\sqrt {{P_a}({\rm \pi} D_j^2/4)} $. Applying the jet thrust equation, derived from the momentum equation by Anderson (Reference Anderson1982), to the present main jet yields ${\rho _j}U_j^2({\rm \pi} D_j^2/4)\; + ({\rm \pi} D_j^2/4)({P_e} - {P_a})$, where ${\rho _j}U_j^2({\rm \pi} D_j^2/4)$ is the momentum thrust and $({\rm \pi} D_j^2/4)({P_e} - {P_a})$ is the pressure thrust due to a difference between the jet pressure and ambient pressure. Apparently, $\sqrt {{\rho _i}U_i^2({\rm \pi} d_i^2/4)}$ is the momentum thrust of the minijet and $\sqrt {{P_a}({\rm \pi} D_j^2/4)} $ is the thrust produced by ambient pressure or a reference thrust. Then, $\zeta $ may be interpreted as the ratio of the minijet momentum thrust to the ambient pressure thrust.

Figure 22. Dependence on ${C_m}$ of the predominant frequency $S{t_e} = {f_e}{D_j}/{U_j}$ of the observed vortex street and correlation between ${U_i}/{U_j}$ and ${C_m}$: (a) ${P_e}/{P_a} = 0.70$, (b) 0.87.

Figure 23. Dependence of $S{t_e}$ on the scaling factor $\zeta = J({d_i}/{D_j})\; \sqrt {\gamma M_j^2{P_e}/{P_a}} $. The solid curve is the least-squares fitting to experimental data.

Figure 24 compares instantaneous schlieren images at various Cm for $d/D = 1/9.5$ and 1/7.7 (${P_e}/{P_a} = 1.05$, ${M_j} = 1.83$) along with the corresponding PSD functions of the POD coefficients for mode 2. In the absence of control (Cm = 0), one prominent peak occurs at $S{t_0} \approx 0.21$ in the PSD function (figure 24ai), suggesting a natural instability. The schlieren image of the natural jet displays staggered structures (figure 24ai), as highlighted by the white dashed ellipses, which are also captured in the POD mode 2 of schlieren images (not shown). Such structures were observed in screeching jets by Powell (Reference Powell1953) and Panda (Reference Panda1998), as shown in their figures 7 and 3, respectively. Furthermore, $S{t_0}$ may be reasonably well predicted by Tam, Seiner & Yu's (Reference Tam, Seiner and Yu1986) semi-theoretical formula for screeching jets ($S{t_0} = 0.22$ for ${M_j} = 1.83$). The evidence points to the occurrence of the screeching mode in the natural jet at ${M_j} = 1.83$. However, this peak disappears under control given d/D = 1/9.5 and ${C_m} \le 2.11\,\%$ (figure 24b) and remains so for a further increase in Cm. Once d/D increases to 1/7.7 and Cm ≥ 2.02 %, one prominent peak appears again at Ste ≈ 0.18 at Cm = 3.24 %. The prominent peak cannot be detected until Cm exceeds a threshold, which is 2.02 %, 4.03 % and 4.33 % for d/D = 1/7.7, 1/6.5 and 1/5.3, respectively, but not observed for d/D = 1/9.5. A similar observation is made for other Pe/Pa; the threshold of Cm for the occurrence of this peak is about 3.04 %, 2.43 % and 2.02 % for Pe/Pa = 0.70, 0.87 and 1.05 (for d/D ≥ 1/7.7), respectively.

Figure 24. (a) Instantaneous schlieren images (${P_e}/{P_a} = 1.05$, ${M_j} = 1.83$): (i) natural jet; manipulated jet for (ii–iv) $d/D = 1/9.5$ and (v,vi) 1/7.7. (b) Corresponding PSD functions of POD coefficients for mode 2.

One may wonder as to the physical mechanism behind the generation of the quasi-periodical structures with Ste. Do they originate from the main jet or from the minijet? The scaling law (figure 23) is related to the parameters Dj, Uj and Mj of main jet along with di and Cm of the minijet, suggesting a link to both minijet and main jet. We present eight sequential schlieren images of the manipulated jet in figure 25(a), along with the PSD functions of the POD coefficients for mode 2 from the flow field shown in the bottom-right panel of figure 25(a) and the grey values from three points P1, P2 and P3 in the shear layer, at the edge of the bow shock and inside the vortex street, respectively (figure 25b). The quasi-periodical vortices are highlighted by elliptic contours and correspondingly one prominent peak occurs at Ste ≈ 0.21 in the PSD function (the upper curve of figure 25b). A careful examination of the images reveals that the bow shock oscillates, as indicated by the arrows. The spectra obtained at P2 and P3 display a pronounced peak at Ste ≈ 0.21 but not at P3 (figure 25b), that is, the predominant frequency of the quasi-periodical structures is the same as the oscillating frequency of the bow shock, but this frequency could not be detected in the shear layer. Furthermore, both instantaneous Lp and β change, the latter being not marked in figure 25(a). For example, Lp contracts at 0.046 (ms) and is prolonged at 0.093 (ms). As discussed previously, Lp and β are linked to the minijet penetration depth.

Figure 25. (a) Sequential schlieren images of the manipulated jet (${P_e}/{P_a} = 1.05$, $d/D = 1/7.7$, ${C_m} = 2.83\,\%$). (b) The PSD functions of POD coefficients of mode 2, calculated from the entire flow field and the grey values from three representative points P1, P2 and P3, as indicated in (a). The elliptic contours highlight the occurrence of the quasi-periodical vortices.

Based on the above observations, one scenario is proposed for the physical mechanism behind the occurrence of the quasi-periodical vortex street. The jet is associated with a natural instability characterized by f 0 or St 0. Under control, the minijet injection interacts with the oscillating bow shock. This instability can be suppressed when Cm is small but excited and amplified once Cm exceeds a threshold, which leads to the occurrence of the quasi-periodical vortex street and meanwhile St 0 changes to Ste, which scales with the momentum ratio ζ (figure 23).

7. Conclusions

Experimental investigation has been conducted to study the jet mixing enhancement of a supersonic axisymmetric jet with a design Mach number Md = 1.8. The jet is manipulated using a single steady radial minijet at the design and off-design conditions, corresponding to Pe/Pa = 1 and Pe/Pa ≠ 1, respectively. Two important minijet parameters are investigated, namely the mass flow rate ratio Cm or velocity ratio Ui/Uj and diameter ratio d/D of the minijet to the main jet. Detailed pressure and flow visualization measurements are carried out using a Pitot tube and schlieren technique, respectively. The following conclusions can be drawn out of this work.

  1. (i) Jet mixing, quantified via the core length $L_c^\ast $, of the manipulated supersonic jet exhibits a strong dependence on Cm (or Ui/Uj), d/D, Pe/Pa and Mj. Length $L_c^\ast $ retreats with increasing Cm for all Pe/Pa, suggesting an increased jet mixing rate with increased minijet penetration depth into the main jet. So does $L_c^\ast $ with decreasing d/D for a given Cm, which also acts to increase the minijet penetration depth. With an increase in Pe/Pa, $L_c^\ast $ retreats markedly with respect to a natural jet and the maximum reduction in $L_c^\ast $ occurs at Pe/Pa = 1 for given Cm and d/D. This retreat is ascribed to a larger penetration depth due to the weak shock cell strength formed under the design condition (Pe/Pa ≈ 1), as compared to the strong shock cell strength under the off-design condition (Pe/Pa ≠ 1).

  2. (ii) Empirical scaling analysis performed on experimental data along with the fully expanded jet Mach number Mj reveals that $L_c^\ast = {f_1}({C_m},d/D,{P_e}/{P_a},{M_j})$ may be reduced to $L_c^\ast = {f_2}(\xi )$. The scaling factor $\xi = J({d_i}/{D_j})/(\gamma M_j^2{P_e}/{P_a})$ is physically the penetration depth of the minijet into the main jet, where $J({d_i}/{D_j}) = \sqrt {{C_m}{U_i}/{U_j}} = \sqrt {{\rho _i}U_i^2/({\rho _j}U_j^2)} ({d_i}/{D_j})$ (${C_m}{U_i}/{U_j}$ is the momentum ratio of minijet to main jet or penetration depth) and $\gamma M_j^2{P_e}/{P_a}$ is the non-dimensional exit pressure ratio that characterizes a natural jet (e.g. Driftmyer Reference Driftmyer1972). This scaling law is more general than $L_c^\ast = f(\sqrt {{M}{{R}_N}} /(\gamma M_j^2{P_e}/{P_a}))$ developed by Perumal & Rathakrishnan (Reference Perumal and Rathakrishnan2022) and Khan et al. (Reference Khan, Nageswara Rao, Baghel, Perumal and Kumar2022) who used 2 and 2–6 minijets, respectively. Their scaling law is valid only for a fixed d/D, whilst the present scaling law is valid not only for different Md but also for varying d/D. The optimal d/D and required Cm may be estimated from the scaling law, given a predefined $L_c^\ast $, γ and Mj, in the case of IPR = NPR (NPR and IPR are related to Uj and Ui, respectively). Further, the scaling law highlights that the choice of the optimal d/D is a trade-off among the minimum operating Mj, required jet mixing and available Cm. This is in distinct contrast to a subsonic jet where the optimal d/D is a trade-off between required jet mixing and available Cm (Perumal & Zhou Reference Perumal and Zhou2021).

  3. (iii) It has been found that, once d/D ≥ 1/7.7 and Cm exceeds a certain level for a given exit pressure ratio (e.g. Cm ≥ 3.04 %, 2.43 % and 2.02 % for ${P_e}/{P_a} = 0.70$, 0.87 and 1.05, respectively), the minijet may generate a street of quasi-periodic large-scale structures downstream. This street exhibits a strong dependence on Cm or Ui/Uj, d/D and Pe/Pa (figure 22) and the dimensionless frequency Ste (≡ feDj/Uj) of the structures scales with a factor $\zeta = J({d_i}/{D_j})\; \sqrt {\gamma M_j^2{P_e}/{P_a}} $ (figure 23), where ζ is physically the ratio of the minijet momentum thrust to the ambient pressure thrust. The formation mechanism of the large-scale structure street is different from that of the Kármán vortex street generated behind a cylinder in cross-flow.

  4. (iv) The thrust vectoring angle δ that takes place under the minijet manipulation depends strongly on Cm, d/D and Pe/Pa and also scales with $\xi $, that is, δ = f 3(Cm, d/D, Pe/Pa) may be reduced to δ = f 4(ξ). Naturally, δ is also correlated with $L_c^\ast $ (figure 17b), implying that jet mixing grows with increasing jet deflection.

Nomenclature

P 0s

stagnation pressure in the settling chamber (bar)

P 0t

total pressure measured by the Pitot tube (bar)

Pa

atmospheric pressure (bar)

Pe

static pressure at the nozzle exit of the main jet (bar)

NPR

nozzle pressure ratio of the main jet, P 0s/Pa

IPR

injection pressure ratio of the minijet, P 0s,i/Pa

Md

design Mach number of the main jet

Mj

fully expanded jet Mach number of the main jet

d

nozzle exit diameter of minijet (mm)

di

fully expanded diameter of minijet (mm)

D

nozzle exit diameter of main jet (mm)

Dth

nozzle throat diameter of main jet (mm)

Dj

fully expanded diameter of main jet (mm)

${\dot{m}_i}$

mass flow rate of minijet (kg s−1)

${\dot{m}_j}$

mass flow rate of main jet (kg s−1)

${U_i}$

exit velocity of minijet (m s−1)

${U_j}$

exit velocity of main jet (m s−1)

Cm

mass flow rate ratio of minijet to main jet, ${\dot{m}_\textrm{i}}/{\dot{m}_j}$

J

momentum flux ratio or effective velocity ratio of minijet to main jet, $\sqrt {{\rho _i}U_i^2/({\rho _j}U_j^2)} $

MR

total momentum ratio of minijet to main jet, ${C_m}{U_i}/{U_j}$

δ

thrust vector angle or deflection angle (deg.)

$L_c^\ast $

supersonic core length, normalized by D

$L_p^\ast $

penetration depth, normalized by D

St 0

normalized frequency of large-scale structures in natural jet, ${f_0}{D_j}/{U_j}$

Ste

normalized frequency of large-scale structures in manipulated jet, ${f_e}{D_j}/{U_j}$

Funding

Y.Z. wishes to acknowledge support from China Guangdong Nuclear Power Corporation through grant CGN-HIT202221 and from the Research Grants Council of the Shenzhen Government through grant JCYJ20210324132816040.

Declaration of interests

The authors report no conflict of interest.

Footnotes

Joint first authors.

References

Akram, S., Perumal, A.K. & Rathakrishnan, E. 2021 Effect of tab parameters on the near-field mixing characteristics of a Mach 1.5 elliptic jet. Phys. Fluids 33 (3), 03611.CrossRefGoogle Scholar
Anderson, D.A., Tannehill, J.C. & Pletcher, R.H. 1984 Computational Fluid Mechanics and Heat Transfer. Hemisphere Publishing.Google Scholar
Anderson, J.D. 1982 Modern Compressible Flow with Historical Perspective. McGraw Hill Book Company.Google Scholar
André, B., Castelain, T. & Bailly, C. 2013 Experimental exploration of under-expanded supersonic jets. Shock Waves 24, 2132.CrossRefGoogle Scholar
Athira, C.M., Rajesh, G., Mohanan, S. & Parthasarathy, A. 2020 Flow interactions on supersonic projectiles in transitional ballistic regimes. J. Fluid Mech. 894, A27.CrossRefGoogle Scholar
Callender, B., Gutmark, E. & Martens, S. 2007 A comprehensive study of fluidic injection technology for jet noise reduction. In 13th AIAA/CEAS Aeroacoustics Conference (28th AIAA Aeroacoustics Conference). AIAA.CrossRefGoogle Scholar
Cattafesta, L.N. & Sheplak, M. 2011 Actuators for active flow control. Annu. Rev. Fluid Mech. 43, 247272.CrossRefGoogle Scholar
Chandra Sekar, T., Jaiswal, K., Arora, R., Sundararaj, R.H., Kushari, A. & Acharya, A. 2021 Nozzle performance maps for fluidic thrust vectoring. J. Propul. Power 37, 314325.CrossRefGoogle Scholar
Chue, S.H. 1975 Pressure probes for fluid measurement. Prog. Aerosp. Sci. 16, 147223.CrossRefGoogle Scholar
Coderoni, M., Lyrintzis, A.S. & Blaisdell, G.A. 2018 Les of unheated and heated supersonic jets with fluidic injection.CrossRefGoogle Scholar
Cuppoletti, D., Gutmark, E., Hafsteinsson, H. & Eriksson, L.-E. 2014 The role of nozzle contour on supersonic jet thrust and acoustics. AIAA J. 52, 25942614.CrossRefGoogle Scholar
Cuppoletti, D.R. & Gutmark, E. 2014 Fluidic injection on a supersonic jet at various mach numbers. AIAA J. 52, 293306.CrossRefGoogle Scholar
Davis, M.R. 1982 Variable control of jet decay. AIAA J. 20, 606609.CrossRefGoogle Scholar
Driftmyer, R.T. 1972 A correlation of free jet data. AIAA J. 10, 10931095.CrossRefGoogle Scholar
Gutmark, E.J., Schadow, K.C. & Yu, K.H. 1995 Mixing enhancement in supersonic free shear flows. Annu. Rev. Fluid Mech. 27, 375417.CrossRefGoogle Scholar
Henderson, B. 2010 Fifty years of fluidic injection for jet noise reduction. Intl J. Aeroacoust. 9, 91122.CrossRefGoogle Scholar
Ibrahim, M.K., Kunimura, R. & Nakamura, Y. 2002 Mixing enhancement of compressible jets by using unsteady microjets as actuators. AIAA J. 40, 681688.CrossRefGoogle Scholar
Jindra, K. 1970 Geometric effects on the performance characteristics of very small nozzles. Ohio School of Engineering.Google Scholar
Katanoda, H., Miyazato, Y., Masuda, M. & Matsuo, K. 2000 Pitot pressures of correctly-expanded and under-expanded free jets from axisymmetric supersonic nozzles. Shock Waves 10 (2), 95101.CrossRefGoogle Scholar
Khan, A., Nageswara Rao, A., Baghel, T., Perumal, A.K. & Kumar, R. 2022 Parametric study and scaling of Mach 1.5 jet manipulation using steady fluidic injection. Phys. Fluids 34 (3), 036107.CrossRefGoogle Scholar
Knowles, K. & Saddington, A.J. 2006 A review of jet mixing enhancement for aircraft propulsion applications. Proc. Inst. Mech. Engrs G: J. Aerosp. Engng 220, 103127.CrossRefGoogle Scholar
Krothapalli, A., Strykowski, P. & King, C. 1998 Origin of streamwise vortices in supersonic jets. AIAA J. 36, 869872.CrossRefGoogle Scholar
Miller, S.A.E. & Veltin, J. 2011 Experimental and numerical investigation of flow properties of supersonic helium-air jets. AIAA J. 49, 235246.CrossRefGoogle Scholar
Miller, S.A.E., Veltin, J., Morris, P.J. & Mclaughlin, D.K. 2009 Assessment of computational fluid dynamics for supersonic shock containing jets. AIAA J. 47, 27382746.CrossRefGoogle Scholar
Moffat, R.J. 1985 Using uncertainty analysis in the planning of an experiment. J. Fluids Engng 107 (2), 173–178.CrossRefGoogle Scholar
Munday, D., Gutmark, E., Liu, J. & Kailasanath, K. 2011 Flow structure and acoustics of supersonic jets from conical convergent-divergent nozzles. Phys. Fluids 23 (11), 116102.CrossRefGoogle Scholar
Muppidi, S. & Mahesh, K. 2005 Study of trajectories of jets in crossflow using direct numerical simulations. J. Fluid Mech. 530, 81100.CrossRefGoogle Scholar
Neely, A.J., Gesto, F.N. & Young, J. 2007 Performance studies of shock vector control fluidic thrust vectoring.CrossRefGoogle Scholar
Panda, J. 1998 Shock oscillation in under-expanded screeching jets. J. Fluid Mech. 363, 173198.CrossRefGoogle Scholar
Perumal, A.K. & Rathakrishnan, E. 2013 Truncated triangular tabs for supersonic-jet control. J. Propul. Power 29, 5065.Google Scholar
Perumal, A.K. & Rathakrishnan, E. 2021 Scaling law for supersonic core length in circular and elliptic free jets. Phys. Fluids 33 (5), 051707.Google Scholar
Perumal, A.K. & Rathakrishnan, E. 2022 Design of fluidic injector for supersonic jet manipulation. AIAA J. 60, 46394648.CrossRefGoogle Scholar
Perumal, A.K., Verma, S.B. & Rathakrishnan, E. 2015 Experimental study of subsonic and sonic jets controlled by air tabs. J. Propul. Power 31, 14731481.Google Scholar
Perumal, A.K., Wu, Z., Fan, D. & Zhou, Y. 2022 A hybrid AI control of turbulent jet: Reynolds number effect and scaling. J. Fluid Mech. 942, 128.CrossRefGoogle Scholar
Perumal, A.K. & Zhou, Y. 2018 Parametric study and scaling of jet manipulation using an unsteady minijet. J. Fluid Mech. 848, 592630.CrossRefGoogle Scholar
Perumal, A.K. & Zhou, Y. 2021 Axisymmetric jet manipulation using multiple unsteady minijets. Phys. Fluids 33 (6), 065124.CrossRefGoogle Scholar
Perumal, K.A., Aravindh Kumar, S.M., Surya Mitra, A. & Rathakrishnan, E. 2019 Empirical scaling analysis of supersonic jet control using steady fluidic injection. Phys. Fluids 31 (5), 056107.Google Scholar
Phalnikar, K.A., Kumar, R. & Alvi, F. 2008 Experiments on free and impinging supersonic microjets. Exp. Fluids 44, 819830.CrossRefGoogle Scholar
Phanindra, B.C. & Rathakrishnan, E. 2010 Corrugated tabs for supersonic jet control. AIAA J. 48, 453465.CrossRefGoogle Scholar
Powell, A. 1953 On the mechanism of choked jet noise. Proc. Phys. Soc. B 66, 1039.CrossRefGoogle Scholar
Rao, A.N., Kushari, A. & Mandal, A.C. 2020 Screech characteristics of under-expanded high aspect ratio elliptic jet. Phys Fluids 32 (7), 076106.CrossRefGoogle Scholar
Rathakrishnan, E. 2016 Instrumentation, Measurements, and Experiments in Fluids, pp. 368. CRC Press.CrossRefGoogle Scholar
Seifert, A., Theofilis, V. & Joslin, R. 2004 Issues in active flow control: theory, simulation and experiment. Prog Aerosp. Sci. 40, 237–289.Google Scholar
Semlitsch, B., Cuppoletti, D.R., Gutmark, E.J. & Mihăescu, M. 2019 Transforming the shock pattern of supersonic jets using fluidic injection. AIAA J. 57, 18511861.CrossRefGoogle Scholar
Sirovich, L. 1987 Proper orthogonal decomposition applied to turbulent flow in a square duct. Q. Appl. Maths 45, 561671.CrossRefGoogle Scholar
Smith, T.D., Cain, A.B. & Chenault, C.F. 2001 Numerical simulation of enhanced mixing in jet plumes using pulsed blowing. J. Aircraft 38, 458463.CrossRefGoogle Scholar
Taira, K., Brunton, S.L., Dawson, S.T.M., Rowley, C.W., Colonius, T., Mckeon, B.J., Schmidt, O.T., Gordeyev, S., Theofilis, V. & Ukeiley, L.S. 2017 Modal analysis of fluid flows: an overview. AIAA J. 55, 40134041.CrossRefGoogle Scholar
Tam, C.K.W., Seiner, J.M. & Yu, J.C. 1986 Proposed relationship between broadband shock associated noise and screech tones. J. Sound Vib. 110, 309321.CrossRefGoogle Scholar
Warsop, C. & Crowther, W.J. 2018 Fluidic flow control effectors for flight control. AIAA J. 56, 38083824.CrossRefGoogle Scholar
Werle, M.J., Shaffer, D.G. & Driftmyer, R.T. 1970 On freejet terminal shocks. AIAA J. 8, 22952297.CrossRefGoogle Scholar
Wu, K., Kim, T.H. & Kim, H.D. 2020 Theoretical and numerical analyses of aerodynamic characteristics on shock vector control. J. Aerosp. Engng 33 (5), 04020050.Google Scholar
Zaman, K.M.Q., Reeder, M.F. & Samimy, M. 1994 Control of an axisymmetric jet using vortex generators. Phys. Fluids 6 (2), 778–793.CrossRefGoogle Scholar
Zhang, H., Aubry, N., Chen, Z., Wu, W. & Sha, S. 2019 The evolution of the initial flow structures of a highly under-expanded circular jet. J. Fluid Mech. 871, 305331.CrossRefGoogle Scholar
Zhang, L. & Fan, J. 2003 Research of optimized design of three-dimensional contraction. Acta Aeronaut. Astronaut. Sin. 21, 417423.Google Scholar
Zigunov, F., Song, M., Sellappan, P. & Alvi, F.S. 2022 Multiaxis shock vectoring control of overexpanded supersonic jet using a genetic algorithm. J. Propul. Power 39 (2), 249257.Google Scholar
Zucrow, M. & Hoffman, J. 1976 Gas Dynamics. Wiley.Google Scholar
Figure 0

Figure 1. Schematics of (a) supersonic jet facility and (b) schlieren flow visualization measurement. All lengths are in mm.

Figure 1

Table 1. Flow conditions for the natural jet of design Mach number Md = 1.8.

Figure 2

Table 2. Mass flow rate ratio Cm of minijet to main jet for various IPRs at exit pressure ratio Pe/Pa = 0.70 (NPR = 4).

Figure 3

Figure 2. Schlieren images of supersonic natural jets, NPR = 4.0 (${P_e}/{P_a} = 0.70$). Pitot tube at various x* locations.

Figure 4

Figure 3. (ac) Time-averaged schlieren images for various fully expanded jets with Mach number ${M_j}$. Parameter ${L_s}$ is the shock-cell length.

Figure 5

Figure 4. Time-averaged centreline pressure ratio at NPR of (a) 4, (b) 5 and (c) 6. The data of Phanindra & Rathakrishnan (2010), whose nozzle is given in red in the inset of (a), from an Md = 1.8 jet with the same $\textit{NPR}$ are included for comparison. The horizontal broken line indicates the cutoff ${P_{0t}}/{P_{0s}}$ for sonic Mach number as given by Perumal & Rathakrishnan (2022).

Figure 6

Figure 5. Variation with fully expanded jet Mach number ${M_j}$ in the supersonic core length $L_c^\ast $. The data from Phanindra & Rathakrishnan (2010) for design Mach number ${M_d} = 1.8$ are included for comparison. The curve is a least-squares fitting to experimental data.

Figure 7

Figure 6. (ad) Radial pressure ratio distributions of natural jet at exit pressure ratio ${P_e}/{P_a} = 0.70$.

Figure 8

Figure 7. Iso-contours of time-averaged pressure ratio ${P_{0t}}/{P_{0s}}$. (a) Natural jet (${P_e}/{P_a} = 0.70$). Manipulated jet ($d/D = 1/9.5$): (bd) injection plane; (eg) non-injection plane. The red thick curve denotes the cutoff pressure ratio (0.472) for the sonic Mach number.

Figure 9

Figure 8. Dependence of the supersonic core length $L_c^\ast $ on mass flow rate ratio ${C_m}$ and correlation between velocity ratio ${U_i}/{U_j}$ and ${C_m}$: (a) ${P_e}/{P_a} = 0.70$, (b) 1.05. The dotted line represents $L_c^\ast $ of natural jet.

Figure 10

Figure 9. Dependence of the supersonic core length $L_c^\ast $ on the scaling factor $\xi = \sqrt {{C_m}{U_i}/{U_j}} /(\gamma M_j^2{P_e}/{P_a}) = J({d_i}/{D_j})/(\gamma M_j^2{P_e}/{P_a})$, where the momentum flux ratio $J = \sqrt {{\rho _i}U_i^2/({\rho _j}U_j^2)} $. The solid curve is the least-squares fitting to experimental data and the broken curves indicate the confidence levels of +10 % and −10 %.

Figure 11

Figure 10. Dependence of predicted supersonic core length $L_c^\ast $ on mass flow rate ratio ${C_m}$ from the scaling law (4.5) (${P_e}/{P_a} = 1.05$, $d/D = 4.1$), as compared with measured $L_c^\ast $ under identical conditions.

Figure 12

Figure 11. (ag,in) Time-averaged schlieren images of manipulated jet at ${P_e}/{P_a} = 0.70$ for various ${C_m}$ along with (e,h) the definitions of the shock wave angle β and the distance ${L_p}$ from the nozzle lip (z* = 0.5) to the point where the induced bow shock and the minijet centreline intersect.

Figure 13

Figure 12. Dependence of the scaling factor $\xi$ and supersonic core length $L_c^\ast $ on (a) the penetration depth $L_p^\ast $ and (b) shock wave angle $\beta $.

Figure 14

Figure 13. (a) Dependence of $\textit{IPR}$ on diameter ratio $d/D$ and fully expanded jet Mach number ${M_j}$ ($\Delta L_c^\ast = 15\,\%$), where the square symbols correspond to $d/D$ at which $\textit{IPR} = \textit{NPR}$ ($\textit{IPR} < \textit{NPR}$ and $\textit{IPR} > \textit{NPR}$ occur above and below the symbols, respectively). (b) Dependence of ${C_m}$ and $d/D$ on ${M_j}$.

Figure 15

Figure 14. Dependence of the optimal $d/D$ and ${C_m}$ on $\Delta L_c^\ast $ at ${M_j} = 1.56$. The curve is the least-squares fitting to the optimal diameter ratios.

Figure 16

Figure 15. Dependence on mass flow rate ratio ${C_m}$ of thrust vector angle $\delta $ estimated from schlieren images and Pitot pressure ratio data for various ${P_e}/{P_a}$ and $d/D$.

Figure 17

Figure 16. (a) Sketch of induced shocks and expansion fans; blue and red correspond to ${P_e}/{P_a} = 0.70$ and 1.05, respectively. (bg) Time-averaged schlieren images of the manipulated jet (d/D = 1/9.5) captured in two orthogonal planes at ${P_e}/{P_a} = 0.70$ and (h) at ${P_e}/{P_a} = 1.05$.

Figure 18

Figure 17. Dependence on thrust vector angle $\delta $ of (a) shock wave angle $\beta $ and (b) supersonic core length ${L_c}/D$ for ${P_e}/{P_a} = 0.70\unicode{x2013} 1.05$ and $d/D = 1/20\unicode{x2013} 1/5.3$.

Figure 19

Figure 18. (a) Dependence of $\delta $ on $\xi $ (${C_m} = 0.18\unicode{x2013} 10.38\,\%$). (b,c) Schlieren images for $\xi = 0.021$ in the dead zone (${P_e}/{P_a} = 0.70$, $d/D = 1/9.5$, ${C_m} = 0.27\,\%$) and 0.15 in the linear region (0.70, 1/5.3, 10.38 %).

Figure 20

Figure 19. Instantaneous schlieren images captured at 43 kHz: (ae) manipulated jet at $d/D = 1/6.5$ and $\textit{IPR} = 7.0$; ( f) ${C_m} = 0$ with the minijet nozzle protruding into the jet (${x^\ast } = 0.2$, ${z^\ast } = 0.3$). The broken curve indicates the trajectory of the organized structures.

Figure 21

Figure 20. (a) (i) Instantaneous and (ii) averaged schlieren images of the manipulated jet for ${P_e}/{P_a} = 0.87$, $d/D = 1/5.3$ and ${C_m} = 5.19\,\%$ when the minijet is placed at $x/D = 0.2$. (b) Reconstructed images of the first eight POD modes calculated from 300 schlieren images captured at a sampling rate of 43 kHz. Arrows in (ai,aii) point to the induced shocks or expansion fans, and the ellipses in (ai) highlight the flow structures that occur downstream of the minijet.

Figure 22

Figure 21. (a) The PSD function of POD coefficients for modes 2–8 and PSD function of grey values for location $({x^\ast },{z^\ast }) = (1,{\textstyle{1 \over 4}})$, as shown in figure 20(ai). (b) Phase plot of the POD coefficients of modes 2–3.

Figure 23

Figure 22. Dependence on ${C_m}$ of the predominant frequency $S{t_e} = {f_e}{D_j}/{U_j}$ of the observed vortex street and correlation between ${U_i}/{U_j}$ and ${C_m}$: (a) ${P_e}/{P_a} = 0.70$, (b) 0.87.

Figure 24

Figure 23. Dependence of $S{t_e}$ on the scaling factor $\zeta = J({d_i}/{D_j})\; \sqrt {\gamma M_j^2{P_e}/{P_a}} $. The solid curve is the least-squares fitting to experimental data.

Figure 25

Figure 24. (a) Instantaneous schlieren images (${P_e}/{P_a} = 1.05$, ${M_j} = 1.83$): (i) natural jet; manipulated jet for (ii–iv) $d/D = 1/9.5$ and (v,vi) 1/7.7. (b) Corresponding PSD functions of POD coefficients for mode 2.

Figure 26

Figure 25. (a) Sequential schlieren images of the manipulated jet (${P_e}/{P_a} = 1.05$, $d/D = 1/7.7$, ${C_m} = 2.83\,\%$). (b) The PSD functions of POD coefficients of mode 2, calculated from the entire flow field and the grey values from three representative points P1, P2 and P3, as indicated in (a). The elliptic contours highlight the occurrence of the quasi-periodical vortices.