Hostname: page-component-78c5997874-j824f Total loading time: 0 Render date: 2024-11-07T07:26:11.284Z Has data issue: false hasContentIssue false

Investigation of near-wall particle statistics in CFD-DEM simulations of dense fluidised beds and derivation of an Eulerian particle dynamic wall boundary condition

Published online by Cambridge University Press:  29 February 2024
Dorian Dupuy
Affiliation:
Laboratoire de Génie Chimique (LGC), Université de Toulouse, CNRS, INPT, UPS, 31400 Toulouse, France FR FERMAT, Université de Toulouse, CNRS, INPT, INSA, UPS, 31400 Toulouse, France
Renaud Ansart
Affiliation:
Laboratoire de Génie Chimique (LGC), Université de Toulouse, CNRS, INPT, UPS, 31400 Toulouse, France
Olivier Simonin*
Affiliation:
Institut de Mécanique des Fluides de Toulouse (IMFT), Université de Toulouse, CNRS, 31400 Toulouse, France
*
Email address for correspondence: [email protected]

Abstract

In two-fluid simulations of gas–solid fluidised beds, the gaseous phase and the particulate phase are modelled as continuous media. The stress exerted by the particulate medium on the container walls should be modelled to predict accurately the bed dynamics. This paper addresses the modelling of sliding particle–wall contacts in two-fluid simulations, based on reference simulations coupling computational fluid dynamics with the discrete element method (CFD-DEM), in which the individual movement of the particles is tracked. The analysis of the CFD-DEM highlights the complex near-wall behaviour of the particles, which is not reproduced by two-fluid models. Nevertheless, the particle–wall shear stress can be expressed based on the total granular pressure within the first cell off the wall. The model is validated for the two-fluid simulation of a bubbling gas–solid fluidised bed of olefin particles in the dense-fluidisation regime.

Type
JFM Papers
Copyright
© The Author(s), 2024. Published by Cambridge University Press

1. Introduction

A gas–solid fluidised bed is a bed of solid particles, through which a gas is passed, which behaves as a fluid. The fluidised state is maintained as the drag force exerted by the gas flow on the solid particles is able to overcome the gravitational force. Gas–solid fluidised beds are used extensively in various industrial applications, such as flue gas desulphurisation (Deng et al. Reference Deng, Ansart, Baeyens and Zhang2019), catalytic polymerisation (Neau et al. Reference Neau, Pigou, Fede, Ansart, Baudry, Mérigoux, Laviéville, Fournier, Renon and Simonin2020) and solar receiver (Sabatier et al. Reference Sabatier, Ansart, Zhang, Baeyens and Simonin2020). Several modelling approaches have been proposed to simulate large-scale gas–solid fluidised beds. They may be classified broadly into Eulerian–Lagrangian models and Eulerian–Eulerian models.

Eulerian–Lagrangian models are those that describe the motion of the gas using an Eulerian model, by modelling it as a continuous medium, and the motion of the solid particles using a deterministic Lagrangian model, by modelling them as discrete entities with, for instance, the discrete element method (DEM) (Cundall & Strack Reference Cundall and Strack1979), the dense discrete phase model (DDPM) (Popoff & Braun Reference Popoff and Braun2007) or the multiphase particle-in-cell (MP-PIC) method (Andrews & O'Rourke Reference Andrews and O'Rourke1996). While the DDPM and MP-PIC methods consider parcels of particles, and furthermore do not use detailed collision laws (Chen & Wang Reference Chen and Wang2014; Adnan et al. Reference Adnan, Sun, Ahmad and Wei2021), DEM entails tracking the motion of each solid particle individually, using Newton's second law of motion, and an explicit treatment of each particle collision. The CFD-DEM approach is a computational technique that combines a computational fluid dynamics (CFD) approach for the simulation of the continuous phase with a DEM for the simulation of the discrete phase. The interaction between the two phases is taken into account using empirical closures, as the complex flow around individual particles is not resolved. Since every particle and every collision is considered, CFD-DEM simulations are computationally expensive for large-scale systems, but can account for the interactions between particles in a realistic manner.

Eulerian–Eulerian models are those that describe the motion of the gas and the solid particles using an Eulerian two-fluid model (TFM), by modelling them as two interpenetrating continua (Wang Reference Wang2020). Two-fluid simulations rely on models to provide of a set of proper governing equations, constitutive relationships and boundary conditions. Coupled mass, momentum and energy transport equations may be derived for each phase from mixture theory or statistical averaging, based on a Lagrangian stochastic model (Anderson & Jackson Reference Anderson and Jackson1967; Bowen Reference Bowen1971; Morioka & Nakajima Reference Morioka and Nakajima1987; Simonin Reference Simonin2000). Constitutive models for the particulate phase are generally closed using the kinetic theory of granular flow (KTGF), which may be understood as an extension of the kinetic theory of gases (Jenkins & Savage Reference Jenkins and Savage1983; Chapman & Cowling Reference Chapman and Cowling1990). The KTGF assumes that particle–particle collisions are instantaneous and binary. To represent the granular stress associated with enduring contacts, referred to hereafter as the frictional granular stress, the KTGF is usually complemented in dense-fluidisation regimes with empirical models based on the critical state theory of soil mechanics (Schaeffer Reference Schaeffer1987; Johnson, Nott & Jackson Reference Johnson, Nott and Jackson1990; Ocone, Sundaresan & Jackson Reference Ocone, Sundaresan and Jackson1993; Srivastava & Sundaresan Reference Srivastava and Sundaresan2003). In particular, (Johnson et al. Reference Johnson, Nott and Jackson1990) introduced a model for the intermediate regime where both enduring contacts and short-duration collisions are significant, in which they proposed to sum the KTGF stress and the frictional stress as if they acted alone.

Regarding the boundary-condition modelling, the no-slip wall boundary condition is in general suitable for the gaseous phase because the Knudsen number is small and turbulent effects are not important (Agrawal et al. Reference Agrawal, Loezos, Syamlal and Sundaresan2001). For the particulate phase, commonly no-slip, free-slip and partial-slip boundary conditions are used. Various particle–wall boundary conditions have been derived in the literature following the KTGF, to take into account the collisions between particles and flat walls (Hui et al. Reference Hui, Haff, Ungar and Jackson1984; Jenkins & Louge Reference Jenkins and Louge1997; Sakiz & Simonin Reference Sakiz and Simonin1999). The shadow-effect model of Sommerfeld & Huber (Reference Sommerfeld and Huber1999) has been used by several authors to extend the modelling approach to take into account the effect of wall roughness (Konan, Simonin & Squires Reference Konan, Simonin and Squires2006; Radenkovic & Simonin Reference Radenkovic and Simonin2018). Johnson & Jackson (Reference Johnson and Jackson1987) proposed a boundary-condition model for dense fluidised beds, following the approach of Hui et al. (Reference Hui, Haff, Ungar and Jackson1984), that aims to represent both short-duration collisions and enduring contacts. The authors represented the momentum and energy transfer due to collisions between particles and rough walls using a specularity coefficient, whose value depends on the roughness of the wall. This coefficient is difficult to measure experimentally, and has in practice been used as a tuning parameter in numerical simulations (Almuttahar & Taghipour Reference Almuttahar and Taghipour2008; Li, Grace & Bi Reference Li, Grace and Bi2010; Shu et al. Reference Shu, Peng, Wang, Zhang, Li and Lin2014). An analytical expression for the specularity coefficient as a function of measurable particle and wall properties has been proposed by Li & Benyahia (Reference Li and Benyahia2012) based on the rigid-body theory. Zhao et al. (Reference Zhao, Ding, Zhu and Zhong2016) proposed another expression based on the particle simulations of Louge (Reference Louge1994). Another family of particle–wall boundary conditions has been established by Jenkins (Reference Jenkins1992) and Jenkins & Louge (Reference Jenkins and Louge1997) to predict the particle slip velocity and agitation kinetic energy flux. Schneiderbauer et al. (Reference Schneiderbauer, Schellander, Löderer and Pirker2012) derived a boundary condition that combines the sliding and non-sliding limit cases of Jenkins (Reference Jenkins1992) and Jenkins & Louge (Reference Jenkins and Louge1997) in one expression. The approach has been extended to the case of rough walls by Soleimani, Pirker & Schneiderbauer (Reference Soleimani, Pirker and Schneiderbauer2015a).

There have been numerous studies on the effect of the particle–wall boundary condition on the hydrodynamics of gas–solid fluidised beds. Benyahia, Syamlal & O'Brien (Reference Benyahia, Syamlal and O'Brien2005) investigated several boundary conditions (Johnson & Jackson Reference Johnson and Jackson1987; Jenkins Reference Jenkins1992; Jenkins & Louge Reference Jenkins and Louge1997) for the simulation of a dilute gas–solid pipe flow, and concluded that the physical behaviour of the particle–wall interaction is close to the sliding limit of the boundary condition of Jenkins & Louge (Reference Jenkins and Louge1997), to the boundary condition of Johnson & Jackson (Reference Johnson and Jackson1987) with a small specularity coefficient, or to a free-slip boundary condition. Darelius et al. (Reference Darelius, Rasmuson, van Wachem, Björn and Folestad2008) compared free-slip and partial-slip boundary conditions for the simulation of a high-shear mixer, and stressed the importance of developing partial-slip boundary conditions for dense systems with enduring particle–wall contacts. Li et al. (Reference Li, Grace and Bi2010) studied the influence of the parameters of the boundary condition of Johnson & Jackson (Reference Johnson and Jackson1987) for the simulation of a bubbling fluidised bed, and emphasised that the particle–wall boundary condition should be specified with great care. Sharma et al. (Reference Sharma, Wang, Pareek, Yang and Zhang2014) examined the effect of the specularity coefficient using the model of Sinclair & Jackson (Reference Sinclair and Jackson1989), and found that its influence was significant at low fluidisation velocities but negligible at higher fluidisation velocities. Soleimani, Schneiderbauer & Pirker (Reference Soleimani, Schneiderbauer and Pirker2015b,Reference Soleimani, Schneiderbauer and Pirkerc) compared four boundary conditions (Johnson & Jackson Reference Johnson and Jackson1987; Jenkins Reference Jenkins1992; Jenkins & Louge Reference Jenkins and Louge1997; Li & Benyahia Reference Li and Benyahia2012; Schneiderbauer et al. Reference Schneiderbauer, Schellander, Löderer and Pirker2012), and argued that the boundary condition of Schneiderbauer et al. (Reference Schneiderbauer, Schellander, Löderer and Pirker2012) is the most complete because it considers rigorously the dissipation of particle agitation. Fede, Simonin & Ingram (Reference Fede, Simonin and Ingram2016) compared smooth- and rough-wall boundary conditions for the simulation of a dense fluidised bed, and showed that the macroscopic hydrodynamic behaviour of the bed was not well reproduced with a smooth-wall boundary condition. Nigmetova (Reference Nigmetova2019) investigated the same bed configuration using CFD-DEM simulations, and recommended taking into account the effect of the enduring contacts of particle clusters near the wall in the TFM boundary condition.

In this paper, we propose and assess a new boundary-condition model for sliding particle–wall contacts at smooth flat walls. The model is developed using CFD-DEM simulations of a bubbling gas–solid fluidised bed of olefin particles in the dense-fluidisation regime. The CFD-DEM simulations are performed with the explicit goal of assisting the TFM development, and therefore use modelling assumptions intended to facilitate the comparison. Namely, the CFD-DEM simulations use the same drag model as used in the TFM and, for consistency with the two-fluid modelling assumptions, neglect both rotation and particle–particle friction. The results of the CFD-DEM simulations are used to inspect the near-wall behaviour of the bed. In particular, a relationship between the particle–wall shear stress and the fluxes of the particle–particle contact-stress tensor is sought. This lets us establish a particle–wall boundary condition based on the total granular pressure within the first cell off the wall, which can operate in all fluidisation regimes. Finally, we compare several boundary-condition models for the two-fluid simulation of the bubbling gas–solid fluidised bed. The results are compared to positron emission particle tracking (PEPT) measurements (Fede et al. Reference Fede, Simonin and Ingram2016) and to the present CFD-DEM simulations. Two cases are considered: a case with total solid mass $2.5$ kg and high fluidisation velocity $0.32\ {\rm m}\ {\rm s}^{-1}$, and a case with total solid mass $3.8$ kg and low fluidisation velocity $0.16\ {\rm m}\ {\rm s}^{-1}$. In both cases, the comparison includes, in addition to the present boundary condition, a no-slip boundary condition, a kinetic boundary condition and a kinetic-frictional boundary condition.

The paper is organised as follows. Section 2 presents the modelling and numerical assumptions of the CFD-DEM simulations. Section 3 analyses the CFD-DEM data and develops the boundary-condition model. Section 4 presents the modelling and numerical assumptions of the TFM simulations, and the a posteriori comparison of the boundary-condition models. Section 5 concludes.

2. Discrete element modelling

The selected test case is a dense, non-reactive, isothermal and pressurised gas–solid cylindrical fluidised bed of olefin particles in the bubbling fluidisation regime. The configuration reproduces the experimental set-up of Fede et al. (Reference Fede, Moula, Ingram, Dumas and Simonin2009Reference Fede, Simonin and Ingram2016). A CFD-DEM simulation of the case has been performed by Nigmetova et al. (Reference Nigmetova, Masi, Simonin, Dufresne and Moureau2022). The present CFD-DEM simulations use the same mesh and numerical method as in Nigmetova et al. (Reference Nigmetova, Masi, Simonin, Dufresne and Moureau2022). This section presents the geometrical and operational parameters of the case, the numerical and modelling hypotheses of the CFD-DEM simulations, and validation results.

2.1. Geometry and operating conditions

The computational domain of the CFD-DEM simulations is represented in figure 1(a). The internal radius of the cylindrical column is $R_c = 0.077$ m. Above height $H_C = 12 R_c$, the radius is enlarged progressively over a height $H_E = 3.7 R_c$ until $R_E = 1.65 R_c$. The total height of the column is $H_T = 22.2 R_c$. A pressurised gas (nitrogen) is injected with uniform velocity $V_f$ on the bottom boundary (inlet). A pressure $12$ bar is prescribed on the top boundary (outlet). This elevated pressure is not necessary for the development of the present wall shear stress model, which should also apply to other pressure conditions and in particular to dry granular flows, where the interstitial gas plays a negligible role. The lateral boundaries are considered no-slip walls for the gas. The variations of temperature and density within the column are assumed negligible. The gas temperature is $T_g = 298$ K. The gas density is $\rho _g = 13.595$ kg m$^{-3}$. The gas dynamic viscosity is $\eta _g = 1.7982 \times 10^{-5}$ Pa s.

Figure 1. (a) Computational domain of the CFD-DEM simulations, and (b) bottom view of the CFD-DEM mesh.

The bed is filled with smooth, mono-disperse, ideally spherical particles of diameter $d_p = R_c/88 = 875 \times 10^{-6}$ m and density $\rho _p = 740$ kg m$^{-3}$. The minimum fluidisation velocity of the particles is 0.095 m s$^{-1}$ according to the correlation of Wen & Yu (Reference Wen and Yu1966), and 0.10 m s$^{-1}$ according to the correlation of Thonglimp, Hiquily & Laguerie (Reference Thonglimp, Hiquily and Laguerie1984). For the particles, the lateral boundaries and the gas inlet act as walls, and are treated identically. Thus no particle can leave the bed during the simulation. Two cases from Fede et al. (Reference Fede, Moula, Ingram, Dumas and Simonin2009Reference Fede, Simonin and Ingram2016) are considered, as reported in table 1: case F3, with total solid mass $M_p = 2.5$ kg and fluidisation velocity $V_f = 0.32\ {\rm m}\ {\rm s}^{-1}$; and case F4, with total solid mass $M_p = 3.8$ kg and fluidisation velocity $V_f = 0.16\ {\rm m}\ {\rm s}^{-1}$. A frictionless variant of case F3 is also considered, in which the sliding friction between particles and walls is neglected. The two cases are in the bubbling fluidisation regime. The bed is denser and associated with smaller bubbles in case F4, given its larger total solid mass and lower fluidisation velocity. The average bed height is $h_b \approx 4.8R$ in case F3, and $h_b \approx 6.6R$ in case F4.

Table 1. Operating conditions and numerical parameters of the CFD-DEM simulations.

2.2. Governing equations and numerical method

Following the CFD-DEM approach, the particulate phase is modelled as a discrete set of particles, whereas the gaseous phase is modelled as a continuous medium that can penetrate the particles. The motion of the particles is modelled using Newton's second law of motion, with a soft-sphere treatment of the contact forces (Cundall & Strack Reference Cundall and Strack1979). The motion of the gas is modelled using a large-eddy simulation formalism, under the low Mach number approximation and without density or temperature variations. A detailed description of the governing equations used for the gaseous and solid phases is found in Dufresne et al. (Reference Dufresne, Moureau, Lartigue and Simonin2020) and Nigmetova et al. (Reference Nigmetova, Masi, Simonin, Dufresne and Moureau2022). The most relevant modelling hypotheses are recalled below for clarity. First, one may note that particle rotation is not considered, for consistency with the two-fluid modelling assumptions discussed in § 4.1. Although the effect of particle rotation is neglected in the present study, it would be valuable to carry out an investigation of its effect in the future, as it might affect the dynamics of the particles near the side walls. Second, the normal contact force exerted on a particle by another particle or by a wall is computed using damped linear spring model, while the tangential contact force is computed using a Coulomb sliding friction model. The collision model is characterised by spring stiffness $k_n$, the spring damping coefficient $\gamma _n$, and the coefficient of sliding friction $\mu$. In the soft-sphere approach, the spring stiffness is generally not determined based on the Young's modulus of the particle material, as this would lead to an impractically small collision time (van der Hoef et al. Reference van der Hoef, Ye, van Sint Annaland, Andrews, Sundaresan and Kuipers2006)

(2.1)\begin{equation} T_c = {\rm \pi}\sqrt{m_{eff}/k_n}. \end{equation}

In the present CFD-DEM simulations, the spring stiffness is set to $k_{n,p} = 200\ {\rm N}\ {\rm m}^{-1}$ for particle–particle contacts. Since particle–particle contacts are limiting for the simulation time step, a higher value $k_{n,w} = 300\ {\rm N}\ {\rm m}^{-1}$ is used for for particle–wall contacts, without additional computational cost. The spring damping coefficient $\gamma _n$ is given by

(2.2)\begin{equation} \gamma_n = \frac{- \ln e_c}{\sqrt{{\rm \pi}^2 + (\ln e_c)^2}}\,\sqrt{k_n/m_{eff}}, \end{equation}

where $e_c$ is the normal restitution coefficient associated with the contacts. For particle–wall contacts, the restitution coefficient is denoted $e_w$ and set to $e_w = 1$, which corresponds to purely elastic contacts. For particle–particle contacts, the restitution coefficient is denoted $e_c$ and set to a lower value $e_c = 0.9$ to take into account the energy dissipated during particle collisions. As reported in table 1, CFD-DEM simulations are performed with wall sliding friction coefficient $\mu _w = 0$ (frictionless wall contacts) and $\mu _w = 0.3$ (non-zero wall sliding friction). The coefficient of sliding friction is set to zero for particle–particle contacts in all cases.

The simulations are performed using a finite-volume method. The gas is advanced using the time-staggered projection method of Chorin (Reference Chorin1968) and the explicit TRK4 scheme of Kraushaar (Reference Kraushaar2011), which combines linearly a fourth-order Runge–Kutta scheme and a two-step Taylor–Galerkin scheme (Colin & Rudgyard Reference Colin and Rudgyard2000). A fourth-order centred scheme is used for spatial discretisation. The simulation is performed on an O-grid mesh that contains 350 000 cells in total, as represented in figure 1(b). The cell size in the vertical direction ($z$) is regular and equal to $\Delta z = 5 d_p$. The typical cell size in the radial direction ($r$) is also $\Delta r = 5 d_p$. The grid sensitivity analysis performed in Nigmetova et al. (Reference Nigmetova, Masi, Simonin, Dufresne and Moureau2022) has shown that this cell size is relevant. In the outer region, the number of cells in the angular direction ($\theta$) is $N_\theta = 80$. This implies that the circular geometry of the column is approximated by an octacontagon (A.4).

The particles are advanced using an explicit second-order Runge–Kutta scheme for time advancement. A linked-cell data structure is used to search for potential collision partners (Lubachevsky Reference Lubachevsky1991; Komiwes et al. Reference Komiwes, Mege, Meimon and Herrmann2006). A Voronoi-region decomposition of the wall features is used to solve the wall contacts. This is performed using the massively parallel code YALES2 (Moureau, Domingo & Vervisch Reference Moureau, Domingo and Vervisch2011). A detailed description of the CFD-DEM methodology is given in Dufresne et al. (Reference Dufresne, Moureau, Lartigue and Simonin2020). The gas is advanced in time using a time step $\Delta t_f$. The particles are advanced in time using a time step $\Delta t_p < \Delta t_f$, during which the gas advancement is frozen. The computation of the fluid and particle time steps is detailed in Nigmetova et al. (Reference Nigmetova, Masi, Simonin, Dufresne and Moureau2022).

3. Development of a particle–wall shear stress model

The present paper establishes a boundary-condition model for the friction exerted by the particles onto the container walls in the sliding regime, assuming a continuum representation of the dispersed phase. The continuum modelling relies on a statistical description of the particles, as described in § 3.1. This theoretical balance of the stresses is combined with insights from the CFD-DEM simulations to inform the modelling of the particle–wall shear stress.

3.1. Continuum modelling

To represent a dispersed phase as a continuous medium, one may consider that the motion of the particles is analogous to the motion of the particles in a gas. Namely, continuum equations and constitutive relationships relevant for an Eulerian modelling of the particles may be derived following the approach used in formal kinetic theory (Chapman & Cowling Reference Chapman and Cowling1990), that is, from the transport equation of the particle probability density in phase space (Buyevich & Shchelchkova Reference Buyevich and Shchelchkova1979; Morioka & Nakajima Reference Morioka and Nakajima1987; Reeks Reference Reeks1991; Simonin Reference Simonin2000; Zaichik, Oesterlé & Alipchenkov Reference Zaichik, Oesterlé and Alipchenkov2004), which is a Boltzmann-type equation that accounts for the interaction with the gaseous phase, external forces and particle–particle collisions. In this work, the one-particle phase-space density is denoted $f_p(\boldsymbol {v}, \boldsymbol {x} ; t)$ and defined such that $f_p(\boldsymbol {v}, \boldsymbol {x} ; t) \,{{\rm d}\boldsymbol {v}} \,{{\rm d} \kern0.7pt \boldsymbol {x}}$ is the expected number of particles whose centre is within a range ${{\rm d} \kern0.7pt \boldsymbol {x}}$ of location $\boldsymbol {x}$, and within a range ${{\rm d}\boldsymbol {v}}$ of velocity $\boldsymbol {v}$. Since the particles have a large inertia, we can neglect the effect of the fluid turbulence on the particle motion. For any particle-valued variable $\varphi$, the expected value of $\varphi$ at time $t$ may be expressed as

(3.1)\begin{equation} \langle\varphi\rangle(\boldsymbol{x}, t) = \frac{1}{n_p(\boldsymbol{x}, t)} \int_{-\infty}^{+\infty} \varphi(\boldsymbol{v}, \boldsymbol{x} ; t)\,f_{p}(\boldsymbol{v}, \boldsymbol{x} ; t) \,{{\rm d}\boldsymbol{v}}, \end{equation}

where $n_p(\boldsymbol {x}, t) = \int _{-\infty }^{+\infty } f_p(\boldsymbol {v}, \boldsymbol {x} ; t) \,{{\rm d}\boldsymbol {v}}$ is the number of particle centres per unit volume. The expectation $\langle \cdot \rangle$ is conditioned implicitly on a given realisation of the gaseous phase, and corresponds to an ensemble average over a distribution of particulate-phase realisations (Février, Simonin & Squires Reference Février, Simonin and Squires2005). Conservation equations associated with the particle velocity moments may be derived. Within a particulate medium, up to but excluding wall boundaries, the transport equations of the mean particle density $n_p$, particle velocity $\langle \boldsymbol {u}_p\rangle$ and particle velocity covariance $\boldsymbol{\mathsf{R}}_{\boldsymbol {p}} = \langle \boldsymbol {u}'' \otimes \boldsymbol {u}'' \rangle$ may be expressed as

(3.2)\begin{align} \partial_t (n_p m_p) + \boldsymbol{\nabla} \boldsymbol{\cdot} (n_p m_p \langle\boldsymbol{u}_{p}\rangle) & = 0, \end{align}
(3.3) \begin{align} \partial_t (n_p m_p \langle\boldsymbol{u}_{p}\rangle) + \boldsymbol{\nabla} \boldsymbol{\cdot} (n_p m_p \langle\boldsymbol{u}_{p}\rangle \otimes \langle\boldsymbol{u}_{p}\rangle) & =- \boldsymbol{\nabla}\boldsymbol{\cdot} (n_p m_p \boldsymbol{\mathsf{R}}_{\boldsymbol{p}}) + n_p \,\boldsymbol{f}_{\!p} \nonumber\\ & \quad + n_p \left\langle\,\boldsymbol{f}_{\!g \rightarrow p}\right\rangle + n_p m_p \boldsymbol{g},\end{align}
(3.4) \begin{align}\partial_t (n_p m_p \boldsymbol{\mathsf{R}}_{\boldsymbol{p}}) + \boldsymbol{\nabla}\boldsymbol{\cdot} ( n_p m_p \boldsymbol{\mathsf{R}}_{\boldsymbol{p}} \otimes \langle\boldsymbol{u}_{p}\rangle) & = {}- \boldsymbol{\nabla} \boldsymbol{\cdot} (n_p m_p \boldsymbol{\mathsf{T}}_{\boldsymbol{p}}) \nonumber\\ & \quad - n_p m_p \boldsymbol{\mathsf{R}}_{\boldsymbol{p}} \boldsymbol{\cdot} \boldsymbol{\nabla} \langle\boldsymbol{u}_{p}\rangle + n_p m_p\,\boldsymbol{\nabla} \langle\boldsymbol{u}_{p}\rangle \boldsymbol{\cdot} \boldsymbol{\mathsf{R}}_{\boldsymbol{p}}\nonumber\\ & \quad + n_p \left\langle\,\boldsymbol{f}_{\!p} \otimes \boldsymbol{u}_{p}''\right\rangle + n_p \left\langle\boldsymbol{u}_{p}'' \otimes \boldsymbol{f}_{\!p}\right\rangle\nonumber\\ & \quad + n_p \left\langle\,\boldsymbol{f}_{\!g \rightarrow p} \otimes \boldsymbol{u}_{p}''\right\rangle + n_p \left\langle\boldsymbol{u}_{p}''\otimes \boldsymbol{f}_{\!g \rightarrow p} \right\rangle, \end{align}

where $\boldsymbol {u}_{p}'' = \boldsymbol {u}_{p} - \langle \boldsymbol {u}_{p}\rangle$ is the particle velocity fluctuation, $\boldsymbol{\mathsf{T}}_{\boldsymbol {p}} = \langle \boldsymbol {u}_{p}'' \otimes \boldsymbol {u}_{p}'' \otimes \boldsymbol {u}_{p}''\rangle$ is the third-order particle velocity covariance, $n_p \boldsymbol {f}_{\!g \rightarrow p}$ is the total force per unit volume exerted by the gas, and $n_p \boldsymbol {f}_{\!p}$ is the total force per unit volume due to contacts with other particles.

For convenience, the particle–particle contact force $\boldsymbol {f}_{\!p}$ is expressed formally as the divergence of a particle–particle contact-stress tensor ${\boldsymbol {\varSigma }^{cnt}_{\boldsymbol {p}}}$. This lets us rewrite (3.3) as

(3.5) \begin{align} \partial_t (n_p m_p \langle\boldsymbol{u}_{p}\rangle) + \boldsymbol{\nabla} \boldsymbol{\cdot} (n_p m_p \langle\boldsymbol{u}_{p}\rangle \otimes \langle\boldsymbol{u}_{p}\rangle) & =- \boldsymbol{\nabla}\boldsymbol{\cdot} ((\boldsymbol{\varSigma}^{kin}_{\boldsymbol{p}})^{\rm T} + (\boldsymbol{\varSigma}^{cnt}_{\boldsymbol{p}})^{\rm T})\nonumber\\ & \quad + n_p \left\langle\,\boldsymbol{f}_{\!g \rightarrow p}\right\rangle + n_p m_p \boldsymbol{g}, \end{align}

where $\boldsymbol {\varSigma }^{kin}_{\boldsymbol {p}} = n_p m_p \boldsymbol{\mathsf{R}}_{\boldsymbol {p}}$ is by definition the kinetic stress of the particles. We thereby identify two classes of stresses within the particulate medium, as represented schematically in figure 2(a). The kinetic stress represents the transport of momentum by the translational motion of the particles across a given surface, due to the particle agitation. The contact stress represents the transfer of momentum due to contacts with other particles. In a dense fluidised bed, the stress associated with particle contacts can be expressed formally as the sum of contributions from two modes of contact: short-duration collisions and enduring contacts. Short-duration collisions are the dominant mode of contact in moderately dense beds. In a moderately dense bed, they can be treated as instantaneous collisions and are generally modelled following the KTGF. Enduring contacts are the dominant mode of contact in densely packed beds. In densely packed beds, they can be treated as semi-permanent frictional contacts and are generally modelled using empirical constitutive relationships. In the following, the stress that results from short-duration collisions is referred to as the collisional stress and denoted $\boldsymbol {\varSigma }^{col}_{\boldsymbol {p}}$, and the stress that results from enduring contacts is referred to as the frictional stress and denoted $\boldsymbol {\varSigma }^{fr}_{\boldsymbol {p}}$, such that

(3.6)\begin{equation} \boldsymbol{\varSigma}^{cnt}_{\boldsymbol{p}} = \boldsymbol{\varSigma}^{col}_{\boldsymbol{p}} + \boldsymbol{\varSigma}^{fr}_{\boldsymbol{p}}. \end{equation}

In practice, only the contact stress $\boldsymbol {\varSigma }^{cnt}_{\boldsymbol {p}}$ can be measured in the CFD-DEM simulation, and not the separate contributions $\boldsymbol {\varSigma }^{col}_{\boldsymbol {p}}$ and $\boldsymbol {\varSigma }^{fr}_{\boldsymbol {p}}$. Indeed, $\boldsymbol {\varSigma }^{cnt}_{\boldsymbol {p}}$ corresponds to the contact force per unit area between particles lying on the opposite side of a surface. The computation of the stresses in the CFD-DEM simulation is detailed in (A.2) and (A.3). The collisional and frictional contributions $\boldsymbol {\varSigma }^{col}_{\boldsymbol {p}}$ and $\boldsymbol {\varSigma }^{fr}_{\boldsymbol {p}}$ stem from an abstract decomposition in the TFM, and we are not currently able to use an objective criterion to identify the contacts that should be viewed as collisional or frictional in a CFD-DEM simulation.

Figure 2. Schematic representation of the different classes of (a) particle momentum fluxes across a surface $A_{bulk}$ in direction $n$ at a distance $x_{n,bulk} = d_p/2 + \Delta n$ from the wall surface, and (b) momentum flux exchanges between the particles and the wall. The contact flux is the sum of the collisional flux and the frictional flux.

An analogous classification of the stresses may be established on the wall boundaries, as represented schematically in figure 2(b). The particles in contact with a wall may undergo short-duration collisions and enduring contacts with the wall. The stress vector exerted by an element of wall surface of normal $\boldsymbol {n}$ on the particles, denoted $\boldsymbol {\sigma }^{tot}_{w}$, can thus be expressed formally as the sum of contributions from the two possible modes of contact:

(3.7)\begin{equation} \boldsymbol{\sigma}^{tot}_{w} = \boldsymbol{\sigma}^{col}_{w} + \boldsymbol{\sigma}^{fr}_{w}, \end{equation}

with $\boldsymbol {\sigma }^{col}_{w}$ the collisional particle–wall stress and $\boldsymbol {\sigma }^{fr}_{w}$ the frictional particle–wall stress. There is no kinetic contribution to the particle–wall stress. Indeed, a non-zero kinetic particle–wall stress would imply that some particles leave the domain, i.e. either pass through the wall or deposit onto the wall.

3.2. Continuity of the stress at the wall

Let us consider particulate stress in the vicinity of the location $\boldsymbol {x}_w$ on the wall surface. The unit vector $\boldsymbol {n}$ is normal to the wall at this location, and the unit vector $\boldsymbol {t}$ is parallel to the wall surface and aligned with the tangential velocity of the particles above the wall, $\boldsymbol {t} = \langle u_{p,t}\rangle /\| \langle u_{p,t}\rangle \|$, with $\langle u_{p,t}\rangle = \langle \boldsymbol {u}_{p}\rangle - \langle \boldsymbol {u}_{p,n}\rangle \boldsymbol {n}$ and $\langle \boldsymbol {u}_{p,n}\rangle = \langle \boldsymbol {u}_{p}\rangle \boldsymbol {\cdot } \boldsymbol {n}$. The transverse unit vector $\boldsymbol {s}$ is taken such that $\{\boldsymbol {t}, \boldsymbol {n}, \boldsymbol {s}\}$ is a local orthonormal basis. Assuming hard-sphere collisions, no particle centres are found below $\check {r}_w = 1/2$ at the location $\boldsymbol {x}_{wb} = \boldsymbol {x}_w + (d_p/2)\boldsymbol {n}$. By construction, the stress vector (i.e. the traction) associated with a wall-parallel plane within the particulate medium, $\boldsymbol {\sigma }^{tot}_{p,n} = (\boldsymbol {\varSigma }^{tot}_{\boldsymbol {p}}(\boldsymbol {x}, t))^{\rm T} \boldsymbol {\cdot } \boldsymbol {n}$, tends to the particle–wall stress when approaching the wall boundary. Hence we have

(3.8)\begin{equation} \boldsymbol{\sigma}^{tot}_{w}(\boldsymbol{x}_{wb}, t) = \lim_{\varepsilon \rightarrow 0^+} \boldsymbol{\sigma}^{tot}_{p,n}(\boldsymbol{x}_{wb} + \varepsilon \boldsymbol{n}, t). \end{equation}

For simplicity, we use the notation $\varphi (\boldsymbol {x}_{wb})$ to denote for any field $\varphi$ the limit $\displaystyle \lim _{\varepsilon \rightarrow 0^+} \varphi (\boldsymbol {x}_{wb} + \varepsilon \boldsymbol {n})$. This leads to no confusion since particle fields are not defined at the location $\boldsymbol {x}_{wb}$. We may thereby express as

(3.9)\begin{equation} \boldsymbol{\sigma}^{tot}_{w}(\boldsymbol{x}_{wb}, t) = \boldsymbol{\sigma}^{tot}_{p,n}(\boldsymbol{x}_{wb}, t) = \boldsymbol{\sigma}^{kin}_{p,n}(\boldsymbol{x}_{wb}, t) + \boldsymbol{\sigma}^{cnt}_{p,n}(\boldsymbol{x}_{wb}, t) \end{equation}

the correspondence between the classes of stress within the particulate medium and at the wall. Note that the vector $\boldsymbol {\sigma }^{cnt}_{p,n}$ corresponds to the stress associated with particle–particle contacts, which includes in general both a collisional contribution and a frictional contribution, but includes a frictional contribution only at the location $x_{wb}$ due to the closeness of the wall. Equation (3.9) can be simplified in the limit case of a moderately dense bed or a densely packed bed. Indeed, the particles in contact with a wall are unlikely to simultaneously be in contact with a particle in moderately dense beds, such that (3.9) simplifies to $\boldsymbol {\sigma }^{col}_{w}(\boldsymbol {x}_{wb}, t) = \boldsymbol {\sigma }^{kin}_{p,n}(\boldsymbol {x}_{wb}, t)$, which expresses the collisional stress at the wall based on the kinetic particle stress within the particulate medium. Conversely, the particle velocity covariance can be neglected in densely packed beds, such that (3.9) simplifies to $\boldsymbol {\sigma }^{fr}_{w}(\boldsymbol {x}_{wb}, t) = \boldsymbol {\sigma }^{fr}_{p,n}(\boldsymbol {x}_{wb}, t)$, which expresses the frictional stress at the wall based on the frictional stress within the medium.

It should be noted that the continuity of the stress at the wall applies to only the total stress, as the relative contributions of the kinetic, collisional or frictional stress vary dramatically near the contact point. The near-wall variations of the particle stresses are measured in the CFD-DEM simulations on a series of octacontagonal surfaces at a varying distance $d_p \check {r}_{w,bulk}$ of the lateral wall (A.4). Numerically, we find that the particle–wall normal stress $\sigma ^{tot}_{w,n}$ is close to the total normal particle stress close to the wall (figure 3), which corroborates the continuity of the stress at the wall. However, the kinetic particle stress increases rapidly as the distance to the wall tends to $d_p/2$, while the contact particle stress drops to a small value. At the limit, the kinetic contribution is predominant because most particle–wall contacts are collisional short-duration contacts. Indeed, the contact particle stress at the wall is by construction related to the number of particles infinitesimally close to the wall, which is zero if there are no frictional contacts, as this implies a finite wall particle density. The normal contact particle stress $\boldsymbol {\varSigma }^{cnt}_{p,nn}(\boldsymbol {x}_{wb}, t) = \boldsymbol {n} \boldsymbol {\cdot } \boldsymbol {\sigma }^{cnt}_{p,n}(\boldsymbol {x}_{wb}, t)$ at the height $\check {r}_w = 1/2$ is thus related to the presence of frictional contacts. In the CFD-DEM simulations F3 and F4, that contribution does not exceed 15 % of the wall-normal particle–wall stress at any height of the bed, indicating that enduring contacts are only a small proportion of the contacts. This is confirmed by the direct measurements of the particle–wall contact duration in the CFD-DEM simulation. The contribution of contacts of varying durations to the mean particle–wall stress according to the CFD-DEM simulations is provided in figure 4. Given that the duration of the contacts $T_c$ depends on the spring constant, which is non-physical in CFD-DEM, the figure should be regarded with some care and used for a qualitative assessment rather than a precise reading of the values. It may be seen that the stress increases with elevation from the bottom of the bed, because the particle concentration reaches a maximum in the upper part of the bed. In case F3, more than 90 % of the mean particle–wall stress is due to contacts that are less than three CFD-DEM collision times $T_c$ in duration. Enduring contacts are more important in case F4 due to the larger solid volume fraction and lower particle velocity of that case. Nevertheless, contacts less than seven CFD-DEM collision times $T_c$ account for more than 80 % of the mean particle–wall stress throughout the bed height (figure 4). This suggests that, from a modelling point of view, the collisional contribution to the particle–wall stress is dominant in the two CFD-DEM simulations.

Figure 3. Radial profile very close to the wall in the cases (a) F3 and (b) F4 of the total normal particle stress $\boldsymbol {\varSigma }^{cnt}_{p,nn}$, normal kinetic particle stress $\boldsymbol {\varSigma }^{kin}_{p,nn}$ and normal contact particle stress $\boldsymbol {\varSigma }^{cnt}_{p,nn}$. The filled square symbol at $\check {r}_{w} = 1/2$ indicates the corresponding particle–wall normal stress $\sigma ^{tot}_{w,n}$. (a) Upper part of the bed, $z/R = 3.45$. (b) Bottom of the bed, $z/R = 0.05$.

Figure 4. Vertical profiles in case F4 of the mean particle–wall normal stress $\sigma ^{tot}_{w,r}$ associated with particle–wall contacts that are shorter than a duration. The durations are given in units of the CFD-DEM collision time $T_c$ (see (2.1)), which corresponds to the duration of a short-duration collision between two particles in the CFD-DEM simulation.

The increase in the kinetic normal particle stress $\boldsymbol {\varSigma }^{kin}_{p,nn} = n_p m_p R_{p,nn}$ near the particle–wall contact point can also be explained by a large increase in the particle-centre density near a distance $d_p/2$ from the wall (see figure 6). Indeed, the wall surface has a large influence on the particle statistics, which is related to the quasi-two-dimensional arrangement of the particles in the vicinity of the wall. Section 3.3 describes this effect based on the numerical results of the CFD-DEM simulations, and discusses the prospect of taking into account these wall-specific effects in a TFM simulation and the implications for the modelling of the particle–wall shear stress.

3.3. Near-wall arrangement of the particles

In the vicinity of the container walls, the particle distribution and dynamics are constrained by the wall surface, and therefore display behaviour different to that in the internal region. This subsection analyses these effects for a dense fluidised bed in the bubbling regime, using the CFD-DEM simulations presented in § 2.

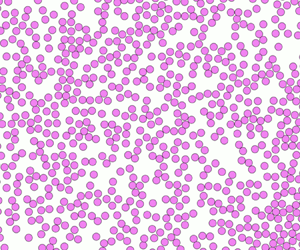
Figures 5(a,c) provide a visualisation of the particle arrangement near the wall in the simulation F3. The particles close to cylindrical walls tend to form particle assemblies with a two-dimensional hexagonal arrangement. These assemblies may be observed for each time step on a significant portion of the wall surface, but are local and transient. Indeed, following the passage of a bubble (figure 5c), the flow is locally more dilute and the arrangement of the particles is broken for a brief duration. The influence of the hexagonal arrangement of the particles lingers for a few layers away from the wall. However, as we move farther away from the wall, the influence of the wall diminishes, and the two-dimensional arrangement of the particles is much less orderly, because the particles are no longer constrained by the wall surface. Thus the arrangement of the particles near the wall differs from the arrangement of the particles in the internal region.

Figure 5. Close-up views in case F3 of (a,c) the first layer of particles near the wall ($0< z_r<1$), namely the particles whose centre is located within $z_r = (R_c-r_p)/d_p = 1$ particle diameter of the wall, and (b,d) a thin layer of particles away from the wall ($10< z_r<11$), namely the particles whose centre is $z_r = 10$$11$ particle diameters away from the wall. (a,b) Instant A: Typical arrangement of the particles ($\alpha _p = 0.59$). (c,d) Instant B: Arrangement of the particles following the passage of a bubble ($\alpha _p = 0.26$).

The structural properties of the near-wall region are consistent with the structural properties of the near-wall region in a fixed randomly packed bed of spheres, which have been described both experimentally and numerically by various authors (Rocke Reference Rocke1971; Tingate Reference Tingate1973; Mueller Reference Mueller1997; Abreu et al. Reference Abreu, Macias-Salinas, Tavares and Castier1999; Zhang et al. Reference Zhang, Thompson, Reed and Beenken2006; Wensrich Reference Wensrich2012; Burtseva et al. Reference Burtseva, Valdez, Werner and Petranovskii2015; von Seckendorff & Hinrichsen Reference von Seckendorff and Hinrichsen2021). The effect of the wall can be characterised by the radial distribution function, as detailed in the supplementary material available at https://doi.org/10.1017/jfm.2024.36. The influence of the wall on the particle distribution can also be characterised by the near-wall radial evolution of the solid volume fraction. Figure 6(a) examines, in case F3, the radial variation of the particle-centre density near the wall for a series of nested octacontagonal shells of thickness $d_p/100$, and figure 6(b) examines the resulting solid volume fraction within each octacontagonal shell (see (A.4)). Due to the wall, the density of particle centres is not uniform. The particles are more likely to be located near specific layers, which after the first period are equally spaced, and less likely to be located in between. Accordingly, there are large oscillations in the solid volume fraction near the wall. Both the oscillations of particle-centre density and solid volume fraction become negligible at a distance $\check {r}_w = 6$ particle diameters away from the wall. Note that since the particle distribution is two-dimensional near the wall, the solid volume fraction on the first oscillation, which exceeds 0.74 in the CFD-DEM, should be compared to that of a circle packing. The period of the oscillations is approximately $0.87 d_p$. This value is consistent with the oscillation period measured experimentally in a fixed randomly packed bed (von Seckendorff & Hinrichsen Reference von Seckendorff and Hinrichsen2021). Figure 6(b) provides a comparison of the CFD-DEM solid volume fraction with the fixed-bed correlation of Mueller (Reference Mueller1992), which can be expressed in the present case as

(3.10)\begin{equation} \alpha_p (\check{r}_w) = \alpha_{inf}\left(1 - {\rm J}_0((7.45 - 11.25/\lambda) \check{r}_w) \exp(-(0.315 - 0.725/\lambda) \check{r}_w)\right)\!, \end{equation}

where ${\rm J}_0$ is the zeroth-order Bessel function of the first kind, $\check {r}_w = (R_c-r)/d_p$ is the normalised distance to the wall, and $\lambda = 2R/d_p = 176$ is the cylinder to particle diameter ratio. Note that we do not use the correlation of Mueller (Reference Mueller1992) to set the bulk solid volume fraction $\alpha _{inf}$, but in place use the CFD-DEM value. The correlation predicts the CFD-DEM oscillations quite well very near to the wall, but underestimates the decrease in the oscillation amplitude away from the wall, compared to the CFD-DEM simulation.

Figure 6. Radial profile at the height $z/R_c=3.45$ in terms of the normalised distance to the wall $\check {r}_w = (R_c - r)/d_p$, in case F3, of (a) the number of particles per unit volume $n_p$ normalised by the mean bed solid fraction, for a series of nested octacontagonal shells of thickness $d_p/100$, and (b) the resulting solid volume fraction $\alpha _p$ within each octacontagonal shell. The solid volume fraction predicted by the correlation of Mueller (Reference Mueller1992) is given for reference.

The dynamics of the particles is also influenced by the wall. For instance, the mean wall-normal particle velocity is oscillating following the variations of particle density near the wall. The mean radial motion of the particles tends to be small within the layers where a large density of particles is found, and larger in the regions in between, where few particles are found (figure 7a). The mean vertical velocity of the particles exhibits similar oscillations. Namely, the fall of the particles in contact with the wall and in the layers where a large density of particles is found tends to be slow compared to the depleted regions. This can be explained by the fact that an orderly three-dimensional arrangement of the particles hinders motion and forbids the presence of particles in between layers. Similarly, the wall-normal particle velocity variance $R_{nn}$ (figure 7b), the vertical particle velocity variance $R_{zz}$ (figure 7d) and the vertical-normal particle velocity covariance $R_{nz}$ (figure 7e) exhibit oscillations and are greater in the regions where few particles are found, since they are associated with a locally less orderly and more dilute flow. The large oscillations of the particle-centre density and of the particle velocity variance are of interested for the modelling of the particle–wall shear stress since they are involved directly in the expression for the kinetic particle stress.

Figure 7. Radial profile at the height $z/R_c=3.45$ in terms of the normalised distance to the wall $\check {r}_w = (R_c - r)/d_p$, in case F3, for a series of nested octacontagonal shells of thickness $d_p/500$ near the wall surface, of (a) the mean wall-normal velocity $\langle u_{p,n} \rangle$, (b) the total wall-normal velocity variance $R_{nn}$, (c) the mean vertical velocity $\langle u_{p,z} \rangle = \langle u_{p,t} \rangle$, (d) the total vertical velocity variance $R_{zz}$, and (e) the total vertical-normal velocity covariance $R_{nz}$ within each octacontagonal shell.

In view of these results, it is clear that the vicinity of the container walls is associated with a specific particle dynamics that is not found in the internal region. The prospect of reproducing this complex near-wall dynamics in a TFM simulation, where the particulate phase is represented as a continuous medium, represents a considerable challenge. First, this would be costly in terms of computational resources, as resolving the near-wall spatial variations in a TFM simulation would require a fine mesh, with a cell size much smaller than a particle diameter. Second, this would be demanding in terms of modelling, as specific source terms would need to be included in the momentum and kinetic energy equations to account for the modification of the particle phase-space density in the near-wall region. In that context, we consider that the Eulerian field of a TFM simulation should filter out these small-scale variations. The continuum equations cannot be resolved too close to the wall in a two-fluid simulation, because certain effects are not accounted for in current models. For instance, the ‘wall shelter effect’ identified by Sakiz & Simonin (Reference Sakiz and Simonin1998), and discussed further in Fede & Simonin (Reference Fede and Simonin2018), leads to the appearance of a mean effective force towards the wall, and causes a significant increase in the number of particle centres per unit volume $n_p$ for wall distances below $(3/2) d_p$. Therefore, in practice, the boundary-condition model for the particulate phase should seek to express the particle–wall shear stress in terms of flow variables that are relatively far from the wall, avoiding values near the particle–wall contact point. Let us consider a location $\boldsymbol {x}_{bulk}$ that is sufficiently far from the wall. A model for the particle–wall shear stress requires, in particular, the modelling of the kinetic particle stress at the location $\boldsymbol {x}_{wb}$. This entails providing a model for the particle-centre density $n_p(\boldsymbol {x}_{wb}, t)$ and the particle velocity covariance $\boldsymbol{\mathsf{R}}_{\boldsymbol {p}}$. For instance, this could be achieved by providing a model for the wall-amplification coefficient $\chi$, which we assume is a function of the solid volume fraction $\alpha _p(\boldsymbol {x}_{bulk})$, to relate $R_{p,nn}(\boldsymbol {x}_{wb}, t)$ to $R_{p,nn}(\boldsymbol {x}_{bulk}, t)$, i.e.

(3.11)\begin{equation} \chi(\alpha_p(\boldsymbol{x}_{bulk})) = \frac{n_p(\boldsymbol{x}_{wb}, t)\,m_p \langle v_p' v_p'\rangle(\boldsymbol{x}_{wb}, t)}{n_p(\boldsymbol{x}_{bulk}, t)\,m_p \langle v_p' v_p'\rangle(\boldsymbol{x}_{bulk}, t)}. \end{equation}

In addition, the modelling of the frictional term should be addressed. This would require dedicated models as no specific frictional model is available to account for the modification of the arrangement of the particles in contact with the wall due to the two-dimensional structure imposed by the wall. The present paper circumvents these modelling requirements by, instead, seeking a relationship between the particle–wall stress and the particle stress within the particulate medium.

3.4. Development of a TFM boundary condition

This subsection uses the momentum balance (3.5) and the results of the CFD-DEM simulation data to develop a TFM model for the particle–wall shear stress. The particle–wall shear stress is the component of the stress parallel to the wall surface. For simplicity, we assume that the particle–wall shear stress vector is aligned with the tangential velocity of the particles at a distance $d_p/2$ from the wall, that is, that the particle–wall stress can be decomposed formally as

(3.12)\begin{equation} \boldsymbol{\sigma}^{tot}_{w}(\boldsymbol{x}_{wb}, t) = \sigma^{tot}_{w,n}(\boldsymbol{x}_{wb}, t)\,\boldsymbol{n} + \sigma^{tot}_{w,t}(\boldsymbol{x}_{wb}, t)\,\boldsymbol{t}, \end{equation}

with $\sigma ^{tot}_{w,t}$ the particle–wall shear stress. This assumption is verified exactly in the purely collisional regime. Indeed, the wall-parallel kinetic particle stress close to the wall, $n_p(\boldsymbol {x}_{wb}, t)\,m_p (\boldsymbol{\mathsf{R}}_{\boldsymbol {p}}(\boldsymbol {x}_{wb}, t) \boldsymbol {\cdot } \boldsymbol {n} - R_{p,nn}(\boldsymbol {x}_{wb}, t)\,\boldsymbol {n})$, is aligned theoretically with the tangential velocity $\langle \boldsymbol {u}_{p,t}\rangle$. If there are enduring contacts, then the alignment of the tangential force exerted by a single particle onto the wall and its tangential velocity is verified for each particle time step in the CFD-DEM simulation. However, assumption (3.12) is verified only if the correlation between the normal force exerted by the wall and the orientation of the instantaneous tangential particle velocity is not strong. Figure 8 confirms that the alignment between the particle–wall shear stress and the cell-averaged tangential particle velocity is generally high in the CFD-DEM simulation.

Figure 8. Relationship between the orientation of the particle–wall shear stress and the cell-averaged tangential particle velocity for various instants and locations along the lateral wall surface, where the orientation is defined as the angle between a vector and the unit vector $\boldsymbol {e}_\theta$. The red line is the identity. Due to the symmetry of the angle space, the clusters of points at the bottom left, bottom right, top left and top right of the figure are all close to each other and to the origin.

A useful relationship for modelling the particle–wall shear stress can be derived from the balance of momentum (3.5) in the vicinity of a wall, in the frame of a quasi-parallel equilibrium boundary layer assumption. By integrating (3.5) over a control volume extending in the wall-normal direction from the near-wall location $\varphi (\boldsymbol {x}_{wb} + \varepsilon \boldsymbol {n})$ to the location $\boldsymbol {x}_{bulk} = \boldsymbol {x}_{wb} + (\Delta n)\boldsymbol {n}$, and infinitesimally small in the two tangential directions $\boldsymbol {t}$ and $\boldsymbol {s}$, we obtain in the limit of an infinitesimally small $\varepsilon$:

(3.13) \begin{align} \boldsymbol{\sigma}^{tot}_{w}(\boldsymbol{x}_{wb}, t) &= \boldsymbol{\sigma}^{kin}_{p,n}(\boldsymbol{x}_{bulk}, t) + \boldsymbol{\sigma}^{cnt}_{p,n}(\boldsymbol{x}_{bulk}, t) + n_p(\boldsymbol{x}_{bulk}, t)\,m_p (\langle\boldsymbol{u}_{p}\rangle \otimes \langle\boldsymbol{u}_{p}\rangle)(\boldsymbol{x}_{bulk}, t) \boldsymbol{\cdot} \boldsymbol{n}\nonumber\\ &\quad + \int_{d_p/2}^{d_p/2+\Delta n} \left( \partial_{t} (n_p m_p \langle\boldsymbol{u}_{p}\rangle) - n_p \left\langle\,\boldsymbol{f}_{\!g \rightarrow p}\right\rangle - n_p m_p \boldsymbol{g} \right) {{\rm d}\kern0.7ptx_n}\nonumber\\ &\quad + \int_{d_p/2}^{d_p/2+\Delta n} \frac{\partial{}}{\partial{x_t}} \left(n_p m_p \left(\langle\boldsymbol{u}_{p}\rangle \otimes \langle\boldsymbol{u}_{p}\rangle\right) + \boldsymbol{\varSigma}^{kin}_{\boldsymbol{p}} + \boldsymbol{\varSigma}^{cnt}_{\boldsymbol{p}}\right) \boldsymbol{\cdot} \boldsymbol{t} \,{{\rm d}\kern0.7pt x_n}\nonumber\\ &\quad + \int_{d_p/2}^{d_p/2+\Delta n} \frac{\partial{}}{\partial{x_s}} \left(n_p m_p \left(\langle\boldsymbol{u}_{p}\rangle \otimes \langle\boldsymbol{u}_{p}\rangle\right) + \boldsymbol{\varSigma}^{kin}_{\boldsymbol{p}} + \left(\boldsymbol{\varSigma}^{cnt}_{\boldsymbol{p}}\right)^{\rm T}\right) \boldsymbol{\cdot} \boldsymbol{s} \,{{\rm d}\kern0.7pt x_n}, \end{align}

where $x_n = (\boldsymbol {x} - \boldsymbol {x}_w) \boldsymbol {\cdot } \boldsymbol {n}$ denotes the wall-normal coordinate. The momentum balance can be simplified in the wall-normal direction. Indeed, assuming that the point $\boldsymbol {x}_{bulk} = \boldsymbol {x}_{wb} + (\Delta n)\boldsymbol {n}$ is not too far from the wall, the mean wall-normal particle velocity, the mean wall-normal gas velocity and the mean gas wall-normal pressure gradient can be assumed to be close to zero. This suggests that the contribution of the interaction with the gas ($\boldsymbol {f}_{\!g \rightarrow p}$) in (3.13) is negligible in the wall-normal direction. Assuming in addition a vertical wall, such that the contribution of gravity is zero in the wall-normal direction, allows us to neglect all the integral terms in (3.13). Hence the wall-normal particle stress balance reads

(3.14)\begin{equation} \sigma^{tot}_{w,n}(\boldsymbol{x}_{wb}, t) = \boldsymbol{\varSigma}^{tot}_{p,nn}(\boldsymbol{x}_{wb}, t) \approx \boldsymbol{\varSigma}^{kin}_{p,nn}(\boldsymbol{x}_{bulk}, t) + \boldsymbol{\varSigma}^{cnt}_{p,nn}(\boldsymbol{x}_{bulk}, t). \end{equation}

The wall-normal profiles of the particle stress balance, provided in figure 9, demonstrate that the total normal particle stress $\boldsymbol {\varSigma }^{tot}_{p,nn} = \boldsymbol {\varSigma }^{kin}_{p,nn} + \boldsymbol {\varSigma }^{cnt}_{p,nn}$ remains approximately constant and equal to the wall-normal particle–wall stress close to the wall. This validates the assumptions leading to (3.14) for the lateral wall of the CFD-DEM simulations. For every height in the CFD-DEM simulation, the contribution of the contact forces to the total particle stress dominates the kinetic contribution, except in the vicinity of $\check {r}_w = 1/2$. Near-wall oscillations of the normal kinetic particle stress and the normal contact particle stress may be observed (figure 9), following the oscillations of the particle-centre density and of the particle velocity variance described in § 3.3. However, these oscillations are relatively small in amplitude, and cancel out in the profile of the total normal particle stress.

Figure 9. Radial profile in case F3 of the total normal particle stress $\boldsymbol {\varSigma }^{cnt}_{p,nn}$, normal kinetic particle stress $\boldsymbol {\varSigma }^{kin}_{p,nn}$ and normal contact particle stress $\boldsymbol {\varSigma }^{cnt}_{p,nn}$. The filled square symbol at $\check {r}_{w} = 1/2$ indicates the corresponding particle–wall normal stress $\sigma ^{tot}_{w,n}$. (a) Upper part of the bed, $z/R = 3.45$. (b) Bottom of the bed, $z/R = 0.05$.

In the tangential direction, these approximations cannot be made, since the mean tangential velocity can be large at the wall. Thus the drag force exerted by the gas and the effect of the gas pressure gradient are not necessarily negligible. Furthermore, the weight of the solid in the control volume should be taken into account in the case of a vertical wall. However, the particle–wall shear stress can be related to the particle–wall normal stress using the coefficient of sliding friction of the particle–wall contacts:

(3.15)\begin{equation} \sigma^{tot}_{w,t}(\boldsymbol{x}_{wb}, t) = \mu_w\, \sigma^{tot}_{w,n}(\boldsymbol{x}_{wb}, t) = \mu_w\, \boldsymbol{\varSigma}^{tot}_{p,nn}(\boldsymbol{x}_{bulk}, t). \end{equation}

This expression will form the basis of the two-fluid modelling. For Coulombian contacts, the relationship (3.15) holds exactly for a single particle for each particle time step of the CFD-DEM simulation. In the general case, the relationship is valid if the orientations of the different particle–wall contacts are perfectly correlated with one another. This is examined in figure 10 based on the CFD-DEM data. A linear best fit of the CFD-DEM data gives $\sigma ^{tot}_{w,t}(\boldsymbol {x}_{wb}, t) = 0.268\, \sigma ^{tot}_{w,n}(\boldsymbol {x}_{wb}, t)$, with a slope 11 % smaller than the friction coefficient $\mu _w$. However, the distribution of the slope is skewed negatively, which suggests that a proportionality coefficient close to $\mu _w$ is preferable, as proposed in (3.15).

Figure 10. Relationship between the particle–wall shear stress and particle–wall normal stress for various instants and locations along the lateral wall surface. The red line is the 0.3 slope corresponding to the coefficient of sliding friction of the CFD-DEM simulation. The green line is the linear best fit, of slope 0.268.

In order to develop a model for the wall-normal particle–particle contact stress in (3.15), it is useful to first assume that the diagonal part of the particle–particle contact-stress tensor is distributed isotropically, that is, to make the approximation

(3.16)\begin{equation} \boldsymbol{\varSigma}^{tot}_{p,nn}(\boldsymbol{x}_{bulk}, t) = P_{p}^{tot} (\boldsymbol{x}_{bulk}, t), \end{equation}

with $P_{p}^{tot} = (1/3) \operatorname {tr}(\boldsymbol {\varSigma }^{tot}_{\boldsymbol {p}})$ the total granular pressure. This is a non-trivial approximation and could not be argued to be valid generally in all gas–solid fluidised beds. For the configurations F3 and F4, the diagonal particle–particle contact stress is, according to the CFD-DEM data, frequently close to isotropy, which supports the assumption of isotropy (figure 11). Furthermore, the two-fluid modelling paradigm used in the present work, which is based on a transport equation for the kinetic energy of particle agitation (§ 4.1), does not consider the anisotropy of the particle agitation and of the granular pressure. Using (3.16) and (3.15), a TFM for the particle–wall shear stress can be obtained by formulating a suitable model for the granular pressure. We use the same model as within the flow, since (3.16) expresses the particle–wall stress in terms of the granular pressure relatively far from the wall. Specifically, the granular pressure is decomposed formally into a kinetic pressure $P_{p}^{kin}$, a collisional pressure $P_{p}^{col}$, and a frictional pressure $P_{p}^{fr}$:

(3.17)\begin{equation} \boldsymbol{\sigma}^{tot}_{w}(\boldsymbol{x}_{wb}, t) = \left( P_{p}^{kin} (\boldsymbol{x}_{bulk}, t) + P_{p}^{col} (\boldsymbol{x}_{bulk}, t) + P_{p}^{fr} (\boldsymbol{x}_{bulk}, t) \right) \left( \boldsymbol{n} - \mu_w\, \frac{\boldsymbol{u}_{p,t}}{\| \boldsymbol{u}_{p,t} \|} \right)\!. \end{equation}

Using (3.17), the particle–wall stress is expressed in terms of the total granular pressure at some distance from the wall. The kinetic, collisional and frictional contribution in (3.17) are given functions of the solid volume fraction $\alpha _p$ and the kinetic energy of particle agitation $q_p^2$, and various models have been proposed in the literature to address these dependencies (Gu et al. Reference Gu, Ozel, Kolehmainen and Sundaresan2019; Si, Shi & Yu Reference Si, Shi and Yu2019). Note that the different contributions are related not to the mode of particle–wall contacts, but rather to the contacts within the flow. Thus each contribution should be included in general, regardless of the specific particle–wall interactions. Finally, it may be noted that although it has been developed in the context of a cylindrical column, the derivation of the present section has neglected the effect of curvature given that the diameter of the column is large compared to the diameter of a particle. The proposed model thus should also be applicable in the case of a flat wall.

Figure 11. Probability density associated with various distributions of the diagonal components of the particle–particle contact-stress tensor, characterised by the ratio of vertical–vertical ($zz$) component to pressure $\varSigma ^{cnt}_{p,zz} (\boldsymbol {x}_{bulk}, t)/P_{p} (\boldsymbol {x}_{bulk}, t)$ and the ratio of radial–radial ($rr$) component to pressure $\varSigma ^{cnt}_{p,rr} (\boldsymbol {x}_{bulk}, t)/P_{p} (\boldsymbol {x}_{bulk}, t)$, in the second cell off the wall in case F3. The dashed lines indicate that two of the diagonal components of the particle–particle contact-stress tensor are equal. Their intersection indicates isotropy.

The proposed model is related closely to several boundary-condition models from the literature. The model of Johnson & Jackson (Reference Johnson and Jackson1987), for a smooth flat wall, can be interpreted as a model that includes only the kinetic and frictional contributions to the particle–wall stress:

(3.18)\begin{equation} \boldsymbol{\sigma}^{tot}_{w}(\boldsymbol{x}_{wb}, t) = \left( P_{p}^{kin} (\boldsymbol{x}_{bulk}, t) + P_{p}^{fr} (\boldsymbol{x}_{bulk}, t) \right) \left( \boldsymbol{n} - \mu_w\,\frac{\boldsymbol{u}_{p,t}}{\| \boldsymbol{u}_{p,t} \|} \right)\!. \end{equation}

The collisional contribution has, however, been shown to be important in the present CFD-DEM simulations. The boundary-condition model of Jenkins (Reference Jenkins1992), in the all-sliding case, may be recast as

(3.19)\begin{equation} \boldsymbol{\sigma}^{tot}_{w}(\boldsymbol{x}_{wb}, t) = \left( \chi(\alpha_p(\boldsymbol{x}_{bulk}))\, P_{p}^{kin} (\boldsymbol{x}_{bulk}, t) \right) \left( \boldsymbol{n} - \mu_w\,\frac{\boldsymbol{u}_{p,t}}{\| \boldsymbol{u}_{p,t} \|} \right), \end{equation}

with $\chi (\alpha _p) = (1/2)\,g_0(\alpha _p)\,(1 + e_w)$, where $g_0$ denotes the radial distribution function, given by $g_0 = (1 - \alpha _p/\alpha _{p}^{max})^{-2.5 \alpha _{p}^{max}}$, with $\alpha _{p}^{max} = 0.64$ the close-packing limit (Lun & Savage Reference Lun and Savage1986). The same remark applies to the boundary-condition model of Schneiderbauer et al. (Reference Schneiderbauer, Schellander, Löderer and Pirker2012), which is based on a similar approach. By neglecting the frictional contribution in (3.17), the present boundary-condition model suggests $\chi (\alpha _p) = 1 + 2 \alpha _p\,g_0(\alpha _p)\,(1 + e_c)$. In the limit case of a dilute bed, the wall-amplification coefficient $\chi$ tends to $(1/2)(1+e_w)$ in the model of Jenkins (Reference Jenkins1992), whereas $\chi$ tends to 1 in the present model, which is consistent with a kinetic boundary-condition model (see (4.5) below). The present boundary-condition model tends to a kinetic boundary-condition model in the limit case of a dilute bed, and to a purely frictional model $\sigma ^{tot}_{w,t} = \mu _w P_p^{fr}$ in the limit of a densely packed bed. This thus provides a candidate general boundary condition that takes into account all modes of particle–wall contacts, whether collisional or frictional.

4. A posteriori tests

The particle–wall stress model is assessed a posteriori for the TFM simulation of the dense bubbling fluidised beds presented in § 2.1. This section presents the two-fluid governing equations and numerical method, discusses the modelling of frictional effects, and evaluates the performance of the particle–wall stress model.

4.1. Two-fluid modelling

The Eulerian two-fluid method used in the present paper relies on a hybrid modelling approach (Morioka & Nakajima Reference Morioka and Nakajima1987), in which the continuous-phase equations are derived by phase ensemble averaging and the dispersed-phase equations are derived by using the KTGF supplemented with models for fluid and turbulent effects for the dispersed phase. The system of equations is based on the approach of Simonin (Reference Simonin2000) and includes a transport equation for the kinetic energy of particle agitation $q_p^2$. A detailed description of the governing equations is found in Ansart et al. (Reference Ansart, García-Triñanes, Boissière, Benoit, Seville and Simonin2017). The same modelling assumptions as in the CFD-DEM simulations are used to compute the mean gas–particle relaxation time scale (Gobin et al. Reference Gobin, Neau, Simonin, Llinas, Reiling and Sélo2003). The particle–particle normal restitution coefficient is set to $e_c = 0.9$, to be consistent with the CFD-DEM simulations.

The TFM wall boundary condition (3.17) developed in § 3, and several boundary conditions from the literature, have been assessed. Generally, the wall boundary condition for the particles should provide a closure for the particle momentum and agitation kinetic energy fluxes at the wall, or more precisely, for the particles whose centres are at distance $d_p/2$ from the wall. To ensure that there is no solid mass flow across the boundary, the wall-normal particle velocity is set to zero at the walls. Thus only the tangential particle momentum flux requires modelling. In other words, providing a wall boundary condition for the particles entails providing a model for (1) the particle–wall shear stress $\sigma ^{tot}_{w,t} = \eta _p\, \partial _n u_{p,t}|_{wall}$ and (2) the agitation kinetic energy flux $Q_w = \alpha _p \rho _p K_p^{{kin\text -col}}\,\partial _n q_p^2|_{wall}$. The fluxes $\sigma ^{tot}_{w,t}$ and $Q_w$ depend on how the discrete particles interact with the wall and in particular may be functions of the elastic normal and tangential restitution coefficients, the wall friction coefficient (Jenkins Reference Jenkins1992; Schneiderbauer et al. Reference Schneiderbauer, Schellander, Löderer and Pirker2012) and the wall roughness (Hui et al. Reference Hui, Haff, Ungar and Jackson1984; Konan et al. Reference Konan, Simonin and Squires2006). Presently, ideally smooth particles and walls are considered, since there is no roughness in the reference CFD-DEM simulations that we aim to reproduce in a TFM setting.

All the boundary-condition models investigated assume that the particle agitation kinetic energy flux is negligible, $Q_w = 0$. We will therefore focus on the tangential momentum flux. The following models are considered.

(4.1)\begin{gather} \text{No-slip:} \quad U_{p,t}|_{wall} = 0. \end{gather}
(4.2)\begin{gather}\text{Kinetic:} \quad \sigma^{tot}_{w,t} = \mu_w P_{p}^{kin}. \end{gather}
(4.3)\begin{gather}\text{Kinetic-frictional:} \quad \sigma^{tot}_{w,t} = \mu_w \left(P_{p}^{kin} + P_{p}^{fr}\right). \end{gather}
(4.4)\begin{gather}\text{Total-pressure (present):} \quad \sigma^{tot}_{w,t} = \mu_w \left(P_{p}^{kin} + P_{p}^{col} + P_{p}^{fr}\right)\!. \end{gather}

To close the boundary-condition models, the following expressions may be used for the kinetic, collisional and frictional pressures (Ansart et al. Reference Ansart, García-Triñanes, Boissière, Benoit, Seville and Simonin2017; Bennani et al. Reference Bennani, Neau, Baudry, Laviéville, Fede and Simonin2017):

(4.5)\begin{gather} P_p^{kin} = \alpha_p \rho_p \left(\tfrac{2}{3} q_p^2\right)\!, \end{gather}
(4.6)\begin{gather}P_p^{col} = 2 \alpha_p^2 \rho_p g_0\left(1 + e_c\right) \left(\tfrac{2}{3} q_p^2\right)\!, \end{gather}
(4.7)\begin{gather}P_p^{fr} = Fr\,\frac{\left(\alpha_p - \alpha_{p}^{min}\right)^{n_{\!J}}}{\left(\alpha_{p}^{max} - \alpha_p\right)^{m_{\!J}}} \left[\alpha_p \geq \alpha_{p}^{min}\right]\!, \end{gather}

with $g_0 = (1 - \alpha _p/\alpha _{p}^{max})^{-2.5 \alpha _{p}^{max}}$ the radial distribution function. Following the model of Johnson et al. (Reference Johnson, Nott and Jackson1990), the frictional pressure law is a rational function that vanishes for a loose-packed bed and increases asymptotically in the limit of a close-packed bed. The proportionality constant $Fr=0.05$, the exponents $n_{\!J}=2$ and $m_{\!J}=5$, and the activation threshold $\alpha _{p}^{min}$ are empirical parameters. The values proposed originally in Johnson et al. (Reference Johnson, Nott and Jackson1990) are used for $n_{\!J}$ and $m_{\!J}$. The activation threshold $\alpha _{p}^{min}$ is set to 0.63. This high value is relevant for the particles being used, which are ideally spherical and frictionless.

Following Fede et al. (Reference Fede, Simonin and Ingram2016), the no-slip boundary condition assumes the maximum flux transferred by the particles towards the wall. The kinetic boundary condition is a suitable boundary condition in dilute beds, as investigated in Sakiz & Simonin (Reference Sakiz and Simonin1999). It assumes instantaneous fully sliding particle–wall contacts on a smooth flat surface, with a Coulomb sliding friction coefficient $\mu _w$. The kinetic-frictional boundary condition assumes that the particle–wall stress may be expressed as the sum of a kinetic-collisional contribution and a frictional contribution, modelled based on the frictional pressure within the first cell off the wall. It corresponds to the boundary condition of Johnson & Jackson (Reference Johnson and Jackson1987) in the particular case where the specularity coefficient is neglected. This assumption is well justified considering that ideally the particles are spherical and the walls are smooth in the CFD-DEM simulation. The present total-pressure boundary condition can be derived assuming, following the CFD-DEM analysis of § 3, that the particle–wall stress may be expressed based on the total granular pressure, which is due to kinetic, collisional and frictional contributions. It should be noted that the choice of the distance from the wall at which the granular pressure is taken is not critical in the model formulation, given that the total granular pressure is constant in the vicinity of the wall and that the TFMs do not represent the near-wall oscillations of the particle statistics observed in the CFD-DEM simulations (§ 3.3). The total granular pressure within the first computational cell off the wall is therefore used for the sake of simplicity. Due to the high value of the activation threshold $\alpha _{p}^{min}$, the frictional term in (4.4) is not large and can be neglected. The frictional contribution may, however, be dominant in other flow configurations, in particular if the particles are rough or non-spherical.

4.2. Results

This subsection compares the four boundary-condition models presented in § 4.1 for the TFM simulation of the three-dimensional pressurised gas–solid bubbling fluidised beds of § 2.1. The corresponding CFD-DEM simulation of the case will be used as a reference. In addition, the experimental measurements of Fede et al. (Reference Fede, Simonin and Ingram2016) by PEPT will be provided when available. The geometry and the properties of gaseous or particulate phases are identical to those of the CFD-DEM simulations (§ 2.1). The simulations are performed using an unstructured-mesh finite-volume method (Neau et al. Reference Neau, Pigou, Fede, Ansart, Baudry, Mérigoux, Laviéville, Fournier, Renon and Simonin2020), with a predictor–corrector scheme (Méchitoua et al. Reference Méchitoua, Boucker, Laviéville, Pigny and Serre2003). This is performed using the massively parallel code NEPTUNE_CFD. The mesh is an O-grid mesh that contains 4 million cells in total. Given the different requirements of CFD-DEM and TFM in terms of cell size, a finer mesh has to be used compared to the CFD-DEM mesh. The cell size in the vertical direction ($z$) is regular and equal to $\Delta z = 1.5 d_p$, whereas the typical cell size in the radial direction ($r$) is $\Delta r = 2.2 d_p$. The number of cells in the angular direction is $N_\theta = 280$ for the outer region. Cases F3 and F4 are considered. As in the CFD-DEM simulation, a no-slip boundary condition is used at the walls for the gaseous phase. Simulations are performed with the wall boundary conditions (4.1)–(4.4) for the particulate phase. In each case, the simulation is initialised with a bed of uniform porosity and with no particle velocity. The dynamics of the fluidised bed is established in the first seconds of the simulation, during a transitory phase. After 10 s, the bed is considered statistically stationary, and an averaging is performed over a duration of 70 s. Given the rotational symmetry of the geometry, the statistics are averaged in the angular direction.

Table 2 compares the mean bed solid fraction of the CFD-DEM and two-fluid simulations for cases F3 and F4. In both cases, the mean bed solid fraction is more accurately predicted with the no-slip and total-pressure boundary conditions than with the kinetic and kinetic-frictional boundary conditions, as these boundary conditions underestimate the expansion of the bed. The macroscopic behaviour of the bed also depends on the particle–wall boundary condition. In both cases F3 and F4, there is a large primary recirculation loop up until the top of the bed. In the recirculation loop, the rise of the bubbles in the centre of the column is associated with an upward movement of the particles, whereas the particles tend to descend near to the lateral walls. Following the coalescence of the bubbles, the velocities of the gas and the particles increase with the height in the column, and the particles are more densely concentrated close to the wall than in the centre of the column. This behaviour of the primary recirculation loop is reproduced qualitatively in all two-fluid simulations for both cases F3 and F4 (figure 12). In case F4, the velocity of the CFD-DEM simulation is low on the mean within an intermediate region located between heights $z/R_c = 2$ and $z/R_c = 3$. A similar behaviour is observed in the TFM simulations with the kinetic and kinetic-frictional boundary conditions, whereas this is not observed with the no-slip and total-pressure boundary conditions. The CFD-DEM simulation also predicts a secondary recirculation near the bottom of the bed in both cases F3 and F4. The secondary recirculation is not reproduced by the TFM simulation with the kinetic and kinetic-frictional boundary conditions, However, a secondary recirculation may be observed with the no-slip and total-pressure boundary conditions, in both cases F3 and F4. Figure 13 shows the effect of the particle–wall boundary condition on the vertical distribution of the solid volume fraction at the wall. With the no-slip boundary condition, the wall solid fraction within the bed tends to be underestimated compared to the CFD-DEM simulation. With the kinetic and kinetic-frictional boundary conditions, and to a lesser degree the total-pressure boundary condition, the wall solid fraction within the bed tends on the contrary to be overestimated. The wall solid fraction characterises the vertical expansion of the bed, as well as its radial homogeneity. Indeed, the bed is typically less dense near the centre of the column. The radial profile of the solid volume fraction is reproduced more accurately in the TFM with the no-slip or total-pressure boundary conditions than with the kinetic and kinetic-frictional boundary conditions (figure 14), as these two models produce a bed that is more radially homogeneous than the CFD-DEM simulation.

Table 2. Effect of the wall boundary condition on the mean bed solid fraction. The error with respect to the CFD-DEM is given in parentheses.

Figure 12. Effect of the wall boundary condition on the mean particle velocity field in case F3, where the coloured regions indicate the mean solid volume fraction: (a) CFD-DEM, (b) no-slip, (c) kinetic, (d) two-fluid simulation with a kinetic-frictional model, and (e) total-pressure boundary condition.

Figure 13. Effect of the wall boundary condition on the vertical distribution of the mean solid volume fraction at the wall: (a) case F3; (b) case F4.

Figure 14. Effect of the wall boundary condition on the radial profile of the mean solid volume fraction, in the upper part of the bed: (a) case F3, $z/R_c = 3.45$; (b) case F4, $z/R_c = 5.91$.

Figure 15 compares the mean vertical particle velocity of the two-fluid simulations with the CFD-DEM simulation in the upper part of the bed, within the primary recirculation loop. The particle–wall boundary condition has a large influence on the near-wall profile. Indeed, with the kinetic or kinetic-frictional boundary conditions, the wall friction is too small to hinder significantly the downward motion of the particles at the wall and decrease the particle slip velocity. This is consistent with the CFD-DEM simulation without particle–wall friction, but does not reproduce the experimental PEPT profile (Fede et al. Reference Fede, Simonin and Ingram2016). The particle slip velocity is reduced more with the total-pressure boundary condition as the particle vertical velocity reaches an extremum at a distance 0.07$R_c$–0.08$R_c$ from the wall in case F3 at $z/R_c=3.45$, and 0.10$R_c$–0.12$R_c$ from the wall in case F4 at $z/R_c=5.91$, which is consistent with the CFD-DEM simulation with particle–wall friction. This is at least qualitatively in agreement with the experiments, though the extremum is typically closer to the wall in the simulations than in the PEPT data (Fede et al. Reference Fede, Simonin and Ingram2016). The vertical particle slip velocity variance is large with the kinetic and kinetic-frictional boundary conditions, whereas the variance is reduced to a low value that is less than 20 % of the bulk value with the total-pressure boundary condition (figure 16). This behaviour is consistent with the CFD-DEM profile. With the no-slip boundary condition, the particle slip velocity and vertical particle slip velocity variance are by construction equal to zero. Whether this is an acceptable approximation depends on the magnitude of the reference slip values.

Figure 15. Effect of the wall boundary condition on the radial profile of the mean vertical particle velocity, in the upper part of the bed, where the PEPT data are from Fede et al. (Reference Fede, Simonin and Ingram2016): (a) case F3, $z/R_c = 3.45$; (b) case F4, $z/R_c = 5.91$.

Figure 16. Effect of the wall boundary condition on the radial profile of vertical particle velocity variance, in the upper part of the bed: (a) case F3, $z/R_c = 3.45$; (b) case F4, $z/R_c = 5.91$.

In all two-fluid simulations, the vertical distribution of the granular pressure at the wall is governed mainly by the collisional pressure, which dominates the kinetic and frictional pressures. More than 90 % of the wall shear stress at any height within the bed, with the total-pressure boundary condition, is due to the collisional contribution. With the kinetic and kinetic-frictional boundary conditions, the wall granular pressure is greatly overestimated throughout the bed and peaks at a lower height than in the CFD-DEM simulation, below height $z/R_c = 3.6$ in case F3, and $z/R_c = 5.8$ in case F4 (figure 17). With the no-slip and total-pressure boundary conditions, the profile of wall granular pressure is predicted more accurately. In case F3, the wall granular pressure is accurate at the bottom of the bed with the no-slip boundary condition, but the peak wall granular pressure is overestimated by 25 % and occurs at a slightly higher height than in the CFD-DEM simulation. With the total-pressure boundary condition, the wall granular pressure is overestimated by up to 40 %, but the height of the peak wall granular pressure is predicted accurately (figure 17). In case F4, the peak wall granular pressure is predicted accurately in terms of height and amplitude with both the no-slip and total-pressure boundary conditions.

Figure 17. Effect of the wall boundary condition on vertical distribution of the granular pressure at the wall: (a) case F3, (b) case F4.

Finally, the mean particle–wall shear stress of the two-fluid simulations is compared in figure 18. The particle–wall shear stress is small with the kinetic boundary condition. Indeed, since the kinetic boundary condition is not superlinearly dependent on the solid volume fraction, it is not able to supply a large amount of friction in dense fluidised beds. The total-pressure boundary condition supplies a large amount of friction since it takes into account the collisional interactions between the particles. As for the granular pressure distribution, the peak particle–wall shear stress is overestimated in case F3 but is more accurate in case F4. At the bottom of the bed, a region of positive vertical wall stress associated with the secondary recirculation loop is present, although its size is underestimated compared to the CFD-DEM simulation (figure 18). The two-fluid simulation with the no-slip boundary condition reaches a similar or slightly higher level of accuracy, for the vertical wall stress prediction, than the simulation with the total-pressure boundary condition. It is also able to predict at least qualitatively the effect of the secondary recirculation loop on the wall granular stress.

Figure 18. Effect of the wall boundary condition on vertical distribution of the particle–wall shear stress: (a) case F3, (b) case F4.

Overall, both the total-pressure and the no-slip boundary conditions provide satisfactory predictions for the two present dense bubbling fluidised beds F3 and F4. However, the no-slip boundary condition is not valid in all fluidisation regimes. In dilute transport flows, for instance, the no-slip boundary condition is not applicable, and the kinetic boundary condition is more suitable. The present total-pressure boundary condition provides an approach that can be relevant in various types of fluidisation regimes, since it tends to a purely kinetic model in the limit of a dilute bed, and a purely frictional model in the limit of a densely packed bed. We believe that this type of modelling is of interest for complex industrial configurations, which may be statistically unstationary and involve several types of fluidisation regimes in a single process.

5. Conclusion

A particle–wall boundary condition model for dense fluidised beds has been developed. By equating the particle–wall normal stress with the total normal stress within the particulate medium, an expression is obtained relating the particle–wall friction with the total granular pressure within the first cell off the wall. The hypothesis is verified empirically in the CFD-DEM simulation of two dense fluidised beds of olefin particles in the bubbling regime. Although the particles exhibit complex behaviour near container walls, due to the constraining effect of the wall surface, the need to describe these phenomena is circumvented following the observation that the total granular pressure is practically constant over a thickness of a few particle diameters away from the wall. The present boundary-condition model does not distinguish between the mode of particle–wall contact. Regardless of the physical mechanisms by which the particle–wall shear stress is governed, the total granular pressure may be expressed in terms of a kinetic, collisional and frictional contribution. Finally, the present model tends to a purely kinetic model in the limit of a dilute bed, and to a purely frictional model in the limit of a densely packed bed. It can thus operate in all fluidisation regimes. The two-fluid simulation of the dense bubbling fluidised beds with several boundary-condition models has demonstrated that the kinetic and kinetic-frictional boundary conditions greatly underestimate the wall friction, and mispredict the macroscopic hydrodynamic behaviour of the bed. The present total-pressure boundary condition provides a more realistic radial velocity or velocity variance profiles compared to these two models. The no-slip boundary condition also provides relevant predictions for the two fluidised beds investigated, in the dense-fluidisation regime. However, the no-slip boundary condition is not applicable in dilute beds, and is therefore unsuitable in some industrial configurations that involve several types of fluidisation regimes.

Supplementary material

Supplementary materials are available at https://doi.org/10.1017/jfm.2024.36.

Acknowledgements

This project was provided with computer and storage resources by GENCI at IDRIS and TGCC thanks to grant 2023-A0142B06938 on the supercomputer Jean Zay and Joliot Curie, and by CALMIP grant 2023-P1132. neptune_cfd is a multiphase CFD code developed in the framework of the NEPTUNE project, financially supported by EDF, CEA (Commissariat à l'Énergie Atomique), IRSN (Institut de Radioprotection et de S$\hat{{\rm u}}$reté Nucléaire) and Framatome.

Funding

This research received no specific grant from any funding agency, commercial or not-for-profit sectors.

Declaration of interests

The authors report no conflict of interest.

Appendix A. CFD-DEM Post-processing

A.1. Definitions

The CFD-DEM particle data are post-processed to assist the development of a boundary condition for the particle–wall stress in the all-sliding regime. The post-processing is based on the spatial averaging of the Lagrangian particle data on post-processing cells, and is similar to the post-processing described in Nigmetova et al. (Reference Nigmetova, Masi, Simonin, Dufresne and Moureau2022). The analysis relies on the hypothesis that the average over the particles in a post-processing cell $C_{n}$ and over one fluid time step $\Delta t_f$ of the CFD-DEM simulation provides a relevant estimation of the conditional expectation $\langle \, \cdot \, \rangle$. The accuracy of this estimation depends on the number of particles contained within the control volume and the uniformity of the particle statistics within the control volume.

For any particle-valued variable $\varphi$, the spatial average of $\varphi$ at a given time $t_\ell$ on a given post-processing cell $C_{n}$ is defined as

(A1)\begin{equation} \bar{\varphi}^{n,\ell} = \frac{\sum_{i=1}^{N_p} \varphi^{i,\ell} \left[\boldsymbol{x}_p^{i,\ell} \in C_{n}\right]}{n_p^{n,\ell} V_n}, \end{equation}

where $V_n$ is the volume of cell $C_n$, and $n_p^{n,\ell } = (1/V_n)\sum _{i=1}^{N_p}[\boldsymbol {x}_p^{i,\ell } \in C_{n}]$ is the number of particle centres per unit volume in cell $C_{n}$ at time $t_\ell$. The time average of $\bar {\varphi }^{n,\ell }$ over $N_\ell$ particle time steps is

(A2)\begin{equation} \langle{\bar{\varphi}}\rangle^{n} = \frac{\sum_{\ell = 1}^{N_\ell} \bar{\varphi}^{n,\ell}\,\Delta t_p^{\ell}}{\sum_{\ell = 1}^{N_\ell} \Delta t_p^{\ell}}, \end{equation}

with $\Delta t_p^{k\ell }$ the particle time step at time $t_\ell$. For the computation of the particle–wall stress, the average is performed over a portion of the wall surface, corresponding to the intersection with a post-processing cell $C_{n}$ of size $R_c/18 \approx 4.9 d_p$ along the wall and over a short duration of time, corresponding to one fluid time step $\Delta t_f$ of the CFD-DEM simulation. For instance, the particle–wall stress associated with a cell $C_{n}$ is the mean contact force exerted on the walls by particles within $C_{n}$ over one fluid time step, per unit surface of the wall, $\langle \boldsymbol {\sigma }^{tot}_{w} \rangle _{\Delta t_f}^{n} = - (1/S^{n}) \langle {n_p}\rangle ^{n} V_n \{{\overline {\boldsymbol {f}_{\!w}}}\}_{\Delta t_f}^{n} = - (1/S^{n}) \sum _{i=1}^{N_p} \boldsymbol {f}_{\!w}^{i,\ell } [\boldsymbol {x}_p^{i,\ell } \in C_{n}]$, where $S^{n}$ is the area of the portion of the wall that intersects cell $C_{n}$. This provides an estimation of the expected particle–wall stress $\langle \boldsymbol {\sigma }^{tot}_{w} \rangle$.

Let us denote by $\{{\bar {\varphi }}\}^{n}$ the Favre average of $\varphi$, that is, the time average weighted by the number of particles in a given cell,

(A3)\begin{equation} \{{\bar{\varphi}}\}^{n} = \frac{\langle{n_p \bar{\varphi}}\rangle^{n}}{\langle{n_p}\rangle^{n}}, \end{equation}

and $''$ indicates the fluctuation with respect to the Favre average, that is, $\bar {\varphi }''^{n,\ell } = \bar {\varphi }^{n,\ell } - \{{\bar {\varphi }}\}^{n}$. The instantaneous particle velocity $\boldsymbol {u}_p$ can be decomposed formally into a cell-averaged part $\overline {\boldsymbol {u}_p}$ and a fluctuation with respect to the spatial average $\delta \boldsymbol {u}_p$:

(A4)\begin{equation} \boldsymbol{u}_p^{i,\ell} = \widehat{\overline{\boldsymbol{u}_p}}^{i,\ell} + \delta\boldsymbol{u}_p^{i} = \widehat{\{{\overline{\boldsymbol{u}_p}}\}} + \widehat{\overline{\boldsymbol{u}_p}''} + \delta\boldsymbol{u}_p^{i}, \end{equation}

where $\widehat{(\,\cdot\,)}$ denotes an interpolation onto the particle location. In the present paper, a zeroth-order interpolation is used for the post-processing particle-cell interpolation, that is, $\widehat {\overline {\boldsymbol {u}_p}}^{i,\ell } = \sum _n \overline {\boldsymbol {u}_p}^{n} [\boldsymbol {x}_p^{i,\ell } \in C_{n}]/\sum _n [\boldsymbol {x}_p^{i,\ell } \in C_{n}]$. The total particle velocity covariance tensor in cell $C_{n}$, denoted $\boldsymbol{\mathsf{R}}^{n}_{\boldsymbol {p,tot}}$, can be decomposed into a cell-based particle velocity covariance $\boldsymbol{\mathsf{R}}^{n}_{\boldsymbol {p,c}}$ and a sub-cell particle velocity covariance $\boldsymbol{\mathsf{R}}^{n}_{\boldsymbol {p,\delta }}$:

(A5)\begin{equation} \boldsymbol{\mathsf{R}}^{n}_{\boldsymbol{p,tot}} = \left\{{\overline{\boldsymbol{u}_p \otimes \boldsymbol{u}_p}}\right\}^{n} - \{{\overline{\boldsymbol{u}_p}}\}^{n} \otimes \{{\overline{\boldsymbol{u}_p}}\}^{n} = \boldsymbol{\mathsf{R}}_{\boldsymbol{p,c}}^{n} + \boldsymbol{\mathsf{R}}_{\boldsymbol{p,\delta}}^{n}, \end{equation}

where $\boldsymbol{\mathsf{R}}_{\boldsymbol {p,c}}^{n}$ is given by $\boldsymbol{\mathsf{R}}_{\boldsymbol {p,c}}^{n} = \left \{{\overline {\boldsymbol {u}_p}'' \otimes \overline {\boldsymbol {u}_p}''}\right \}^{n} = \left \{{\overline {\boldsymbol {u}_p} \otimes \overline {\boldsymbol {u}_p}}\right \}^{n} - \{{\overline {\boldsymbol {u}_p}}\}^{n} \otimes \{{\overline {\boldsymbol {u}_p}}\}^{n}$, and $\boldsymbol{\mathsf{R}}_{\boldsymbol {p,\delta }}^{n}$ is given by $\boldsymbol{\mathsf{R}}_{\boldsymbol {p,\delta }}^{n} = \left \{{\overline {\delta \boldsymbol {u}_p \otimes \delta \boldsymbol {u}_p}}\right \}^{n}$. The sub-cell particle velocity covariance $\boldsymbol{\mathsf{R}}^{n}_{\boldsymbol {p,\delta }}$ can provide an estimation of the particle velocity covariance $\boldsymbol{\mathsf{R}}_{\boldsymbol {p}}$. In addition, this decomposition is useful to compare the results of a CFD-DEM simulation and a TFM simulation, because two-fluid modelling does not provide access to the individual particle velocities but provides a velocity field that can be compared to the cell-averaged CFD-DEM velocity, and whose variance can be compared to the CFD-DEM cell-based velocity variance (Nigmetova et al. Reference Nigmetova, Masi, Simonin, Dufresne and Moureau2022).

A.2. Computation of the particle–particle contact-stress tensor

In the present paper, the definition of the particle–particle contact-stress tensor adheres strictly to the discrete-particle formalism of kinetic theory (§ 3.1). This contrasts with approaches rooted in continuum mechanics, for instance the approaches that define a bulk granular contact stress by considering the stress associated with the internal forces within the solid particles, modelled as a continuous solid mass (Babic Reference Babic1997; Nicot et al. Reference Nicot, Hadda, Guessasma, Fortin and Millet2013; Wensrich Reference Wensrich2014).

The particle–particle contact stress is defined directly based on the forces exerted by particles onto particles lying on the opposing side of the surface. Namely, the particle–particle contact stress associated with a bounded planar surface $A$ of normal $\boldsymbol {n}$ and area $S$ is

(A6)\begin{gather} \frac{1}{S} \int_A \boldsymbol{\sigma}^{cnt}_{p,n} \,{{\rm d}S} = \frac{1}{S} \sum_{i=1}^{N_p} \sum_{j=1}^{N_p} \boldsymbol{f}_{\!c}^{ij} \left[\boldsymbol{x}_p^{i}\boldsymbol{\cdot}\boldsymbol{n} < \boldsymbol{x}_0\boldsymbol{\cdot}\boldsymbol{n}\right] \left[(\boldsymbol{x}_p^{j}\boldsymbol{\cdot}\boldsymbol{n} \geq \boldsymbol{x}_0\boldsymbol{\cdot}\boldsymbol{n}) \wedge (\boldsymbol{x}_{{\cap}}^{ij} \in A)\right.\nonumber\\ \left.{}\wedge (\|\boldsymbol{x}_p^{j} - \boldsymbol{x}_p^{i}\| \leq d_p)\right]\!, \end{gather}

where $\boldsymbol {x}_0$ is a point on surface $A$, and $\boldsymbol {x}_{\cap }^{ij} = \boldsymbol {x}_p^{i} + (\boldsymbol {x}_p^{j} - \boldsymbol {x}_p^{i})((\boldsymbol {x}_0 - \boldsymbol {x}_p^{i}) \boldsymbol {\cdot } \boldsymbol {n})/((\boldsymbol {x}_p^{j} - \boldsymbol {x}_p^{i}) \boldsymbol {\cdot } \boldsymbol {n})$ is the intersection between the plane underlying $A$ and the line joining the centres of the particles $p_{i}$ and $p_{j}$.

The particle–particle contact-stress tensor $\boldsymbol {\varSigma }^{cnt}_{\boldsymbol {p}}$ can be defined by considering the particle–particle contact-stress fluxes on each face of an infinitesimal control volume (figure 19):

(A7)\begin{equation} \boldsymbol{\varSigma}^{cnt}_{\boldsymbol{p}} = \boldsymbol{e}_x \otimes \frac{ \boldsymbol{\boldsymbol{\sigma}}^{cnt}_{p,x} }{S_{x}} + \boldsymbol{e}_y \otimes \frac{ \boldsymbol{\boldsymbol{\sigma}}^{cnt}_{p,y} }{S_{z}} + \boldsymbol{e}_z \otimes \frac{ \boldsymbol{\boldsymbol{\sigma}}^{cnt}_{p,z} }{S_{y}}, \end{equation}

where $\boldsymbol {\boldsymbol {\sigma }}^{cnt}_{p,x}$, $\boldsymbol {\boldsymbol {\sigma }}^{cnt}_{p,y}$ and $\boldsymbol {\boldsymbol {\sigma }}^{cnt}_{p,z}$ are respectively the particle–particle contact-stress fluxes associated with the faces $A_{x}$, $A_{y}$ and $A_{z}$, which are normal to the $\boldsymbol {e}_x$, $\boldsymbol {e}_{y}$ and $\boldsymbol {e}_{z}$ directions, respectively, and of respective areas $S_{x}$, $S_{y}$ and $S_{z}$.

Figure 19. Elementary control volume.

This may be used to reconstruct the particle–particle contact-stress tensor. Indeed, the net force due to particle–particle contacts within a control volume $C_{n}$ may be decomposed as

(A8)\begin{equation} \sum_{i=1}^{N_p} \sum_{j=1}^{N_p} \boldsymbol{f}_{\!c}^{ij} \left[\boldsymbol{x}_p^{i} \in C_{n}\right] \left[\|\boldsymbol{x}_p^{j} - \boldsymbol{x}_p^{i}\| \leq d_p\right] = \boldsymbol{\chi}_{n} + \boldsymbol{\vartheta}_{n}, \end{equation}

with

(A9)\begin{gather} \boldsymbol{\chi}_{n} = \sum_{i=1}^{N_p} \sum_{j=1}^{N_p} \boldsymbol{f}_{\!c}^{ij} \left[\boldsymbol{x}_p^{i} \in C_{n}\right] \left[(\boldsymbol{x}_p^{j} \in C_{n}) \wedge (\|\boldsymbol{x}_p^{j} - \boldsymbol{x}_p^{i}\| \leq d_p)\right]\!, \end{gather}
(A10)\begin{gather}\boldsymbol{\vartheta}_{n} = \sum_{i=1}^{N_p} \sum_{j=1}^{N_p} \boldsymbol{f}_{\!c}^{ij} \left[\boldsymbol{x}_p^{i} \in C_{n}\right] \left[(\boldsymbol{x}_p^{j} \notin C_{n}) \wedge (\|\boldsymbol{x}_p^{j} - \boldsymbol{x}_p^{i}\| \leq d_p)\right]\!, \end{gather}

where $\boldsymbol {\chi }_{n} = 0$ is the contribution of particles interior to the volume, which cancels out following Newton's third law of motion, and $\boldsymbol {\vartheta }_{n}$ is the contribution of particles exterior to the volume, which can be identified as the particle–particle contact-stress flux on the outer surface of $C_{n}$:

(A11)\begin{equation} \boldsymbol{\vartheta}_{n} = \int_{\partial C_{n}} (\boldsymbol{\varSigma}^{cnt}_{\boldsymbol{p}})^{\rm T} \boldsymbol{\cdot} \boldsymbol{n} \,{{\rm d}S}. \end{equation}

A.3. Computation of the kinetic particle stress

There are two methods to calculate the kinetic particle stress $\boldsymbol {\varSigma }^{kin}_{\boldsymbol {p}} = n_p m_p \boldsymbol{\mathsf{R}}_{\boldsymbol {p}}$ in the CFD-DEM simulations. The first approach involves computing the particle velocity covariance over small volumes, as described in (A.1). The second approach is based on the direct measurements of the momentum fluxes. Namely, the kinetic stress flux at time $t_\ell$ across a bounded planar surface $A$ of normal $\boldsymbol {n}$ may be computed based on the sum of the momentum of the particles crossing the surface per unit of time:

(A12) \begin{align} \int_A \left(\boldsymbol{\psi}_{p,n}^{\ell}\left\langle \boldsymbol{u}_{p} \right\rangle + \boldsymbol{\sigma}^{kin,\ell}_{p,n}\right) {\rm d}S & = \frac{1}{\Delta t_p^{\ell}} \sum_{i=1}^{N_p} m_p \boldsymbol{u}_{p}^{i,\ell} \left[\boldsymbol{x}_p^{i,\ell}\boldsymbol{\cdot}\boldsymbol{n} < \boldsymbol{x}_0\boldsymbol{\cdot}\boldsymbol{n}\right] \left[\boldsymbol{x}_p^{i,\ell+1}\boldsymbol{\cdot}\boldsymbol{n} \geq \boldsymbol{x}_0\boldsymbol{\cdot}\boldsymbol{n}\right]\nonumber\\ & \quad - \frac{1}{\Delta t_p^{\ell}} \sum_{i=1}^{N_p} m_p \boldsymbol{u}_{p}^{i,\ell} \left[\boldsymbol{x}_p^{i,\ell}\boldsymbol{\cdot}\boldsymbol{n} \geq \boldsymbol{x}_0\boldsymbol{\cdot}\boldsymbol{n}\right] \left[\boldsymbol{x}_p^{i,\ell+1}\boldsymbol{\cdot}\boldsymbol{n} < \boldsymbol{x}_0\boldsymbol{\cdot}\boldsymbol{n}\right]\!, \end{align}

where the vector $\boldsymbol {\sigma }^{kin,\ell }_{p,n}$ is defined as $\boldsymbol {\sigma }^{kin,\ell }_{p,n} = (\boldsymbol {\varSigma }^{kin}_{\boldsymbol {p}})^{\rm T} \boldsymbol {\cdot } \boldsymbol {n}$, $\boldsymbol {x}_0$ is a point on surface $A$, and $\boldsymbol {\psi }_{p,n}^{\ell }$ is the particle mass flux across the surface, given by

(A13) \begin{align} \int_A \boldsymbol{\psi}_{p,n}^{\ell} \,{\rm d}S & = \frac{1}{\Delta t_p^{\ell}} \sum_{i=1}^{N_p} m_p \left[\boldsymbol{x}_p^{i,\ell}\boldsymbol{\cdot}\boldsymbol{n} < \boldsymbol{x}_0\boldsymbol{\cdot}\boldsymbol{n}\right] \left[\boldsymbol{x}_p^{i,\ell+1}\boldsymbol{\cdot}\boldsymbol{n} \geq \boldsymbol{x}_0\boldsymbol{\cdot}\boldsymbol{n}\right]\nonumber\\ & \quad - \frac{1}{\Delta t_p^{\ell}} \sum_{i=1}^{N_p} m_p \left[\boldsymbol{x}_p^{i,\ell}\boldsymbol{\cdot}\boldsymbol{n} \geq \boldsymbol{x}_0\boldsymbol{\cdot}\boldsymbol{n}\right] \left[\boldsymbol{x}_p^{i,\ell+1}\boldsymbol{\cdot}\boldsymbol{n} < \boldsymbol{x}_0\boldsymbol{\cdot}\boldsymbol{n}\right]\!. \end{align}

In (A12) and (A13), $[\boldsymbol {x}_p^{i,\ell }\boldsymbol {\cdot }\boldsymbol {n} < \boldsymbol {x}_0\boldsymbol {\cdot }\boldsymbol {n}] [\boldsymbol {x}_p^{i,\ell +1}\boldsymbol {\cdot }\boldsymbol {n} \geq \boldsymbol {x}_0\boldsymbol {\cdot }\boldsymbol {n}]$ indicates that particle $p_{i}$ is below the plane at time $t_\ell$ and above the plane at the time $t_{\ell +1} = t_\ell + \Delta t_p^{\ell }$, one particle time step later, or in other words that particle $p_{i}$ has crossed the surface $A$ towards $\boldsymbol {n}$ during the particle time step. Similarly, $[\boldsymbol {x}_p^{i,\ell }\boldsymbol {\cdot }\boldsymbol {n} \geq \boldsymbol {x}_0\boldsymbol {\cdot }\boldsymbol {n}] [\boldsymbol {x}_p^{i,\ell +1}\boldsymbol {\cdot }\boldsymbol {n} < \boldsymbol {x}_0\boldsymbol {\cdot }\boldsymbol {n}]$ indicates that particle $p_{i}$ has crossed the surface $A$ away from $\boldsymbol {n}$ during the particle time step.

This approach is used to compute the kinetic particle stress near the wall in the present paper, because it is more consistent with particle–particle stress computation and allows us to compute the two stresses at the same location without interpolation.

A.4. Octacontagonal coordinates

The mesh of the CFD-DEM simulations is discretised in $N_\theta = 80$ cells along the angular direction (see § 2.2). Hence a horizontal section of the geometry is not circular but octacontagonal, an 80-sided regular polygon. To investigate the CFD-DEM simulations in the close vicinity of the wall, we define an octacontagonal coordinate system ($r,\theta,z$), where $z$ is the vertical Cartesian coordinate, $\theta = \operatorname {atan2}(y,x)$ is the angular, and $r$ is the octacontagonal radial coordinate, which may be computed by considering a rotation of the polygon towards the $x$ axis:

(A14)\begin{equation} r = \frac{x \cos(\theta^*) + y \sin(\theta^*)}{\cos({\rm \pi}/{80})}, \end{equation}

where $\theta ^* = ({2{\rm \pi} }/{80})\lfloor \theta ({80}/{2{\rm \pi} }) \rfloor + {{\rm \pi} }/{80}$ is the angle of the nearest side (figure 20). This ensures that each point on the lateral wall surface has a radius $r = R_c$. Equation (A14) is used to to compute the distance to the wall $\check {r}_w d_p = R_c - r$. Using the cylindrical radial coordinate $r_{cyl} = \sqrt {x^2 + y^2}$ to compute $\check {r}_w d_p$ may induce an error of up to the difference between the circumradius and the apothem of the octacontagon, in our case $R_c(1 - \cos ({{\rm \pi} }/{80})) = 0.068 d_p$. This is not negligible very close to the wall. A local octacontagonal basis may also be defined, using

(A15)\begin{gather} \boldsymbol{e_r} = \cos(\theta^*)\,\boldsymbol{e_x} + \sin(\theta^*)\,\boldsymbol{e_y}, \end{gather}
(A16)\begin{gather}\boldsymbol{e_\theta} =-\sin(\theta^*)\,\boldsymbol{e_x} + \cos(\theta^*)\,\boldsymbol{e_y}, \end{gather}

to define the normal and tangential components of vectorial quantities near the wall.

Figure 20. Coordinates of a point in a slice of an 80-sided regular polygon.

References

Abreu, C.R.A., Macias-Salinas, R., Tavares, F.W. & Castier, M. 1999 A Monte Carlo simulation of the packing and segregation of spheres in cylinders. Braz. J. Chem. Engng 16, 395405.CrossRefGoogle Scholar
Adnan, M., Sun, J., Ahmad, N. & Wei, J.J. 2021 Comparative CFD modeling of a bubbling bed using a Eulerian–Eulerian two-fluid model (TFM) and a Eulerian–Lagrangian dense discrete phase model (DDPM). Powder Technol. 383, 418442.CrossRefGoogle Scholar
Agrawal, K., Loezos, P.N., Syamlal, M. & Sundaresan, S. 2001 The role of meso-scale structures in rapid gas–solid flows. J. Fluid Mech. 445, 151185.CrossRefGoogle Scholar
Almuttahar, A. & Taghipour, F. 2008 Computational fluid dynamics of high density circulating fluidized bed riser: study of modeling parameters. Powder Technol. 185 (1), 1123.CrossRefGoogle Scholar
Anderson, T.B. & Jackson, R.O.Y. 1967 Fluid mechanical description of fluidized beds. Equations of motion. Ind. Engng Chem. Fundam. 6 (4), 527539.CrossRefGoogle Scholar
Andrews, M.J. & O'Rourke, P.J. 1996 The multiphase particle-in-cell (MP-PIC) method for dense particulate flows. Intl J. Multiphase Flow 22 (2), 379402.CrossRefGoogle Scholar
Ansart, R., García-Triñanes, P., Boissière, B., Benoit, H., Seville, J.P.K. & Simonin, O. 2017 Dense gas–particle suspension upward flow used as heat transfer fluid in solar receiver: PEPT experiments and 3D numerical simulations. Powder Technol. 307, 2536.CrossRefGoogle Scholar
Babic, M. 1997 Average balance equations for granular materials. Intl J. Engng Sci. 35 (5), 523548.CrossRefGoogle Scholar
Bennani, L., Neau, H., Baudry, C., Laviéville, J., Fede, P. & Simonin, O. 2017 Numerical simulation of unsteady dense granular flows with rotating geometries. Chem. Engng Res. Des. 120, 333347.CrossRefGoogle Scholar
Benyahia, S., Syamlal, M. & O'Brien, T.J. 2005 Evaluation of boundary conditions used to model dilute, turbulent gas/solids flows in a pipe. Powder Technol. 156 (2–3), 6272.CrossRefGoogle Scholar
Bowen, R.M. 1971 Continuum Theory of Mixtures. US Army Aberdeen Research & Development Center.Google Scholar
Burtseva, L., Valdez, S.B., Werner, F. & Petranovskii, V. 2015 Packing of monosized spheres in a cylindrical container: models and approaches. Rev. Mex. Fís. E 61 (1), 2027.Google Scholar
Buyevich, Y.A. & Shchelchkova, I.N. 1979 Flow of dense suspensions. Prog. Aerosp. Sci. 18, 121150.CrossRefGoogle Scholar
Chapman, S. & Cowling, T.G. 1990 The Mathematical Theory of Non-Uniform Gases: An Account of the Kinetic Theory of Viscosity, Thermal Conduction and Diffusion in Gases. Cambridge University Press.Google Scholar
Chen, X. & Wang, J. 2014 A comparison of two-fluid model, dense discrete particle model and CFD-DEM method for modeling impinging gas–solid flows. Powder Technol. 254, 94102.CrossRefGoogle Scholar
Chorin, A.J. 1968 Numerical solution of the Navier–Stokes equations. Maths Comput. 22 (104), 745762.CrossRefGoogle Scholar
Colin, O. & Rudgyard, M. 2000 Development of high-order Taylor–Galerkin schemes for LES. J. Comput. Phys. 162 (2), 338371.CrossRefGoogle Scholar
Cundall, P.A. & Strack, O.D.L. 1979 A discrete numerical model for granular assemblies. Gèotechnique 29 (1), 4765.CrossRefGoogle Scholar
Darelius, A., Rasmuson, A., van Wachem, B., Björn, I.N. & Folestad, S. 2008 CFD simulation of the high shear mixing process using kinetic theory of granular flow and frictional stress models. Chem. Engng Sci. 63 (8), 21882197.CrossRefGoogle Scholar
Deng, Y., Ansart, R., Baeyens, J. & Zhang, H. 2019 Flue gas desulphurization in circulating fluidized beds. Energies 12 (20), 3908.CrossRefGoogle Scholar
Dufresne, Y., Moureau, V., Lartigue, G. & Simonin, O. 2020 A massively parallel CFD/DEM approach for reactive gas–solid flows in complex geometries using unstructured meshes. Comput. Fluids 198, 104402.CrossRefGoogle Scholar
Fede, P., Moula, G., Ingram, A., Dumas, T. & Simonin, O. 2009 3D numerical simulation and PEPT experimental investigation of pressurized gas–solid fluidized bed hydrodynamic. In Fluids Engineering Division Summer Meeting, vol. 43727, pp. 1833–1842. ASME.CrossRefGoogle Scholar
Fede, P. & Simonin, O. 2018 Direct simulation Monte Carlo predictions of coarse elastic particle statistics in fully developed turbulent channel flows: comparison with deterministic discrete particle simulation results and moment closure assumptions. Intl J. Multiphase Flow 108, 2541.CrossRefGoogle Scholar
Fede, P., Simonin, O. & Ingram, A. 2016 3D numerical simulation of a lab-scale pressurized dense fluidized bed focussing on the effect of the particle–particle restitution coefficient and particle–wall boundary conditions. Chem. Engng Sci. 142, 215235.CrossRefGoogle Scholar
Février, P., Simonin, O. & Squires, K.D. 2005 Partitioning of particle velocities in gas–solid turbulent flows into a continuous field and a spatially uncorrelated random distribution: theoretical formalism and numerical study. J. Fluid Mech. 533, 146.CrossRefGoogle Scholar
Gobin, A., Neau, H., Simonin, O., Llinas, J.-R., Reiling, V. & Sélo, J.-L. 2003 Fluid dynamic numerical simulation of a gas phase polymerization reactor. Intl J. Numer. Meth. Fluids 43 (10–11), 11991220.CrossRefGoogle Scholar
Gu, Y., Ozel, A., Kolehmainen, J. & Sundaresan, S. 2019 Computationally generated constitutive models for particle phase rheology in gas-fluidized suspensions. J. Fluid Mech. 860, 318349.CrossRefGoogle Scholar
van der Hoef, M.A., Ye, M., van Sint Annaland, M., Andrews, A.T., Sundaresan, S. & Kuipers, J.A.M. 2006 Multiscale modeling of gas-fluidized beds. Adv. Chem. Engng 31, 65149.CrossRefGoogle Scholar
Hui, K., Haff, P.K., Ungar, J.E. & Jackson, R. 1984 Boundary conditions for high-shear grain flows. J. Fluid Mech. 145, 223233.CrossRefGoogle Scholar
Jenkins, J.T. 1992 Boundary conditions for rapid granular flow: flat, frictional walls. J. Appl. Mech. 59 (1), 120.CrossRefGoogle Scholar
Jenkins, J.T. & Louge, M.Y. 1997 On the flux of fluctuation energy in a collisional grain flow at a flat, frictional wall. Phys. Fluids 9 (10), 28352840.CrossRefGoogle Scholar
Jenkins, J.T. & Savage, S.B. 1983 A theory for the rapid flow of identical, smooth, nearly elastic, spherical particles. J. Fluid Mech. 130, 187202.CrossRefGoogle Scholar
Johnson, P.C. & Jackson, R. 1987 Frictional–collisional constitutive relations for granular materials, with application to plane shearing. J. Fluid Mech. 176, 6793.CrossRefGoogle Scholar
Johnson, P.C., Nott, P. & Jackson, R. 1990 Frictional–collisional equations of motion for participate flows and their application to chutes. J. Fluid Mech. 210, 501535.CrossRefGoogle Scholar
Komiwes, V., Mege, P., Meimon, Y. & Herrmann, H. 2006 Simulation of granular flow in a fluid applied to sedimentation. Granul. Matt. 8, 4154.CrossRefGoogle Scholar
Konan, N.A., Simonin, O. & Squires, K.D. 2006 Rough wall boundary condition derivation for particle continuum equations: validation from LES/DPS of gas–solid turbulent channel flow. In Fluids Engineering Division Summer Meeting, vol. 47500, pp. 1723–1732. ASME.CrossRefGoogle Scholar
Kraushaar, M. 2011 Application of the compressible and low-Mach number approaches to large-eddy simulation of turbulent flows in aero-engines. PhD thesis, Université de Toulouse, France.Google Scholar
Li, T. & Benyahia, S. 2012 Revisiting Johnson and Jackson boundary conditions for granular flows. AIChE J. 58 (7), 20582068.CrossRefGoogle Scholar
Li, T., Grace, J. & Bi, X. 2010 Study of wall boundary condition in numerical simulations of bubbling fluidized beds. Powder Technol. 203 (3), 447457.CrossRefGoogle Scholar
Louge, M.Y. 1994 Computer simulations of rapid granular flows of spheres interacting with a flat, frictional boundary. Phys. Fluids 6 (7), 22532269.CrossRefGoogle Scholar
Lubachevsky, B.D. 1991 How to simulate billiards and similar systems. J. Comput. Phys. 94 (2), 255283.CrossRefGoogle Scholar
Lun, C.K.K. & Savage, S.B. 1986 The effects of an impact velocity dependent coefficient of restitution on stresses developed by sheared granular materials. Acta Mech. 63 (1), 1544.CrossRefGoogle Scholar
Méchitoua, N., Boucker, M., Laviéville, J., Pigny, S. & Serre, G. 2003 An unstructured finite volume solver for two phase water/vapour flows based on an elliptic oriented fractional step method. In NURETH 10, Seoul, South Korea.Google Scholar
Morioka, S. & Nakajima, T. 1987 Modeling of gas and solid particles 2-phase flow and application to fluidized-bed. J. Theor. Appl. Mech. 6 (1), 7788.Google Scholar
Moureau, V., Domingo, P. & Vervisch, L. 2011 Design of a massively parallel CFD code for complex geometries. C. R. Méc. 339 (2–3), 141148.CrossRefGoogle Scholar
Mueller, G.E. 1992 Radial void fraction distributions in randomly packed fixed beds of uniformly sized spheres in cylindrical containers. Powder Technol. 72 (3), 269275.CrossRefGoogle Scholar
Mueller, G.E. 1997 Numerical simulation of packed beds with monosized spheres in cylindrical containers. Powder Technol. 92 (2), 179183.CrossRefGoogle Scholar
Neau, H., Pigou, M., Fede, P., Ansart, R., Baudry, C., Mérigoux, N., Laviéville, J., Fournier, Y., Renon, N. & Simonin, O. 2020 Massively parallel numerical simulation using up to 36 000 CPU cores of an industrial-scale polydispersed reactive pressurized fluidized bed with a mesh of one billion cells. Powder Technol. 366, 906924.CrossRefGoogle Scholar
Nicot, F., Hadda, N., Guessasma, M., Fortin, J. & Millet, O. 2013 On the definition of the stress tensor in granular media. Intl J. Solids Struct. 50 (14–15), 25082517.CrossRefGoogle Scholar
Nigmetova, A. 2019 DEM-CFD simulation of dilute and dense particle laden flows: application to a lab-scale pressurized dense fluidized bed. PhD thesis, Université de Toulouse, France.Google Scholar
Nigmetova, A., Masi, E., Simonin, O., Dufresne, Y. & Moureau, V. 2022 Three-dimensional DEM-CFD simulation of a lab-scale fluidized bed to support the development of two-fluid model approach. Intl J. Multiphase Flow 156, 104189.CrossRefGoogle Scholar
Ocone, R., Sundaresan, S. & Jackson, R. 1993 Gas–particle flow in a duct of arbitrary inclination with particle–particle interactions. AIChE J. 39 (8), 12611271.CrossRefGoogle Scholar
Popoff, B. & Braun, M. 2007 A Lagrangian approach to dense particulate flows. In International Conference on Multiphase Flow, Leipzig, Germany (ed. M. Sommerfield).Google Scholar
Radenkovic, D. & Simonin, O. 2018 Stochastic modelling of three-dimensional particle rebound from isotropic rough wall surface. Intl J. Multiphase Flow 109, 3550.CrossRefGoogle Scholar
Reeks, M.W. 1991 On a kinetic equation for the transport of particles in turbulent flows. Phys. Fluids A 3 (3), 446456.CrossRefGoogle Scholar
Rocke, F.A. 1971 The cylindrically ordered packing of equal spheres. Powder Technol. 4 (4), 180186.CrossRefGoogle Scholar
Sabatier, F., Ansart, R., Zhang, H., Baeyens, J. & Simonin, O. 2020 Experiments support simulations by the NEPTUNE_CFD code in an upflow bubbling fluidized bed reactor. Chem. Engng J. 385, 123568.CrossRefGoogle Scholar
Sakiz, M. & Simonin, O. 1998 Continuum modelling and Lagrangian simulation of the turbulent transport of particle kinetic stresses in a vertical gas–solid channel flow. In 3rd International Conference on Multiphase Flows, Lyon, France, vol. 66, pp. 70–91.Google Scholar
Sakiz, M. & Simonin, O. 1999 Development and validation of continuum particle wall boundary conditions using Lagrangian simulation of a vertical gas–solid channel flow. In Proc. ASME Fluids Engineering Division Summer Meeting, FEDSM99-7898. ASME.Google Scholar
Schaeffer, D.G. 1987 Instability in the evolution equations describing incompressible granular flow. J. Differ. Equ. 66 (1), 1950.CrossRefGoogle Scholar
Schneiderbauer, S., Schellander, D., Löderer, A. & Pirker, S. 2012 Non-steady state boundary conditions for collisional granular flows at flat frictional moving walls. Intl J. Multiphase Flow 43, 149156.CrossRefGoogle Scholar
von Seckendorff, J. & Hinrichsen, O. 2021 Review on the structure of random packed-beds. Can. J. Chem. Engng 99, S703S733.CrossRefGoogle Scholar
Sharma, A., Wang, S., Pareek, V., Yang, H. & Zhang, D. 2014 CFD modeling of mixing/segregation behavior of biomass and biochar particles in a bubbling fluidized bed. Chem. Engng Sci. 106, 264274.CrossRefGoogle Scholar
Shu, Z., Peng, G., Wang, J., Zhang, N., Li, S. & Lin, W. 2014 Comparative CFD analysis of heterogeneous gas–solid flow in a countercurrent downer reactor. Ind. Engng Chem. Res. 53 (8), 33783384.CrossRefGoogle Scholar
Si, P., Shi, H. & Yu, X. 2019 A general frictional–collisional model for dense granular flows. Landslides 16, 485496.CrossRefGoogle Scholar
Simonin, O. 2000 Statistical and Continuum Modelling of Turbulent Reactive Particulate Flows. Part I: Theoretical Derivation of Dispersed Phase Eulerian Modelling from Probability Density Function Kinetic Equation. VKI for Fluid Dynamics, Lecture Series, vol. 6. Von Karman Institute for Fluid Dynamics.Google Scholar
Sinclair, J.L. & Jackson, R. 1989 Gas–particle flow in a vertical pipe with particle–particle interactions. AIChE J. 35 (9), 14731486.CrossRefGoogle Scholar
Soleimani, A., Pirker, S. & Schneiderbauer, S. 2015 a Solid boundary condition for collisional gas–solid flows at rough walls. Powder Technol. 281, 2833.CrossRefGoogle Scholar
Soleimani, A., Schneiderbauer, S. & Pirker, S. 2015 b CFD study of the gas–particle flow in a horizontal duct: the impact of the solids wall boundary conditions. Procedia Engng 102, 10261037.CrossRefGoogle Scholar
Soleimani, A., Schneiderbauer, S. & Pirker, S. 2015 c A comparison for different wall-boundary conditions for kinetic theory based two-fluid models. Intl J. Multiphase Flow 71, 9497.CrossRefGoogle Scholar
Sommerfeld, M. & Huber, N. 1999 Experimental analysis and modelling of particle–wall collisions. Intl J. Multiphase Flow 25 (6–7), 14571489.CrossRefGoogle Scholar
Srivastava, A. & Sundaresan, S. 2003 Analysis of a frictional-kinetic model for gas–particle flow. Powder Technol. 129 (1–3), 7285.CrossRefGoogle Scholar
Thonglimp, V., Hiquily, N. & Laguerie, C. 1984 Vitesse minimale de fluidisation et expansion des couches fluidisées par un gaz. Powder Technol. 38 (3), 233253.CrossRefGoogle Scholar
Tingate, G.A. 1973 Some geometrical properties of packings of equal spheres in cylindrical vessels. Nucl. Engng Des. 24 (2), 153179.CrossRefGoogle Scholar
Wang, J. 2020 Continuum theory for dense gas–solid flow: a state-of-the-art review. Chem. Engng Sci. 215, 115428.CrossRefGoogle Scholar
Wen, C.-Y. & Yu, Y.H. 1966 Mechanics of fluidization. In Fluid Particle Technology, Chem. Eng. Progress. Symposium Series, vol. 62, pp. 100–111. American Institute of Chemical Engineers.Google Scholar
Wensrich, C.M. 2012 Boundary structure in dense random packing of monosize spherical particles. Powder Technol. 219, 118127.CrossRefGoogle Scholar
Wensrich, C.M. 2014 Stress, stress-asymmetry and contact moments in granular matter. Granul. Matt. 16 (4), 597608.CrossRefGoogle Scholar
Zaichik, L.I., Oesterlé, B. & Alipchenkov, V.M. 2004 On the probability density function model for the transport of particles in anisotropic turbulent flow. Phys. Fluids 16 (6), 19561964.CrossRefGoogle Scholar
Zhang, W., Thompson, K.E., Reed, A.H. & Beenken, L. 2006 Relationship between packing structure and porosity in fixed beds of equilateral cylindrical particles. Chem. Engng Sci. 61 (24), 80608074.CrossRefGoogle Scholar
Zhao, Y., Ding, T., Zhu, L. & Zhong, Y. 2016 A specularity coefficient model and its application to dense particulate flow simulations. Ind. Engng Chem. Res. 55 (5), 14391448.CrossRefGoogle Scholar
Figure 0

Figure 1. (a) Computational domain of the CFD-DEM simulations, and (b) bottom view of the CFD-DEM mesh.

Figure 1

Table 1. Operating conditions and numerical parameters of the CFD-DEM simulations.

Figure 2

Figure 2. Schematic representation of the different classes of (a) particle momentum fluxes across a surface $A_{bulk}$ in direction $n$ at a distance $x_{n,bulk} = d_p/2 + \Delta n$ from the wall surface, and (b) momentum flux exchanges between the particles and the wall. The contact flux is the sum of the collisional flux and the frictional flux.

Figure 3

Figure 3. Radial profile very close to the wall in the cases (a) F3 and (b) F4 of the total normal particle stress $\boldsymbol {\varSigma }^{cnt}_{p,nn}$, normal kinetic particle stress $\boldsymbol {\varSigma }^{kin}_{p,nn}$ and normal contact particle stress $\boldsymbol {\varSigma }^{cnt}_{p,nn}$. The filled square symbol at $\check {r}_{w} = 1/2$ indicates the corresponding particle–wall normal stress $\sigma ^{tot}_{w,n}$. (a) Upper part of the bed, $z/R = 3.45$. (b) Bottom of the bed, $z/R = 0.05$.

Figure 4

Figure 4. Vertical profiles in case F4 of the mean particle–wall normal stress $\sigma ^{tot}_{w,r}$ associated with particle–wall contacts that are shorter than a duration. The durations are given in units of the CFD-DEM collision time $T_c$ (see (2.1)), which corresponds to the duration of a short-duration collision between two particles in the CFD-DEM simulation.

Figure 5

Figure 5. Close-up views in case F3 of (a,c) the first layer of particles near the wall ($0< z_r<1$), namely the particles whose centre is located within $z_r = (R_c-r_p)/d_p = 1$ particle diameter of the wall, and (b,d) a thin layer of particles away from the wall ($10< z_r<11$), namely the particles whose centre is $z_r = 10$$11$ particle diameters away from the wall. (a,b) Instant A: Typical arrangement of the particles ($\alpha _p = 0.59$). (c,d) Instant B: Arrangement of the particles following the passage of a bubble ($\alpha _p = 0.26$).

Figure 6

Figure 6. Radial profile at the height $z/R_c=3.45$ in terms of the normalised distance to the wall $\check {r}_w = (R_c - r)/d_p$, in case F3, of (a) the number of particles per unit volume $n_p$ normalised by the mean bed solid fraction, for a series of nested octacontagonal shells of thickness $d_p/100$, and (b) the resulting solid volume fraction $\alpha _p$ within each octacontagonal shell. The solid volume fraction predicted by the correlation of Mueller (1992) is given for reference.

Figure 7

Figure 7. Radial profile at the height $z/R_c=3.45$ in terms of the normalised distance to the wall $\check {r}_w = (R_c - r)/d_p$, in case F3, for a series of nested octacontagonal shells of thickness $d_p/500$ near the wall surface, of (a) the mean wall-normal velocity $\langle u_{p,n} \rangle$, (b) the total wall-normal velocity variance $R_{nn}$, (c) the mean vertical velocity $\langle u_{p,z} \rangle = \langle u_{p,t} \rangle$, (d) the total vertical velocity variance $R_{zz}$, and (e) the total vertical-normal velocity covariance $R_{nz}$ within each octacontagonal shell.

Figure 8

Figure 8. Relationship between the orientation of the particle–wall shear stress and the cell-averaged tangential particle velocity for various instants and locations along the lateral wall surface, where the orientation is defined as the angle between a vector and the unit vector $\boldsymbol {e}_\theta$. The red line is the identity. Due to the symmetry of the angle space, the clusters of points at the bottom left, bottom right, top left and top right of the figure are all close to each other and to the origin.

Figure 9

Figure 9. Radial profile in case F3 of the total normal particle stress $\boldsymbol {\varSigma }^{cnt}_{p,nn}$, normal kinetic particle stress $\boldsymbol {\varSigma }^{kin}_{p,nn}$ and normal contact particle stress $\boldsymbol {\varSigma }^{cnt}_{p,nn}$. The filled square symbol at $\check {r}_{w} = 1/2$ indicates the corresponding particle–wall normal stress $\sigma ^{tot}_{w,n}$. (a) Upper part of the bed, $z/R = 3.45$. (b) Bottom of the bed, $z/R = 0.05$.

Figure 10

Figure 10. Relationship between the particle–wall shear stress and particle–wall normal stress for various instants and locations along the lateral wall surface. The red line is the 0.3 slope corresponding to the coefficient of sliding friction of the CFD-DEM simulation. The green line is the linear best fit, of slope 0.268.

Figure 11

Figure 11. Probability density associated with various distributions of the diagonal components of the particle–particle contact-stress tensor, characterised by the ratio of vertical–vertical ($zz$) component to pressure $\varSigma ^{cnt}_{p,zz} (\boldsymbol {x}_{bulk}, t)/P_{p} (\boldsymbol {x}_{bulk}, t)$ and the ratio of radial–radial ($rr$) component to pressure $\varSigma ^{cnt}_{p,rr} (\boldsymbol {x}_{bulk}, t)/P_{p} (\boldsymbol {x}_{bulk}, t)$, in the second cell off the wall in case F3. The dashed lines indicate that two of the diagonal components of the particle–particle contact-stress tensor are equal. Their intersection indicates isotropy.

Figure 12

Table 2. Effect of the wall boundary condition on the mean bed solid fraction. The error with respect to the CFD-DEM is given in parentheses.

Figure 13

Figure 12. Effect of the wall boundary condition on the mean particle velocity field in case F3, where the coloured regions indicate the mean solid volume fraction: (a) CFD-DEM, (b) no-slip, (c) kinetic, (d) two-fluid simulation with a kinetic-frictional model, and (e) total-pressure boundary condition.

Figure 14

Figure 13. Effect of the wall boundary condition on the vertical distribution of the mean solid volume fraction at the wall: (a) case F3; (b) case F4.

Figure 15

Figure 14. Effect of the wall boundary condition on the radial profile of the mean solid volume fraction, in the upper part of the bed: (a) case F3, $z/R_c = 3.45$; (b) case F4, $z/R_c = 5.91$.

Figure 16

Figure 15. Effect of the wall boundary condition on the radial profile of the mean vertical particle velocity, in the upper part of the bed, where the PEPT data are from Fede et al. (2016): (a) case F3, $z/R_c = 3.45$; (b) case F4, $z/R_c = 5.91$.

Figure 17

Figure 16. Effect of the wall boundary condition on the radial profile of vertical particle velocity variance, in the upper part of the bed: (a) case F3, $z/R_c = 3.45$; (b) case F4, $z/R_c = 5.91$.

Figure 18

Figure 17. Effect of the wall boundary condition on vertical distribution of the granular pressure at the wall: (a) case F3, (b) case F4.

Figure 19

Figure 18. Effect of the wall boundary condition on vertical distribution of the particle–wall shear stress: (a) case F3, (b) case F4.

Figure 20

Figure 19. Elementary control volume.

Figure 21

Figure 20. Coordinates of a point in a slice of an 80-sided regular polygon.

Supplementary material: File

Dupuy et al. supplementary material 1

Dupuy et al. supplementary material
Download Dupuy et al. supplementary material 1(File)
File 279.3 KB
Supplementary material: File

Dupuy et al. supplementary material 2

Dupuy et al. supplementary material
Download Dupuy et al. supplementary material 2(File)
File 105.7 KB