Hostname: page-component-7bb8b95d7b-pwrkn Total loading time: 0 Render date: 2024-09-29T17:54:12.142Z Has data issue: false hasContentIssue false

Interfaces of high- and low-speed large-scale structures in compressible turbulent mixing layers: compressibility effects and structures

Published online by Cambridge University Press:  15 February 2024
Xiaoning Wang
Affiliation:
Department of Mechanics and Aerospace Engineering, Southern University of Science and Technology, Shenzhen 518055, PR China Guangdong Provincial Key Laboratory of Turbulence Research and Applications, Southern University of Science and Technology, Shenzhen 518055, PR China Guangdong-Hong Kong-Macao Joint Laboratory for Data-Driven Fluid Mechanics and Engineering Applications, Southern University of Science and Technology, Shenzhen 518055, PR China
Jing Guo
Affiliation:
Department of Mechanics and Aerospace Engineering, Southern University of Science and Technology, Shenzhen 518055, PR China
Jianchun Wang*
Affiliation:
Department of Mechanics and Aerospace Engineering, Southern University of Science and Technology, Shenzhen 518055, PR China Guangdong Provincial Key Laboratory of Turbulence Research and Applications, Southern University of Science and Technology, Shenzhen 518055, PR China Guangdong-Hong Kong-Macao Joint Laboratory for Data-Driven Fluid Mechanics and Engineering Applications, Southern University of Science and Technology, Shenzhen 518055, PR China
Shiyi Chen
Affiliation:
Department of Mechanics and Aerospace Engineering, Southern University of Science and Technology, Shenzhen 518055, PR China Guangdong Provincial Key Laboratory of Turbulence Research and Applications, Southern University of Science and Technology, Shenzhen 518055, PR China Guangdong-Hong Kong-Macao Joint Laboratory for Data-Driven Fluid Mechanics and Engineering Applications, Southern University of Science and Technology, Shenzhen 518055, PR China Eastern Institute for Advanced Study, Eastern Institute of Technology, Ningbo 315200, PR China
*
Email address for correspondence: [email protected]

Abstract

Direct numerical simulations of temporally developing mixing layers have been performed to investigate the effects of compressibility on statistics and structures near the interfaces of high- and low-speed large-scale structures (LSSs), covering a range of convective Mach numbers from $M_c=0.2$ to $1.8$ and Taylor Reynolds numbers up to 290. The interfaces of LSSs are directly defined by the isosurface of zero fluctuating streamwise velocity. The characteristic velocity jump at the interfaces grows rapidly in the transition stage and then decreases until reaching a gradual self-similar stage. The evolution of velocity jump is evidently delayed as the convective Mach number increases. The interface layer is formed by the shearing motion of neighbouring LSSs. A small vortical motion characterized by the Kolmogorov scale is induced in the interface layer by shear-dominated outer regions. The strengths of outer shearing motion and central vortical motion are greater at the leading edge, but smaller at the trailing edge, which is also reflected in a larger velocity jump at the leading edge. As the convective Mach number increases, the small-scale vortical structure is obviously suppressed by compressibility. At high convective Mach number $M_c=1.8$, the compressive shear-dominated outer regions are linked with a sheet-like structure passing through the centre of the expansion region corresponding to a small-scale vortical structure. The compressibility and shearing strength near the interface are highly dependent on the interface orientation.

Type
JFM Papers
Copyright
© The Author(s), 2024. Published by Cambridge University Press

1. Introduction

One of the essential characteristics of turbulence is an increasing scale separation between the integral and small scales of the flow as the Reynolds number increases (Shen & Warhaft Reference Shen and Warhaft2000; Smits, McKeon & Marusic Reference Smits, McKeon and Marusic2011; Lee & Moser Reference Lee and Moser2019). In wall-bounded turbulent flow, high- and low-speed large-scale structures (LSSs) residing in the log-law layer have been extensively studied in the last two decades (Ganapathisubramani et al. Reference Ganapathisubramani, Hutchins, Hambleton, Longmire and Marusic2005; Marusic, Mathis & Hutchins Reference Marusic, Mathis and Hutchins2010; Smits et al. Reference Smits, McKeon and Marusic2011; Jiménez Reference Jiménez2018), and they have been shown to carry a significant fraction of turbulent kinetic energy and Reynolds shear stress and evidently interact with the small-scale structures near the wall. These LSSs in a fluctuating velocity field are found to be equivalent to uniform momentum zones (UMZs), regions of relatively similar streamwise velocity with coherence in the streamwise and wall-normal directions (Adrian, Meinhart & Tonkins Reference Adrian, Meinhart and Tonkins2000; Saxton-Fox & McKeon Reference Saxton-Fox and McKeon2017; Gul, Elsinga & Westerweel Reference Gul, Elsinga and Westerweel2020). Recently, a notable model for LSSs presented by Saxton-Fox & McKeon (Reference Saxton-Fox and McKeon2017) has demonstrated a capacity to reproduce the presence of UMZs within the instantaneous streamwise velocity field of turbulent boundary layers. In the turbulent mixing layers, the existence of streamwise elongated high- and low-speed LSSs were also confirmed in stably stratified shear layers by Watanabe et al. (Reference Watanabe, Riley, Nagata, Matsuda and Onishi2019) and Watanabe & Nagata (Reference Watanabe and Nagata2021) and in compressible turbulent mixing layers by Messersmith & Dutton (Reference Messersmith and Dutton1996), Pirozzoli et al. (Reference Pirozzoli, Bernardini, Marié and Grasso2015) and Wang, Wang & Chen (Reference Wang, Wang and Chen2022), due to the strong stabilizing effects of stable density stratification and compressibility, respectively. These LSSs highly resemble turbulent structures found in wall turbulence.

As Reynolds number increases, the large energy-containing scales and small dissipative scales become increasingly separated (Pope Reference Pope2000). In wall turbulence, the quasistreamwise vortices and near-wall streaks are dominant in the near wall region characterized by the viscous length scale (Robinson Reference Robinson1991; Smits et al. Reference Smits, McKeon and Marusic2011; Jiménez Reference Jiménez2013). Far away from the wall or in the outer layer, a large proportion of small-scale structures reside in the near vicinity of UMZ edges, while they are sparse within the UMZs which accounts for a significantly larger volume fraction (Adrian et al. Reference Adrian, Meinhart and Tonkins2000; Eisma et al. Reference Eisma, Westerweel, Ooms and Elsinga2015; De Silva et al. Reference De Silva, Philip, Hutchins and Marusic2017). The interaction between large- and small-scale structures also occurs near the interfaces of the high- and low-speed LSSs, which is prevalent in wall-bounded turbulence, due to the superposition and amplitude-modulation effects (Marusic et al. Reference Marusic, Mathis and Hutchins2010; Mathis, Hutchins & Marusic Reference Mathis, Hutchins and Marusic2011; Agostini & Leschziner Reference Agostini and Leschziner2014). In compressible turbulent mixing layers, Wang et al. (Reference Wang, Wang and Chen2022) found that the small-scale vortical structures have an apparent preference for clustering near the top of the large-scale low-speed regions, which is directly associated with high-shearing motions near the upper portion of the low-speed structures.

In the present work, we focus our attention on the interfaces of high- and low-speed LSSs within the turbulent region of compressible turbulent mixing layers, which have not received significant attention to date, particularly at high levels of compressibility. The interfaces of UMZs have been investigated as internal shear layers (ISLs) with intense vorticity associated with strong jumps of several flow statistics, including turbulent shear stress, streamwise and wall-normal velocities, and have been studied widely (Meinhart & Adrian Reference Meinhart and Adrian1995; Kwon et al. Reference Kwon, Philip, de Silva, Hutchins and Monty2014; de Silva, Hutchins & Marusic Reference de Silva, Hutchins and Marusic2016; Fan et al. Reference Fan, Xu, Yao and Hickey2019; Chen, Chung & Wan Reference Chen, Chung and Wan2020). The turbulent/non-turbulent interface (TNTI), separating the turbulent region from the irrotational region, is considered as the outer edge of the UMZs (De Silva et al. Reference De Silva, Philip, Hutchins and Marusic2017; Fan et al. Reference Fan, Xu, Yao and Hickey2019). The ISLs exhibit velocity jump, scaling of thickness and vortical structures, similar to TNTI in both turbulent boundary layers (Eisma et al. Reference Eisma, Westerweel, Ooms and Elsinga2015; De Silva et al. Reference De Silva, Philip, Hutchins and Marusic2017) and free shear turbulence (Fiscaletti, Buxton & Attili Reference Fiscaletti, Buxton and Attili2021; Hayashi, Watanabe & Nagata Reference Hayashi, Watanabe and Nagata2021), since they are dominated by the smallest vortical structures characterized by the Kolmogorov length scale. According to several experimental and numerical investigations, the thickness of the ISLs is nearly equal to 10 times the Kolmogorov length scale $\eta$, and the streamwise velocity jump across the layer is proportional to Kolmogorov velocity $u_\eta$ (De Silva et al. Reference De Silva, Philip, Hutchins and Marusic2017; Gul et al. Reference Gul, Elsinga and Westerweel2020; Watanabe, Tanaka & Nagata Reference Watanabe, Tanaka and Nagata2020; Hayashi et al. Reference Hayashi, Watanabe and Nagata2021). When normalized by the Kolmogorov scales, the characteristics of the ISLs exhibit consistent behaviour across various types of turbulence, including homogeneous isotropic turbulence, free shear turbulence and wall-bounded turbulence. This indicates that the ISL may be an important general feature of turbulence. (Elsinga & Marusic Reference Elsinga and Marusic2010; Ishihara, Kaneda & Hunt Reference Ishihara, Kaneda and Hunt2013; Elsinga et al. Reference Elsinga, Ishihara, Goudar, Da Silva and Hunt2017; Fiscaletti et al. Reference Fiscaletti, Buxton and Attili2021; Hayashi et al. Reference Hayashi, Watanabe and Nagata2021; Heisel et al. Reference Heisel, De Silva, Hutchins, Marusic and Guala2021). The presence of mean shear leads to the persistence of coherent structures and imparts a preferential direction of the small-scale shear layers, which is a distinct feature of both free shear and wall-bounded turbulence (Fiscaletti et al. Reference Fiscaletti, Buxton and Attili2021; Heisel et al. Reference Heisel, De Silva, Hutchins, Marusic and Guala2021).

As part of the edge of UMZs, the ISLs are usually detected by two different techniques, including histograms of the instantaneous streamwise velocity (Adrian et al. Reference Adrian, Meinhart and Tonkins2000; Fan et al. Reference Fan, Xu, Yao and Hickey2019) and triple decomposition of vorticity (Kolář Reference Kolář2007). The former approach relies on the histogram of the instantaneous streamwise velocity determined over a wall-normal–streamwise plane at a certain spanwise position, while the latter relies on distinguishing the shear through the velocity gradient tensor. Based on the time-averaged quantities, the high- and low-speed LSSs can be detected by the premultiplied energy spectra (Kim & Adrian Reference Kim and Adrian1999; Monty et al. Reference Monty, Hutchins, Ng, Marusic and Chong2009; Watanabe & Nagata Reference Watanabe and Nagata2021), the two-point correlation of the fluctuating streamwise velocity (Ganapathisubramani et al. Reference Ganapathisubramani, Hutchins, Hambleton, Longmire and Marusic2005; Monty et al. Reference Monty, Stewart, Williams and Chong2007; Wang et al. Reference Wang, Wang and Chen2022) and proper orthogonal decomposition (Baltzer, Adrian & Wu Reference Baltzer, Adrian and Wu2013; Pirozzoli et al. Reference Pirozzoli, Bernardini, Marié and Grasso2015). In the instantaneous flow field, individual high- and low-speed LSSs are extracted as the isosurfaces of the fluctuating streamwise velocity that exceed a threshold value (Dennis & Nickels Reference Dennis and Nickels2011; Lee et al. Reference Lee, Lee, Choi and Sung2014; Deng et al. Reference Deng, Pan, Wang and He2018). A smoothing filter needs to be adopted to exclude any small-scale features. However, the interfaces of the high- and low-speed LSSs have rarely been identified and analysed in the fluctuating flow field.

Compared with the extensive works for analysing the TNTI and ISL in incompressible turbulence, fewer works have been done for compressible flows. In compressible mixing layers, Rossmann, Mungal & Hanson (Reference Rossmann, Mungal and Hanson2002) and Zhou, He & Shen (Reference Zhou, He and Shen2012) suggested that three-dimensional shocklets are formed at TNTI, namely the boundary of the large structures acting as bluff bodies embedded in supersonic flow when the convective Mach number is higher than 0.7. Jahanbakhshi & Madnia (Reference Jahanbakhshi and Madnia2016) found that the percentage of the compressed regions on the TNTI decreases as the convective Mach number increases, resulting in a reduction of the average entrained mass flux and the surface area of the TNTI. The conditional average of dilatation reported by Nagata, Watanabe & Nagata (Reference Nagata, Watanabe and Nagata2018) showed that a fluid expansion occurs at TNTI on average and is accompanied by a strong compression on the turbulent side. Furthermore, they found that the fluid compression at the leading edge of TNTI is stronger than at the trailing edge of TNTI. Compressibility also changes the local flow topology near the TNTI in compressible mixing layers (Vaghefi & Madnia Reference Vaghefi and Madnia2015). Recently, Zhang, Watanabe & Nagata (Reference Zhang, Watanabe and Nagata2018) studied the TNTI in supersonic temporally evolving turbulent boundary layers at incoming Mach number 1.6. They showed that the compressibility effects are almost negligible for the entrainment near the TNTI because of the low level of compressibility in the outer region of the turbulent boundary layer. To the best of the authors’ knowledge, the study of the compressibility at the internal interfaces in compressible turbulent mixing layers has never been done.

The purpose of this paper is to explore the compressibility effects on the internal interfaces of LSSs in the turbulent mixing layers at various Mach numbers. The interfaces of two neighbouring high- and low-speed LSSs are directly defined as the isosurface of the velocity fluctuation $u^\prime = 0$. The general properties of the interface are provided to examine the rationality of this definition. The turbulent structures and compressibility near the interfaces of LSSs are investigated through conditionally averaging the turbulent flow fields. Meanwhile, the effect of interface orientation is analysed to gain a better understanding of the interaction between large- and small-scale structures. The paper is organized as follows. A brief description of the direct numerical simulation (DNS) of compressible turbulent mixing layers is provided in § 2. In § 3, we then provide in detail our results. Finally, conclusions are drawn in § 4.

2. Direct numerical simulation of compressible mixing layers

The DNS data of a temporally evolving compressible mixing layer for three convective Mach numbers are obtained by solving the unsteady, three-dimensional, compressible Navier–Stokes equations in the non-dimensional conservative form. In this section, a brief description of the numerical simulations is presented. Figure 1 is a schematic of the flow configuration considered in the present work. The coordinate system $x$, $y$ and $z$ refers to the streamwise, vertical and spanwise directions, respectively, and $u$, $v$ and $w$ denote the instantaneous velocity components in the corresponding directions. The computational domain with lengths $L_x \times L_y \times L_z = 314 \delta _\theta ^0 \times 314 \delta _\theta ^0 \times 157 \delta _\theta ^0$ in the streamwise, vertical and spanwise directions is discretized uniformly with the number of grid points equal to $N_x \times N_y \times N_z = 1024 \times 1024 \times 512$, where $\delta _\theta ^0$ is the initial momentum thickness (Vreman, Sandham & Luo Reference Vreman, Sandham and Luo1996). Boundary conditions are periodic in the homogeneous streamwise and spanwise directions. To allow periodic configuration in the vertical direction, the mean streamwise velocity is initialized by a hyperbolic tangent profile with two shear layers (one is located at the middle and the other at the boundary of transverse direction),

(2.1)\begin{equation} \tilde{u} = \frac{1}{2}\Delta U \left[ \text{tanh}\left(\frac{y }{2C_\delta\delta_\theta^0}\right) -\text{tanh}\left(\frac{y+L_y/2}{2C_\delta\delta_\theta^0}\right) +\text{tanh}\left(\frac{y-L_y/2}{2C_\delta\delta_\theta^0}\right) \right], \end{equation}

where $\tilde {u}$ is the Favre average of streamwise velocity, and $C_\delta$ is an adjustment constant that is determined by the initial momentum thickness $\delta _\theta ^0$ (Vaghefi Reference Vaghefi2014; Vaghefi & Madnia Reference Vaghefi and Madnia2015; Wang et al. Reference Wang, Wang and Chen2022). The mean vertical and spanwise velocities are set to zero. The initial temperature is obtained from the Busemann–Crocco relationship (Ragab & Wu Reference Ragab and Wu1989). The pressure field is uniform. The density field is acquired from the ideal gas equation of state. A numerical diffusion zone (red-dashed rectangles in figure 1) is applied near the vertical boundary, which can reduce the intensity of possible disturbances at the vertical boundary such that there is a negligible effect on the mixing layer (Reckinger, Livescu & Vasilyev Reference Reckinger, Livescu and Vasilyev2016). In order to accelerate the transition to turbulence, a spatially correlated perturbation velocity field obtained by the digital filter method (Klein, Sadiki & Janicka Reference Klein, Sadiki and Janicka2003) is superposed on mean velocities. The filtering length is chosen as the vorticity thickness, computed by $\delta _\omega =\Delta U/({\rm d}\tilde {u}/{{\rm d}y})_{max}$, in each direction.

Figure 1. Schematic of the temporally evolving shear layer. The black solid curve represents the mean velocity profile, while the contour map displays the instantaneous temperature in the $x\unicode{x2013}y$ plane. The red-dashed rectangles denote the boundaries of the sponge layers at the vertical boundary.

The numerical simulation has been performed for three different convective Mach numbers, $M_c = 0.2, 0.8, 1.8$, using a high-order hybrid numerical scheme proposed by Wang et al. (Reference Wang, Wang, Xiao, Shi and Chen2010). The convective Mach number is defined as $M_c=\Delta U/(2c_\infty )$, where $\Delta U$ is the free stream velocity difference across the shear layer and $c_\infty$ is the speed of sound in the free stream, respectively. Several key non-dimensional flow parameters corresponding to the self-similar period at the centreline are presented in table 1. The self-similar period is carefully determined by analysing the time evolution of the mean velocity, Reynolds stresses and integrated transfer terms of turbulent kinetic energy. The resulting time duration of the self-similar period is from $\tau _0$ to $\tau _f$. The statistics are functions of normalized time $\tau = t\Delta U/\delta _\theta ^0$. The turbulent Mach number $M_t={\sqrt {{2K}}}/{c}$ ranges from 0.1 to 0.6, where $K$ is the turbulent kinetic energy and $c$ is the average speed of sound. The lowest turbulent Mach number case corresponds to a nearly incompressible condition, while the highest turbulent Mach number case almost approaches the strongest compressibility effects, as reported in the literature of numerical simulations (Pantano & Sarkar Reference Pantano and Sarkar2002; Arun et al. Reference Arun, Sameen, Srinivasan and Girimaji2019; Wang et al. Reference Wang, Wang and Chen2022), to the best of our knowledge. The Reynolds numbers based on the momentum thickness $Re_\theta$, the vorticity thickness $Re_\omega$ and the Taylor microscale $Re_\lambda$ are defined as

(2.2ac)\begin{equation} Re_\theta = \frac{\rho_\infty \Delta U \delta_\theta}{\mu_\infty},\quad Re_\omega = \frac{\rho_\infty \Delta U \delta_\omega}{\mu_\infty},\quad Re_\lambda = 2K\sqrt{\frac{5\rho}{\mu\epsilon}}, \end{equation}

respectively, where $\epsilon$ is the turbulent kinetic energy dissipation rate per unit mass, and $\mu$ is the viscosity coefficient. The initial momentum thickness Reynolds number is $Re_\theta = 320$. The integral length scales in the streamwise direction $(l_x)$ and spanwise direction $(l_z)$ are sufficiently small compared with the length of the computational domain, ensuring that the self-similar growth of LSSs is not confined. In terms of the local Kolmogorov length scale $\eta =( {\mu ^3}/{(\rho ^3\epsilon )} )^{1/4}$, the resolution parameter $\eta /\Delta x$ is in the range $0.42 \leqslant \eta /\Delta x \leqslant 1.05$ at the centreline, where $\Delta x$ is the grid length in each direction, indicating that the resolution of the present simulations is fine enough to resolve the smallest scales in the flow, as given in table 1. The statistics are obtained by plane averaging along the homogeneous $x$ and $z$ directions and ensemble averaging of repeated simulations. The Reynolds average of a variable $\phi$ is denoted by $\langle \phi \rangle$, while the Reynolds fluctuations are denoted as $\phi ^\prime =\phi -\langle \phi \rangle$. It can be observed that, under the same initial Reynolds number, the Taylor microscale $Re_\lambda$ decreases with an increase in the convective Mach number during the self-similar stage of the mixing layer. The root-mean-square (r.m.s.) value of vorticity and velocity divergence are computed by $\omega _{rms}= \sqrt {\langle \omega ^2_1+\omega ^2_2+\omega ^2_3\rangle }$ and $\varTheta _{rms}= \sqrt {\langle {\varTheta ^2}\rangle }$, where $\omega _i$ is vorticity component and $\varTheta = \partial u^\prime _k/\partial x_k$. They are normalized by $(\Delta U/\delta _\omega )$. As the convective Mach number increases, the r.m.s. dilatation, $\varTheta _{rms}$, evidently increases, while the r.m.s. vorticity magnitude, $\omega _{rms}$, decreases, indicating that the small-scale energy is inhibited at a high dilatation level. A detailed description and a comprehensive validation of the DNS can be found in previous work by Wang et al. (Reference Wang, Wang and Chen2022).

Table 1. Simulation parameters at the beginning ($\tau =\tau _0$) and end ($\tau =\tau _f$) of the self-similar period. The values of $M_t$, $Re_{\lambda }$, $K$, $\omega$, $\varTheta _{rms}$, $\eta$, $l_x$ and $l_z$ are obtained at $y = 0$.

3. Numerical results

3.1. Characteristic scales of turbulence

In a turbulent mixing layer, the large-scale Kelvin–Helmholtz rollers and high- and low-speed structures are the largest coherent features which scale with the thickness of the mixing layer (Rogers & Moser Reference Rogers and Moser1994; Balaras, Piomelli & Wallace Reference Balaras, Piomelli and Wallace2001; Mungal Reference Mungal1995; Pirozzoli et al. Reference Pirozzoli, Bernardini, Marié and Grasso2015; Wang et al. Reference Wang, Wang and Chen2022). The momentum thickness ($\delta _\theta$) and vorticity thickness ($\delta _\omega$) are most commonly used to describe the thickness of the mixing layer. The former is defined as

(3.1)\begin{equation} \delta_\theta = \frac{1}{\rho_\infty \Delta U^2}\int_{-\infty}^{+\infty} \langle \rho \rangle \left( \Delta U/2-\tilde{u} \right)\left( \Delta U/2+\tilde{u} \right){\rm d}y. \end{equation}

The vorticity thickness is defined as $\delta _\omega =\Delta U/({\rm d}\langle u \rangle /{{\rm d}y})_{max}$ (Vreman et al. Reference Vreman, Sandham and Luo1996). In the self-similar periods, the two mixing layer thicknesses grow linearly with time (Rogers & Moser Reference Rogers and Moser1994; Pantano & Sarkar Reference Pantano and Sarkar2002; Wang et al. Reference Wang, Wang and Chen2022).

Figure 2 shows the ratio of the momentum thickness to the vorticity thickness for cases with convective Mach numbers $M_c = 0.2, 0.8, 1.8$. In the self-similar periods, the thickness ratio $\delta _\theta /\delta _\omega$ is nearly constant with time and decreases from 0.19 to 0.14 as the convective Mach number increases from 0.2 to 1.8. It has been found that the mean streamwise velocity profiles at different convective Mach numbers collapse very well when scaled with the free stream velocity difference $\Delta U$ and vorticity thickness $\delta _\omega$, and hence the vorticity thickness is used as an estimate of the integral scale of the mixing layer in the present work (Baltzer & Livescu Reference Baltzer and Livescu2020; Wang et al. Reference Wang, Wang and Chen2022).

Figure 2. Time evolution of the thickness ratio $\delta _\theta /\delta _\omega$ at $M_c=0.2, 0.8$ and $1.8$. The vertical line segments mark the self-similar periods.

According to Kolmogorov's turbulence theory (Kolmogorov Reference Kolmogorov1941), the characteristic length scale of the smallest turbulent structures is given by the Kolmogorov length scale $\eta$, and the corresponding characteristic velocity is the Kolmogorov velocity $u_\eta =( \mu \epsilon /\rho )^{1/4}$. In figure 3(a), we plot the time evolution of the Kolmogorov length $\eta$ which is normalized by the vorticity thickness $\delta _\omega$ at $M_c=0.2$, $0.8$ and $1.8$. The normalized Kolmogorov length $\eta /\delta _\omega$ decreases exponentially with time in the self-similar periods, indicating an increasing scale separation between the small and integral scales of the turbulent mixing layer. As the convective Mach number increases, $\eta /\delta _\omega$ evidently increases, demonstrating that the compressibility suppresses the small-scale structures, and thus decreases the scale separation. As shown in figure 3(b), the normalized Kolmogorov velocity $u_\eta /\Delta U$ also decreases with time, while it slightly depends on the convective Mach number.

Figure 3. Time evolution of (a) the normalized Kolmogorov length $\eta /\delta _\omega$ and (b) normalized Kolmogorov velocity $u_\eta /\Delta U$ at $M_c=0.2, 0.8$ and $1.8$. The length $\eta$, and velocity $u_\eta$ are evaluated at the centreline of the mixing layer. The vertical line segments mark the self-similar periods.

3.2. General properties of interfaces of LSSs

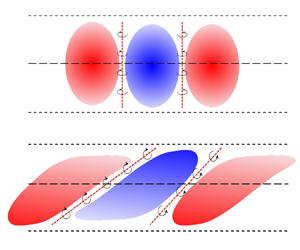
Figure 4 shows a two-dimensional schematic of high- and low-speed LSSs and small vortical structures near their interfaces. The shapes of high- and low-speed LSSs are reconstructed from the two-point correlations of fluctuating streamwise velocity reported by Wang et al. (Reference Wang, Wang and Chen2022). For ISL, edges of UMZs and TNTI, several identification approaches have been proposed to detect the location of these interfaces (Adrian et al. Reference Adrian, Meinhart and Tonkins2000; Kolář Reference Kolář2007; Fan et al. Reference Fan, Xu, Yao and Hickey2019). In the present work, we find that the isosurfaces of $u^\prime = 0$ provide a full three-dimensional description of the interfaces of two neighbouring high- and low-speed LSSs in a fluctuating velocity field. In this section, we report several general properties of the interfaces.

Figure 4. Schematic of the high- and low-speed LSSs and small vortical structures near their interfaces in the (a) $x\unicode{x2013}y$ and (b) $z\unicode{x2013}y$ planes. The red and blue regions indicate the high- and low-speed LSSs, respectively. The red bold dashed line represents the interfaces superposed with small-scale vortices. The red arrow indicates the normal vector of the interface directed into low-speed region. The black circle with arrow indicates the small-scale vortex.

In figure 5(a), we plot five randomly selected streamwise velocity profiles. The instantaneous streamwise velocity $u/\Delta U$ in the vertical direction ($y$) presents a step-like profile with sharp changes in momentum indicating the existence of UMZs (highlighted in black-dashed ellipsoids), similar to that in turbulent boundary layers (De Silva et al. Reference De Silva, Philip, Hutchins and Marusic2017). In contrast, there is no evidence of UMZs in the profile of the fluctuating streamwise velocity $u^\prime /\Delta U$ which is constantly being used to signify the large-scale turbulent structures in turbulent shear flows, including turbulent boundary layer, jet and mixing layer (Lee et al. Reference Lee, Lee, Choi and Sung2014; Samie, Lavoie & Pollard Reference Samie, Lavoie and Pollard2021; Wang et al. Reference Wang, Wang and Chen2022). The corresponding profiles of the velocity gradient are shown in figure 5(b). We can find that the vertical gradients of the instantaneous streamwise velocity $u/\Delta U$ and fluctuating streamwise velocity $u^\prime /\Delta U$ almost overlap with each other. The magnitudes of the velocity gradients of $u/\Delta U$ and $u^\prime /\Delta U$ in high shear regions are much higher than (several times greater than) the maximum gradient of mean streamwise velocity. It is evident that the magnitude of positive gradients of the instantaneous and fluctuating streamwise velocity significantly exceeds that of negative velocity gradients. This is consistent with the observed behaviour of streamwise velocity gradients in turbulent boundary layers (De Silva et al. Reference De Silva, Philip, Hutchins and Marusic2017) and mixing layers (Fiscaletti et al. Reference Fiscaletti, Buxton and Attili2021).

Figure 5. (a) Comparison between the vertical profiles of instantaneous streamwise velocity $u/\Delta U$ (red), fluctuating streamwise velocity $u^\prime /\Delta U$ (green) and mean streamwise velocity $\langle u \rangle /\Delta U$ (blue) at five equally spaced streamwise location from a snapshot for $M_c = 1.8$ at $\tau = 1750$, and (b) the corresponding profiles of the vertical gradients of them.

We present instantaneous visualizations of the spanwise vorticity $\omega _z$ in figure 6(a,b), the vertical vorticity $\omega _y$ in figure 6(c,d) and the streamwise vorticity $\omega _x$ in figure 6(e,f) at $M_c = 0.2$ and $1.8$. Here, the contour lines of $u^\prime /\Delta U=-0.1$ and $0.1$ are overlaid to display the high- and low-speed large-scale regions, instead of $u^\prime /\Delta U=0.0$, in order to give a qualitative impression of the velocity gradient which can be visualized by the distance between the two contour lines. The high shear regions (high-velocity gradients) are visualized by the colour contours of vorticity components. At $M_c=0.2$, the contour lines of $u^\prime /\Delta U=-0.1$ and $0.1$ obviously extend into the free stream, with characteristic sizes of the order of mixing layer thickness, which indicates the potential perturbations produced by the turbulence within the mixing layer. This observation is consistent with the previous study of a weakly compressible mixing layer by Almagro, Garciá-Villalba & Flores (Reference Almagro, Garciá-Villalba and Flores2017). It is convenient to utilize the TNTI as the outer edge of LSSs instead of the outer parts of the contour lines of $u^\prime /\Delta U=0$, similar to the outer edge of UMZs (De Silva et al. Reference De Silva, Philip, Hutchins and Marusic2017; Fan et al. Reference Fan, Xu, Yao and Hickey2019). Only the interfaces of LSSs within the turbulent region are studied in the following. At $M_c=0.2$, the contour lines of $u^\prime /\Delta U=-0.1$ and $0.1$ almost overlap with each other in the turbulent region, while there exists an evident separation between them at $M_c=1.8$, indicating the decrease of velocity gradient at points with $u^\prime /\Delta U=0$ as the convective Mach number increases. A significant proportion of the high shear regions (high vorticity) is concentrated in the near vicinity of the interfaces of LSSs, which is more obvious in figure 6(b,d,f) for higher convective Mach number $M_c=1.8$. At low convective Mach number $M_c=0.2$, the contour lines are complicated and tortuous with a concentration of small fragments, while they appear to be smoother and have fewer small structures at a higher convective Mach number $M_c=1.8$, indicating that the interfaces become stable as the convective Mach number increases. This stabilizing effect of compressibility on interfaces of LSSs resembles the behaviour of interfaces of UMZs with decreasing Reynolds number found by De Silva et al. (Reference De Silva, Philip, Hutchins and Marusic2017) in turbulent boundary layers. Meanwhile, we can see that the high shear regions are intermittently distributed on the continuous interfaces detected as isocontours of fluctuating streamwise velocity $u^\prime$. This is consistent with previous studies on edges of the UMZs in wall-bounded (De Silva et al. Reference De Silva, Philip, Hutchins and Marusic2017; Gul et al. Reference Gul, Elsinga and Westerweel2020) and free shear turbulence (Fiscaletti et al. Reference Fiscaletti, Buxton and Attili2021).

Figure 6. Instantaneous visualization of contour lines of $u^\prime /\Delta U=-0.1$ and $0.1$ at (a,c,e) $M_c=0.2$ and (b,d,f) $M_c=1.8$, overlaid on colour contours of (a,b) spanwise vorticity $\omega _z$ in $x\unicode{x2013}y$ plane, (c,d) vertical vorticity $\omega _y$ in $x\unicode{x2013}z$ plane and (e,f) streamwise vorticity $\omega _x$ in $y\unicode{x2013}z$ plane.

In order to quantitatively illustrate the correlation between interfaces of LSSs (zero-$u^\prime$ isosurfaces) and high vorticity regions, we plot the joint probability density function ( p.d.f.) of the normalized vorticity components $\omega _i/\omega _{rms}$ and the normalized fluctuating streamwise velocity $u^\prime /\Delta U$ at convective Mach numbers $M_c =0.2$ in figure 7(a). It is found that the maximum of the p.d.f. for high values of $\omega _i/\omega _{rms}$ tends to appear at $u^\prime /\Delta U \approx 0$. The joint p.d.f.s of $(\omega _x/\omega _{rms},u^\prime /\Delta U)$ and $(\omega _y/\omega _{rms},u^\prime /\Delta U)$ are almost symmetric with respect to the line $\omega _x=0$ and $\omega _y=0$, respectively. However, the joint p.d.f. of ($\omega _z/\omega _{rms}$,$u^\prime /\Delta U$) is slightly negatively skewed (where $\omega _z=\partial {v}/\partial {x}-\partial {u}/\partial {y}$), indicating that the positive vertical gradient of the streamwise velocity occurs more frequently than the negative one, which is consistent with the observation in figure 5(b). As the convective Mach number increases from 0.2 to 1.8, the joint p.d.f. of ($\omega _z/\omega _{rms}$,$u^\prime /\Delta U$) significantly decreases along the abscissa, as shown in figure 7(b), indicating the stabilizing effect of compressibility on small-scale vortical structures in the turbulent mixing layer. The joint p.d.f.s of ($\omega _x/\omega _{rms}$,$u^\prime /\Delta U$) and ($\omega _y/\omega _{rms}$,$u^\prime /\Delta U$) at different convective Mach numbers resemble that of ($\omega _z/\omega _{rms}$,$u^\prime /\Delta U$) and are omitted here for the sake of brevity. The joint p.d.f. and visualization in figure 6 confirm that the interfaces of LSSs can be detected by zero-$u^\prime$ isosurfaces within the mixing layer. As previously mentioned, the UMZs and high- and low-speed LSSs arise from the observation of large-scale motions in different reference frames. The UMZs are typically observed in the laboratory frame within the instantaneous velocity field, whereas the LSSs are derived from the Reynolds-decomposed or fluctuating velocity field (de Silva et al. Reference de Silva, Hutchins and Marusic2016; Saxton-Fox & McKeon Reference Saxton-Fox and McKeon2017; Gul et al. Reference Gul, Elsinga and Westerweel2020; Heisel et al. Reference Heisel, De Silva, Hutchins, Marusic and Guala2021). The connection between the interfaces of UMZs and those of high- and low-speed LSSs remains an open question, and a preliminary analysis is offered in the Appendix A.

Figure 7. Isocontour lines of (a) $\log _{10}$ p.d.f. ($\omega _i$,$u^\prime$) at $M_c=0.2$ and (b) $\log _{10}$ p.d.f. ($\omega _z$,$u^\prime$) for three different convective Mach numbers $M_c =0.2$, $0.8$ and $1.8$. Four contour lines at $-1,-2,-3$ and $-4$ are shown.

The orientation of the interfaces of LSSs can be distinguished by its unit normal vector defined as $\boldsymbol {n}= -\boldsymbol {\nabla } {u}^\prime /|\boldsymbol {\nabla } {u}^\prime |$, and its three components are equal to $\cos (\psi _i)$, where $\psi _i$ ($i=x$, $y$ and $z$) is the interface angle between the normal unit vector and three coordinate axes $x, y$ and $z,$ respectively. The unit normal vector of the interface is indicated by red arrows in figure 4. Figure 8 shows the p.d.f.s of the cosine of interface angles for low-speed LSSs, namely p.d.f. of $\cos (\psi _x)$, $\cos (\psi _y)$ and $\cos (\psi _z)$, at three different convective Mach numbers $M_c =0.2, 0.8$ and $1.8$. The p.d.f. of $\cos (\psi _x)$ shows two peaks near $\cos (\psi _x) = \pm 0.1$. The p.d.f. also shows a bimodal distribution with peaks at $-0.98$ and $0.92$ for $\cos (\psi _y)$, and $-0.95$ and $0.95$ for $\cos (\psi _z)$. These results indicate that most interfaces are approximately parallel to the streamwise direction, which is in accordance with the fact that LSSs are highly elongated in the streamwise direction. The most probable orientation of the interfaces is approximately $12^\circ$ with respect to horizontal for the peak of p.d.f. at $\cos (\psi _y)=-0.98$, and $23^\circ$ for the peak of p.d.f. at $\cos (\psi _y)=0.92$. The most probable orientation of $12^\circ$ is in good agreement with the average orientation of $10^\circ \unicode{x2013}15^\circ$ for the ISL reported in turbulent boundary layers (Squire Reference Squire2016; Heisel et al. Reference Heisel, De Silva, Hutchins, Marusic and Guala2021), which is crucial information for understanding these turbulent structures and holds significant importance for turbulence modelling. It is interesting to note that the peak of p.d.f. at $\cos (\psi _y) = -0.98$ is clearly higher than the peak at $\cos (\psi _y) = 0.92$, indicating a preferential orientation of the interfaces of LSSs in the negative vertical direction. A much weaker preferential orientation also can be found in the p.d.f. of $\cos (\psi _x)$. In addition, we find that the percentage of interfaces characterized by $\cos (\psi _y) <0$, oriented in the negative $y$-direction, is approximately 55 % of the total interfaces. In the incompressible mixing layer, Fiscaletti et al. (Reference Fiscaletti, Buxton and Attili2021) reported that ISLs with $\partial u /\partial y >0$ (equivalent to $\cos (\psi _y) <0$) are found between 60 % and 70 %. It should be pointed out that the ISLs are only part of the overall interfaces (de Silva et al. Reference de Silva, Hutchins and Marusic2016; Gul et al. Reference Gul, Elsinga and Westerweel2020; Heisel et al. Reference Heisel, De Silva, Hutchins, Marusic and Guala2021). These results show the inhomogeneity of the interfaces of LSSs. The p.d.f.s of $\cos (\psi _z)$ are completely symmetric with respect to the line $\cos (\psi _z)=0$, as shown in figure 8(c), since it is statistically homogeneous in the $z$-direction. The two peaks for all three p.d.f.s of interface orientation angle increase slightly with increasing convective Mach number from 0.2 to 1.8, especially for $\cos (\psi _x)$. The observations are consistent with the previous result that the large-scale high- and low-speed structures in the mixing layers are significantly streamwise elongated to have a smaller inclination angle at a higher convective Mach number (Wang et al. Reference Wang, Wang and Chen2022).

Figure 8. The p.d.f. of the cosines of the angle between (a) the $x$-axis, (b) the $y$-axis, (c) the $z$-axis and the normal unit vector of the interfaces of LSSs at three different convective Mach numbers $M_c =0.2$, $0.8$ and $1.8$.

To highlight the correlation between interface orientation and the three vorticity components, the joint p.d.f. of the normalized vorticity components $\omega _j/\omega _{rms}$ and the cosine of the orientation angle $\cos (\psi _i)$ for low-speed LSSs is plotted in figure 9 for $M_c = 1.8$ at $\tau = 1750$. We can find that the spanwise and vertical vorticity components are highly dependent on the interface orientation, as shown in figures 9(f) and 9(h). As can be seen from figure 9(f), the positive and negative intense spanwise vorticities are largely concentrated in the first and third quadrants of the $\cos (\psi _y)\unicode{x2013}\omega _z$ plane, respectively, with two clear peaks around the most probable orientations of $\cos (\psi _y) \approx \pm 1$. Since the statistics presented here are solely based on the low-speed LSS, it is reasonable to conjecture that the negative and positive spanwise vorticities mainly result from shear between the high- and low-speed LSSs located above and below it, respectively, as shown by a schematic of the high- and low-speed LSSs in figure 4(a). The joint p.d.f. of ($\cos (\psi _z)$, $\omega _y/\omega _{rms}$) is shown in figure 9(h), and the high probability regions of positive and negative vertical vorticities fall in the second and fourth quadrants of $\cos (\psi _z)\unicode{x2013}\omega _y$ plane, with two peaks around the most probable orientations of $\cos (\psi _z) \approx \pm 1$. Similarly, we can expect that the negative and positive vertical vorticities mainly result from shear between the high- and low-speed LSSs located on the left- and right-hand side of it in the spanwise direction, respectively, as shown in figure 4(b). It is noteworthy that the joint p.d.f.s of ($\cos (\psi _i)$, $\omega _z/\omega _{rms}$) are distinctly asymmetric concerning the line $\omega _z/\omega _{rms} =0$ and skewed towards the negative side, suggesting a clear preference for negative spanwise vorticity. At convective Mach numbers $M_c = 0.2$, $0.8$, the joint p.d.f.s show similar behaviour and are not reproduced here for brevity. The interface orientation has a very modest effect on the intensity of the streamwise vorticity component, as shown in figures 9(a), 9(d) and 9(g). At all three convective Mach numbers, the joint p.d.f.s are almost unchanged with time during the self-similar region of the mixing layer.

Figure 9. Isocontours of $\log _{10}$ p.d.f. ($\cos (\psi _i)$, $\omega _j$ ) for $M_c = 1.8$ at $\tau = 1750$. Four contour lines at $-1$, $-2$, $-3$ and $-4$ are shown.

In figure 10, we plot the average of normalized vorticity components $\omega _i/\omega _{rms}$ conditioned on the cosine of interface orientation $\cos (\psi _j)$ for low-speed LSSs. Only the results at $M_c = 1.8$ and $\tau = 1750$ are illustrated in figure 10 since the conditionally averaged vorticity components are similar at all three convective Mach numbers. We find that the conditionally averaged vorticity components are nearly independent of the interface orientation concerning the streamwise direction $\cos (\psi _x)$, due to the cancellation between positive and negative vorticity, which is also presented in figure 9(ac). As shown in figure 10(b), the conditionally averaged spanwise vorticity $\langle \omega _z/\omega _{rms}|\cos (\psi _y)\rangle$ rapidly increases up to $1$ as $\cos (\psi _y)$ increases from $0.5$ to $1$, and decreases to $-1$ as $\cos (\psi _y)$ decreases from $-0.5$ to $-1$. The other two vorticity components $\langle \omega _x/\omega _{rms}|\cos (\psi _y)\rangle$ and $\langle \omega _y/\omega _{rms}|\cos (\psi _y)\rangle$ are almost independent of $\cos (\psi _y)$. From figure 10(c), it is interesting to find that $\langle \omega _y/\omega _{rms}|\cos (\psi _z)\rangle$ decreases linearly from $0.75$ to $-0.75$ as $\cos (\psi _z)$ increases from $-1$ to $1$. The streamwise vorticity $\langle \omega _x/\omega _{rms}|\cos (\psi _z)\rangle$ is also a linear function of $\cos (\psi _z)$ and is much smaller than the vertical vorticity. Here, $\langle \omega _z/\omega _{rms}|\cos (\psi _z)\rangle$ is small and always negative. Considering the dynamics of high- and low-speed LSSs and the definition of vorticity, one can expect that the large value of vorticity components $\omega _z=\partial v/\partial x-\partial u/\partial y$ and $\omega _y=\partial u/\partial z-\partial w/\partial x$ are caused by the vertical shear (see figure 4a) and the lateral shear (see figure 4b) of the adjacent LSSs, respectively.

Figure 10. Average of normalized vorticity components $\omega _i/\omega _{rms}$ conditioned on the cosine of interface orientation $\cos (\psi _j)$ at $M_c = 1.8$ and at $\tau = 1750$.

3.3. Conditionally averaged velocity

The above results show that isosurfaces of $u^\prime = 0$ are suitable for representing the interfaces of high- and low-speed LSSs in the fluctuating velocity field. In order to obtain conditional statistics with respect to the distance from the interface, an interface coordinate ($\xi$) is introduced with its origin located at the interface, as indicated by red arrows in figure 4. The interface coordinate $\xi$ is set to be parallel to the unit normal vector defined as $\boldsymbol {n}= -\boldsymbol {\nabla } {u}^\prime /|\boldsymbol {\nabla } {u}^\prime |$, where $\xi >0$ directs into the low-speed region. Since the interface is a continuous three-dimensional surface, the unit normal vector can point along any direction within the three-dimensional space. The value of a flow variable in the interface coordinate $\xi$ is calculated from its neighbouring points in computational coordinates using trilinear interpolation. We denote the conditional average statistics in the interface coordinate by $\langle \,\cdot\, \rangle _I$. Only the interfaces of low-speed LSS within the turbulent region are studied in the present paper. An isoline of the r.m.s. vorticity magnitude $\omega _{rms}=0.01\Delta U/\delta _{\theta }^0$ is selected as the nominal threshold to identify the TNTI (Jahanbakhshi & Madnia Reference Jahanbakhshi and Madnia2016; Watanabe, Zhang & Nagata Reference Watanabe, Zhang and Nagata2018; Wang et al. Reference Wang, Wang and Chen2022).

Figure 11 shows the conditionally averaged profiles of the streamwise velocity across the internal interfaces of LSSs at different non-dimensional times $\tau = t\Delta U/\delta _\theta ^0$. We can observe a sharp rise of streamwise velocity across a thin thickness, which is similar to that observed at the edges of UMZs and the TNTI (Chauhan, Philip & Marusic Reference Chauhan, Philip and Marusic2014; de Silva et al. Reference de Silva, Hutchins and Marusic2016; Nagata et al. Reference Nagata, Watanabe and Nagata2018). These conditionally averaged profiles of the streamwise velocity exhibit large positive and negative peaks, and their magnitudes decrease linearly with the distance from the centre of the interface layer at the far-field region. There is a mild overshoot of conditionally averaged streamwise velocity near the interface, especially at lower convective Mach number $M_c=0.2$. It can be seen that the velocity jump at the interfaces grows rapidly with time, and reaches a maximum value in the transition stage at $\tau =125$ for low and moderate convective Mach numbers of $M_c=0.2$ and $0.8$, while at a later time of $\tau =250$ for $M_c=1.8$. Then, the conditionally averaged streamwise velocity decreases until reaching a gradual development stage in the self-similar period. The evolution process of interfaces at $M_c=0.2$ and $0.8$ during the transition stage is evidently faster than that at $M_c=1.8$, consistent with the overall behaviour of the development of the mixing layers.

Figure 11. Conditionally averaged streamwise velocity profiles in the near vicinity of all detected internal interfaces at three times inside the transition stage and three times inside the self-similar stage of the mixing layer: (a) $M_c=0.2$; (b) $M_c=0.8$; (c) $M_c=1.8$. The red solid lines correspond to profile at the initial field.

Figure 12 shows the conditionally averaged streamwise velocity normalized by Kolmogorov velocity $u_\eta$ as a function of $\xi /\eta$ at $M_c=0.2$, $0.8$ and $1.8$ in the self-similar period. In this figure, $u_\eta$ and $\eta$ are the values computed at the centreline. The profiles show a fairly good collapse around the centre of the interface when normalized by the Kolmogorov scales, but they start to slightly deviate from each other in the far-field region. This result indicates that the internal interfaces of LSSs are dominated by the smallest structures characterized by the Kolmogorov length scale.

Figure 12. Conditionally averaged streamwise velocity profiles at different times in the self-similar period for (a) $M_c=0.2$, (b) $M_c=0.8$ and (c) $M_c=1.8$. Profiles are normalized by the Kolmogorov length $\eta$ and velocity $u_\eta$.

The thickness of the ISL is typically estimated by projecting linear fits to the regions above and below the sharp velocity change on the profile of the conditionally averaged streamwise velocity, assuming the internal shear layer is a mixing layer (De Silva et al. Reference De Silva, Philip, Hutchins and Marusic2017; Chen et al. Reference Chen, Chung and Wan2020; Fiscaletti et al. Reference Fiscaletti, Buxton and Attili2021). The thickness can also simply be estimated as the distance between the negative and positive peaks of the streamwise velocity, giving rise to a slightly larger thickness than the former method (Eisma et al. Reference Eisma, Westerweel, Ooms and Elsinga2015; Hayashi et al. Reference Hayashi, Watanabe and Nagata2021; Heisel et al. Reference Heisel, De Silva, Hutchins, Marusic and Guala2021). Using the first method, the thickness of the interfaces within the mixing layer is found to be between $8\eta$ to $9\eta$, which is consistent with the typical internal shear layer thickness of $10\eta$ observed in the turbulent free-shear flows by Fiscaletti et al. (Reference Fiscaletti, Buxton and Attili2021) and in the outer region of the turbulent boundary layer by Eisma et al. (Reference Eisma, Westerweel, Ooms and Elsinga2015). The velocity jump, or velocity difference between the negative and positive peaks of the streamwise velocity is approximately $6 u_\eta$. The thickness and velocity jump are nearly independent of the convective Mach numbers, indicating the similarity of small-scale flow structures. We note that the conditional statistics are weakly dependent on momentum thickness Reynolds numbers $Re_\theta$ increasing from 3768 to 4798 at $M_c=0.2$ and from 3036 to 5232 at $M_c=1.8$, therefore, an even wider $Re$ range would be necessary to fully examine the appropriate characteristic scales in the future.

Figure 13 depicts the conditionally averaged streamwise velocity normalized by $\Delta U$ as a function of $\xi /\delta _\omega$ at $M_c=0.2$, $0.8$ and $1.8$. It is shown that the profiles collapse in a thinner layer around the centre of the interface, while they start to deviate from each other around the peaks. The velocity difference is approximately $0.1\Delta U$ and decreases with time or with an increase in the Reynolds number, which is in agreement with the results reported by Fiscaletti et al. (Reference Fiscaletti, Buxton and Attili2021) in turbulent free-shear flows. This result can be explained by the increasing scale separation as the Reynolds number increases with time; that is, the Kolmogorov velocity $u_\eta /\Delta U$ dominating the interfaces decreases with time, as shown in figure 3(b). For a mixing layer, the maximum velocity gradient is generally used to define its vorticity thickness as $\delta _\omega =\Delta U/({\rm d}\langle u \rangle /{{\rm d}y})_{max}$. When normalized by the $\Delta U$ and $\delta _\omega$, the maximum gradient of the mean streamwise velocity $({\rm d}\langle u \rangle /{{\rm d}y})_{max}$ for the mixing layer is approximately 1 and located at the centreline (Wang et al. Reference Wang, Wang and Chen2022). From figure 13, we can see that the normalized maximum gradient of the conditionally averaged streamwise velocity decreases from $-7$ to $-5$ as the convective Mach number increases from $0.2$ to $1.8$. This result suggests that the velocity gradient at the interfaces is almost one order of magnitude larger than that of the mean streamwise velocity, confirming the qualitative conclusion shown in figure 5(b). Another important result is that, under integral scales $\delta _\omega$ and $\Delta U$, the maximum gradient of the conditionally averaged streamwise velocity at the interfaces of LSSs is significantly suppressed by compressibility, and the relative reduction of the maximum gradient can reach up to 40 % for $M_c = 1.8$.

Figure 13. Conditionally averaged streamwise velocity profiles at different times in the self-similar period for (a) $M_c=0.2$, (b) $M_c=0.8$ and (c) $M_c=1.8$. Profiles are normalized by the vorticity thickness $\delta _\omega$ and the velocity difference across the shear layer $\Delta U$.

Noting that the referenced existing studies in this section, including Eisma et al. (Reference Eisma, Westerweel, Ooms and Elsinga2015) and Fiscaletti et al. (Reference Fiscaletti, Buxton and Attili2021), calculate the velocity jump based on the average distribution of instantaneous velocity obtained at the internal shear layer (as the interface of UMZs). In contrast, our velocity jump is determined by the average fluctuating velocity at the interface of LSSs. Although the two velocity jumps exhibit some degree of agreement, noticeable differences exist in the average of fluctuating velocities at the interface of UMZs and the interface of LSSs, as shown in the Appendix A.

3.4. Effect of interface orientation

In § 3.2, we found that the orientation angle has an obvious influence on the shear strength (vorticity). The conditional statistics are computed separately for the leading, trailing and side edges to investigate the dependence on the interface orientation. The leading and trailing edges are defined as $\cos (\psi _y)<-0.5$ and $\cos (\psi _y)>0.5$, respectively. These definitions are based on the value of the interface angle ($\psi _y$), instead of $\psi _x$ used in previous works on TNTI, taking into account that the LSSs are highly elongated in the streamwise direction like a baguette. Similarly, the side edge is defined as $|\cos (\psi _z)|>0.5$, where the absolute value of the angle is considered because of homogeneity in the spanwise direction. It is worth noting that the selection of the interface angle criterion $\cos (\psi _c)=0.5$ is similar to the works of Zhang, Watanabe & Nagata (Reference Zhang, Watanabe and Nagata2019) and is a critical value beyond which the magnitude of conditionally averaged spanwise vorticity $\langle \omega _z/\omega _{rms}|\cos (\psi _y)\rangle$ rapidly increases, as shown in figure 10. The sensitivity of the results to the interface angle criterion $\cos (\psi _c)$ will be discussed in the following.

The influence of the orientation angle on the conditionally averaged streamwise velocity is shown in figure 14. The distance from the interface is normalized by the vorticity thickness of the mixing layer $\delta _\omega$. It is clearly seen that velocity jump strongly depends on the interface orientation. The magnitude of the streamwise velocity jump is greater at the leading edge than that at the entire edge, but smaller at the trailing edge. At the side edge, the streamwise velocity is slightly larger than that of the entire edge. The peak position of the profile weakly depends on the interface orientation, and the overshoot is more obvious at the trailing edge. A zoomed-in view of the same area of the interface layer is provided for all three convective Mach numbers. The interface orientation effect appears more clearly in the zoomed-in insets of figure 14, indicating that the magnitude of the velocity gradients at the leading edge is significantly higher than that at the trailing edge. On the other hand, the zoomed region of figure 14 reveals that the velocity gradient at different interface orientations decreases as the convective Mach number increases from $M_c=0.2$ to $1.8$.

Figure 14. Conditionally averaged streamwise velocity at different edges for (a) $M_c=0.2$, (b) $M_c=0.8$ and (c) $M_c=1.8$. The enlarged views near the centre are shown in the insets.

The conditionally averaged profiles of the vertical velocity at different interface orientations are presented in figure 15. The vertical velocity is found to have a stronger dependence on the interface orientation and unexpectedly changes sign near the trailing edge. Near the leading edge and side edge, the vertical velocity is negatively correlated with the streamwise velocity, which is consistent with the scenario of $Q$2 events (defined by $\langle u^\prime \rangle _I <0$ and $\langle v^\prime \rangle _I >0$) on the low-speed side ($\xi >0$) and $Q$4 events (defined by $\langle u^\prime \rangle _I >0$ and $\langle v^\prime \rangle _I <0$ ) on the high-speed side ($\xi <0$). The $Q$2 and $Q$4 events contribute significantly to the negative Reynolds shear stress and the positive turbulence production (Wallace Reference Wallace2016; Arun et al. Reference Arun, Sameen, Srinivasan and Girimaji2019; Wang et al. Reference Wang, Wang and Chen2022). The vertical velocity at the trailing edge is smaller than that at the leading and side edges, inferring a degree of stabilizing of the interface here. At $M_c=0.2$ and $0.8$, the vertical velocity near the trailing edge is positive in the high-speed region ($\xi <0$) and negative in the low-speed region ($\xi >0$), which is inconsistent with $Q$2 and $Q$4 events, while it changes sign away from the centre of the interface. At a high convective Mach number $M_c=1.8$, it is interesting to observe that the vertical velocity at the trailing edge has a plateau between $\xi /\delta _\omega =-0.01$ and $0.01$.

Figure 15. Conditionally averaged vertical velocity at different edges for (a$M_c=0.2$, (b$M_c=0.8$ and (c$M_c=1.8$.

Figure 16(ac) shows the conditionally averaged profiles of vertical velocity at the trailing edge identified using different values of interface angle criterion $|\cos (\psi _c)| =0.2$, $0.5$ and $0.8$. We can find that the vertical velocity at the trailing edge is very sensitive to the values of interface angle criterion $\psi _c$. At the small interface angle criterion with $|\cos (\psi _c)| =0.2$, the trailing edge vertical velocity is positive in the low-speed region, and it presents a clear jump at high convective Mach number $M_c=1.8$. As the interface angle criterion increases to $|\cos (\psi _c)| =0.8$, the trailing edge vertical velocity tends to be negative in the low-speed region, and the maximum jump occurs at low convective Mach number $M_c=0.2$. This scenario is consistent with the signature of $Q1$ events (defined by $\langle u^\prime \rangle _I >0$ and $\langle v^\prime \rangle _I >0$) on the high-speed side ($\xi <0$) and $Q$3 events (defined by $\langle u^\prime \rangle _I <0$ and $\langle v^\prime \rangle _I <0$ ) on the low-speed side ($\xi >0$). The $Q$1 and $Q$3 events contribute to the positive Reynolds shear stress and the negative turbulence production (Wallace Reference Wallace2016; Arun et al. Reference Arun, Sameen, Srinivasan and Girimaji2019; Wang et al. Reference Wang, Wang and Chen2022). The conditionally averaged vertical velocity at the leading edge at $M_c=1.8$ is displayed in figure 16(d) for comparison. The profiles are almost coincident for different interface angle criteria. The streamwise velocity for the three interface orientations is insensitive to the choice of the interface angle criterion $\psi _c$ and is not reproduced here for brevity. The mechanism behind this phenomenon will be further revealed in the next section based on the analysis of small-scale turbulent structures near the interface. Based on the above results, it can be suggested that, on average, the downward high-speed LSS (with $\langle u^\prime \rangle _I >0$ and $\langle v^\prime \rangle _I <0$) impinges on the upward low-speed LSS (with $\langle u^\prime \rangle _I <0$ and $\langle v^\prime \rangle _I >0$) at the leading edge, such that the high-speed structure rides over the low-speed structure, as illustrated in figure 4(a). Similar to the analysis by Eisma et al. (Reference Eisma, Westerweel, Ooms and Elsinga2015) on boundary layers, this compression process at the leading edge implies that vorticity stretching occurs in the spanwise ($z$) direction over this interface, which maintains a higher velocity jump and a sharp interface. While at the trailing edge, the downward high-speed LSS deviates from the upward low-speed LSS on average, indicating extensive strain in the $x\unicode{x2013}y$ plane. This results in a weaker velocity jump or shear. This speculative explanation will be verified by the analysis of turbulent structures near the interface in the next section.

Figure 16. Conditionally averaged vertical velocity at the trailing edge identified using different values of interface angle criterion at (a) $M_c=0.2$, (b) $M_c=0.8$ and (c) $M_c=1.8$, compared with (d) that at the leading edge at $M_c=1.8$. The legend is the same for all plots.

3.5. Small-scale structures

We now focus on the small-scale structures near the interface which have been found to be dominated by the Kolmogorov scale. Figure 17 compares the conditional average of the r.m.s. vorticity magnitude $\omega _{rms}$ near the leading, side and trailing edges at convective Mach numbers $M_c=0.2$, $0.8$ and $1.8$. The r.m.s. vorticity magnitude $\omega _{rms}$ is normalized by $(\Delta U/\delta _\omega )$. The distance from the interface, $\xi$, is normalized by the centreline $\eta$ on the top horizontal axis and by $\delta _\omega$ on the bottom horizontal axis. The normalized r.m.s. vorticity magnitude $\langle \omega _{rms} \rangle _I /(\Delta U/\delta _\omega )$ is almost uniform far from the interface and begins to increase rapidly towards the centre of the interface. There is a significant dependence on the interface orientation. In the velocity jump region, $\langle \omega _{rms} \rangle _I /(\Delta U/\delta _\omega )$ is smallest near the trailing edge and largest near the leading edge, consistent with the effect of interface orientation on the velocity jump shown in figure 14. On the contrary, $\langle \omega _{rms} \rangle _I /(\Delta U/\delta _\omega )$ is smallest near the leading edge and largest near the trailing edge outside the velocity jump region. Compared with the entire edge, the r.m.s. vorticity magnitude is amplified at the leading edge and attenuated at the trailing edge. As the convective Mach number increases, $\langle \omega _{rms} \rangle _I /(\Delta U/\delta _\omega )$ decreases rapidly at the three interface orientations, indicating that the small-scale vortical structures are suppressed significantly by compressibility at the interface.

Figure 17. Conditional average of the r.m.s. vorticity magnitude $\omega _{rms}$ at different edges at (a$M_c=0.2$, (b$M_c=0.8$ and (c$M_c=1.8$.

More details on the small-scale structures have been investigated using the second invariant of velocity gradient tensor, namely the $Q$-criterion, proposed by Hunt, Wray & Moin (Reference Hunt, Wray and Moin1988). This technique was originally developed for incompressible flow and is applicable to compressible flow when the second invariant is obtained for the deviatoric part of velocity gradient tensor (Kolář Reference Kolář2009), $Q = 1/2(\varOmega _{ij}\varOmega _{ij}-S_{ij}S_{ij})$, where $\varOmega$ and $S$ are the antisymmetric and symmetric components of the deviatoric part of the velocity gradient tensor, respectively. According to the definition, a positive value of $Q$ indicates that the flow is locally dominated by vortex motion, and a negative value indicates regions dominated by shear strain. Figure 18 shows the conditionally averaged profiles of $Q$ at different interface orientations, where $Q$ is normalized by $(\Delta U/\delta _\omega )^2$. We can find that there is a sharp drop in $\langle Q \rangle _I/(\Delta U/\delta _\omega )^2$ as the distance from the interface increases. This implies that the interface is dominated by vortex motion with $\langle Q \rangle _I > 0$ in a small range. Near the leading and side edges, the vortex-dominated region is flanked by strain-dominated regions with two negative peaks located at $\xi /\eta \approx \pm 7$. While at the trailing edge, $\langle Q \rangle _I/(\Delta U/\delta _\omega )^2$ is always positive and two smaller positive peaks appear at $\xi /\eta \approx \pm 12$. As the convective Mach number increases, the magnitude of $\langle Q \rangle _I/(\Delta U/\delta _\omega )^2$ decreases dramatically at the three interface orientations, which is similar to the behaviour of the r.m.s. vorticity magnitude in figure 17. The observations from figures 17 and 18 confirm that the small-scale vortices are intermittently distributed and clustered to the interfaces of LSSs. Furthermore, they suggest that the effect of compressibility on the mixing layer is more pronounced at the interfaces of LSSs. In other words, compressibility stabilizes the interfaces of LSSs, providing valuable insights into the compressibility suppression mechanism.

Figure 18. Conditionally averaged second invariant of velocity gradient tensor $Q$ at different edges for (a$M_c=0.2$, (b$M_c=0.8$ and (c$M_c=1.8$.

To obtain a more complete picture of the small-scale turbulent structures, the two-dimensional average velocity field is calculated with conditional averaging of the velocity field around points on the leading or trailing edges of low-speed LSSs. The conditional averaging is performed in a rectangular subregion with local coordinates ($r_x, r_y, r_z$) along the coordinate system ($x,y,z$) used in the simulation and the origin located at the sampling point ($r_x=0, r_y=0, r_z=0$) in the flow. Figure 19 shows the velocity vector of average flow and contours of $\langle Q \rangle _I/(\Delta U/\delta _\omega )^2$ in the $r_x\unicode{x2013}r_y$ plane conditioned on the leading and trailing edges at $M_c=0.2$ and $1.8$, superimposed with the corresponding streamlines. For the leading edge, the averaged flow exhibits a shear layer pattern with two parallel flows inclined at an angle of approximately $45^\circ$ with respect to the streamwise direction. A region with large positive $\langle Q \rangle _I$ has an elliptical shape with its major axis along the interface and minor axis perpendicular to the interface. Two regions with negative $\langle Q \rangle _I$ appear above and below the region of positive $\langle Q \rangle _I$ region. As shown by the streamlines in figures 19(a) and 19(c), a vortical motion is formed at the centre of the shear layer, extending a large distance in the streamwise direction, indicating the effect of large-scale motions on the shear layer. The flow patterns at the leading edge are very similar to each other for low and high convective Mach numbers $M_c=0.2$ and $1.8$. A similar average flow pattern has been observed around ISLs in homogeneous isotropic turbulence (Watanabe et al. Reference Watanabe, Tanaka and Nagata2020) and turbulent planar jets (Hayashi et al. Reference Hayashi, Watanabe and Nagata2021), as well as around TNTIs in turbulent planar jets (Elsinga & da Silva Reference Elsinga and da Silva2019). Interestingly, figures 19(b) and 19(d) show that, for the trailing edge, the vortical motion centred at the interface becomes weaker, since the flow away from the interface is dominated by large-scale rotation characterized by large-scale circular streamlines, instead of parallel shear flow, particularly at low convective Mach number $M_c=0.2$. This result clearly shows that the high- and low-speed LSSs depart from each other at the trailing edge. Meanwhile, there are two saddle point flow patterns along the interface at $r_x/\delta _\omega =\pm 0.15$ and $\pm 0.2$ for $M_c=0.2$ and $1.8$, respectively.

Figure 19. Velocity vector of average flow and contours of $\langle Q \rangle _I/(\Delta U/\delta _\omega )^2$ in the $r_x\unicode{x2013}r_y$ plane conditioned on the (a,c) leading and (b,d) trailing edges at (a,b) $M_c=0.2$ and (c,d) $M_c=1.8$. The corresponding streamlines are displayed with black bold solid lines. The red bold solid line represents the $\langle u^\prime \rangle _I=0$ line. The blue arrow indicates the normal vector of the interface directed into low-speed region. The contour cutoff level is $-0.02$ to $0.1$.

Elsinga & Marusic (Reference Elsinga and Marusic2010) investigated the universality of small-scale turbulence by evaluating the average flow pattern in the eigenframe defined by the eigenvectors of the rate of the strain tensor. They found very similar average flows around the vorticity vector in different turbulent flows, including turbulent boundary layer, turbulent channel flow and homogenous isotropic turbulence. Their average flows are also quite similar to those in figures 19(a) and 19(c). The shearing in the $r_x\unicode{x2013}r_y$ plane is composed of two velocity gradients $\partial u / \partial y$ and $\partial v / \partial x$. It can result from either a pure strain (a saddle point flow pattern) or a layered shear flow with a single non-zero velocity gradient, see figure 3 of Elsinga & Marusic (Reference Elsinga and Marusic2010). The flow pattern is a combination of pure strain and layered shear. Furthermore, the layered shear flow has the potential to develop secondary Kelvin–Helmholtz instability, resulting in secondary Kelvin–Helmholtz vortices (Smyth Reference Smyth2003; Fritts et al. Reference Fritts, Wang, Lund and Thorpe2022). The secondary Kelvin–Helmholtz vortices can be observed in the instantaneous flow visualizations in figure 6. As shown in figure 19, the layered shear dominates the average flow pattern near the leading edge with a secondary Kelvin–Helmholtz vortex located at the centre, while the dominance is weakened near the trailing edge due to the lower level of shear (see figure 14).

In the topological methodology introduced by Chong, Perry & Cantwell (Reference Chong, Perry and Cantwell1990), the small-scale structures of the velocity gradient tensor are examined through an analysis of its invariants. Detailed background information regarding the topological methodology is available in Chong et al. (Reference Chong, Perry and Cantwell1990), Cantwell (Reference Cantwell1992) and Ooi et al. (Reference Ooi, Martin, Soria and Chong1999). As demonstrated by Fiscaletti et al. (Reference Fiscaletti, Buxton and Attili2021), the intense shear layers in a spatially developing mixing are primarily governed by a ‘stable-focus/stretching’ flow topology. As shown in figure 19, the streamline pattern of the average flow at the leading edge is consistent with the flow topology referred to as ‘stable-focus/stretching’, signifying the dominance of vortex stretching in the spanwise ($z$) direction. This is consistent with the result of Fiscaletti et al. (Reference Fiscaletti, Buxton and Attili2021). On the other hand, the streamline pattern at the trailing edge corresponds to the flow topology termed ‘unstable-focus/compressing’, indicating the presence of vortex compression in the spanwise ($z$) direction. These results corroborate our analysis of the effect of interface orientation in § 3.4.

Based on the understanding of turbulent structures near the interface, we try to explain the sensitivity of vertical velocity on the interface orientation, as observed in figures 15 and 16. We plot the contours of $\langle v^\prime \rangle _I / \Delta U$ in the $r_x\unicode{x2013}r_y$ plane conditioned on the trailing edge identified with different values of interface angle criterion $\psi _c$ in figure 20. The results are only shown for $M_c=1.8$ because they are qualitatively similar for different convective Mach numbers. The preceding results have shown that the spanwise vorticity $\omega _z=\partial v/\partial x-\partial u/\partial y$ is strongly correlated with the interface orientation $\cos (\psi _y)$, as shown in figure 10. On average, the larger the $|\cos (\psi _c)|$, the larger the magnitude of spanwise vorticity $\omega _z$, and the stronger the shear at the interface. As seen in figure 20, the conditionally averaged field of vertical velocity is featured by two regions with different scales. One is the large-scale positive $\langle v^\prime \rangle _I$ region on the low-speed side and negative $\langle v^\prime \rangle _I$ region on the high-speed side far away from the interface (red solid line), which become smaller as the interface angle criterion $|\cos (\psi _c)|$ increases. The other one is a small-scale $\langle v^\prime \rangle _I$ region induced by the vortical structure at the origin, which is magnified as $|\cos (\psi _c)|$ increases. The latter dominates the average flow near the trailing edge at $|\cos (\psi _c)|=0.8$, which generates the $Q$1 events ($\langle u^\prime \rangle _I >0$ and $\langle v^\prime \rangle _I >0$) and $Q$3 events ($\langle u^\prime \rangle _I <0$ and $\langle v^\prime \rangle _I <0$).

Figure 20. Velocity vector of average flow and contours of $\langle v^\prime \rangle _I / \Delta U$ in the $r_x\unicode{x2013}r_y$ plane conditioned on the trailing edge identified with different values of interface angle criterion: (a$|\cos (\psi _c)| =0.2$; (b$|\cos (\psi _c)| =0.5$; (c$|\cos (\psi _c)| =0.8$ at $M_c=1.8$. The red bold solid line represents the $\langle u^\prime \rangle =0$ line. The blue arrow indicates the normal vector of the interface directed into low-speed region.

The above results confirm the explanation in § 3.4 that the downward high-speed LSS impacts the upward low-speed LSS at the leading edge and they depart from each other at the trailing edge, then resulting in a higher shear at the leading edge and a weaker shear at the trailing edge, respectively. What is of great importance is that the explanation is consistent with the phenomenon of large-scale amplitude modulation of the small-scale structures in turbulent boundary layers (Marusic et al. Reference Marusic, Mathis and Hutchins2010; Mathis et al. Reference Mathis, Hutchins and Marusic2011; Agostini & Leschziner Reference Agostini and Leschziner2014) and mixing layer (Wang et al. Reference Wang, Wang and Chen2022): the small-scale vortical structures are amplified at the top of low-speed LSS, which is directly associated with high-shearing motions, and the small-scale fluctuations are attenuated beneath the low-speed LSS.

3.6. Compressibility

For compressible flow, the velocity divergence $\varTheta$ serves as an excellent indicator of the local compressibility. Figure 21 shows the conditionally averaged velocity divergence $\langle \varTheta \rangle _I$ at different interface orientations for three Mach number cases, where $\langle \varTheta \rangle _I$ is normalized by $\Delta U/\delta _\omega$. At low and moderate convective Mach numbers $M_c=0.2, 0.8$, a gentle positive peak can be found within the interface layer at three interface orientations, which indicates that a fluid expansion is induced by the vortical structures. The peak value at $M_c=0.8$ is nearly 10 times larger than the value at $M_c=0.2$. The velocity divergence $\langle \varTheta \rangle _I$ is smallest near the trailing edge and largest near the leading edge, similar to the behaviour of rotation strength (positive $\langle Q \rangle _I$) at the trailing and leading edges, as shown in figure 18. At high turbulent Mach number $M_c=1.8$, the velocity divergence $\langle \varTheta \rangle _I$ exhibits two positive peaks near the leading and side edges at $\xi /\eta \approx \pm 3$. Between the two peaks, the fluid is slightly compressed at the leading edge, which is qualitatively similar to that observed near the TNTIs (Rossmann et al. Reference Rossmann, Mungal and Hanson2002; Zhou et al. Reference Zhou, He and Shen2012; Nagata et al. Reference Nagata, Watanabe and Nagata2018). A larger positive peak of $\langle \varTheta \rangle _I$ is observed near the trailing edge compared with the leading edge. Away from the interface, the velocity divergence $\langle \varTheta \rangle _I$ is mildly negative, indicating that the LSSs are compressive at $M_c=1.8$.

Figure 21. Conditionally averaged velocity divergence at different edges for (a) $M_c=0.2$, (b) $M_c=0.8$ and (c) $M_c=1.8$.

Figure 22 shows the velocity vector of average flow and contours of the normalized velocity divergence $\langle \varTheta \rangle _I / (\Delta U/\delta _\omega )$ in the $r_x\unicode{x2013}r_y$ plane conditioned on the leading and trailing edges at $M_c=0.2$ and $1.8$. At $M_c=0.2$, there are no negative levels of the contour for $\langle \varTheta \rangle _I$ near the interface, implying that the flow is expansive on average near the leading and trailing edges. Close to the leading edge, the positive region of $\langle \varTheta \rangle _I$ has a similar shape to the small-scale vortical structure, while the positive regions mainly reside in shear-dominated regions near the trailing edge, as shown in figures 22(a) and 22(b). Due to the lack of samples, the results are not statistically stable far away from the interface with regard to LSSs. At a higher convective Mach number $M_c=1.8$, a narrow compression region passes through the centre of a small-scale vortical structure with an inclination angle of $45^\circ$ with respect to the interface and links two strong compression motions in the shear-dominated regions away from the leading edge. There are two expansion regions on both sides of the shock-like compression region. Moreover, we observe that expansion motion dominates the average flow near the trailing edge at $M_c=1.8$.

Figure 22. Velocity vector of the average flow and contours of $\langle \varTheta \rangle _I / (\Delta U/\delta _\omega )$ in the $r_x\unicode{x2013}r_y$ plane conditioned on the (a,c) leading and (b,d) trailing edges at (a,b) $M_c=0.2$ and (c,d) $M_c=1.8$. The red bold solid line represents the $\langle u^\prime \rangle _I =0$ line. The blue arrow indicates the normal vector of the interface directed into the low-speed region.

4. Conclusion

We have performed the DNS of a temporal compressible shear layer to study the compressibility effects on the statistics and structures of interfaces of LSSs at the convective Mach numbers $M_c$ ranging from 0.2 to 1.8. The three-dimensional interfaces of LSSs are defined by the isosurface of the zero fluctuating streamwise velocity. The interfacial layers are characterized by a strong concentration of vorticity similar to the interfaces of UMZs detected in instantaneous streamwise velocity. The shear strength is highly dependent on the orientation angle of the interface. The magnitude of averaged spanwise vorticity $\omega _z/\omega _{rms}$, conditioned on the interface angle $\cos (\psi _y)$, rapidly increases when $|\cos (\psi _y)|>0.5$, while the streamwise and vertical vorticity components, $\omega _x/\omega _{rms}$ and $\omega _y/\omega _{rms}$ are almost independent of $\cos (\psi _y)$. The conditional average of $\omega _y/\omega _{rms}$ decreases linearly with $\cos (\psi _z)$. To explore the effect of interface orientation, the interface is divided into leading and trailing edges based on the value of the interface angle $\cos (\psi _y)$ and side edge on $\cos (\psi _z)$.

The small-scale structures and compressibility are investigated by employing a conditional average of the flow field depending on the distance from the interface. The results confirm the presence of sharp jumps of streamwise velocity within the interface layer of LSSs. We observe that the velocity jump grows rapidly in the transition stage and then decreases until reaching a self-similar stage. The evolution process of interfaces at $M_c=0.2$ and $0.8$ is evidently faster than that at $M_c=1.8$, indicating an analogous suppression of mixing layer growth rate due to compressibility. In the self-similar stage, the conditional average of streamwise velocity shows a fairly good collapse near the interface layer when normalized by the Kolmogorov length $\eta$ and velocity $u_\eta$, confirming that the interface layers are dominated by the smallest vortical structures characterized by the Kolmogorov scale.

The mean flow around the interface demonstrates a shear layer pattern with shear-dominated outer regions and an induced small-scale vortical motion at the centre of the interface layer. At the leading edge, the downward high-speed LSS impacts the upward low-speed LSS, resulting in stronger outer shearing motion and central vortical motion (larger velocity jump). At the trailing edge, the high- and low-speed LSSs depart from each other, resulting in weaker shear (smaller velocity jump). In other words, the small-scale vortical structures are promoted at the leading edge and are attenuated at the trailing edge of low-speed LSS. As the convective Mach number increases, the small-scale structures are obviously suppressed by compressibility at all interface orientations. Near the trailing edge, the vertical velocity induced by strong central vortical motion is comparable to the vertical velocity of LSSs, resulting in $Q$1 and $Q$3 events when the swirling strength is strong.

The conditionally averaged velocity divergence is always positive due to the centrifugal effect of small-scale vortical structures near the interface at $M_c=0.2$ and $0.8$. At higher convective Mach number $M_c=1.8$, a narrow compression region passes through the centre of a small-scale vortical structure and links two strong compression motions in the shear-dominated regions near the leading edge, while expansion motion dominates the average flow near the trailing edge. It implies that the compressibility is highly dependent on the interface orientation.

Funding

This work was supported by the National Natural Science Foundation of China (NSFC grant nos. 92052301, 12161141017, 12172161 and 91952104), by the NSFC Basic Science Center Program (grant no. 11988102), by the Shenzhen Science and Technology Program (grant no. KQTD20180411143441009) and by Department of Science and Technology of Guangdong Province (grant nos. 2019B21203001, 2020B1212030001, 2023B1212060001). This work was also supported by Center for Computational Science and Engineering of Southern University of Science and Technology.

Declaration of interests

The authors report no conflict of interest.

Appendix A. Conditionally averaged velocity at the ISLs

In this section, the interfaces of UMZs are identified and compared with the interfaces of LSSs. In order to detect the ISLs which have been considered as the interface of UMZs (Eisma et al. Reference Eisma, Westerweel, Ooms and Elsinga2015; de Silva et al. Reference de Silva, Hutchins and Marusic2016; Montemuro et al. Reference Montemuro, White, Klewicki and Chini2020), the triple decomposition method proposed by Kolář (Reference Kolář2007) is applied. The details of the algorithms of the triple decomposition can be referred to previous references (Kolář Reference Kolář2007; Nagata et al. Reference Nagata, Watanabe, Nagata and da Silva2020; Fiscaletti et al. Reference Fiscaletti, Buxton and Attili2021). According to this method, the velocity gradient tensor is decomposed into three parts,

(A1)\begin{equation} \Delta u = (\Delta u)_{rr}+(\Delta u)_{sh}+(\Delta u)_{el}, \end{equation}

where $rr$, $sh$ and $el$ denote the rigid-body rotation, shear and elongation components of the velocity gradient tensor, respectively. From the obtained shear component of the velocity gradient tensor $(\Delta u)_{sh}$, the vorticity associated with the shear contribution, $\omega _{sh}$, was calculated. From the definition, $\omega \geqslant \omega _{sh}$, where $\omega$ is the vorticity associated with the velocity gradient tensor. The following threshold is applied to identify the ISLs:

(A2)\begin{equation} \omega_{sh} > K\langle \omega_{sh} \rangle_{y=0}, \end{equation}

where $\langle \omega _{sh} \rangle _{y=0}$ is the maximum mean shear vorticity occurring at the centreline of the mixing layer. The constant value of $K = 1.5$ is chosen to identify the intense shear layers (Fiscaletti et al. Reference Fiscaletti, Buxton and Attili2021). Inside the ISLs, the local maximum of $\omega _{sh}$ along the vertical direction is identified as the centre point of these internal shear layers. We plot the joint p.d.f.s between $\omega /\omega _{rms}$ and $\omega _{sh}/\omega$ in figure 23 for $M_c = 0.2$ and $1.8$. A large probability occurs at $\omega _{sh}/\omega \approx 1$ when $\omega /\omega _{rms}<1$. A smaller $\omega _{sh}/\omega$ is more frequently observed for a larger $\omega /\omega _{rms}$, which attenuates as the convective Mach number increases. At $\omega /\omega _{rms} \approx 0.05$, the joint p.d.f. become larger, especially at $M_c = 1.8$, which may be caused by the existence of TNTI in the mixing layer.

Figure 23. Isocontours of $\log _{10}$ p.d.f. ($\omega /\omega _{rms}$, $\omega _{sh}/\omega$) for $M_c = 0.2$ at $\tau = 750$ and for $M_c = 1.8$ at $\tau = 1750$.

To examine conditionally averaged statistical properties in the near vicinity of these ISLs, a local frame of reference along the vertical direction at each centre point $y=y_i$ is employed. The subscript $i$ indicates quantities computed within this local coordinate system. This procedure of conditional averaging closely follows the methodology outlined by Fiscaletti et al. (Reference Fiscaletti, Buxton and Attili2021) and De Silva et al. (Reference De Silva, Philip, Hutchins and Marusic2017). The conditional average statistics near ISLs are denoted by $\langle \,\cdot\, \rangle _i$. It is worth noting that the local coordinate system used at the interfaces of LSSs is set to be parallel to its unit normal vector defined as $\boldsymbol {n}= -\boldsymbol {\nabla }{u}^\prime /|\boldsymbol {\nabla } {u}^\prime |$. The comparability between these conditional averages is supported by the fact that both the ISLs and interfaces of LSSs are oriented orthogonal to the mean shear of the flow, as shown in Fiscaletti et al. (Reference Fiscaletti, Buxton and Attili2021), De Silva et al. (Reference De Silva, Philip, Hutchins and Marusic2017) and present results in § 3.2.

The conditionally averaged profiles of the instantaneous streamwise velocity ($u$) across the ISLs are presented in figure 24 at $M_c =0.2$ and $Re_\lambda \approx 280$ and at $M_c =1.8$ and $Re_\lambda \approx 215$, compared with the results reported by Fiscaletti et al. (Reference Fiscaletti, Buxton and Attili2021) in a spatially developing incompressible mixing layer at $Re_\lambda \approx 200, 250$ and $275$. We can observe that, in temporally developing mixing layers, the total conditional velocity profiles, and the profiles characterized by ${\partial u^\prime }/{\partial y} >0$ or ${\partial u^\prime }/{\partial y} <0$ are symmetric. The lower parts (with $\langle y-y_i \rangle _i <0$) of these profiles agree well with those in the spatially developing mixing layer from Fiscaletti et al. (Reference Fiscaletti, Buxton and Attili2021), where these profiles are asymmetric. This observation validates the accurate identification of ISLs using the triple decomposition method. Interestingly, the conditionally averaged instantaneous streamwise velocity ($u$) at the ISLs is more sensitive to the Reynolds number $Re_\lambda$ or convective Mach number $M_c$ than the fluctuating streamwise velocity ($u^\prime$) at the interfaces of LSSs (as shown in figures 13 and 14), implying that the statistical characteristics at the interface of LSSs are more universal.

Figure 24. (a) Conditionally averaged profiles of the streamwise velocity in the near vicinity of all detected ISLs. Conditionally averaged profiles of the streamwise velocity characterized by (b) positive and (c) negative values of ${\partial u^\prime }/{\partial y}$.

A comparison of the conditionally averaged profiles of the fluctuating streamwise velocity ($u^\prime$) across the ISLs ($\langle {u}^\prime \rangle _i/ \Delta U$) and across the interfaces of LSSs ($\langle {u}^\prime \rangle _I/ \Delta U$) is displayed in figure 25 at $M_c =1.8$. We observe that both the conditionally averaged profiles of $\langle {u}^\prime \rangle _i/ \Delta U$ and $\langle {u}^\prime \rangle _I/ \Delta U$ exhibit characteristics of the velocity jump, with the former showing significantly smaller magnitudes than the latter. The positive and negative peaks of $\langle {u}^\prime \rangle _i/ \Delta U$ occur at a smaller separation than those of $\langle {u}^\prime \rangle _I/ \Delta U$, especially in figure 25(b). The value of $\langle {u}^\prime \rangle _i/ \Delta U$ decreases rapidly with increasing distance from the centre of the ISL, and there is a change in sign. The pronounced difference between $\langle {u}^\prime \rangle _i/ \Delta U$ and $\langle {u}^\prime \rangle _I/ \Delta U$ is unexpected. This may be attributed to the influence of LSSs persisting at their interfaces, leading to a stronger correlation in velocity. At the interfaces of LSSs, there exists both rigid-body rotation and shear, while ISL only encompass regions of intense shear, lacking the contribution of rigid-body rotation to velocity gradients. Further investigation is required to analyse the differences and connections between the interfaces of LSSs and those of UMZs.

Figure 25. Comparison of the conditionally averaged profiles of the fluctuating streamwise velocity $u^\prime$ (a) across the ISLs with ${\partial u^\prime }/{\partial y} > 0$ and the leading edge of interfaces of LSSs and (b) across the ISLs with ${\partial u^\prime }/{\partial y} < 0$ and the trailing edge of interfaces of LSSs at $M_c = 1.8$.

References

Adrian, R.J., Meinhart, C.D. & Tonkins, C.D. 2000 Vortex organization in the outer region of the turbulent boundary layer. J. Fluid Mech. 422, 154.CrossRefGoogle Scholar
Agostini, L. & Leschziner, M.A. 2014 On the influence of outer large-scale structures on near-wall turbulence in channel flow. Phys. Fluids 26 (7), 075107.CrossRefGoogle Scholar
Almagro, A., Garciá-Villalba, M. & Flores, O. 2017 A numerical study of a variable-density low-speed turbulent mixing layer. J. Fluid Mech. 830, 569601.CrossRefGoogle Scholar
Arun, S., Sameen, A., Srinivasan, B. & Girimaji, S.S. 2019 Topology-based characterization of compressibility effects in mixing layers. J. Fluid Mech. 874, 3875.CrossRefGoogle Scholar
Balaras, E., Piomelli, U. & Wallace, J.M. 2001 Self-similar states in turbulent mixing layers. J. Fluid Mech. 446, 124.CrossRefGoogle Scholar
Baltzer, J.R., Adrian, R.J. & Wu, X. 2013 Structural organization of large and very large scales in turbulent pipe flow simulation. J. Fluid Mech. 720, 236279.CrossRefGoogle Scholar
Baltzer, J.R. & Livescu, D. 2020 Variable-density effects in incompressible non-buoyant shear-driven turbulent mixing layers. J. Fluid Mech. 900, A16.CrossRefGoogle Scholar
Cantwell, B.J. 1992 Exact solution of a restricted Euler equation for the velocity gradient tensor. Phys. Fluids A 4 (4), 782793.CrossRefGoogle Scholar
Chauhan, K., Philip, J. & Marusic, I. 2014 Scaling of the turbulent/non-turbulent interface in boundary layers. J. Fluid Mech. 751, 298328.CrossRefGoogle Scholar
Chen, X., Chung, Y.M. & Wan, M. 2020 Uniform-momentum zones in a turbulent pipe flow. J. Fluid Mech. 884, A25.CrossRefGoogle Scholar
Chong, M.S., Perry, A.E. & Cantwell, B.J. 1990 A general classification of three-dimensional flow fields. Phys. Fluids A 2 (5), 765777.CrossRefGoogle Scholar
De Silva, C.M., Philip, J., Hutchins, N. & Marusic, I. 2017 Interfaces of uniform momentum zones in turbulent boundary layers. J. Fluid Mech. 820, 451478.CrossRefGoogle Scholar
Deng, S., Pan, C., Wang, J. & He, G. 2018 On the spatial organization of hairpin packets in a turbulent boundary layer at low-to-moderate Reynolds number. J. Fluid Mech. 844, 635668.CrossRefGoogle Scholar
Dennis, D.J.C. & Nickels, T.B. 2011 Experimental measurement of large-scale three-dimensional structures in a turbulent boundary layer. Part 2. Long structures. J. Fluid Mech. 673, 218244.CrossRefGoogle Scholar
Eisma, J., Westerweel, J., Ooms, G. & Elsinga, G.E. 2015 Interfaces and internal layers in a turbulent boundary layer. Phys. Fluids 27 (5), 55103.CrossRefGoogle Scholar
Elsinga, G.E., Ishihara, T., Goudar, M.V., Da Silva, C.B. & Hunt, J.C.R. 2017 The scaling of straining motions in homogeneous isotropic turbulence. J. Fluid Mech. 829, 3164.CrossRefGoogle Scholar
Elsinga, G.E. & Marusic, I. 2010 Universal aspects of small-scale motions in turbulence. J. Fluid Mech. 662, 514539.CrossRefGoogle Scholar
Elsinga, G.E. & da Silva, C.B. 2019 How the turbulent/non-turbulent interface is different from internal turbulence. J. Fluid Mech. 866, 216238.CrossRefGoogle Scholar
Fan, D., Xu, J., Yao, M.X. & Hickey, J.-P. 2019 On the detection of internal interfacial layers in turbulent flows. J. Fluid Mech. 872, 198217.CrossRefGoogle Scholar
Fiscaletti, D., Buxton, O.R.H. & Attili, A. 2021 Internal layers in turbulent free-shear flows. Phys. Rev. Fluids 6 (3), 034612.CrossRefGoogle Scholar
Fritts, D.C., Wang, L., Lund, T.S. & Thorpe, S.A. 2022 Multi-scale dynamics of Kelvin–Helmholtz instabilities. Part 1. Secondary instabilities and the dynamics of tubes and knots. J. Fluid Mech. 941, A30.CrossRefGoogle Scholar
Ganapathisubramani, B., Hutchins, N., Hambleton, W.T., Longmire, E.K. & Marusic, I. 2005 Investigation of large-scale coherence in a turbulent boundary layer using two-point correlations. J. Fluid Mech. 524, 5780.CrossRefGoogle Scholar
Gul, M., Elsinga, G.E. & Westerweel, J. 2020 Internal shear layers and edges of uniform momentum zones in a turbulent pipe flow. J. Fluid Mech. 901, A10.CrossRefGoogle Scholar
Hayashi, M., Watanabe, T. & Nagata, K. 2021 Characteristics of small-scale shear layers in a temporally evolving turbulent planar jet. J. Fluid Mech. 920, A38.CrossRefGoogle Scholar
Heisel, M., De Silva, C.M., Hutchins, N., Marusic, I. & Guala, M. 2021 Prograde vortices, internal shear layers and the Taylor microscale in high-Reynolds-number turbulent boundary layers. J. Fluid Mech. 920, A52.CrossRefGoogle Scholar
Hunt, J.C.R., Wray, A.A. & Moin, P. 1988 Eddies, streams, and convergence zones in turbulent flows. In Center for Turbulence Research Report CTR-S88, pp. 193–208. Stanford University.Google Scholar
Ishihara, T., Kaneda, Y. & Hunt, J.C.R. 2013 Thin shear layers in high Reynolds number turbulence – DNS results. Flow Turbul. Combust. 91 (4), 895929.CrossRefGoogle Scholar
Jahanbakhshi, R. & Madnia, C.K. 2016 Entrainment in a compressible turbulent shear layer. J. Fluid Mech. 797 (2016), 564603.CrossRefGoogle Scholar
Jiménez, J. 2013 Near-wall turbulence. Phys. Fluids 25 (10), 101302.CrossRefGoogle Scholar
Jiménez, J. 2018 Coherent structures in wall-bounded turbulence. J. Fluid Mech. 842, P1.CrossRefGoogle Scholar
Kim, K.C. & Adrian, R.J. 1999 Very large-scale motion in the outer layer. Phys. Fluids 11 (2), 417.CrossRefGoogle Scholar
Klein, M., Sadiki, A. & Janicka, J. 2003 A digital filter based generation of inflow data for spatially developing direct numerical or large eddy simulations. J. Comput. Phys. 186 (2), 652665.CrossRefGoogle Scholar
Kolář, V. 2007 Vortex identification: new requirements and limitations. Intl J. Heat Fluid Flow 28 (4), 638652.CrossRefGoogle Scholar
Kolář, V. 2009 Compressibility effect in vortex identification. AIAA J. 47 (2), 473475.CrossRefGoogle Scholar
Kolmogorov, A.N. 1941 The local structure of turbulence in incompressible viscous fluid for very large Reynolds numbers. Dokl. Akad. Nauk SSSR 30, 299303.Google Scholar
Kwon, Y.S., Philip, J., de Silva, C.M., Hutchins, N. & Monty, J.P. 2014 The quiescent core of turbulent channel flow. J. Fluid Mech. 751, 228254.CrossRefGoogle Scholar
Lee, J., Lee, J.H., Choi, J.-I. & Sung, H.J. 2014 Spatial organization of large- and very-large-scale motions in a turbulent channel flow. J. Fluid Mech. 749, 818840.CrossRefGoogle Scholar
Lee, M. & Moser, R.D. 2019 Spectral analysis of the budget equation in turbulent channel flows at high Reynolds number. J. Fluid Mech. 860, 886938.CrossRefGoogle Scholar
Marusic, I., Mathis, R. & Hutchins, N. 2010 Predictive model for wall-bounded turbulent flow. Science 329 (5988), 193196.CrossRefGoogle ScholarPubMed
Mathis, R., Hutchins, N. & Marusic, I. 2011 A predictive inner–outer model for streamwise turbulence statistics in wall-bounded flows. J. Fluid Mech. 681, 537566.CrossRefGoogle Scholar
Meinhart, C.D. & Adrian, R.J. 1995 On the existence of uniform momentum zones in a turbulent boundary layer. Phys. Fluids 7 (4), 694696.CrossRefGoogle Scholar
Messersmith, N.L. & Dutton, J.C. 1996 Characteristic features of large structures in compressible mixing layers. AIAA J. 34 (9), 18141821.CrossRefGoogle Scholar
Montemuro, B., White, C.M., Klewicki, J.C. & Chini, G.P. 2020 A self-sustaining process theory for uniform momentum zones and internal shear layers in high Reynolds number shear flows. J. Fluid Mech. 901, A28.CrossRefGoogle Scholar
Monty, J.P., Hutchins, N., Ng, H.C.H., Marusic, I. & Chong, M.S. 2009 A comparison of turbulent pipe, channel and boundary layer flows. J. Fluid Mech. 632, 431442.CrossRefGoogle Scholar
Monty, J.P., Stewart, J.A., Williams, R.C. & Chong, M.S. 2007 Large-scale features in turbulent pipe and channel flows. J. Fluid Mech. 589, 147156.CrossRefGoogle Scholar
Mungal, M.G. 1995 Large-scale structure and entrainment in the supersonic mixing layer. J. Fluid Mech. 284, 171216.Google Scholar
Nagata, R., Watanabe, T. & Nagata, K. 2018 Turbulent/non-turbulent interfaces in temporally evolving compressible planar jets. Phys. Fluids 30 (10), 105109.CrossRefGoogle Scholar
Nagata, R., Watanabe, T., Nagata, K. & da Silva, C.B. 2020 Triple decomposition of velocity gradient tensor in homogeneous isotropic turbulence. Comput. Fluids 198, 104389.CrossRefGoogle Scholar
Ooi, A., Martin, J., Soria, J. & Chong, M.S. 1999 A study of the evolution and characteristics of the invariants of the velocity-gradient tensor in isotropic turbulence. J. Fluid Mech. 381, 141174.CrossRefGoogle Scholar
Pantano, C. & Sarkar, S. 2002 A study of compressibility effects in the high-speed turbulent shear layer using direct simulation. J. Fluid Mech. 451, 329371.CrossRefGoogle Scholar
Pirozzoli, S., Bernardini, M., Marié, S. & Grasso, F. 2015 Early evolution of the compressible mixing layer issued from two turbulent streams. J. Fluid Mech. 777, 196218.CrossRefGoogle Scholar
Pope, S.B. 2000 Turbulent Flows. Cambridge University Press.CrossRefGoogle Scholar
Ragab, S.A. & Wu, J.L. 1989 Linear instabilities in two-dimensional compressible mixing layers. Phys. Fluids A 1 (6), 957966.CrossRefGoogle Scholar
Reckinger, S.J., Livescu, D. & Vasilyev, O.V. 2016 Comprehensive numerical methodology for direct numerical simulations of compressible Rayleigh–Taylor instability. J. Comput. Phys. 313, 181208.CrossRefGoogle Scholar
Robinson, S.K. 1991 Coherent motions in the turbulent boundary layer. Annu. Rev. Fluid Mech. 23 (1), 601639.CrossRefGoogle Scholar
Rogers, M.M. & Moser, R.D. 1994 Direct simulation of a self-similar turbulent mixing layer. Phys. Fluids 6 (2), 903923.CrossRefGoogle Scholar
Rossmann, T., Mungal, M.G. & Hanson, R.K. 2002 Evolution and growth of large-scale structures in high compressibility mixing layers. J. Turbul. 3 (2001), 2729.CrossRefGoogle Scholar
Samie, M., Lavoie, P. & Pollard, A. 2021 Quantifying eddy structures and very-large-scale motions in turbulent round jets. J. Fluid Mech. 916, A2.CrossRefGoogle Scholar
Saxton-Fox, T. & McKeon, B.J. 2017 Coherent structures, uniform momentum zones and the streamwise energy spectrum in wall-bounded turbulent flows. J. Fluid Mech. 826, R6.CrossRefGoogle Scholar
Shen, X. & Warhaft, Z. 2000 The anisotropy of the small scale structure in high Reynolds number ($R_{\lambda }\sim 1000$) turbulent shear flow. Phys. Fluids 12 (11), 29762989.CrossRefGoogle Scholar
de Silva, C.M., Hutchins, N. & Marusic, I. 2016 Uniform momentum zones in turbulent boundary layers. J. Fluid Mech. 786, 309331.CrossRefGoogle Scholar
Smits, A.J., McKeon, B.J. & Marusic, I. 2011 High-Reynolds number wall turbulence. Annu. Rev. Fluid Mech. 43 (1), 353375.CrossRefGoogle Scholar
Smyth, W.D. 2003 Secondary Kelvin–Helmholtz instability in weakly stratified shear flow. J. Fluid Mech. 497, 6798.CrossRefGoogle Scholar
Squire, D.T. 2016 The structure and scaling of rough-wall turbulent boundary layers. PhD thesis, University of Melbourne.Google Scholar
Vaghefi, N.S. 2014 Simulation and modeling of compressible turbulent mixing layer. PhD thesis, State University of New York.Google Scholar
Vaghefi, N.S. & Madnia, C.K. 2015 Local flow topology and velocity gradient invariants in compressible turbulent mixing layer. J. Fluid Mech. 774, 6794.CrossRefGoogle Scholar
Vreman, A.W., Sandham, N.D. & Luo, K.H. 1996 Compressible mixing layer growth rate and turbulence characteristics. J. Fluid Mech. 320, 235.CrossRefGoogle Scholar
Wallace, J.M. 2016 Quadrant analysis in turbulence research: history and evolution. Annu. Rev. Fluid Mech. 48 (1), 131158.CrossRefGoogle Scholar
Wang, J., Wang, L., Xiao, Z., Shi, Y. & Chen, S. 2010 A hybrid numerical simulation of isotropic compressible turbulence. J. Comput. Phys. 229 (13), 52575279.CrossRefGoogle Scholar
Wang, X., Wang, J. & Chen, S. 2022 Compressibility effects on statistics and coherent structures of compressible turbulent mixing layers. J. Fluid Mech. 947, A38.CrossRefGoogle Scholar
Watanabe, T. & Nagata, K. 2021 Large-scale characteristics of a stably stratified turbulent shear layer. J. Fluid Mech. 927, A27.CrossRefGoogle Scholar
Watanabe, T., Riley, J.J., Nagata, K., Matsuda, K. & Onishi, R. 2019 Hairpin vortices and highly elongated flow structures in a stably stratified shear layer. J. Fluid Mech. 878, 3761.CrossRefGoogle Scholar
Watanabe, T., Tanaka, K. & Nagata, K. 2020 Characteristics of shearing motions in incompressible isotropic turbulence. Phys. Rev. Fluids 5, 072601.CrossRefGoogle Scholar
Watanabe, T., Zhang, X. & Nagata, K. 2018 Turbulent/non-turbulent interfaces detected in DNS of incompressible turbulent boundary layers. Phys. Fluids 30 (3), 035102.CrossRefGoogle Scholar
Zhang, X., Watanabe, T. & Nagata, K. 2018 Turbulent/nonturbulent interfaces in high-resolution direct numerical simulation of temporally evolving compressible turbulent boundary layers. Phys. Rev. Fluids 3 (9), 094605.CrossRefGoogle Scholar
Zhang, X., Watanabe, T. & Nagata, K. 2019 Passive scalar mixing near turbulent/non-turbulent interface in compressible turbulent boundary layers. Phys. Scr. 94 (4), 044002.CrossRefGoogle Scholar
Zhou, Q., He, F. & Shen, M.Y. 2012 Direct numerical simulation of a spatially developing compressible plane mixing layer: flow structures and mean flow properties. J. Fluid Mech. 711, 437468.CrossRefGoogle Scholar
Figure 0

Figure 1. Schematic of the temporally evolving shear layer. The black solid curve represents the mean velocity profile, while the contour map displays the instantaneous temperature in the $x\unicode{x2013}y$ plane. The red-dashed rectangles denote the boundaries of the sponge layers at the vertical boundary.

Figure 1

Table 1. Simulation parameters at the beginning ($\tau =\tau _0$) and end ($\tau =\tau _f$) of the self-similar period. The values of $M_t$, $Re_{\lambda }$, $K$, $\omega$, $\varTheta _{rms}$, $\eta$, $l_x$ and $l_z$ are obtained at $y = 0$.

Figure 2

Figure 2. Time evolution of the thickness ratio $\delta _\theta /\delta _\omega$ at $M_c=0.2, 0.8$ and $1.8$. The vertical line segments mark the self-similar periods.

Figure 3

Figure 3. Time evolution of (a) the normalized Kolmogorov length $\eta /\delta _\omega$ and (b) normalized Kolmogorov velocity $u_\eta /\Delta U$ at $M_c=0.2, 0.8$ and $1.8$. The length $\eta$, and velocity $u_\eta$ are evaluated at the centreline of the mixing layer. The vertical line segments mark the self-similar periods.

Figure 4

Figure 4. Schematic of the high- and low-speed LSSs and small vortical structures near their interfaces in the (a) $x\unicode{x2013}y$ and (b) $z\unicode{x2013}y$ planes. The red and blue regions indicate the high- and low-speed LSSs, respectively. The red bold dashed line represents the interfaces superposed with small-scale vortices. The red arrow indicates the normal vector of the interface directed into low-speed region. The black circle with arrow indicates the small-scale vortex.

Figure 5

Figure 5. (a) Comparison between the vertical profiles of instantaneous streamwise velocity $u/\Delta U$ (red), fluctuating streamwise velocity $u^\prime /\Delta U$ (green) and mean streamwise velocity $\langle u \rangle /\Delta U$ (blue) at five equally spaced streamwise location from a snapshot for $M_c = 1.8$ at $\tau = 1750$, and (b) the corresponding profiles of the vertical gradients of them.

Figure 6

Figure 6. Instantaneous visualization of contour lines of $u^\prime /\Delta U=-0.1$ and $0.1$ at (a,c,e) $M_c=0.2$ and (b,d,f) $M_c=1.8$, overlaid on colour contours of (a,b) spanwise vorticity $\omega _z$ in $x\unicode{x2013}y$ plane, (c,d) vertical vorticity $\omega _y$ in $x\unicode{x2013}z$ plane and (e,f) streamwise vorticity $\omega _x$ in $y\unicode{x2013}z$ plane.

Figure 7

Figure 7. Isocontour lines of (a) $\log _{10}$ p.d.f. ($\omega _i$,$u^\prime$) at $M_c=0.2$ and (b) $\log _{10}$ p.d.f. ($\omega _z$,$u^\prime$) for three different convective Mach numbers $M_c =0.2$, $0.8$ and $1.8$. Four contour lines at $-1,-2,-3$ and $-4$ are shown.

Figure 8

Figure 8. The p.d.f. of the cosines of the angle between (a) the $x$-axis, (b) the $y$-axis, (c) the $z$-axis and the normal unit vector of the interfaces of LSSs at three different convective Mach numbers $M_c =0.2$, $0.8$ and $1.8$.

Figure 9

Figure 9. Isocontours of $\log _{10}$ p.d.f. ($\cos (\psi _i)$, $\omega _j$ ) for $M_c = 1.8$ at $\tau = 1750$. Four contour lines at $-1$, $-2$, $-3$ and $-4$ are shown.

Figure 10

Figure 10. Average of normalized vorticity components $\omega _i/\omega _{rms}$ conditioned on the cosine of interface orientation $\cos (\psi _j)$ at $M_c = 1.8$ and at $\tau = 1750$.

Figure 11

Figure 11. Conditionally averaged streamwise velocity profiles in the near vicinity of all detected internal interfaces at three times inside the transition stage and three times inside the self-similar stage of the mixing layer: (a) $M_c=0.2$; (b) $M_c=0.8$; (c) $M_c=1.8$. The red solid lines correspond to profile at the initial field.

Figure 12

Figure 12. Conditionally averaged streamwise velocity profiles at different times in the self-similar period for (a) $M_c=0.2$, (b) $M_c=0.8$ and (c) $M_c=1.8$. Profiles are normalized by the Kolmogorov length $\eta$ and velocity $u_\eta$.

Figure 13

Figure 13. Conditionally averaged streamwise velocity profiles at different times in the self-similar period for (a) $M_c=0.2$, (b) $M_c=0.8$ and (c) $M_c=1.8$. Profiles are normalized by the vorticity thickness $\delta _\omega$ and the velocity difference across the shear layer $\Delta U$.

Figure 14

Figure 14. Conditionally averaged streamwise velocity at different edges for (a) $M_c=0.2$, (b) $M_c=0.8$ and (c) $M_c=1.8$. The enlarged views near the centre are shown in the insets.

Figure 15

Figure 15. Conditionally averaged vertical velocity at different edges for (a$M_c=0.2$, (b$M_c=0.8$ and (c$M_c=1.8$.

Figure 16

Figure 16. Conditionally averaged vertical velocity at the trailing edge identified using different values of interface angle criterion at (a) $M_c=0.2$, (b) $M_c=0.8$ and (c) $M_c=1.8$, compared with (d) that at the leading edge at $M_c=1.8$. The legend is the same for all plots.

Figure 17

Figure 17. Conditional average of the r.m.s. vorticity magnitude $\omega _{rms}$ at different edges at (a$M_c=0.2$, (b$M_c=0.8$ and (c$M_c=1.8$.

Figure 18

Figure 18. Conditionally averaged second invariant of velocity gradient tensor $Q$ at different edges for (a$M_c=0.2$, (b$M_c=0.8$ and (c$M_c=1.8$.

Figure 19

Figure 19. Velocity vector of average flow and contours of $\langle Q \rangle _I/(\Delta U/\delta _\omega )^2$ in the $r_x\unicode{x2013}r_y$ plane conditioned on the (a,c) leading and (b,d) trailing edges at (a,b) $M_c=0.2$ and (c,d) $M_c=1.8$. The corresponding streamlines are displayed with black bold solid lines. The red bold solid line represents the $\langle u^\prime \rangle _I=0$ line. The blue arrow indicates the normal vector of the interface directed into low-speed region. The contour cutoff level is $-0.02$ to $0.1$.

Figure 20

Figure 20. Velocity vector of average flow and contours of $\langle v^\prime \rangle _I / \Delta U$ in the $r_x\unicode{x2013}r_y$ plane conditioned on the trailing edge identified with different values of interface angle criterion: (a$|\cos (\psi _c)| =0.2$; (b$|\cos (\psi _c)| =0.5$; (c$|\cos (\psi _c)| =0.8$ at $M_c=1.8$. The red bold solid line represents the $\langle u^\prime \rangle =0$ line. The blue arrow indicates the normal vector of the interface directed into low-speed region.

Figure 21

Figure 21. Conditionally averaged velocity divergence at different edges for (a) $M_c=0.2$, (b) $M_c=0.8$ and (c) $M_c=1.8$.

Figure 22

Figure 22. Velocity vector of the average flow and contours of $\langle \varTheta \rangle _I / (\Delta U/\delta _\omega )$ in the $r_x\unicode{x2013}r_y$ plane conditioned on the (a,c) leading and (b,d) trailing edges at (a,b) $M_c=0.2$ and (c,d) $M_c=1.8$. The red bold solid line represents the $\langle u^\prime \rangle _I =0$ line. The blue arrow indicates the normal vector of the interface directed into the low-speed region.

Figure 23

Figure 23. Isocontours of $\log _{10}$ p.d.f. ($\omega /\omega _{rms}$, $\omega _{sh}/\omega$) for $M_c = 0.2$ at $\tau = 750$ and for $M_c = 1.8$ at $\tau = 1750$.

Figure 24

Figure 24. (a) Conditionally averaged profiles of the streamwise velocity in the near vicinity of all detected ISLs. Conditionally averaged profiles of the streamwise velocity characterized by (b) positive and (c) negative values of ${\partial u^\prime }/{\partial y}$.

Figure 25

Figure 25. Comparison of the conditionally averaged profiles of the fluctuating streamwise velocity $u^\prime$ (a) across the ISLs with ${\partial u^\prime }/{\partial y} > 0$ and the leading edge of interfaces of LSSs and (b) across the ISLs with ${\partial u^\prime }/{\partial y} < 0$ and the trailing edge of interfaces of LSSs at $M_c = 1.8$.