Hostname: page-component-586b7cd67f-g8jcs Total loading time: 0 Render date: 2024-11-26T17:03:10.933Z Has data issue: false hasContentIssue false

Impact of compliant coating on Mack-mode evolution in hypersonic boundary layers

Published online by Cambridge University Press:  23 October 2023
Xiaoyang Ji
Affiliation:
State Key Laboratory of Nonlinear Mechanics, Institute of Mechanics, Chinese Academy of Sciences, Beijing 100190, PR China School of Engineering Science, University of Chinese Academy of Sciences, Beijing 101408, PR China
Ming Dong*
Affiliation:
State Key Laboratory of Nonlinear Mechanics, Institute of Mechanics, Chinese Academy of Sciences, Beijing 100190, PR China
Lei Zhao*
Affiliation:
Department of Mechanics, Tianjin University, Tianjin 300072, PR China
*
Email addresses for correspondence: [email protected], [email protected]

Abstract

This paper focuses on the linear evolution of Mack instability modes in a hypersonic boundary layer over a flat plate that is partially coated by a compliant section. The compliant section is a thin, flexible membrane covering on a porous wall consisting of micro holes. The instability pressure could induce a vibration of the membrane, leading to a feedback to the boundary-layer fluids through the transverse velocity fluctuation. Such a process is formulated by an admittance boundary condition for the boundary-layer perturbation, which is dependent on the thickness and tension of the membrane, the properties of the porous wall, and the frequency of the Mack-mode perturbation. Using this admittance condition, the impact of the compliant coating on the Mack growth rate is studied systematically by solving the compressible Orr–Sommerfeld equations. It is found that the compliant coating could suppress the Mack instability with a frequency band in the neighbourhood of the most unstable frequency, and the stabilising frequency band widens as the membrane thickness and tension decrease, indicating a more favourable effect of a softer membrane. For a Mack mode with a specified dimensional frequency – since its dimensionless frequency, normalised by the local boundary-layer thickness and oncoming velocity, increases as it propagates downstream – the second-mode frequency band usually appears in downstream locations, and so does the stabilising effect of the membrane. Thus it is favourable to apply a compliant panel at a downstream region. In this situation, the solid–compliant junction could produce an additional scattering effect on the evolution of the Mack mode due to the sudden change of its boundary condition. The scattering effect is quantified by a transmission coefficient defined by the equivalent amplitude of the compliant-wall perturbation to the solid-wall perturbation, which can be obtained by the harmonic linearised Navier–Stokes (HLNS) approach. If the admittance is weak, then the transmission coefficient can also be predicted by an analytical solution based on the residue theorem. It is found that most of the second modes are suppressed by the scattering effect as long as the argument of the admittance is in the interval $[150^\circ, 210^\circ ]$, agreeing with most of the physical situation. The analytical predictions agree well with the HLNS calculations when the modulus of the admittance is less than $O(0.1)$.

Type
JFM Papers
Copyright
© The Author(s), 2023. Published by Cambridge University Press

1. Introduction

Since the surface friction and heat flux in laminar boundary layers are remarkably smaller than those in turbulent boundary layers, to develop a laminar-flow control (LFC) strategy to postpone the onset of transition to turbulence is favourable in the aerodynamic design of high-speed flying vehicles. In flight conditions, the environmental perturbations are usually low and the laminar–turbulence transition follows a natural route (Morkovin Reference Morkovin1969; Kachanov Reference Kachanov1994), which is initiated by the receptivity process to excite the boundary-layer instability modes, followed by their linear and nonlinear evolution, until the breakdown of the laminar phase and the emergence of the turbulence. Since the linear evolution of the instability modes dominates the laminar phase, most LFC designs are based on the suppression of the growth rates of the dominant linear instability modes.

1.1. Hypersonic boundary-layer instability

For hypersonic boundary layers, there exist a multiplicity of linear instability modes, which are referred to as the Mack first mode, second mode, etc., in ascending order of their frequencies; see Mack (Reference Mack1987). For an insulated supersonic boundary layer, the second mode becomes unstable when the oncoming Mach number $M$ is approximately greater than 4, and for cooler walls, the second mode could dominate at lower Mach numbers. Asymptotic analyses have revealed that only the first mode with an oblique wave angle greater than $\sqrt {M^2-1}$ is viscous, driven by the balance of the inertial, pressure-gradient and viscous terms, as pointed out based on the triple-deck theory by Smith (Reference Smith1986); the quasi-two-dimensional (quasi-2-D) first modes and all the higher-order modes are inviscid, associated with the generalised inflectional point, as studied asymptotically by Smith & Brown (Reference Smith and Brown1990) and Cowley & Hall (Reference Cowley and Hall1990).

The first step of the natural transition process, receptivity, is induced by the interaction of freestream perturbations with mean-flow distortions. The latter may appear in either the leading-edge vicinity or a local region where surface imperfections appear. These two types of mean-flow distortions link to two types of receptivity mechanisms, the leading-edge receptivity and the local receptivity. In supersonic or hypersonic boundary layers, the former was attributed to the synchronisation mechanism as formulated by Fedorov & Khokhlov (Reference Fedorov and Khokhlov1991, Reference Fedorov and Khokhlov2001) and Fedorov (Reference Fedorov2003a) based on the bi-orthogonal eigenvalue system, whereas the latter was described by a local scattering mechanism as formulated by Dong, Liu & Wu (Reference Dong, Liu and Wu2020), Liu, Dong & Wu (Reference Liu, Dong and Wu2020) and Zhao, He & Dong (Reference Zhao, He and Dong2023) based on the high-Reynolds-number asymptotic technique.

For a smooth wall, the length scale of the boundary-layer profile in the streamwise direction is much greater than the instability wavelength, for which the base flow can be assumed to be parallel to leading order, and linear stability theory can be used to describe the evolution of boundary-layer instability modes. Alternatively, one can employ the parabolised stability equation to take into account the weak non-parallelism of the base flow. However, application of the LFC strategy often induces a localised distortion on the mean flow or on the boundary-layer perturbation, and if its streamwise length scale is comparable with the instability wavelength, then the above approaches become invalid; such a scenario is referred to as the local scattering process. In the subsonic regime, the scattering of the Tollmien–Schlichting mode by a surface roughness element was formulated by Wu & Dong (Reference Wu and Dong2016b) using the triple-deck formalism. To quantify the scattering effect, they introduced a transmission coefficient defined by the amplitude of the downstream Tollmien–Schlichting mode to that upstream. In the large-Reynolds-number framework, the scattering system is reduced to a generalised eigenvalue problem based on the triple-deck formalism. However, for supersonic and hypersonic boundary layers, since the majority of the Mack instability is of an inviscid nature, the aforementioned system ceases to be valid, and the scattering process induced by roughness is described by a different asymptotic theory (Dong & Zhao Reference Dong and Zhao2021). Using the multi-scale analysis combined with the bi-orthogonal decomposition of the eigenmode, the transmission coefficient is expressed with the impacts of the instability property and mean-flow distortion being separated explicitly. The asymptotic theory was extended later to the scattering problem induced by surface heating or cooling strips (Zhao & Dong Reference Zhao and Dong2022). The accuracy of the asymptotic predictions was confirmed by comparing with the harmonic linearised Navier–Stokes (HLNS) calculations (Zhao, Dong & Yang Reference Zhao, Dong and Yang2019) and direct numerical simulations (DNS) (Dong & Li Reference Dong and Li2021; Li & Dong Reference Li and Dong2021).

1.2. Laminar-flow control

In the application of LFC strategies, the linear accumulations of the instability modes are of particular interest. Early numerical calculations (Mack Reference Mack1984) showed that the second mode, which is the most amplified perturbation, is usually destabilised when the wall temperature is reduced. However, subsequent theoretical (Malik Reference Malik1989) and experimental (Masad & Nayfeh Reference Masad and Nayfeh1992) works revealed that the transition could be delayed if a cooling or heating strip is located judiciously. A similar experimental observation was provided by Fujii (Reference Fujii2006), who reported that the transition could be delayed by a roughness element if the latter is placed at a relatively downstream location. This was confirmed later by the DNS results of Fong, Wang & Zhong (Reference Fong, Wang and Zhong2014) and Fong et al. (Reference Fong, Wang, Huang, Zhong, McKiernan, Fisher and Schneider2015), in which a critical location of the roughness was reported. If the roughness were placed downstream of this critical location, then the transition would be delayed; however, the opposite is true if the roughness is upstream of this location. The critical location was found to agree with the synchronisation point of the fast and slow modes, whose phase speeds approach the freestream fast and slow acoustic waves, respectively. Such a phenomenon was revisited recently by employing an efficient numerical approach, the HLNS approach, in Zhao et al. (Reference Zhao, Dong and Yang2019), and explained by an asymptotic model in Dong & Zhao (Reference Dong and Zhao2021) and Zhao & Dong (Reference Zhao and Dong2022), and the traditional e-N approach fails to predict this phenomenon due to the neglect of the non-parallelism. Because the oncoming condition of flying vehicles changes with the cruising altitude, the critical location would change accordingly, which makes a uniformly effective design almost impossible.

A porous coating with micro holes is considered as another type of LFC strategy that in general affects the evolution of boundary-layer perturbations without inducing evident mean-flow distortions. Because the Mack second mode shows an acoustic mode property, analogous to an acoustic wave reflecting and dissipating between the wall and the sonic line, the presence of the porous wall allows the acoustic wave to be directed into the micro holes and reflected with a different phase and amplitude. This can be modelled by an admittance boundary condition to the second mode, leading to a modification of the second-mode growth rate that eventually affects the transition onset.Fedorov et al. (Reference Fedorov, Shiplyuk, Maslov, Burov and Malmuth2003) developed a mathematical model to describe the admittance boundary condition for the boundary-layer perturbations, and found that the porous coating could suppress the second-mode growth rate and weakly affects the first mode. This was confirmed by numerical (Egorov, Fedorov & Soudakov Reference Egorov, Fedorov and Soudakov2008) and experimental (Rasheed et al. Reference Rasheed, Hornung, Fedorov and Malmuth2002) results. The nonlinear aspects of the porous coatings with regular microstructures were studied by Chokani et al. (Reference Chokani, Bountin, Shiplyuk and Maslov2005) using bi-orthogonal analysis, and the results indicate that the harmonic resonance is also suppressed by the porous coating. Guidelines for the choice of the hole depth and porosity were suggested by Brès et al. (Reference Brès, Inkman, Colonius and Fedorov2009, Reference Brès, Inkman, Colonius and Fedorov2013).

Although the porous coating shows superior behaviour compared to the localised roughness and heating/cooling strips due to its successive modification on the Mack-mode growth rate, there are still two shortcomings. First, in the engineering applications, the porous coatings may also induce surface geometric fluctuations, which may behave as distributed roughness and induce certain mean-flow distortions. As a result, the theoretical prediction of the instability growth may not agree with the real situation, so a favourable theoretical design may not be realised in practice. Second, the porous coating could suppress the perturbations in only a portion of the second-mode frequency band, and the stabilising frequency band is dependent of the properties of the porous coating and the oncoming condition. It is rather difficult to increase the stabilising frequency band because of the restriction of the phase angle of the admittance boundary condition. In fact, if the porous coating is covered by a thin, flexible membrane, then the surface geometric fluctuations are avoided, and the phase angle of the admittance boundary condition can be adjusted to a much wider extent, making a more efficient design possible. Gaponov (Reference Gaponov2014) investigated the linear stability of the supersonic boundary layer over a flexible membrane covering on a porous wall, and the decreases of the spatial growth rate of unstable disturbances in certain frequency bands can be observed for high Reynolds numbers. This strategy is our interest in this paper. The compliant coating applied in a hypersonic boundary layer is different from that applied in the low-speed boundary layers as in Carpenter & Morris (Reference Carpenter and Morris1990), because the latter is unable to respond effectively to the high-frequency forcing induced by the hypersonic Mack mode.

It is also reported by Song & Zhao (Reference Song and Zhao2022) that the porous coatings may enhance the Mack instability in upstream positions, but the stabilising effect is observed downstream. Therefore, it is rational to apply the porous coating section at a downstream location. In this situation, a rigid–porous junction could produce an additional scattering effect on the oncoming Mack mode due to the sudden change of the boundary condition, which was studied systematically by Song & Zhao (Reference Song and Zhao2022) using the HLNS approach. Such a scenario may also occur for compliant coatings. Therefore, in this paper, both the growth-rate modification and the scattering effect of the compliant coating will be considered.

The rest part of this paper is structured as follows. The physical model is introduced in § 2. In particular, the admittance boundary condition to the unsteady perturbation is formulated in § 2.3. Based on five representative case studies with different Mach numbers and wall temperatures, the impact of compliant coatings on the linear growth of Mack modes is discussed in § 3. In § 4, the numerical results for the scattering effect obtained by the HLNS calculations and the analytical predictions are presented and compared. Concluding remarks and discussions are provided in § 5.

2. Mathematical description

2.1. Physical model

The physical model to be considered is a 2-D isothermal flat plate with a partially coated compliant section inserted into a uniform hypersonic stream with a zero angle of attack, as shown in figure 1(a). A compliant section, which is a flexible thin membrane covering on a porous wall consisting of micro holes, is allocated from a distance $L^*$ downstream of the leading edge of the plate. Each hole of the porous wall is assumed to be a long pipe with its upper end connecting with the membrane and its lower end connecting with a rigid plug; see the sketches in figures 1(b,c). The compliant section may appear as an LFC strategy because it could lead to a change of the instability growth, as well as the downstream transition onset. To unveil the underlying mechanism, an oncoming Mack mode is introduced from the upstream solid-wall region. As it propagates over the compliant coating, two factors affecting the accumulated Mack amplitude appear, namely, (i) the Mack growth rate would be distorted successively, and (ii) a scattering effect due to the sudden change of the wall boundary condition would appear in the vicinity of the junction.

Figure 1. Schematic of the physical model: (a) side view; (b) top view; (c) zoom-in plot of a micro hole.

The oncoming flow is assumed to be a perfect gas, and the Cartesian coordinate system $(x^*,y^*,z^*)$ with its origin $o$ at the solid–compliant junction is employed. In what follows, an asterisk indicates a dimensional quantity. The characteristic length is defined as the local boundary-layer characteristic thickness at the origin, $\delta ^*=\sqrt {\nu _{e}^*L^*/U_{e}^*}$, where the subscript $e$ denotes the quantities of the oncoming flow, and $U_e^*$ and $\nu _e^*$ represent the dimensional velocity and the kinematic viscosity of the oncoming stream, respectively. The dimensionless coordinate system $(x,y,z)=(x^*,y^*,z^*)/\delta ^*$ and the time $t=t^*U_{e}^*/\delta ^*$ are introduced, and the velocity field $(u,v,w)$, density $\rho$, temperature $T$ and pressure $p$ are normalised by their freestream quantities:

(2.1)\begin{equation} (u,v,w,\rho,T,p)=\left(\frac{u^*}{U_e^*},\frac{v^*}{U_e^*}, \frac{w^*}{U_e^*},\frac{\rho^*}{\rho_e^*},\frac{T^*}{T_e^*}, \frac{p^*}{\rho_e^*U_e^*{}^2}\right).\end{equation}

The Reynolds number $Re$ and the oncoming Mach number $M$ are defined as

(2.2a,b)\begin{equation} Re=\frac{U_e^*\delta^*}{\nu_e^*}=\sqrt{\frac{U_e^* L^*}{\nu_e^*}},\quad M=\frac{U_e^*}{a_e^*}, \end{equation}

where $a_e^*$ is the sound speed of the oncoming stream. Here, $Re\gg 1$ and $M>1$ is chosen.The dimensionless dynamic viscous coefficient $\mu$ is assumed to satisfy the Sutherland's law, and the heat conductivity $\kappa$ is related to $\mu$ through a constant Prandtl number $Pr=0.72$. The dimensionless radius and depth of each micro hole are $R$ and $H$, respectively, and we take $R \ll H$.

2.2. Governing equations

The dimensionless Navier–Stokes (N–S) equations are (Dong & Zhao Reference Dong and Zhao2021)

(2.3a)$$\begin{gather} \frac{\partial \rho}{\partial t}+\boldsymbol{\nabla} \boldsymbol{\cdot}(\rho \boldsymbol{u})=0, \end{gather}$$
(2.3b)$$\begin{gather}\rho\,\frac{\partial \boldsymbol{u}}{\partial t}+\rho(\boldsymbol{u} \boldsymbol{\cdot}\boldsymbol{\nabla}) \boldsymbol{u}={-}\boldsymbol{\nabla} p+ \frac{1}{Re}\, \boldsymbol{\nabla}\boldsymbol{\cdot}(2 \mu \boldsymbol{e})+\frac{1}{Re}\, \boldsymbol{\nabla}\left(-\frac{2}{3}\,\mu\,\boldsymbol{\nabla} \boldsymbol{\cdot} \boldsymbol{u}\right), \end{gather}$$
(2.3c)$$\begin{gather}\frac{\partial T}{\partial t}+\rho(\boldsymbol{u} \boldsymbol{\cdot}\boldsymbol{\nabla}) T=(\gamma-1) M^{2} \left[\frac{\partial p}{\partial {t}}+(\boldsymbol{u} \boldsymbol{\cdot}\boldsymbol{\nabla}) p\right]+ \frac{\boldsymbol{\nabla}\boldsymbol{\cdot}(\mu\,\boldsymbol{\nabla} T)}{Pr\,Re}+\frac{(\gamma-1) M^{2} \varPhi}{Re}, \end{gather}$$
(2.3d)$$\begin{gather}\gamma M^{2} p=\rho T, \end{gather}$$

where the strain-rate tensor $\boldsymbol {e}$ and the dissipation function $\varPhi$ are expressed as

(2.4a,b)\begin{equation} e_{i j}=\frac{1}{2}\left(\frac{\partial u_{i}}{\partial x_{j}}+ \frac{\partial u_{j}}{\partial x_{i}}\right),\quad \varPhi=2 \mu \boldsymbol{e}\boldsymbol{:}\boldsymbol{e}-\frac{2}{3}\, \mu(\boldsymbol{\nabla}\boldsymbol{\cdot}\boldsymbol{u})^{2}, \end{equation}

and $\gamma =1.4$ denotes the ratio of the specific heats.

For simplicity, the physical quantities are denoted by $\boldsymbol {\varPhi }\equiv (u,v,w,T,p)^{\rm T}$. The instantaneous flow field is decomposed as a sum of the base flow $\boldsymbol {\varPhi }_0$ and the unsteady perturbation $\bar {\boldsymbol {\varPhi }}$:

(2.5)\begin{equation} \boldsymbol{\varPhi}(x,y,z,t)=\boldsymbol{\varPhi}_0(x,y)+\bar{\boldsymbol{\varPhi}}(x,y,z,t).\end{equation}

Because the radius of each micro hole is much smaller than the local boundary-layer thickness, the effect of the compliant coating does not lead to any distortion of the mean flow, and therefore the mean flow on either the solid wall or the compliant coating is described by the compressible Blasius similarity solution

(2.6)\begin{equation} \boldsymbol{\varPhi}_0=(U_{B},0,0,T_B,1/\gamma M^2)^{\rm T}+O(Re^{{-}1}), \end{equation}

where $U_B$ and $T_B$ are the profiles of the streamwise velocity and temperature, respectively. The mathematical description of the compressible Blasius solution can be found in Wu & Dong (Reference Wu and Dong2016a).

2.3. Model of the admittance boundary condition on the compliant coating

Following Gaponov (Reference Gaponov2014), the compliant-wall effect on the unsteady perturbations can be modelled by an admittance boundary condition. When a perturbation in the boundary layer propagates over the compliant coating, the perturbation pressure at the wall excites an oscillation of the membrane. The latter acts as a sound generator to induce acoustic waves propagating along the micro holes underneath, as sketched in figure 1(c). The acoustic wave then reflects after reaching the bottom end of the holes, adjusting the phase of the oscillation of the membrane. In principle, the vibration of the membrane surface and the propagation of the acoustic waves could be resolved by DNS, which, however, require huge computational cost. In this subsection, an alternative means is employed, namely, describing the perturbation evolution over an equivalent rigid wall with an admittance boundary condition.

The acoustic propagation in a long pipe can be formulated based on the work of Tijdeman (Reference Tijdeman1975). The dimensionless density, temperature and viscosity of the gas inside the micro holes are denoted by $\rho _h$, $T_h$ and $\mu _h$, respectively. These values remain uniform throughout the hole. The perturbations propagating in the hole are described by a local cylindrical coordinate system $(\bar r,\theta,\bar \xi )$, as shown in figure 1(c). Noticing that the internal hole radius $R$ is much smaller than the acoustic wavelength (${\sim }2{\rm \pi} \sqrt {T_h}/(\omega M)$), two rescaled coordinates are introduced:

(2.7a,b)\begin{equation} r=\bar r/R,\quad \xi=\omega M \bar \xi/\sqrt{T_h},\end{equation}

where $r\in [0,1]$ and $\xi \in [-H_0,0]$, with $H_0=H\omega M/\sqrt {T_h}$. The ratio of the two length scales is quantified by a dimensionless parameter $\varOmega =\omega RM / \sqrt {T_h}\ll 1$.

The acoustic perturbations of the axial velocity, radial velocity, pressure, temperature and density in the hole are expressed as

(2.8)\begin{equation} \left(\frac{\sqrt{T_h}}{M}\,v_\xi,\varOmega\, \frac{\sqrt{T_h}}{M}\,v_r,\frac{\rho_hT_h}{\gamma M^2}\,p_s,T_h\theta_s,\rho_h\rho_s\right) \exp({-{\rm i}\omega t})+{\rm c.c.}, \end{equation}

where $v_\xi$, $v_r$, $p_s$, $\theta _s$ and $\rho _s$ denote the rescaled quantities, and ${\rm c.c.}$ denotes the complex conjugate. Similar to the analysis in Tijdeman (Reference Tijdeman1975), the acoustic velocity and pressure are

(2.9a)$$\begin{gather} v_\xi=\frac{{\rm i} }{\gamma}\,\frac{{\rm d} p_s}{{\rm d}\xi}\left[1-\frac{J_0 \langle\sqrt{{\rm i}}\,r s\rangle }{J_0 \langle\sqrt{{\rm i}}\,s\rangle }\right], \end{gather}$$
(2.9b)$$\begin{gather}p_s=A(\exp({\varGamma\xi+2\varGamma H_0})+\exp({-\varGamma\xi})), \end{gather}$$

where

(2.10a)$$\begin{gather} \varGamma=\sqrt{\left[\gamma+(\gamma-1)\,\frac{J_{2}\left\langle\sqrt{{\rm i}\,Pr}\,s\right\rangle}{J_{0} \left\langle\sqrt{{\rm i}\,Pr}\,s\right\rangle}\right]\frac{J_{0}\left\langle \sqrt{{\rm i}}\,s\right\rangle}{J_{2} \left\langle\sqrt{{\rm i}}\,s\right\rangle}}, \end{gather}$$
(2.10b)$$\begin{gather}s=R\sqrt{Re\,\rho _h\omega/\mu _h}. \end{gather}$$

Here, $A$ is an arbitrary constant related to the acoustic amplitude, and $J_n$ is the Bessel function of the $n$th order.

The investigation of the correlation between the perturbation velocity and the pressure at the upper end of the membrane, particularly at the location where $\xi = 0$, is of interest. Because the radii of the holes are sufficiently small, the wall-normal movement of the membrane is related to the averaged axial velocity at the upper end of each hole by the equation

(2.11)\begin{equation} \bar{v}_\xi(0)=\frac{1}{\rm \pi}\int_{0}^{1} 2{\rm \pi} r\,v_\xi(0,r)\,{\rm d} r={-}\frac{{\rm i}\varGamma\,J_2(\sqrt{{\rm i}}\,s)}{\gamma\,J_0(\sqrt{{\rm i}}\,s)}\tanh (\varGamma H_0)\,p_s(0).\end{equation}

Introducing the dimensionless perturbation mean velocity $v_p(\xi )=\sqrt {T_h}\,\bar {v}_{\xi }(\xi )/M$, the perturbation pressure $p_p(\xi )=\rho _hT_h\bar {p}_s/\gamma M^2$ and the thickness $H=H_0\sqrt {T_h}/\omega M$, (2.11) can be rewritten as

(2.12)\begin{equation} v_p(0)={-}\frac{\tanh (\varLambda H)}{Z_0}\,p_p(0),\end{equation}

where

(2.13a)$$\begin{gather} Z_0=\sqrt{Z_1/Y_1},\quad \varLambda=\sqrt{Z_1Y_1}, \end{gather}$$
(2.13b)$$\begin{gather}Z_1=\frac{{ {\rm i}} \omega}{T_h}\,\frac{J_0(\sqrt{{\rm i}}\,s)}{J_2(\sqrt{{\rm i}}\,s)},\quad Y_1={-}{{\rm i}}\omega M^2\left[\gamma+(\gamma-1)\,\frac{J_2(\sqrt{{\rm i}\,Pr}\,s)}{J_0(\sqrt{{\rm i}\,Pr}\,s)}\right]. \end{gather}$$

Note that the relation (2.12) denotes the velocity–pressure relation of the acoustic wave at one single hole. If a multiplicity of micro holes are considered, then the porosity of the surface $n$ needs to be introduced to denote the area of the holes per unit area. Therefore, the total velocity at the lower surface of the membrane should be $v_w = n\,v_p(0)$, and (2.12) is recast to

(2.14)\begin{equation} v_w=K\,p_p(0)\quad\mbox{with }K={-}\frac{n\tanh (\varLambda H)}{Z_0}. \end{equation}

Then we focus on the movement of the membrane. Let $h$, $\rho _m$ and $\varTheta$ denote the dimensionless thickness, density and tension coefficient of the membrane, respectively, as shown in figure 2. The pressure at the upper surface is denoted by $p_w\exp ({-{\rm i} \omega t})$, and that at the lower surface is equal to $p_p(0)\exp ({-{\rm i} \omega t})$. The vertical movement of the membrane $y_m\exp ({-{\rm i}\omega t})$ is described by

(2.15)\begin{equation} -\omega^2 a{y_m}={-}by_m+n(p_p(0)-p_{w}), \end{equation}

where $a$ and $b$ represent the normalised thickness and surface tension of the membrane,

(2.16a,b)\begin{equation} a={\rho _{m}h},\quad b=\frac{\varTheta}{{\rm \pi} {R}^2}. \end{equation}

The movement of the membrane is related to the velocity of the acoustic wave at the upper end of the hole via

(2.17)\begin{equation} v_w={-}{\rm i}\omega y_m. \end{equation}

By eliminating $p_p(0)$ and $y_m$ from (2.14), (2.15) and (2.17), the relation between $v_w$ and $p_w$ in the spectrum space is obtained as

(2.18)\begin{equation} v_w=\mathcal{A} p_w, \end{equation}

where the admittance of the compliant coating is

(2.19)\begin{equation} \mathcal{A}=\frac{n}{{\rm i}\omega a-{\rm i}{b}/{\omega}+{n}/{K}}. \end{equation}

If the thickness and tension of the membrane are zero, i.e. $a=b=0$, then the admittance condition recovers to that of the porous wall, so the porous-wall admittance is $K$. The admittance sometimes also appears as an impedance, which is the reciprocal of the former (Scalo, Bodart & Lele Reference Scalo, Bodart and Lele2015; Chen & Scalo Reference Chen and Scalo2021). At first glance, we may find that the denominator of $\mathcal {A}$ shares the same form as the Helmholtz resonator impedance model as in Tam & Auriault (Reference Tam and Auriault1996), but there are certain differences.

Figure 2. Schematic of the movement of the membrane (not to scale).

An archetypal Helmholtz resonator consists of a neck and a cavity, and the length scales of both components are much smaller than the acoustic wavelength. The mathematical details from (2.7a,b)–(2.14) are also valid for the impedance model for a Helmholtz resonator, but we need to take $H$ to be much smaller than the acoustic wavelength. Such a short length is not sufficient to damp the acoustic energy apparently, so the viscosity is negligible. Therefore, we may take $s\gg 1$ and $H\ll 1$. Under such conditions, we can approximate the ratio of the Bessel functions as

(2.20)\begin{equation} \frac{J_0(\sqrt{{\rm i}}\,s)}{J_2(\sqrt{{\rm i}}\,s)}\approx{-}1-\frac{\sqrt{2}}{s}\,(1+{\rm i}). \end{equation}

Thus the equations in (2.13) are approximated by

(2.21a,b)\begin{equation} \left.\begin{gathered} Z_0\approx \frac{1}{\sqrt{T_h}\,M}\left[1+\frac{(1+{\rm i}) \left(\sqrt{Pr}+1-\gamma\right)}{\sqrt{2\,Pr}\,s}\right],\\ \varLambda\approx \frac{\omega M}{\sqrt{T_h}}\left[-{\rm i}+\frac{\left(1-{\rm i}\right) \left(\sqrt{Pr}-1+\gamma\right)}{\sqrt{2\,Pr}\,s}\right], \end{gathered}\right\} \end{equation}

and the impedance is expressed as

(2.22)\begin{equation} \bar Z={-}K^{{-}1}\approx \frac{-{\rm i}}{n M\sqrt{T_h}}\left(\frac{MH}{3\sqrt{T_h}}\, \omega-\frac{\sqrt{T_h}}{MH}\,\omega^{{-}1}\right).\end{equation}

Here, the negative sign in front of $K^{-1}$ is because the definition of the velocity direction in our paper is different from that in Tam & Auriault (Reference Tam and Auriault1996). This formula agrees with the analysis in Fahy (Reference Fahy2001). The impedance (2.22) under the inviscid approximation is pure imaginary. The term proportional to the frequency $\omega$ represents the stiffness, while the term inversely proportional to the frequency represents the elasticity. If the viscosity is taken into account, then a small real part is added to the impedance:

(2.23)\begin{equation} \bar Z=\bar R-\frac{{\rm i}}{n M\sqrt{T_h}}\left(\frac{MH}{3\sqrt{T_h}}\, \omega-\frac{\sqrt{T_h}}{MH}\,\omega^{{-}1}\right).\end{equation}

In this sense, the real part $\bar R$ is usually much smaller than the imaginary part, and independent of $\omega$, and the coefficients of $\omega$ and $\omega ^{-1}$ can be obtained experimentally by curve fitting (Tam & Auriault Reference Tam and Auriault1996).

However, for the long-hole porous wall studied in this paper, $H$ is much greater than the acoustic wavelength, so the acoustic wave may damp remarkably when reaching the bottom of the hole from its open side, implying that the viscosity is non-negligible. Also, the radii of the holes are much smaller than unity, leading to a small $s$ value. In the limit of $s\ll 1$, we have

(2.24)\begin{equation} \frac{J_2(\sqrt{{\rm i}}\,s)}{J_0(\sqrt{{\rm i}}\,s)}\approx {\rm i}\,\frac{s^2}{8}. \end{equation}

Similar to the analysis from (2.21a,b) to (2.22), the impedance of the long-hole porous wall is

(2.25)\begin{equation} \bar Z\approx \frac{2(1+{\rm i})}{nM\sqrt{\gamma T_h}}\,s^{{-}1}. \end{equation}

The argument of $\bar Z$ is approximately $45^\circ$, so from the definition ($\bar Z=-K^{-1}$) we know that the argument of the admittance $K$ for a long-hole porous wall is approximately $135^\circ$. Because in this model the viscous effect has already been considered, no additional term as in (2.23) is needed. Different from the short-hole Helmholtz resonator, the impedance of the long-hole porous wall has comparable real and imaginary parts, both of which are dependent on $\omega$ since $s\sim \sqrt {\omega }$.

When the compliant coating is covered on the surface of the long-hole porous wall, the property of the impedance is modified as

(2.26)\begin{equation} \bar Z_c=\bar Z-\frac{{\rm i}}{n}\,(a\omega -b/\omega). \end{equation}

Since $a$ and $b$ represent the thickness and surface tension of the membrane, they are related to the stiffness and elasticity, respectively, which, in principle, agrees with the analysis of the Helmholtz resonator in Fahy (Reference Fahy2001). However, $\bar Z$ in (2.26) is complex and dependent on $\omega$, in contrast to $\bar R$ in (2.23).

For moderate $a$ and $b$ values, the application of the compliant coating is to broaden the argument range of the impedance or admittance of the porous coating, which will be favourable in the application of the LFC, as will be shown later. The above analysis also indicates that an acoustic liner, consisting of an array of Helmholtz resonators, if applicable in hypersonic configurations, may also be a good candidate for the strategy of the LFC.

The quantities $\varLambda$ and $Z_0$ in the definition of $K$ in (2.14) are dependent on $s$, which is related to the density of the gas in the holes $\rho _h$ via (2.10b). Therefore, $\rho _h$ affects $K$ indirectly. Because the outer gas in the boundary layer and the inner gas inside the holes are separated by the membrane, the densities of the two gas flows could be different, i.e. $\rho _h\ne \rho _B(0)$. Thus $C_\rho \equiv \rho _h/\rho _B(0)$ is introduced to quantify the ratio of the two densities. The relation (2.18) appears as the admittance boundary condition for the Mack instability as it propagates over the compliant coating, and the admittance $\mathcal {A}$ is determined by $(a,b,C_\rho,H,R,n,\omega )$.

2.4. Linear stability theory

At a position away from the solid–compliant junction, the base flow shows a weakly non-parallel feature, and the propagation of a linear Mack mode, with an $O(1)$ wavelength, is expressed in a Wenzel–Kramers–Brillouin form

(2.27)\begin{equation} \bar{\boldsymbol{\varPhi}}(x,y,z,t)=\mathcal{E}\,\hat{\boldsymbol{\varPhi}}(y;X) \exp\left[{{\rm i}\left(\int\alpha(x)\,{{\rm d}\kern0.06em x}+\beta z -\omega t\right)}\right]+{\rm c.c.}, \end{equation}

where $X=x/Re$ denotes a slow coordinate associated with the non-parallelism of the basic flow, $\mathcal {E}\ll 1$ denotes its amplitude, and $\hat {\boldsymbol {\varPhi }}$ is the Mack-mode eigenfunction. Here, $\omega$ is the frequency of the Mack mode, which is the same as the frequency of the acoustic perturbation propagating in the micro holes; $\alpha$ and $\beta$ are the streamwise and spanwise wavenumbers, respectively, and for a spatial mode, $\omega$ and $\beta$ are taken to be real, while $\alpha \equiv \alpha _r+\textrm{i}\alpha _i$ is complex, with $-\alpha _i$ representing the growth rate. The wall pressure perturbation is set to be unity for normalization, namely, $\hat p(0; X)=1$.

By substituting (2.5) and (2.27) into the compressible N–S equations (2.3) and neglecting the non-parallelism, the compressible Orr–Sommerfeld (O–S) equations are obtained:

(2.28)\begin{equation} \mathcal{L}_{OS}(\omega,\alpha,\beta;Re)\,\hat{\boldsymbol{\varPhi}}=0,\end{equation}

where $\mathcal {L}_{OS}$ is the O–S operator and can be found in Malik (Reference Malik1990) and Wu & Dong (Reference Wu and Dong2016a). The attenuation condition is imposed in the far field:

(2.29)\begin{equation} \hat{\boldsymbol{\varPhi}}\rightarrow 0\quad \mbox{as}\ y\rightarrow \infty. \end{equation}

Note that for a very cold wall, a radiating mode may appear near the upper-branch neutral frequency of the second mode, for which the far-field boundary condition should be replaced by the Neumann type, namely, each perturbation quantity for a sufficiently large $y$ is related linearly to its $y$-derivative; see Chuvakhov & Fedorov (Reference Chuvakhov and Fedorov2016) and Zhao & Dong (Reference Zhao and Dong2022). For the solid wall, the no-slip, non-penetration and isothermal conditions are imposed:

(2.30)\begin{equation} (\hat{u},\hat{v},\hat{w},\hat{T})=(0,0,0,0)\quad \mbox{at}\ y=0. \end{equation}

At the compliant coating, the wall-normal velocity perturbation is related to the pressure perturbation via (2.18), and the no-slip and isothermal conditions in (2.30) are still valid. Thus the boundary conditions for the compliant coating are

(2.31)\begin{equation} (\hat{u},\hat{v},\hat{w},\hat{T})=(0,\mathcal{A}\hat{p},0,0)\quad \mbox{at}\ y=0. \end{equation}

The linear system (2.28) with boundary conditions (2.29) and (2.30) or (2.31) forms an eigenvalue problem, which can be solved numerically following Malik (Reference Malik1990), Dong et al. (Reference Dong, Liu and Wu2020) and Dong & Zhao (Reference Dong and Zhao2021). In the following, the eigenvalues and eigenfunctions of Mack modes on the solid and compliant walls are distinguished by subscripts $s$ and $c$, respectively.

2.5. An analytical solution of the scattering process for small-admittance configurations

Now we consider the evolution of the Mack instability around the solid–compliant junction. At a sufficiently upstream position, a Mack mode on the solid wall is introduced, and its boundary condition is changed as it propagates over the junction. If the norm of the admittance $|\mathcal {A}|$ is sufficiently small, then the scattering effect can be quantified by an analytical solution. For convenience, a small parameter $\bar {\varepsilon } =|\mathcal {A}|\ll 1$ is introduced, and $\bar {\mathcal {A}}={\mathcal {A}}/\bar \varepsilon$. Note that $|\bar {\mathcal {A}}|=1$. Under such a condition, the difference of the growth rates between the solid and compliant walls is only $O(\bar \varepsilon )$.

The perturbation field is expressed in terms of a perturbative form

(2.32)\begin{equation} \bar{\boldsymbol{\varPhi}}=\mathcal{E} \left(\tilde{\boldsymbol{\varPhi}}_0(x,y)+ \bar\varepsilon\,\tilde{\boldsymbol{\varPhi}}_1(x,y)+\cdots\right) \exp({{\rm i}(\beta z -\omega t)})+c.c., \end{equation}

where the $O(\mathcal {E}\bar \varepsilon )$ term is the modification induced by the solid–compliant junction. The no-slip, non-penetration and isothermal conditions are imposed for $\tilde {\boldsymbol {\varPhi }}_0$. However, for the second-order perturbation, the transverse velocity $\tilde v_1$ yields

(2.33)\begin{equation} \tilde v_1(x,0)=H(x)\,\bar{\mathcal{A}}\,\tilde p_0(x,0), \end{equation}

where $H(x)$ is the Heaviside step function. Substituting (2.32) into the N–S equations (2.3), and performing the Fourier transform with respect to $x$, $\breve {\boldsymbol {\varPhi }}(k,y)=\mathscr {F}[\tilde {\boldsymbol {\varPhi }}]=(1/\sqrt {2{\rm \pi} })$$\int_{-\infty}^{\infty}\tilde{\boldsymbol{\varPhi}}(x, y) \exp (-\mathrm{i} k x) \mathrm{d}\kern 0.06em x$, the leading-order system is obtained as

(2.34)\begin{equation} \left. \begin{aligned} &\mathcal{L}_{OS}(\omega,k,\beta;Re)\,\breve{\boldsymbol{\varPhi}}_0=0,\\ &(\breve u_0,\breve{v}_0,\breve w_0, \breve T_0)=\left(0,0,0,0\right) \mbox{ at} \ y=0;\quad \breve{\boldsymbol{\varPhi}}_0(k,\infty)\rightarrow 0. \end{aligned}\right\} \end{equation}

The eigenvalue system (2.34) is the same as that introduced in § 2.4 for the solid-wall configuration, and its eigenvalue solution is denoted by $k=\hat \alpha$. The second-order perturbation field $\tilde {\boldsymbol {\varPhi }}_1$ is governed by

(2.35)\begin{equation} \left. \begin{aligned} &\mathcal{L}_{OS}(\omega,k,\beta;Re)\,\breve{\boldsymbol{\varPhi}}_1=0,\\ &(\breve u_1,\breve{v}_1,\breve w_1, \breve T_1)= \left(0,\dfrac{-{\rm i}\bar{\mathcal{A}}\,\breve{p}_0(0;\hat\alpha)}{\sqrt{2{\rm \pi}} (k-\hat\alpha)},0,0\right) \mbox{ at} \ y=0; \quad \breve{\boldsymbol{\varPhi}}_1(k,\infty)\rightarrow 0. \end{aligned} \right\} \end{equation}

Here, $\breve {p} _0(0; \hat {\alpha })$ is set to be unity for normalization.

Considering that the linear operator $\mathcal {L}_{OS}$ has poles at $k=\hat {\alpha }$, the response of $\tilde {\boldsymbol {\varPhi }}_1|_{k=\hat \alpha }$ may become infinite. In the physical space, the second-order perturbation is obtained by performing the inverse Fourier transform

(2.36)\begin{equation} \tilde{\boldsymbol{\varPhi}}_1(x,y)=\mathscr{F}^{{-}1}[\breve{\boldsymbol{\varPhi}}_1(k,y)]= \frac{1}{\sqrt{2{\rm \pi}}}\int_{-\infty}^{\infty}\breve{\boldsymbol{\varPhi}}_1(k,y)\,{\rm e}^{{\rm i} kx}\,{\rm d} k. \end{equation}

The integral on the right-hand side may be evaluated by closing the integration contour in the upper half complex $k$-plane. The inverse Fourier integral corresponds to a sum of contributions from the poles and branch cuts of the integrand $\breve {\boldsymbol {\varPhi }}_1\,\textrm {e}^{\textrm {i} kx}$. The contributions from the latter represent the near field in the vicinity of the junction, and decay algebraically as $x \rightarrow \infty$. The disturbance sufficiently downstream is dominated by the contribution from the pole, which is evaluated by use of the residue theorem:

(2.37)\begin{equation} \tilde{\boldsymbol{\varPhi}}_1\rightarrow {{\rm i}}\sqrt{2{\rm \pi}}\,\textrm{Res}_{k=\hat{\alpha}} [\breve{\boldsymbol\varPhi}_{1}(k,y)\,{\rm e}^{{\rm i} kx}]\quad \mbox{as}\ x\rightarrow \infty. \end{equation}

Interestingly, the wall boundary condition of $\tilde {v}_1$ in (2.35) is also singular at $k=\hat {\alpha }$, rendering a second-order singularity of the system. Expressing $\breve {\boldsymbol {\varPhi }}_1$ in terms of the Laurent series in the neighbourhood of $k=\hat {\alpha }$,

(2.38)\begin{equation} \breve{\boldsymbol{\varPhi}}_1( k,y ) =\boldsymbol{c}_{{-}2}\, \frac{1}{( k-\hat{\alpha} ) ^2}+\boldsymbol{c}_{{-}1}\, \frac{1}{( k-\hat{\alpha} )}+\sum_{n=0}^{\infty}{\boldsymbol{c}_n (k-\hat{\alpha} )^n}, \end{equation}

the residual is expressed as

(2.39)\begin{equation} \textrm{Res}_{k=\hat{\alpha}}[\breve{\boldsymbol{\varPhi}}_1(k,y)\,{\rm e}^{{\rm i} k x}]= \lim _{k\rightarrow \hat{\alpha}}\frac{{\rm d}}{{\rm d} k}\left[ ( k-\hat{\alpha} )^2\, \boldsymbol{\breve{\boldsymbol{\varPhi}}}_1( k,y )\,{\rm e}^{{\rm i} k x} \right]= (\boldsymbol{c}_{{-}1}+{\rm i} x\boldsymbol{c}_{{-}2})\,{\rm e}^{{\rm i}\hat \alpha x}. \end{equation}

In order to obtain $\boldsymbol c_{-1}$ and $\boldsymbol c_{-2}$, we solve (2.35) at two perturbed wavenumbers $k=\hat {\alpha }\pm \varDelta _\alpha$, with $\varDelta _\alpha \ll 1$. Thus $\boldsymbol {c}_{-1}$ and $\boldsymbol {c}_{-2}$ are calculated by

(2.40a)$$\begin{gather} \bar c_{{-}1}=\lim_{\varDelta_{\alpha}\rightarrow0}\frac{\varDelta_{\alpha}}{2} \left[\breve{\varPhi}_1(\hat{\alpha}+\varDelta_\alpha)-\breve{\varPhi}_1 (\hat{\alpha}-\varDelta_\alpha)\right], \end{gather}$$
(2.40b)$$\begin{gather}\bar c_{{-}2}=\lim_{\varDelta_{\alpha}\rightarrow0}\frac{\varDelta_\alpha^2}{2} \left[\breve{\varPhi}_1(\hat{\alpha}+ \varDelta_\alpha)+\breve{\varPhi}_1(\hat{\alpha}-\varDelta_\alpha)\right], \end{gather}$$

where the notations $\bar c_{-1}, \bar c_{-2}, \breve {\varPhi }_1$ represent each component in $\boldsymbol {c}_{-1}, \boldsymbol {c}_{-2}, \breve {\boldsymbol {\varPhi }}_1$, respectively.

By substituting (2.39) into (2.37), the second-order perturbation is recast to

(2.41)\begin{equation} \tilde{\boldsymbol{\varPhi}}_1\rightarrow \sqrt{2{\rm \pi}}\,\textrm{i}(\boldsymbol{c}_{{-}1}+ \textrm{i}x\boldsymbol{c}_{{-}2})\,{\rm e}^{{\rm i} \hat{\alpha}x}\quad \mbox{as}\ x \rightarrow \infty. \end{equation}

Actually, because of the change of the wall boundary condition, the Mack growth rate over the downstream compliant coating $\alpha _c$ differs from that over the upstream solid wall $\hat \alpha$ by a factor $\epsilon _\alpha =\alpha _c-\hat \alpha$. For a weak admittance, i.e. $|\epsilon _\alpha |\ll 1$, the downstream perturbation should grow like $\exp ({\textrm {i} (\hat \alpha +\epsilon _{\alpha } )x})\approx \textrm {e}^{\textrm {i}\hat \alpha x}(1+\textrm {i} \epsilon _\alpha x)$. Thus the emergence of the $x\,\textrm {e}^{\textrm {i} \hat \alpha x}$ term in (2.41) is due to the successive modification of the Mack growth rate by the weak admittance, which is irrelevant to the scattering effect at the junction.

The first term on the right-hand side of (2.41) shows a pure exponential growth $\textrm {e}^{\textrm {i} \hat \alpha x}$, which characterises the scattering effect at the junction. Thus the scattering effect is quantified by introducing a transmission coefficient as in Wu & Dong (Reference Wu and Dong2016b) and Dong & Zhao (Reference Dong and Zhao2021), which is defined as the ratio of the equivalent amplitude of the downstream Mack modes to that upstream:

(2.42)\begin{equation} \mathscr{T}=1+\bar{\varepsilon}\sqrt{2{\rm \pi}}\,\textrm{i} c_{{-}1}, \end{equation}

where $c_{-1}$ is the element of $\boldsymbol {c}_{-1}$ corresponding to the wall pressure, namely,

(2.43)\begin{equation} c_{{-}1}=\lim_{\varDelta_{\alpha}\rightarrow0}\frac{\varDelta_{\alpha}}{2} \left[\breve{p}_1(\hat{\alpha}+\varDelta_\alpha,0)-\breve{p}_1(\hat{\alpha}-\varDelta_\alpha,0)\right]. \end{equation}

Likewise,

(2.44)\begin{equation} c_{{-}2}=\lim_{\varDelta_{\alpha}\rightarrow0}\frac{\varDelta_{\alpha}^2}{2} \left[\breve{p}_1(\hat{\alpha}+\varDelta_\alpha,0)+\breve{p}_1(\hat{\alpha}-\varDelta_\alpha,0)\right] \end{equation}

is introduced to quantify the growth-rate modification in the downstream compliant coating.

2.6. HLNS calculations for $O(1)$-admittance configurations

If the norm of the admittance is $O(1)$, then the aforementioned analytical solution does not apply, and a numerical approach is required. Because of the sudden change of the wall boundary condition at the solid–compliant junction, the O–S equations under the parallel-flow assumption cease to be valid. Therefore, an elliptic approach needs to be introduced, i.e. the HLNS approach, to calculate the perturbation field in the vicinity of the junction. Now, the perturbation field is expressed as

(2.45)\begin{equation} \bar{\boldsymbol{\varPhi}}=\mathcal{E}\,\tilde{\boldsymbol{\varPhi}}(x,y)\, \exp({{\rm i}(\alpha_0 x+\beta z -\omega t)})+{\rm c.c.}.\end{equation}

Being different from (2.32), a reference complex wavenumber $\alpha _0$ is introduced to ease the numerical process; see a detailed illustration in Zhao et al. (Reference Zhao, Dong and Yang2019). Here, $\alpha _0$ is chosen simply from the O–S solution based on the base flow at the inlet of the computation domain. In contrast to the travelling wave form (2.27), $\tilde {\boldsymbol {\varPhi }}$ is allowed to vary quickly in both the $x$ and $y$ directions, in order to account for the scattering effect at the solid–compliant junction.

Substituting (2.45) into the N–S equations (2.3) and retaining the $O({\mathcal {E}})$ terms, we arrive at the harmonic linearised equation system,

(2.46) \begin{equation} \left(\boldsymbol{\mathsf{D}}+\boldsymbol{\mathsf{A}}\,\frac{\partial}{\partial x}+\boldsymbol{\mathsf{B}}\, \frac{\partial}{\partial y}+{\mathsf{V}}_{xx}\,\frac{\partial^2}{\partial x^2}+{\mathsf{V}}_{yy}\, \frac{\partial^2}{\partial y^2}+{\mathsf{V}}_{xy}\,\frac{\partial^2}{\partial x\,\partial y}\right) \tilde{\boldsymbol{\varPhi}}(x,y)=0, \end{equation}

where $\boldsymbol{\mathsf{D}}$, $\boldsymbol{\mathsf{A}}$, $\boldsymbol{\mathsf{B}}$, ${\mathsf{V}}_{xx}$, ${\mathsf{V}}_{xy}$ and ${\mathsf{V}}_{yy}$ are $5\times 5$ order coefficient matrices that can be found in Zhao et al. (Reference Zhao, Dong and Yang2019). The boundary conditions are $\tilde {\boldsymbol {\varPhi }}(x,\infty )\rightarrow 0$ and $\tilde {u}(x,0)=\tilde {w}(x,0)=\tilde {T}(x,0)=0$. In particular, the transverse velocity at the wall is $\tilde {v}(x,0)=H(x)\,\mathcal {A}\,\tilde {p}(x,0)$, where, again, $H(x)$ denotes the Heaviside step function. At the inlet of the computation domain, $x=x_0$, where the non-parallelism is rather weak, the perturbation is described by the O–S solution for a solid wall, $\hat {\boldsymbol {\varPhi }}_s$, whose amplitude is set to be unity for normalisation. The outflow condition is applied at the outlet of the computational domain.

The HLNS equations are discretised in a 2-D computational domain $x\in [x_0,x_I]$ and $y \in [0,y_{J}]$, and the numbers of the grid points are $I+1$ and $J+1$ in the streamwise and wall-normal directions, respectively. Therefore, the discretisation ultimately yields a linear algebraic equation system

(2.47)\begin{equation} \boldsymbol{\mathsf{S}}\tilde{\boldsymbol{q}}=\tilde{\boldsymbol{r}}, \end{equation}

where $\boldsymbol{\mathsf{S}}$ is a $5(I+1)(J+1)\times 5(I+1)(J+1)$ dimension matrix, and

(2.48)\begin{equation} \tilde{\boldsymbol{q}}=\left(\tilde{\boldsymbol{\varPhi}}_{0,0}^{\rm T},\ldots, \tilde{\boldsymbol{\varPhi}}_{0,J}^{\rm T},\ldots,\tilde{\boldsymbol{\varPhi}}_{i,0}^{\rm T},\ldots, \tilde{\boldsymbol{\varPhi}}_{i,J}^{\rm T},\ldots,\tilde{\boldsymbol{\varPhi}}_{I,0}^{\rm T},\ldots, \tilde{\boldsymbol{\varPhi}}_{I,J}^{\rm T}\right)^{\rm T}. \end{equation}

The scattering effect of the solid–compliant junction could be quantified by solving the aforementioned linear system. In the upstream and downstream limits, the perturbations behave as

(2.49)$$\begin{gather} \tilde{\boldsymbol{\varPhi}}\exp({{\rm i}\alpha_0 x})\rightarrow A_s\, \hat{\boldsymbol{\varPhi}}_s(y;x)\exp\left({{\rm i} \int_0^x\alpha \,{{\rm d}\kern0.06em x}}\right)\quad\mbox{as}\ x\rightarrow -\infty, \end{gather}$$
(2.50)$$\begin{gather}\tilde{\boldsymbol{\varPhi}}\exp({{\rm i}\alpha_0 x})\rightarrow A_c\, \hat{\boldsymbol{\varPhi}}_c(y;x)\exp\left({{\rm i} \int_0^x\alpha \,{{\rm d}\kern0.06em x}}\right)\quad\mbox{as}\ x\rightarrow \infty, \end{gather}$$

where $A_s$ and $A_c$ characterise the equivalent amplitude and phase of the Mack modes on the solid and compliant walls, respectively. They are obtained by curve fitting from the HLNS calculations. Note that the $c_{-2}x\,\textrm {e}^{\textrm {i}\hat \alpha x}$ term as in (2.41) is included in the exponent $\exp ({\textrm {i} \int _0^x\alpha \,{\textrm {d}x}})$. According to (2.42), the transmission coefficient is calculated by the HLNS approach as

(2.51)\begin{equation} \mathscr{T}={A_c}/{A_s}. \end{equation}

Equation (2.51) can be compared to (2.42) when $|{\mathcal {A}}|$ is sufficiently small.

3. Numerical results

3.1. Case studies and the base flow

For demonstration, five case studies are selected as shown in table 1. Each case is labelled by a four-character string. The first two characters represent the Mach number $M$, which is ‘M1’ for $M=5.92$ and ‘M2’ for $M=4.5$; the last two characters represent the wall temperature, where ‘T1’, ‘T2’, ‘T3’ and ’T4’ are for $T_w/T_{ad}=1, 0.75, 0.5, 0.25$. Here, $T_{ad}$ is the adiabatic wall temperature. These cases were also considered for the study of the scattering of Mack instability by surface heating or cooling strips in Zhao & Dong (Reference Zhao and Dong2022). In the table, $\delta _{99}$ and $\delta _1$ denote the nominal and displacement boundary-layer thicknesses, respectively; $\omega _s$, $\omega _c$ and $\omega _p$ denote the synchronisation frequency of the fast and slow modes, the critical frequency distinguishing the first and second modes, and the most unstable frequency, respectively.

Table 1. Parameters characterising the base flow.

The base flow for each case is given by the compressible Blasius similarity solution, which is shown in figure 3. These plots can also be found in Dong & Zhao (Reference Dong and Zhao2021) and Zhao & Dong (Reference Zhao and Dong2022). For the same Mach number, a decrease of the wall temperature leads to a decrease of the boundary-layer thickness, whereas an increase of the Mach number with the same $T_w/T_{ad}$ values leads to an increase of the boundary-layer thickness.

Figure 3. (a) The streamwise velocity and (b) the temperature of the compressible Blasius solution for cases in table 1.

3.2. Instability of the Mack modes on a solid wall

The dispersion relation of the Mack modes for a solid wall can be obtained by solving the O–S equations (2.28) with boundary conditions (2.29) and (2.30). The dependence on the frequency $\omega$ of the growth rate $-\alpha _i$ and the phase speed $c_r=(\omega /\alpha )_r$ of the 2-D Mack modes is plotted in figure 4, where the five cases listed in table 1 are all shown. Two families of discrete modes are observed, which are termed the fast mode (mode F) and the slow mode (mode S), following Fedorov & Khokhlov (Reference Fedorov and Khokhlov2001), respectively. As $\omega \rightarrow 0$, the phase speeds of the fast and slow modes approach those of the fast ($c=1+1/M$) and slow ($c=1-1/M$) acoustic waves, respectively, implying that the two modes synchronise with the freestream acoustic waves in the low-frequency limit. As $\omega$ increases, $c_r$ of mode F decreases, while that of mode S increases. The two phase-speed curves intersect at a synchronisation frequency $\omega _s$, as shown by the blue vertical dashed lines in figures 4(a,c,e,g,i).

Figure 4. Dependence on $\omega$ of (a,c,e,g,i) the phase speeds and (b,df,h,j) the growth rates of modes F and S for $Re = 1560$ and $\beta = 0$, for cases (a,b) M1T1, (c,d) M1T2, (ef) M1T3, (h,h) M1T4, (i,j) M2T1. The vertical solid, dashed and dotted blue lines mark $\omega _c$, $\omega _s$ and $\omega _p$, respectively.

Figures 4(b,df,h,j) show the growth rates of modes F and S. There are overall two unstable frequency bands, which are named as the first and second modes according to the ascending order of the frequency (Mack Reference Mack1987). The second mode is more unstable, and the frequency of the most unstable mode is denoted by $\omega _p$, plotted by the blue vertical dotted lines. The second mode always belongs to the mode S branch. However, the first mode belongs to the mode S branch for cases M1T1, M1T2 and M2T1, while it belongs to the mode F branch for the very cold wall case M1T4. The intersection frequency of the first and second modes $\omega _c$ for the former three cases is defined by the local valley of the mode S curve, as denoted by the vertical solid short lines. For cases M1T3 and M1T4, the first mode is marginally stable, and $\omega _c$ is not defined in this situation.

3.3. Mack instability modes over a compliant coating

3.3.1. Zero-thickness limit of the compliant coating: porous wall

If both the thickness and tension of the compliant coating are negligibly small, namely, $a, b \approx 0$, then (2.19) is reduced to the porous-wall configuration (Fedorov Reference Fedorov2003a; Lysenko et al. Reference Lysenko, Gaponov, Smorodsky, Yermolaev, Kosinov and Semionov2016). Now, the porous admittance ${\mathcal {A}}$ depends only on $H$, $R$, $n$ and $\omega$. The verification of the O–S solver is provided in the Appendix.

Figure 5 shows the dependence of the growth rate $-\alpha _i$ of the 2-D Mack mode on the frequency $\omega$ for case M1T1, where three representative Reynolds numbers ($Re=1560, 3490, 4940$) are considered. Computations are performed for deep holes (i.e. $H\rightarrow \infty$) with $n=0.5$ and $R=0.5$ or $0.05$. Note that the local nominal boundary-layer thickness is about 20, as shown in table 1, so holes with $R=0.5$ can still be regarded as micro holes that do not disturb the mean flow. The dimensionless frequencies of the most unstable first and second modes almost do not change with $Re$, but their growth rates increase with $Re$ monotonically. The effect of the porous wall on the Mack-mode growth rate is mixed: it destabilises the Mack modes when the frequency is lower than a critical value, but stabilises the Mack modes for supercritical frequencies, which agrees with a few previous works (Fedorov Reference Fedorov2003b; Song & Zhao Reference Song and Zhao2022). The impact of the porous wall is greater for a larger $R$. Since the most amplified second mode is suppressed, the application of the porous wall is favourable from the LFC point of view.

Figure 5. Dependence of the growth rate on $\omega$ for case M1T1: (a) for $(H,R,n)=(\infty, 0.5, 0.5)$; (b) for $(H,R,n)=(\infty, 0.05, 0.5)$.

Choosing $n=0.35$ and $\omega =0.118$, figures 6(a) and 6(b) show the contours of the modulus and argument of the admittance $\mathcal {A}$ for case M1T1 in the $R$$H$ plane, respectively. For a small hole radius, both the modulus and argument are almost independent of $H$ as long as $H$ is sufficiently deep, and an increase of $R$ leads to a greater $|\mathcal {A}|$ and a slightly greater $\textrm {arg}\,\mathcal {A}$. The argument of the admittance ranges from $130^\circ$ to $150^\circ$. Note that we must take $R\ll H$, otherwise the mean flow is likely to be distorted by wide holes, and our admittance model would become invalid. As a representative configuration, we choose $(R,H,n)=(0.085,42,0.35)$ for further calculations (unless otherwise specified), which is plotted by white circles in figure 6. For this case, $|\mathcal {A}|=0.39$ and $\textrm {arg}\,\mathcal {A}=135^\circ$.

Figure 6. Contours of (a) the modulus and (b) the argument of the admittance $\mathcal {A}$ in the $R$$H$ plane for case M1T1, where ($Re,n,\omega )=(1560,0.35,0.118)$. The white circle denotes $(H,R)=(42,0.085)$.

3.3.2. Compliant coating

Now the compliant-coating configuration with finite $a$ and $b$ values is considered. The controlling parameters are chosen by the following estimate from practical viewpoints. The density, thickness and tension of the compliant membrane are usually $\rho _m^*\sim 10^3\,\textrm {kg}\,\textrm {m}^{-3}$, $h^*\sim 10^{-6}\,\textrm {m}$ and $\varTheta ^*\sim 10^{-3}\,\textrm {kg}\,\textrm {s}^{-2}$. The radius of the micro holes is $R^*\sim 10^{-5}\,\textrm {m}$. The density of the oncoming gas may vary from $\rho _e^* \sim 0.001$ to $\rho _e^* \sim 1\,\textrm {kg}\,\textrm {m}^{-3}$, depending on the wind tunnel condition or the flight condition. The boundary-layer thickness is $\delta ^*\sim O(10^{-4}{-}10^{-3})\,\textrm {m}$. Based on the flow conditions for case M1T1, as shown in table 1, it can be estimated that $a\sim O(1{-}10^4)$ and $b \sim O(10^{-3}{-}10)$ according to (2.16a,b). It should be noted that one may argue that such a thin membrane may not sustain for a long period in reality. However, we emphasise that as a theoretical work, this paper presents conceptual evidence to show the reliability of the compliant coating on LFC, and this technique may be realistic by performing a careful design in the near future.

The contours of the modulus and argument of the admittance $\mathcal {A}$ in the $a$$b$ plane for case M1T1 and parameters $(H,R,n,Re, \omega )=(42,0.085,0.35,1560,0.118)$ are plotted in figure 7. The application of compliant coating enlarges the range of the argument of $\mathcal {A}$ from $130^\circ{-}150^\circ$ for the porous configuration shown in figure 6, to $90^\circ{-}270^\circ$, which is favourable for LFC designs. Here, $|\mathcal {A}|$ is rather small when $a$ or $b$ is large, approaching the solid-wall configuration. However, as $a$ and $b$ decrease, $|\mathcal {A}|$ reaches a moderate value in a curved triangle region. From figures 7(a,c), it is found that as $C_\rho$ increases, this region becomes narrower, and the peak value of $|\mathcal {A}|$ becomes greater. When $a$ and $b$ satisfy the relation $b/a=\omega ^2$, as plotted by the two white dashed lines in each image, the modulus recovers to the porous coating case, namely, $\mathcal {A}=K$. When the relation $-a\omega +b/\omega =(n/K)_i$ is satisfied, $|\mathcal {A}|$ reaches its maximum, as plotted by the white dotted lines. For this case, $\textrm {arg}\,\mathcal {A}=180^\circ$, and $|\mathcal {A}|$ is equal to $|K|/K_r$ times that of the porous case. In the design of the LFC strategy, if the selected $(a,b)$ is located in this region, then the impact of the compliant coating could be significant, and whether this impact leads to a stabilising or destabilising effect will be discussed below.

Figure 7. Contours of (a,c) the modulus and (b,d) the argument of $\mathcal {A}$ in the $a$$b$ plane for case M1T1, where $(H,R,Re,n,\omega )=(42,0.085,1560,0.35,0.118)$, for (a,b) $C_\rho =1$, (c,d) $C_\rho =100$. The white dashed lines stand for $b/a=\omega ^2$, and the white dotted lines represent $- a \omega + b\omega =(n/K)_i$.

In figures 8(a) and 8(b), the growth rates of the compliant-wall instability for various $C_\rho$ values are presented, which are compared with those for the solid and porous walls. To facilitate a direct comparison of the effect of compliant walls, the growth-rate modification $\sigma =(-\alpha _i)_{compliant (porous)}-(-\alpha _i)_{solid}$ is introduced, and its dependence on $\omega$ is plotted in figures 8(c,d). Overall, both the porous and compliant coatings produce a stabilising effect in the frequency band around the most unstable second mode, but a destabilising effect is observed in other frequency bands. Increase of $C_\rho$ leads to a stronger stabilising or destabilising effect due to the increase of the admittance $|\mathcal {A}|$, and a much greater reduction of the most unstable growth rate than in the porous configuration is observed for a large $C_\rho$. Actually, a large $C_\rho$ is quite realistic, because under high-altitude flight conditions, the background gas density is rather low, as well as the density of the fluid at the wall $\rho _B(0)$. Thus, in the following, $C_\rho$ is taken to be $100$. It needs to be noted that for a large density ratio $C_\rho$, one may challenge the reliability of the admittance model because both the acoustic propagation in the micro holes and the membrane vibration could be affected by the prestress due to the pressure difference of the gases inside and outside the membrane. The explanations are as follows. On the one hand, because the radius of each micro hole is small, the transverse movement of the membrane from the flat state induced by the prestress should be much smaller than the wavelength of the acoustic wave propagating in the micro hole. Thus the formulae of the acoustic propagation, (2.8)–(2.14), are good approximations. On the other hand, for the dynamics of the membrane, things are not that simple. If the curvature of the membrane is not negligible, then the pressure difference $p_p(0)-p_w$ in (2.19) should be projected to the wall-normal direction, and a less-than-unity coefficient $\mathcal {C}$ must appear as a prefactor of this term. Consequently, the admittance formula is still correct, but the definitions of $a$ and $b$ should be changed to $a=\rho _mh/\mathcal {C}$ and $b=\varTheta /{\rm \pi} R^2\mathcal {C}$. From figures 8(c,d), it is found that as $a$ and $b$ increase, the frequency band for the stabilising effect becomes narrower, which is less efficient from the LFC viewpoint.

Figure 8. Dependence of (a,b) the growth rate $-\alpha _i$ and (c,d) the growth-rate modification $\sigma$ on $\omega$ for case M1T1 with different $C_\rho \equiv \rho _h/\rho _B(0)$ values, where $(H,R,Re,n)=(42, 0.085,1560,0.35)$: (a,c) for (a,b) $=(1,0.01)$, (b,d) for (a,b) $=(5,0.065)$.

Figure 9 shows the variation of the growth rate with $\omega$ for different $a$ and $b$ values. For a very thick coating and/or a large surface tension (i.e. $a$ and $b$ are large), the compliant coating behaves like a quasi-solid wall, and the growth rates for these cases are rather close to the solid-wall configuration for all the frequency bands. As $a$ and $b$ decrease, the growth rate of the second mode around the most unstable frequency band is reduced, implying that a thin and soft coating is more effective.

Figure 9. Dependence of (a,b) the growth rate $-\alpha _i$ and (c,d) the growth-rate modification $\sigma$ on $\omega$ for case M1T1 with $(H,R,Re,n,C_\rho )=(42, 0.085, 1560,0.35,100)$, for (a,c) $b=0.01$, (b,d) $a=1$.

Figure 10 shows the contours of the growth-rate modification $\sigma$ in the $|\mathcal {A}|$$\textrm {arg}\,\mathcal {A}$ plane for the most unstable mode, $\omega = \omega _p$. In the argument band $90^\circ <\textrm {arg}\,{\mathcal {A}}<270^\circ$, the most unstable Mack mode is overall suppressed. The stabilising effect increases with the increase of $|\mathcal {A}|$, and reaches its maxima at $\textrm {arg}\,\mathcal {A}\approx 90^\circ$ and $270^\circ$.

Figure 10. Contours of the growth-rate modification $\sigma$ induced by the compliant walls in the $|\mathcal {A}|$$\textrm {arg}\,\mathcal {A}$ plane, for (ae) cases M2T1, M1T1, M1T2, M1T3 and M1T4, respectively, where $Re=1560$ and $\omega =\omega _p$ for each case.

The contours of the growth-rate modification $\sigma$ with $|\mathcal {A}|=0.5$ for three representative cases are plotted in figures 11(a,d,g). The stabilising effect of the compliant coating in the second-mode frequency band is shown clearly (blue region). Two destabilising regions appear in the vicinity of the lower-branch and upper-branch second-mode frequency bands, respectively. Because the growth rates there are small, as shown in figures 11(cf,i), this destabilising effect is not a big issue. When the admittance is increased to $|\mathcal {A}|=4.0$, as shown in figures 11(b,e,h), the $|\sigma |$ value becomes greater, and the stabilising frequency band does not change much. Figures 11(cf,i) depict the relationship between $-\alpha _i$ and $\omega$ for two different $\mathcal {A}$ values. The results for the solid case, $\mathcal {A}=0$, are included for comparison. Here, $\textrm {arg}\,\mathcal {A}$ is selected to be $140^\circ$. The frequency of the most unstable second mode is shifted to a higher value as $|\mathcal {A}|$ increases, but the peak value is remarkably reduced, rendering an effective outcome.

Figure 11. Effect of the compliant coating on the growth rate. (a,d,g) Contours of the growth-rate modification $\sigma$ for $|\mathcal {A}|=0.5$. (b,e,h) Contours of $\sigma$ for $|\mathcal {A}|=4$. (cf,i) Growth rate curves for $|\mathcal {A}|=0$, 0.5 and 4 with $\textrm {arg}\, \mathcal {A}=140^{\circ }$. The first, second and third rows are computed for cases M2T1, M1T1 and M1T4, respectively.

4. Scattering calculations

4.1. HLNS calculations

The instability analyses in § 3 have shown that the compliant effect may destabilise the low-frequency Mack mode, but suppress the second mode in the frequency band close to the most unstable frequency. Usually, for a Mack mode with a fixed dimensional frequency, the dimensionless frequency $\omega$ would increase with $x$, so the suppression frequency band will appear in a downstream region. Now a global dimensionless frequency

(4.1)\begin{equation} F=\frac{\omega ^*\nu _{e}^{*}}{{U_{e}^{*}}^2} =\frac{\omega}{Re}, \end{equation}

is introduced. The global frequency $F$ is fixed as a particular perturbation evolves downstream. Figure 12(a) compares the evolution of the growth rates between the solid and compliant walls for $F=7.56\times 10^{-5}$ and $b=0.01$. The difference of each compliant-wall curve and the solid-wall curve is shown in figure 12(b). Evidently, in the upstream region, the compliant wall plays a destabilising role, while a stabilising effect appears in a certain downstream region where the second-mode growth rate is approximately its maximum. Although in a further downstream region, the compliant coating plays a mild destabilising effect again, the low-growth-rate nature determines that this region is of less interest. Therefore, it is rational to introduce the compliant coating at a downstream location.

Figure 12. Dependence of (a) the growth rate $-\alpha _i$ and (b) the growth-rate modification $\sigma$ on $x$ for case M1T1 with $(H,R,Re,n,C_\rho,b)=(42, 0.085,1560,0.35,100,0.01)$ and $F=7.56\times 10^{-5}$.

Now, we consider that the streamwise evolution of the 2-D Mack modes over the solid–compliant wall is calculated by the HLNS approach, and the three-dimensional (3-D) scattering effect will be probed by the analytical predictions in § 4.2. The 2-D computational domain is selected as $[x_0,x_I]\times [y_0,y_J]=[-720,1820]\times [0,500]$, so 1101 uniform grid points are employed in the streamwise direction, while 301 non-uniform grid points that are clustered in the near-wall region are employed in the wall-normal direction.

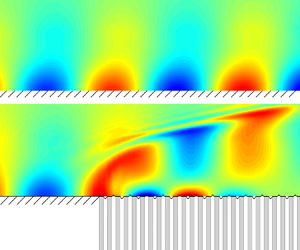
For case M1T1 with $(a,b,C_\rho,Re,n)=(1,0.01,100,1560,0.35)$, the pressure perturbation field $\tilde p(x,y)$ for two representative frequencies is calculated, $\omega =0.094$ and $0.165$, as shown in figure 13. The values of $\mathcal {A}$ for the two frequencies are $3.11\exp ({2.48\textrm {i}})$ and $3.41\exp ({-2.42\textrm {i}})$, respectively. The contours in the lower half-plane show the perturbation field for a solid wall, while those in the upper half-plane are for the solid to the compliant coating with its junction located at $x=0$. Downstream of the junction, the perturbation shows a phase difference in comparison with that of the solid case for each frequency, and the amplitude also changes slightly.

Figure 13. Contours of the modulus of $\tilde {p}_r(x,y)$ over the solid wall (lower half-plane) and solid–compliant wall (upper half-plane) for case M1T1, where $(H,R,a,b,C_\rho,Re,n)=(42,0.085,1,0.01,100,1560,0.35)$, for(a) $\omega =0.094$, (b) $\omega =0.165$.

To quantify the scattering effect, figure 14 plots the streamwise evolution of the wall pressure $|\tilde {p}|_{y=0}$, representing the instability amplitude, for the two frequencies, and the curves for the solid ($|\tilde {p}_s|_{y=0}$) and pure-compliant ($|\tilde {p}_c|_{y=0}$) cases are also shown for comparison. The curves for $|\tilde {p}_c|$ are shifted such that their downstream amplitudes agree with those of the scattering cases $|\tilde {p}|$. In the upstream limit, the amplitude of the scattering case for each frequency agrees with $\tilde {p}_s$. In the vicinity of the junction $x=0$, its amplitude shows a kink, indicating the rapid deformation of the perturbation filed due to the sudden change of the wall boundary condition. In the downstream limit, the amplitude evolution of $\tilde {p}$ approaches that of the compliant coating $\tilde {p}_c$. Obviously, there is a jump from $\tilde {p}_s$ to $\tilde {p}_c$ at the junction, as shown in the inset. Substituting $\tilde {p}_s$ and $\tilde {p}_c$ into (2.51), the transmission coefficient could be calculated by $\mathscr T=\tilde {p}_c/\tilde {p}_s|_{y=0}$. For $\omega =0.094$, $|{\mathscr T}|=0.89<1$, indicating a stabilising effect, whereas for $\omega =0.165$, $|{\mathscr T}|=1.09>1$, indicating a destabilising effect.

Figure 14. Evolution of the wall pressure perturbation for case M1T1, where $(H,R,a,b,C_\rho,Re,n) =(42,0.085,1,0.01,100,1560,0.35)$. The result for a solid wall and a compliant coating are also shown for reference. Plots for (a) $\omega =0.094$, (b) $\omega =0.165$.

A more instructive demonstration of the scattering effect is to plot the dependence of the transmission coefficient on $\omega$ for different parameters, as shown in figure 15. In the low-frequency band (including the first mode and a portion of the second mode), the scattering effect plays a destabilising role; however, it suppresses the second mode in the vicinity of the most unstable frequency band, which again is favourable from the LFC viewpoint. As shown in figures 15(a,b), for a very thick coating or a large surface tension, as mentioned in § 3.3.2, the change of the wall condition is rather weak, leading to a weak scattering effect. As $a$ decreases, the stabilising frequency bands move to the high-frequency direction and the stabilising effect becomes stronger. The effect of $b$ on the scattering effect is not monotonic, and the stabilising effect for $b\leq 0.01$ is more remarkable. When the Mach number decreases, as shown in figure 15(c), the stabilising effect on the frequency band near the most unstable frequency becomes stronger, whereas the destabilising effect in the low-frequency band is suppressed, implying that the stabilising effect of the compliant coatings on a lower $M$ is stronger. Figure 15(d) shows the $|\mathscr {T}|{-}\omega$ curves for $M=5.92$ with different wall temperatures. The stabilising effect in the supercritical frequency band for each case is more profound for a lower $T_w$ value, but the destabilising effect is hardly affected by $T_w$.

Figure 15. Dependence of the transmission coefficient on $\omega$ for different compliant coatings and oncoming conditions, where $(H,R,C_\rho,Re,n)=(42,0.085,100,1560,0.35)$. Plots for (a) different membrane thickness $a$ for case M1T1, where $b=0.01$; (b) different membrane tension $b$ for M1T1, where $a=1$; (c) different Mach numbers with $(a,b)=(1,0.01)$; (d) different temperatures with $(a,b)=(1,0.01)$.

4.2. Analytical predicting for $|{\mathcal {A}}|\ll 1$

When $|{\mathcal {A}}|\ll 1$, the scattering effect can be quantified by the analytical solution (2.41). Figure 16 shows the dependence of the Laurent coefficients $c_{-1}$ and $c_{-2}$ on $\omega$ and $\beta$ for case M1T1. As shown in figures 16(ad), both $c_{-1}$ and $c_{-2}$ peak near the frequency of the lower-branch second mode, and show a moderate value in the second-mode frequency band, indicating a remarkable scattering effect on the second mode. The magnitude of $c_{-2}$ is three orders of magnitude lower than that of $c_{-1}$, indicating a rather weak modification on the growth rates. The 3-D scattering effect is probed in figures 16(ef), in which the impact of the spanwise wavenumber $\beta$ on the scattering effect is shown. Here, $|c_{-1}|$ increases slightly with $\beta$ when the latter is smaller than $0.1$, but $c_{-2}$ stays almost constant. For $\beta >0.1$, both $|c_{-1}|$ and $|c_{-2}|$ decay drastically with increase of $\beta$. The implication is that the 3-D effect is not distinguished, and the study based on the 2-D mode is sufficient.

Figure 16. The coefficients (a,c,e) $c_{-1}$ and (b,df) $c_{-2}$ of the Laurent expansion (2.38) for case M1T1, where $(H,R,C_\rho,Re,n)=(42,0.085,100,1560,0.35)$. Plots for (a,b) $(a,b,\beta )=(1,2,0)$, (c,d) $(a,b,\beta ) =(100,0.01,0)$, (ef) $(a,b,\omega )=(1,2,0.118)$.

According to (2.32), the perturbation pressure $\tilde p$ for a small admittance can be expanded as a sum of the oncoming pressure $\tilde {p}_0$ and the junction-induced scattering perturbation $\bar \epsilon \tilde {p}_1$. The solid lines in figures 17(a) and 17(b) show the streamwise evolution of the junction-induced perturbation pressure $|\tilde {p}_1|$ obtained by the HLNS calculations for two representative membranes, respectively, which are compared with the analytical predictions plotted by the symbols. For figure 17(a), $(a,b)=(1,2)$ is selected, and for the three selected frequencies $\omega =0.077$, $0.112$ and $0.151$, $\mathcal {A}=0.013\exp ({1.574\textrm {i}})$, $0.02\exp ({1.576\textrm {i}})$ and $0.027\exp ({1.577\textrm {i}})$, respectively. The arguments of $\mathcal {A}$ for these frequencies are all approximately $90^\circ$. For figure 17(b), $(a,b)=(100,0.01)$ is selected, and the values of the admittance are $\mathcal {A}=0.047\exp ({-1.58\textrm {i}})$, $0.032\exp ({-1.578\textrm {i}})$ and $0.023\exp ({-1.576\textrm {i}})$ for the three frequencies. The arguments of $\mathcal {A}$ for these frequencies are all approximately $-90^\circ$ (or $270^\circ$). The base flow is assumed to be parallel for ease of comparison, and the effect of non-parallelism will be considered later. The amplitude obtained by HLNS for each curve shows a jump at the junction, and grows linearly with $x$ in the downstream, which agrees well with the analytical prediction given by (2.41), indicating that both the scattering effect and the growth-rate modification are well predicted.

Figure 17. Streamwise evolution of the perturbation amplitude for a parallel base flow for case M1T1, where $(H,R,C_\rho,Re,n)=(42,0.085,100,1560,0.35)$, for (a) $(a,b)=(1,2)$, (b) $(a,b)=(100,0.01)$.

The dependence of the transmission coefficient on $\omega$ is summarised in figures 18(a) and 18(b) for the two membranes, respectively. The analytical predictions (red solid lines) agree perfectly with the HLNS calculations with the non-parallelism neglected (green dashed lines). For $\omega <0.1$, the transmission coefficient curve in figure 18(a) indicates a destabilising effect, whereas that for $\omega >0.1$ indicates a stabilising effect. The opposite is true for figure 18(b). This is caused by the difference of the $\textrm {arg}\,{\mathcal {A}}$ values for the two panels, which is approximately $90^\circ$ for figure 18(a) and approximately $-90^\circ$ (or $270^\circ$) for figure 18(b). This confirms the significant role of $\textrm {arg}\,\mathcal {A}$ in the scattering effect.

Figure 18. Dependence of transmission coefficient $\mathscr {T}$ on frequency $\omega$ for case M1T1, where $(H,R,C_\rho,Re,n)=(42,0.085,100,1560,0.35)$, for (a) $(a,b)=(1,2)$, (b) $(a,b)=(100,0.01)$.

When the non-parallelism is considered, as shown by the blue squares, the overall trend of the $\mathscr T$ distribution does not change, although the values of $\mathscr T$ may vary by a certain amount. This indicates that the analytical predictions are effective even for a non-parallelism base flow as long as $|\mathcal {A}|$ is small.

4.3. Scattering calculations for $O(1)$-admittance configurations

The analytical theory ceases to be valid when $|\mathcal {A}|$ is $O(1)$, and for this case only the HLNS calculations are applicable. To evaluate the influence of nonlinearity, it is necessary to introduce a ratio coefficient

(4.2)\begin{equation} \mathscr{R}=\frac{|\mathscr{T}|-1}{\left|\mathcal{A}\right|}. \end{equation}

Here, $\mathscr {R}$ is positive (negative) when the scattering effect is destabilising (stabilising). Obviously, $\mathscr R$ is a constant when $|\mathcal {A}|$ is small, but the nonlinearity for $|\mathcal {A}| =O(1)$ leads to a remarkable variation of $\mathscr R$ on $\mathcal |A|$. Figure 19 shows the dependence of $\mathscr {R}$ on $|\mathcal {A}|$ for two representative frequencies. The HLNS calculations of $\mathscr R$ for a parallel base flow agree well with the analytical predictions when $|\mathcal {A}|<0.1$, but deviate from the linear predictions for greater $|\mathcal {A}|$ values. Overall, $|\mathscr {R}|$ is reduced as $|\mathcal {A}|$ increases, indicating that the nonlinearity weakens the scattering effect. The non-parallelism of the base flow induces a quantitative modification on $\mathscr {R}$ and $\mathscr {T}$, but it does not affect the overall trend.

Figure 19. Dependence of the ratio coefficient $\mathscr {R}$ on the amplitude of the admittance $|\mathcal {A}|$ for case M1T1, with $Re=1560$, for (a) $\omega =0.094$, (b) $\omega =0.165$.

Figure 20 summarises the contours of the transmission coefficient $|\mathscr {T}|$ in the $\omega{-}\textrm {arg}\,{\mathcal {A}}$ plane for $|\mathcal {A}|=1$ for all the cases considered. It is observed that when the admittance argument is in the interval $150^\circ <\textrm {arg}\,\mathcal {A}<210^\circ$, most of the second modes are suppressed by the scattering effect, and this argument band is realistic, as indicated by figure 7. Decrease of the Mach number and wall temperature or increases of $Re$ lead to a stronger scattering effect.

Figure 20. Contour plots of the transmission coefficient $|\mathscr {T}|$ in the $\textrm {arg}\,\mathcal {A}$$\omega$ plane for $|\mathcal {A}|=1$. Plots for (ae) cases M1T1, M1T2, M1T3, M1T4 and M2T1, respectively, with $Re=1560$; ( f) case M1T1 with $Re=4940$.

5. Conclusion

This paper studies the linear evolution of Mack modes in hypersonic boundary layers over a flat plate with a partially coated compliant section. The compliant-coating section is a flexible thin membrane covering on a porous wall consisting of numerous micro holes. Based on five representative case studies with different Mach numbers and wall temperatures, two mechanisms are considered: (1) the successive modification of the Mack mode by the compliant-wall effect; and (2) the scattering effect at the solid–compliant junction.

Because the radii of the micro holes are much smaller than the boundary-layer thickness, the compliant section has little impact on the base flow, so the compressible Blasius solution is selected as the base flow for both the solid and compliant walls. The impact of the compliant-wall effect on the perturbation is quantified by an admittance boundary condition based on the analysis of the motion of the membrane and the propagation of the acoustic wave in the micro holes underneath.

By solving the compressible O–S equations based on the admittance condition, the modification of the Mack growth rate by the compliant coating is obtained for the five case studies. The instability is dependent on the base flow, the perturbation frequency, and the property of the micro holes and the membrane. For most cases, the majority of the second mode is suppressed, especially in the frequency band close to the most unstable mode, while the first mode and a small portion of the second mode with small growth rates are enhanced. The impact of the compliant coating on the instability increases as the thickness and the tension of the membrane reduce. Compared with the porous wall without the membrane, it is found that the compliant coating can produce a greater admittance with a wider argument range, which leads to a stronger stabilising effect on the second mode with a frequency close to the most unstable state. This is indeed favourable from the LFC viewpoint.

Due to the sudden change of the perturbation boundary conditions at the solid–compliant junction, the oncoming Mack modes undergo a rapid distortion induced by the scattering effect. Following Wu & Dong (Reference Wu and Dong2016b) and Dong & Zhao (Reference Dong and Zhao2021), a transmission coefficient is introduced to quantify the scattering effect, which is defined by the ratio of the equivalent amplitudes of the downstream Mack mode to that upstream. The majority of the Mack modes can be suppressed when the argument of the admittance is in the interval $[150^\circ, 210^\circ ]$. The stabilising effect of the solid–compliant junction in the second-mode frequency band increases with decrease of the membrane thickness. For a given thickness, the membrane tension does not affect the stabilising effect much unless the tension is very large. For cases with a very large tension, the scattering effect could be rather weak. If the admittance of the compliant coating is small, then the transmission coefficient can be predicted by the analytical solution based on the residue theorem. However, for an $O(1)$ admittance, only the HLNS approach is applicable, and the nonlinearity is found to weaken the scattering effect, including both the stabilising and destabilising effects in different frequency bands. As the Mach number or wall temperature decreases, or as the Reynolds number increases, the scattering effect becomes stronger.

It needs to be noted that in the physical situation, the environmental perturbations are usually broadband, so are the boundary-layer instability modes excited due to certain receptivity regimes. For convenience, the present study focuses only on the spatial evolution of each Fourier component. This is a good approximation if the perturbation amplitudes are sufficiently small, such that the interactions between different Fourier components and their self-interactions are negligible. However, to prescribe whether transition is delayed or promoted by the compliant coating requires consideration of the combined behaviours of all the Fourier components with the nonlinearity included, which could be a future work.

Funding

This research was supported by the National Science Foundation of China (grant nos U20B2003, 11988102, 12002235 and 91952202).

Declaration of interests

The authors report no conflict of interest.

Appendix. Code verification

To verify our O–S solver, the cases in Lysenko et al. (Reference Lysenko, Gaponov, Smorodsky, Yermolaev, Kosinov and Semionov2016) are revisited. Figure 21 shows the comparison of the present results and the reference data, and good agreement is achieved for all cases.

Figure 21. Dependence of the growth rate $-\alpha _i/Re$ on $\hat {F}=\omega /Re$ for (a) a solid wall and (b) a porous wall, where $(M,T_w,T_e)=(2,1.67,180)$, with $(H,R,n)=(\infty,0.5,0.5)$.

References

Brès, G.A., Inkman, M., Colonius, T. & Fedorov, A.V. 2009 Alternate designs of ultrasonic absorptive coatings for hypersonic boundary layer control. AIAA Paper 2009-4217.CrossRefGoogle Scholar
Brès, G.A., Inkman, M., Colonius, T. & Fedorov, A.V. 2013 Second-mode attenuation and cancellation by porous coatings in a high-speed boundary layer. J. Fluid Mech. 726, 312337.CrossRefGoogle Scholar
Carpenter, P.W. & Morris, P.J. 1990 The effect of anisotropic wall compliance on boundary-layer stability and transition. J. Fluid Mech. 218, 171223.CrossRefGoogle Scholar
Chen, Y. & Scalo, C. 2021 Trapped waves in supersonic and hypersonic turbulent channel flow over porous walls. J. Fluid Mech. 920, A24.CrossRefGoogle Scholar
Chokani, N., Bountin, D.A., Shiplyuk, A.N. & Maslov, A.A. 2005 Nonlinear aspects of hypersonic boundary-layer stability on a porous surface. AIAA J. 43, 149155.CrossRefGoogle Scholar
Chuvakhov, P. & Fedorov, A.V. 2016 Spontaneous radiation of sound by instability of a highly cooled hypersonic boundary layer. J. Fluid Mech. 805, 188206.CrossRefGoogle Scholar
Cowley, S. & Hall, P. 1990 On the instability of hypersonic flow past a wedge. J. Fluid Mech. 214, 1742.CrossRefGoogle Scholar
Dong, M. & Li, C. 2021 Effect of two-dimensional short rectangular indentations on hypersonic boundary-layer transition. AIAA J. 59, 23682381.CrossRefGoogle Scholar
Dong, M., Liu, Y. & Wu, X. 2020 Receptivity of inviscid modes in supersonic boundary layers due to scattering of free-stream sound by localised wall roughness. J. Fluid Mech. 896, A23.CrossRefGoogle Scholar
Dong, M. & Zhao, L. 2021 An asymptotic theory of the roughness impact on inviscid Mack modes in supersonic/hypersonic boundary layers. J. Fluid Mech. 913, A22.CrossRefGoogle Scholar
Egorov, I.V., Fedorov, A.V. & Soudakov, V.G. 2008 Receptivity of a hypersonic boundary layer over a flat plate with a porous coating. J. Fluid Mech. 601, 165187.CrossRefGoogle Scholar
Fahy, F.J. 2001 Foundations of Engineering Acoustics. Elsevier.Google Scholar
Fedorov, A.V. 2003 a Receptivity of a high-speed boundary layer to acoustic disturbances. J. Fluid Mech. 491, 101129.CrossRefGoogle Scholar
Fedorov, A.V. 2003 b Receptivity of hypersonic boundary layer to acoustic disturbances scattered by surface roughness. AIAA Paper 2003-3731.CrossRefGoogle Scholar
Fedorov, A.V. & Khokhlov, A.P. 1991 Excitation of unstable modes in a supersonic boundary layer by acoustic waves. Fluid Dyn. 9, 456467.Google Scholar
Fedorov, A.V. & Khokhlov, A.P. 2001 Prehistory of instability in a hypersonic boundary layer. Theor. Comput. Fluid Dyn. 14, 359375.CrossRefGoogle Scholar
Fedorov, A.V., Shiplyuk, A.N., Maslov, A.A., Burov, E.A. & Malmuth, N.D. 2003 Stabilization of a hypersonic boundary layer using an ultrasonically absorptive coating. J. Fluid Mech. 479, 99124.CrossRefGoogle Scholar
Fong, K., Wang, X., Huang, Y., Zhong, X., McKiernan, G., Fisher, R. & Schneider, S. 2015 Second mode suppression in hypersonic boundary layer by roughness: design and experiments. AIAA J. 53, 31383144.CrossRefGoogle Scholar
Fong, K., Wang, X. & Zhong, X. 2014 Numerical simulation of roughness effect on the stability of a hypersonic boundary layer. Comput. Fluids 96, 350367.CrossRefGoogle Scholar
Fujii, K. 2006 Experiment of the two-dimensional roughness effect on hypersonic boundary-layer transition. J. Spacecr. Rockets 43, 731738.CrossRefGoogle Scholar
Gaponov, S.A. 2014 Linear instability of the supersonic boundary layer on a compliant surface. J. Appl. Math. Phys. 2, 253263.CrossRefGoogle Scholar
Kachanov, Y.S. 1994 Physical mechanisms of laminar-boundary-layer transition. Annu. Rev. Fluid Mech. 26, 411482.CrossRefGoogle Scholar
Li, S. & Dong, M. 2021 Verification of local scattering theory as is applied to transition prediction in hypersonic boundary layers. Adv. Mech. 51 (2), 364375.Google Scholar
Liu, Y., Dong, M. & Wu, X. 2020 Generation of first Mack modes in supersonic boundary layers by slow acoustic waves interacting with streamwise isolated wall roughness. J. Fluid Mech. 888, A10.CrossRefGoogle Scholar
Lysenko, V.I., Gaponov, S.A., Smorodsky, B.V., Yermolaev, Y.G., Kosinov, A.D. & Semionov, N.V. 2016 Combined influence of coating permeability and roughness on supersonic boundary layer stability and transition. J. Fluid Mech. 798, 751773.CrossRefGoogle Scholar
Mack, L. 1984 Boundary layer linear stability theory. AGARD Rep. 3–1–3–81.Google Scholar
Mack, L. 1987 Review of linear compressible stability theory. In Stability of Time Dependent and Spatially Varying Flows (ed. D.L. Dwoyer & M.Y. Hussaini), pp. 164–187. Springer.CrossRefGoogle Scholar
Malik, M. 1989 Prediction and control of transition in supersonic and hypersonic boundary layers. AIAA J. 27, 14871493.CrossRefGoogle Scholar
Malik, M. 1990 Numerical methods for hypersonic boundary layer stability. J. Comput. Phys. 86, 376413.CrossRefGoogle Scholar
Masad, J.A. & Nayfeh, A.H. 1992 Laminar flow control of subsonic boundary layers by suction and heat-transfer strips. Phys. Fluids A 4, 12591272.CrossRefGoogle Scholar
Morkovin, M.V. 1969 Critical evaluation of transition from laminar to turbulent shear layers with emphasis on hypersonically traveling bodies. Tech. Rep. AFFDL-TR, 68-149. US Air Force Flight Dynamics Laboratory, Wright Patterson Air Force Base.Google Scholar
Rasheed, A., Hornung, H.G., Fedorov, A.V. & Malmuth, N.D. 2002 Experiments on passive hypervelocity boundary-layer control using an ultrasonically absorptive surface. AIAA J. 40, 481489.CrossRefGoogle Scholar
Scalo, C., Bodart, J. & Lele, S.K. 2015 Compressible turbulent channel flow with impedance boundary conditions. Phys. Fluids 27 (3), 035107.CrossRefGoogle Scholar
Smith, F.T. 1986 Steady and unsteady boundary-layer separation. Annu. Rev. Fluid Mech. 18, 197220.CrossRefGoogle Scholar
Smith, F.T. & Brown, S.N. 1990 The inviscid instability of a Blasius boundary layer at large values of the Mach number. J. Fluid Mech. 219, 499518.CrossRefGoogle Scholar
Song, Q. & Zhao, L. 2022 Scattering of Mack modes by solid–porous junctions in hypersonic boundary layers. Phys. Fluids 34, 084104.CrossRefGoogle Scholar
Tam, C.K.W. & Auriault, L. 1996 Time-domain impedance boundary conditions for computational aeroacoustics. AIAA J. 34 (5), 917923.CrossRefGoogle Scholar
Tijdeman, H. 1975 On the propagation of sound waves in cylindrical tubes. J. Sound Vib. 39, 133.CrossRefGoogle Scholar
Wu, X. & Dong, M. 2016 a Entrainment of short-wavelength free-stream vortical disturbances in compressible and incompressible boundary layers. J. Fluid Mech. 797, 683728.CrossRefGoogle Scholar
Wu, X. & Dong, M. 2016 b A local scattering theory for the effects of isolated roughness on boundary-layer instability and transition: transmission coefficient as an eigenvalue. J. Fluid Mech. 794, 68108.CrossRefGoogle Scholar
Zhao, L. & Dong, M. 2022 Effect of surface temperature strips on the evolution of supersonic and hypersonic Mack modes: asymptotic theory and numerical results. Phys. Rev. Fluids 7, 053901.CrossRefGoogle Scholar
Zhao, L., Dong, M. & Yang, Y. 2019 Harmonic linearized Navier–Stokes equation on describing the effect of surface roughness on hypersonic boundary-layer transition. Phys. Fluids 31, 034108.CrossRefGoogle Scholar
Zhao, L., He, J. & Dong, M. 2023 Asymptotic theory of Mack-mode receptivity in hypersonic boundary layers due to interaction of a heating/cooling source and a freestream sound wave. J. Fluid Mech. 963, A34.CrossRefGoogle Scholar
Figure 0

Figure 1. Schematic of the physical model: (a) side view; (b) top view; (c) zoom-in plot of a micro hole.

Figure 1

Figure 2. Schematic of the movement of the membrane (not to scale).

Figure 2

Table 1. Parameters characterising the base flow.

Figure 3

Figure 3. (a) The streamwise velocity and (b) the temperature of the compressible Blasius solution for cases in table 1.

Figure 4

Figure 4. Dependence on $\omega$ of (a,c,e,g,i) the phase speeds and (b,df,h,j) the growth rates of modes F and S for $Re = 1560$ and $\beta = 0$, for cases (a,b) M1T1, (c,d) M1T2, (ef) M1T3, (h,h) M1T4, (i,j) M2T1. The vertical solid, dashed and dotted blue lines mark $\omega _c$, $\omega _s$ and $\omega _p$, respectively.

Figure 5

Figure 5. Dependence of the growth rate on $\omega$ for case M1T1: (a) for $(H,R,n)=(\infty, 0.5, 0.5)$; (b) for $(H,R,n)=(\infty, 0.05, 0.5)$.

Figure 6

Figure 6. Contours of (a) the modulus and (b) the argument of the admittance $\mathcal {A}$ in the $R$$H$ plane for case M1T1, where ($Re,n,\omega )=(1560,0.35,0.118)$. The white circle denotes $(H,R)=(42,0.085)$.

Figure 7

Figure 7. Contours of (a,c) the modulus and (b,d) the argument of $\mathcal {A}$ in the $a$$b$ plane for case M1T1, where $(H,R,Re,n,\omega )=(42,0.085,1560,0.35,0.118)$, for (a,b) $C_\rho =1$, (c,d) $C_\rho =100$. The white dashed lines stand for $b/a=\omega ^2$, and the white dotted lines represent $- a \omega + b\omega =(n/K)_i$.

Figure 8

Figure 8. Dependence of (a,b) the growth rate $-\alpha _i$ and (c,d) the growth-rate modification $\sigma$ on $\omega$ for case M1T1 with different $C_\rho \equiv \rho _h/\rho _B(0)$ values, where $(H,R,Re,n)=(42, 0.085,1560,0.35)$: (a,c) for (a,b) $=(1,0.01)$, (b,d) for (a,b) $=(5,0.065)$.

Figure 9

Figure 9. Dependence of (a,b) the growth rate $-\alpha _i$ and (c,d) the growth-rate modification $\sigma$ on $\omega$ for case M1T1 with $(H,R,Re,n,C_\rho )=(42, 0.085, 1560,0.35,100)$, for (a,c) $b=0.01$, (b,d) $a=1$.

Figure 10

Figure 10. Contours of the growth-rate modification $\sigma$ induced by the compliant walls in the $|\mathcal {A}|$$\textrm {arg}\,\mathcal {A}$ plane, for (ae) cases M2T1, M1T1, M1T2, M1T3 and M1T4, respectively, where $Re=1560$ and $\omega =\omega _p$ for each case.

Figure 11

Figure 11. Effect of the compliant coating on the growth rate. (a,d,g) Contours of the growth-rate modification $\sigma$ for $|\mathcal {A}|=0.5$. (b,e,h) Contours of $\sigma$ for $|\mathcal {A}|=4$. (cf,i) Growth rate curves for $|\mathcal {A}|=0$, 0.5 and 4 with $\textrm {arg}\, \mathcal {A}=140^{\circ }$. The first, second and third rows are computed for cases M2T1, M1T1 and M1T4, respectively.

Figure 12

Figure 12. Dependence of (a) the growth rate $-\alpha _i$ and (b) the growth-rate modification $\sigma$ on $x$ for case M1T1 with $(H,R,Re,n,C_\rho,b)=(42, 0.085,1560,0.35,100,0.01)$ and $F=7.56\times 10^{-5}$.

Figure 13

Figure 13. Contours of the modulus of $\tilde {p}_r(x,y)$ over the solid wall (lower half-plane) and solid–compliant wall (upper half-plane) for case M1T1, where $(H,R,a,b,C_\rho,Re,n)=(42,0.085,1,0.01,100,1560,0.35)$, for(a) $\omega =0.094$, (b) $\omega =0.165$.

Figure 14

Figure 14. Evolution of the wall pressure perturbation for case M1T1, where $(H,R,a,b,C_\rho,Re,n) =(42,0.085,1,0.01,100,1560,0.35)$. The result for a solid wall and a compliant coating are also shown for reference. Plots for (a) $\omega =0.094$, (b) $\omega =0.165$.

Figure 15

Figure 15. Dependence of the transmission coefficient on $\omega$ for different compliant coatings and oncoming conditions, where $(H,R,C_\rho,Re,n)=(42,0.085,100,1560,0.35)$. Plots for (a) different membrane thickness $a$ for case M1T1, where $b=0.01$; (b) different membrane tension $b$ for M1T1, where $a=1$; (c) different Mach numbers with $(a,b)=(1,0.01)$; (d) different temperatures with $(a,b)=(1,0.01)$.

Figure 16

Figure 16. The coefficients (a,c,e) $c_{-1}$ and (b,df) $c_{-2}$ of the Laurent expansion (2.38) for case M1T1, where $(H,R,C_\rho,Re,n)=(42,0.085,100,1560,0.35)$. Plots for (a,b) $(a,b,\beta )=(1,2,0)$, (c,d) $(a,b,\beta ) =(100,0.01,0)$, (ef) $(a,b,\omega )=(1,2,0.118)$.

Figure 17

Figure 17. Streamwise evolution of the perturbation amplitude for a parallel base flow for case M1T1, where $(H,R,C_\rho,Re,n)=(42,0.085,100,1560,0.35)$, for (a) $(a,b)=(1,2)$, (b) $(a,b)=(100,0.01)$.

Figure 18

Figure 18. Dependence of transmission coefficient $\mathscr {T}$ on frequency $\omega$ for case M1T1, where $(H,R,C_\rho,Re,n)=(42,0.085,100,1560,0.35)$, for (a) $(a,b)=(1,2)$, (b) $(a,b)=(100,0.01)$.

Figure 19

Figure 19. Dependence of the ratio coefficient $\mathscr {R}$ on the amplitude of the admittance $|\mathcal {A}|$ for case M1T1, with $Re=1560$, for (a) $\omega =0.094$, (b) $\omega =0.165$.

Figure 20

Figure 20. Contour plots of the transmission coefficient $|\mathscr {T}|$ in the $\textrm {arg}\,\mathcal {A}$$\omega$ plane for $|\mathcal {A}|=1$. Plots for (ae) cases M1T1, M1T2, M1T3, M1T4 and M2T1, respectively, with $Re=1560$; ( f) case M1T1 with $Re=4940$.

Figure 21

Figure 21. Dependence of the growth rate $-\alpha _i/Re$ on $\hat {F}=\omega /Re$ for (a) a solid wall and (b) a porous wall, where $(M,T_w,T_e)=(2,1.67,180)$, with $(H,R,n)=(\infty,0.5,0.5)$.