


1. Introduction
Immiscible two-phase displacement in permeable media has drawn extensive research attention across various fields of science and engineering, such as microfluidic logic control (Cybulski, Garstecki & Grzybowski Reference Cybulski, Garstecki and Grzybowski2019), solvents separation in chromatography columns (Shalliker et al. Reference Shalliker, Catchpoole, Dennis and Guiochon2007), formation of liquid-infused materials (Yeganeh et al. Reference Yeganeh2022), film wetting in nanofabrication (Anand et al. Reference Anand, Ghosh, Aabdin, Koneti, Xu, Holsteyns and Mirsaidov2021), geological carbon sequestration (Szulczewski et al. Reference Szulczewski, Macminn, Herzog and Juanes2012) and hydrocarbon recovery (Blunt Reference Blunt2017). However, complex interfacial behaviour and multiscale variability between fluids and porous structures pose great challenges to understanding and controlling multiphase flow dynamics and fluid entrapment. For instance, in geological carbon sequestration, viscous instability during CO2 rising through brine-filled pore spaces and capillary instability during water film spreading in complex porous structures can significantly increase trapping efficiency by increasing the interfacial area (Huppert & Neufeld Reference Huppert and Neufeld2014). Unlike the drainage process where the fluid entrapment patterns in porous media with fractal fluid–fluid fronts are often observed, the imbibition pattern is typically expected to be stable and compact due to the favoured pore-scale cooperative pore-filling mechanism (Stokes et al. Reference Stokes, Weitz, Gollub, Dougherty, Robbins, Chaikin and Lindsay1986; Cieplak & Robbins Reference Cieplak and Robbins1988, Reference Cieplak and Robbins1990; Holtzman & Segre Reference Holtzman and Segre2015; Jung et al. Reference Jung, Brinkmann, Seemann, Hiller, Sanchez de la Lama and Herminghaus2016; Singh et al. Reference Singh, Jung, Brinkmann and Seemann2019). However, the recent discoveries of incomplete imbibition processes in various structures make the above pore-scale imbibition results more subtle (Odier et al. Reference Odier, Levaché, Santanach-Carreras and Bartolo2017; Lei et al. Reference Lei, Lu, Liu and Wang2022a; Wang et al. Reference Wang, Pereira, Sauret and Gan2022). Clearly, there is a need for a thorough examination of imbibition mechanisms in diverse porous structures.
During the forced imbibition process, the macroscopic displacement patterns are governed by the competition between the capillary force and the viscous force, which is further complicated by flow rate, wettability and complex geometry (Rabbani et al. Reference Rabbani, Or, Liu, Lai, Lu, Datta, Stone and Shokri2018; Hu et al. Reference Hu, Lan, Wei and Chen2019; Mehmani et al. Reference Mehmani, Kelly, Torres-Verdín and Balhoff2019; Primkulov et al. Reference Primkulov, Pahlavan, Fu, Zhao, Macminn and Juanes2019, Reference Primkulov, Pahlavan, Fu, Zhao, Macminn and Juanes2021; Singh et al. Reference Singh, Jung, Brinkmann and Seemann2019; Lei et al. Reference Lei, Lu, Liu and Wang2022a; Wang et al. Reference Wang, Pereira, Sauret and Gan2022; Lei, Gong & Wang Reference Lei, Gong and Wang2023a). Flow regimes in complete or incomplete displacements are controlled not only by the capillary number (the ratio of viscous to capillary force) (Stokes et al. Reference Stokes, Weitz, Gollub, Dougherty, Robbins, Chaikin and Lindsay1986; Cieplak & Robbins Reference Cieplak and Robbins1988, Reference Cieplak and Robbins1990; Zhao, Macminn & Juanes Reference Zhao, Macminn and Juanes2016; Primkulov et al. Reference Primkulov, Pahlavan, Fu, Zhao, Macminn and Juanes2021), but also by the local capillary pressure variation (Craster & Matar Reference Craster and Matar2009; Hu et al. Reference Hu, Wan, Kim and Tokunaga2017; Gu, Liu & Wu Reference Gu, Liu and Wu2021; Wang, Mehmani & Xu Reference Wang, Mehmani and Xu2021). The capillary pressure $\; {P_c} = 2\gamma \,\textrm{cos}\,\theta /{R_h}$ is determined by interfacial tension (IFT)
  $\gamma $, contact angle
  $\theta $ and hydraulic radius of pores
  ${R_h}$. While most focus has been placed on the effects of fluid properties or injection conditions, the influence of 3-D geometrical features of porous structures on multiphase flow received less attention. To control and optimize fluid entrapment in applications, it is of crucial importance to understand the interplay between capillary number, contact angle and hydraulic diameter on forced imbibition in porous media with diverse geometric confinements.
Various natural and industrial porous media present different geometric constraints, as appear in the geological formation, vascular networks and membranes. By affecting pore-scale interfacial behaviour, such as the competition between the main meniscus and water film interface, geometric confinements of porous media lead to different fluid entrapments in complex porous structures (Lei et al. Reference Lei, Lu, Gong and Wang2023c). Compared with the difficulty of visualization and quantification of multiphase flow in real-world 3-D porous media (Berg et al. Reference Berg2013), microfluidic chips with complex porous geometry provide a convenient and flexible tool to visualize and quantify both microscopic flow dynamics and macroscopic fluid configuration (Sinton Reference Sinton2014). These microfluidic chips as ‘2-D models’ can realize size variation in horizontal dimensions but constant depth in the vertical dimension (Lei, Lu & Wang Reference Lei, Lu and Wang2023b). However, there exist strong geometric confinements in these 2-D microfluidic chips with complex porous geometry that  ${\lim _{W/H \gg 1}}{R_h} = {\lim _{W/H \gg 1}}(W/(W + H))H \approx H$, where W and H are the pore width and depth, respectively. Consequently, the hydraulic radius of designed larger pores will be confined by depth into the diameter range of 0∼H. This depth confinement will always result in a homogeneous porous media with a narrow 3-D pore size distribution whatever the heterogeneous design of the 2-D porous structure. The capillary pressure-saturation functions of porous media can be influenced by the pore size distribution directly (Rücker et al. Reference Rücker2020). Considering hydraulic-radius-dependent capillary pressure, the results based on 2-D microfluidic porous media may be not sufficient for fully understanding the microscopic capillary physics and macroscopic flow patterns during imbibition in 3-D porous media.
A few attempts have been made to add 3-D geometric features into microfluidic chips, such as 3-D printing (Ju, Gong & Zheng Reference Ju, Gong and Zheng2022) and glass-based isotropic hydrofluoric acid (HF) etching (Xu et al. Reference Xu, Liang, Zhu, Qi, Lu, Huh and Balhoff2017). Unfortunately, as yet, there has been no complete and rigorous fabrication technique reported for a microfluidic chip to mitigate this depth-confined capillarity limitation. The space resolution (tens of microns) and limited printing material (fusible and transparent) of current 3-D printing technology make it impossible to build a 3-D microfluidic chip with complex porous geometry (Yazdi et al. Reference Yazdi, Popma, Wong, Nguyen, Pan and Xu2016). Glass-based isotropic HF etching can achieve a shallower throat if two designed neighbouring pores are close enough (Xu et al. Reference Xu, Liang, Zhu, Qi, Lu, Huh and Balhoff2017), while this special design is limited by the channel aspect ratio in wet-etched glass. Moreover, it is difficult to fabricate microfluidic chips with complex porous geometry on the glass due to the dense, complex and small patterns (Lei et al. Reference Lei, Lu and Wang2023b).
In this paper, we combine advanced microfluidic experiments, numerical simulations and theoretical analysis to elucidate the complex interplay between capillary number, wettability and geometric confinement on multiphase flow dynamics and fluid entrapment. We first present a novel method for designing and fabricating multidepth microfluidic chips (§ 2.1) and the corresponding microfluidic platform (§ 2.2). Then, we introduce the fundamentals of direct numerical simulations with OpenFOAM (§ 2.3) and an improved dynamic pore-network model (§ 2.4). By combining microfluidic experiments and direct numerical simulations (§§ 3.1 and 3.2), we determine the underlying flow mechanism and purify the complex displacement modes as the basic pore-scale events. Theoretical models of these pore-scale events, such as snap-off and bypass, were proposed and numerically verified (§ 3.3). Finally, by inputting these pore-scale events into the improved pore-network model, these microscopic pore-scale events were linked directly to the macroscopic displacement patterns (§ 3.4). Our findings highlight the interplay of depth confinement, capillary number and contact angle on both microscopic flow dynamics and macroscopic forced imbibition patterns. These insights not only bridge the understanding of fluid entrapment in various 2-D and 3-D porous media but also open the door for the potential of 3-D microfluidic design for striking macroscopic imbibition patterns.
2. Materials and methods
2.1. Design and fabrication of multidepth microfluidic chips
In this study, the sequential photolithography and multietching processes are combined for fabricating silicon-based multidepth microfluidic chips. Among these processing steps, mask design is the crucial step. Figure 1 shows the whole process from the 2-D image generation to the area segmentation for labelling depth information. Here, a high-resolution 2-D porous structure, aiming for a target pore size distribution resembling natural 3-D porous media, is generated using a random generation algorithm known as the quartet structure generation set (Wang et al. Reference Wang, Wang, Pan and Chen2007; Lei et al. Reference Lei, Liu, Xie, Yang, Wu and Wang2020). To simplify the microfabrication processes, the target depth of each etched pattern is configured to the same value. Here, this value can be chosen as the characteristic diameter of the desired pore size distribution (40 μm). Therefore, the depth value of pores in the microfluidic chips can be 40, 80 or 120 μm.

Figure 1. Labelling different depth regions according to the width distribution of the 2-D geometry, which is regenerated based on the statistic information of natural porous media. (a) The 2-D diameter distribution calculated by the maximal ball algorithm. (b) The basic rule of dividing the depth regions according to the width range of the 2-D geometry. (c) Corresponding designed depth distribution on the 2-D geometry to achieve the target pore size distribution in multidepth microfluidic chips. (d) Different etching layers in sequential photolithography and multietching processes.
We utilized the maximal ball algorithm (Blunt Reference Blunt2017) to identify the 2-D width distribution of the porous structure, as shown in figure 1(a). Statistical information about the width distributions (figure 1b) can be acquired by calculating the ratios of these pore areas. Considering the impact of depth confinement on the hydraulic diameter’s distribution, we divided the aforementioned 2-D diameter-labelled regions into three categories: the first-depth region, the second-depth region and the third-depth region, as shown in figure 1(b,c). To achieve depth variations in pores and ensure mismatch tolerance during the fabrication, we designed the etching range to shrink to the inside of the pores with the etching times increase. As a result, the first mask for the first etching is the original 2-D image containing the all-depth region, the second mask for the second etching is extracted from the first mask that contains the second-depth and third-depth regions, the third mask for the third etching is extracted from the second mask that only contains the third-depth region. Subsequently, the corresponding 2-D geometry can be categorized into different depth regions (figure 1c), enabling the fabrication of depth-variable microfluidic chips through sequential photolithography and multietching methods (figure 1d).
It is worth noting that directly dividing the width distribution into three regions according to 2-D diameter values will result in discontinuities in the 3-D hydraulic diameter distribution due to  $2{R_{{h_i}}} = W{H_i}/(W + {H_i})\; \ne \; 2{R_{{h_j}}} = W{H_j}/(W + {H_j})$, where
  ${H_i}$ and
  ${H_j}$ are different depth values, i and j are different depth labels. To address this issue and maintain a continuous pore size distribution, it is essential to include an overlap width range between two different depth regions, where Area II was designed to make up the gap caused by the first-depth region and the second-depth region that
  $1/W{2_{min}} + 1/2H = 1/W{1_{max}} + 1/H$ and Area IV was designed to make up the gap caused by the second-depth region and third-depth region that
  $1/W{3_{min}} + 1/3H = 1/W{2_{max}} + 1/2H$, where W1max, W2max and W3max represent the largest width for first-depth, second-depth and third-depth regions, respectively; W2min and W3min represent the smallest width for second-depth and third-depth regions, respectively, as shown in figure 1(b). In the overlap width regions II and IV, we randomly select 50 % of the pore area labelled with shallower depth and the other pore area labelled with deeper depth.
Based on the obtained pattern, the porous structures were created from a silicon wafer using microfabrication techniques, including multiple uses of standard photography, and inductively coupled plasma-deep reactive ion etching. Figure 2(a i–iii) shows the corresponding sequential photolithography and multietching processes. With an increase in etching cycles, the geometric confinement in the depth direction is gradually weakened, which is evident in pore-network features that the larger 3-D pores are increased clearly (figure 2b i–iii). To get equal wettability on all surfaces within the microfluidic chip, all etched silicon wafers underwent a one-hour heating process at 1000 °C in the presence of oxygen to create a uniform 100 nm silicon dioxide layer via thermal oxidation (Chomsurin & Werth Reference Chomsurin and Werth2003). Finally, a Schott Borofloat 270 glass wafer with inlet and outlet ports was anodically bonded to the above thermally oxidized silicon. Figure 2(c i–iii) present the final morphology of uniform-depth and depth-variable microfluidic chips observed by the stereo microscope.

Figure 2. Sequence photolithography and multietching processes for depth-variable microfluidic chips with complex porous geometry. (a) Photolithography regions for first, second and third etching processes, where black, blue and red pixels represent pores etched sequentially. (b) Different pore-network features are generated by the SNOW algorithm (Gostick Reference Gostick2017) based on different microfluidic chips with uniform depth, two different depths and three different depths. Grey colour areas are small pores, blue colour areas are middle pores and red colour areas are large pores. (c) The corresponding images from (i) to (iii) are uniform-depth, two-different-depth and three-different-depth microfluidic chips.
The depth confinements of these microfluidic chips can be directly reflected by the 3-D pore size distribution, as shown in figure 3. Here, the depth variation factor is defined as  $\alpha = {d_{max}}/{d_{min}}$,
  ${d_{max}}$ and
  ${d_{min}}$ are the maximum and minimum depth in the microfluidic chips. Smaller depth variation
  $\alpha $ will result in strong depth confinement (figure 3). Figure 3(b) presents the strong depth confinement (
 $\alpha = 1$) in pore size distribution, which is commonly observed in traditional 2-D microfluidic experiments. Our novel multidepth design in microfluidic chips (
 $\alpha = 2,3$) can release the depth confinement and even realize the wide 3-D pore size distribution as 3-D porous media (figure 3d).

Figure 3. Comparing pore size distributions in natural-occurring 3-D porous media and microfluidic chips. From (a) target pore size distribution to corresponding pore distributions of (b) traditional uniform-depth ( $\alpha = 1$), (c) two-different-depth (
 $\alpha = 2$) and (d) three-different-depth (
 $\alpha = 3$) microfluidic chips. The 3-D microstructure of natural rock is regenerated by microcomputed tomography, and the local microstructure of microchips is scanned by the scanning electron microscope. The pore size distributions of natural rock and microfluidic chips are calculated by the maximal ball algorithm (Blunt Reference Blunt2017).
2.2. Experimental set-up and procedures
The experimental set-up used in this study has been introduced in our previous works (Lei et al. Reference Lei, Liu, Xie, Yang, Wu and Wang2020, Reference Lei, Lu, Wu, Yang and Wang2022b). The microfluidic chip was cleaned by acetone, alcohol, 4 vol. % hydrochloric acid and deionized water sequentially, and was dried by N2, then fixed by a homemade holder under the fluorescence microscope (Nikon, SMZ18) with a high-speed camera (Nikon, DS-Ri2). The flow rate was controlled using a feedback-controlled pump (Fluigent, MFCS-EZ) with a precise flow meter (Fluigent, Flow-unit). The visualized displacement processes can be quantified by image processing and data analysis. During displacement experiments in the microfluidic porous media, we employed a spatial resolution of 1.92 μm pixel−1 and a time resolution of 1 s frame−1 to meet the requirements of a quasistatic experiment and analysis of the phenomena from the micron pore scale to centimetre porous media scale.
2.3. Direct numerical simulation methods
Direct numerical simulation within a computational fluid dynamics framework was conducted to investigate the impact of depth variation, capillary number and wettability on the multiphase flow dynamics and fluid entrapment during imbibition in porous media (Ferrari et al. Reference Ferrari, Jimenez-Martinez, Borgne, Méheust and Lunati2015; Zheng et al. Reference Zheng, Lei, ju and Wang2021). Gravity was neglected in this study because Bond number  $Bd = \rho g{r^2}/\gamma \ll 1$, where
  $\rho $ is the fluid density, g is the gravitational acceleration, r is the characteristic pore size and
  $\gamma $ is fluid–fluid IFT. The imbibition processes can be captured by solving the Navier–Stokes (N–S) equations in the pore space and employing the volume-of-fluid (VOF) method to track the evolution of the fluid–fluid interface (Ferrari & Lunati Reference Ferrari and Lunati2013). The VOF method provides a simple and economical way to track the fluid–fluid interface, which can better ensure mass conservation. Generally, it is more flexible and efficient than other two-phase flow models in dealing with problems involving highly complex interface configurations. However, it is also worth noting that VOF simulations can be computationally expensive for problems involving complex geometry.
In our simulations, the direct solution of the governing equations was carried out using the open-source software OpenFOAM (interFoam solver). The wetting phase (water) and non-wetting phase (air or decane) can be treated as incompressible Newtonian fluids under a low flow rate. The flow system of experiments and simulations is under normal temperature and pressure conditions. The governing equations for the isothermal incompressible two-phase immiscible Newtonian fluids are
 \begin{gather}\frac{{\partial (\rho \boldsymbol{u})}}{{\partial t}} + \boldsymbol{\nabla }\boldsymbol{\cdot }(\rho \boldsymbol{uu}) ={-} \boldsymbol{\nabla }p + \boldsymbol{\nabla }\boldsymbol{\cdot }{\bf (}2\mu \boldsymbol{E}) + {\boldsymbol{f}_s},\end{gather}
 \begin{gather}\boldsymbol{\nabla }\boldsymbol{\cdot }\boldsymbol{u} = 0,\end{gather}
where t designates time, the density  $\rho $ and the dynamic viscosity
  $\mu $ are the function of volume fraction
  $\delta $ that
  $\rho (\delta ) = (1 - \delta ){\rho _{nw}} + \delta {\rho _w}$ and
  $\mu (\delta ) = (1 - \delta ){\mu _{nw}} + \delta {\mu _w}$. The volume fraction
  $\delta $ is introduced as an indicator function to represent the volume fraction of wetting fluid within flow cells, where
  $\delta = 1$ and
  $\delta = 0$ denote the wetting phase cell and non-wetting phase cell, respectively, while
  $0 < \delta < 1$ denotes the interfacial cell. The subscript nw stands for the non-wetting phase and the subscript w stands for the wetting phase. Here
  $\boldsymbol{E} = {\textstyle{1 \over 2}}(\boldsymbol{\nabla }\boldsymbol{u} + {\nabla ^T}\boldsymbol{u})$ is the rate-of-strain tensor, u is the vector of the fluid velocity, p is the pressure. Here
  ${\boldsymbol{f}_s}$ is the volumetric surface tension force and describes the effect of the Laplace pressure. These equations are combined with a transport equation for the volume fraction
  $\delta $,
 \begin{equation}\frac{{\partial \delta }}{{\partial t}} + \boldsymbol{\nabla }\boldsymbol{\cdot }(\delta \boldsymbol{u}) = 0,\end{equation}
which can be regarded as a mass-conservation equation for the incompressible wetting fluid.
According to the continuum surface force model (Brackbill, Kothe & Zemach Reference Brackbill, Kothe and Zemach1992), the volumetric surface tension force  ${\boldsymbol{f}_s}$ can be calculated as
 \begin{equation}{\boldsymbol{f}_s} = \gamma \kappa \boldsymbol{\nabla }\delta ,\end{equation}
where  $\kappa $ is the interface curvature. The interface curvature
  $\kappa $ is obtained as
 \begin{equation}\kappa ={-} \boldsymbol{\nabla }\boldsymbol{\cdot }\boldsymbol{n} ={-} \boldsymbol{\nabla }\boldsymbol{\cdot }\left( {\frac{{\boldsymbol{\nabla }\delta }}{{|{\boldsymbol{\nabla }\delta } |}}} \right).\end{equation}
When fluids flow through a porous medium, their access to space is restricted – they are confined within the pore space defined by the solid matrix surface. The fluid–wall interaction adopts no-slip boundary conditions. The wettability of the fluid–fluid–solid system is considered by imposing an additional constraint at the intersection between the interface and solid surface (Ferrari & Lunati Reference Ferrari and Lunati2013),
 \begin{equation}\boldsymbol{n}{|_{x \in wall}} = {\boldsymbol{n}_{\boldsymbol{s}}}\,\textrm{cos}\,\theta + {\boldsymbol{t}_{\boldsymbol{s}}}\,\textrm{sin}\,\theta ,\end{equation}
where  $\theta $ is the static contact angle of the invading fluid,
  $\boldsymbol{n}$ is the normal cell vector of the fluid–fluid interface. Here
  ${\boldsymbol{n}_{\boldsymbol{s}}}$ is the normal cell pointing into the solid and
  ${\boldsymbol{t}_{\boldsymbol{s}}}$ is the cell tangent to solid points into the wetting phase.
The advection equation (2.3) is solved explicitly using the velocity from the previous time step. A nonlinear convective term is added in (2.3) to keep the interface sharp and create a shock that balances numerical diffusion. These yield
 \begin{equation}\frac{{\partial \delta }}{{\partial t}} + \boldsymbol{\nabla }\boldsymbol{\cdot }(\delta \boldsymbol{u}) + \boldsymbol{\nabla }\boldsymbol{\cdot }[\delta (1 - \delta ){\boldsymbol{u}_r}] = 0,\end{equation}
where  ${\boldsymbol{u}_r}$ is a suitable compression velocity, which does not affect the solution outside the interface region because of the factor
  $\delta (1 - \delta )$. An appropriate discretization and a suitable choice of the parameters ensure mass-conservation of the phase fraction and guarantee a bounded and unbiased solution (Berberović et al. Reference Berberović, Van Hinsberg, Jakirlić, Roisman and Tropea2009; Ferrari & Lunati Reference Ferrari and Lunati2013). This is achieved by using the multidimensional universal limiter with explicit solution solver, which is implemented in interFoam, to compute the compression velocity,
  ${\boldsymbol{u}_r} = \min [{C_f}|\boldsymbol{u}|,\;\max (|\boldsymbol{u}|)]\boldsymbol{n}$, which acts perpendicular to the interface due to the presence of the interface normal
  $\boldsymbol{n}$ (Ferrari & Lunati Reference Ferrari and Lunati2013). Here
  $\textrm{max}(|\boldsymbol{u} |)$ is the maximum velocity in the interface region and
  ${C_f}$ is a user-defined parameter that controls the strength of the compression. In our simulations, we have used
  ${C_f} = 1$, which guarantees a conservative compression and ensures a convergent numerical scheme: the compression term vanishes and (2.3) is recovered if the interface thickness tends to zero (Weller Reference Weller2008; Berberović et al. Reference Berberović, Van Hinsberg, Jakirlić, Roisman and Tropea2009).
A rectangular buffer region with a length of 40 μm is set up at the inlet and outlet of the porous medium. At the initial state, the wetting phase fills the buffer region at the inlet, and the non-wetting phase fills other volumes. The coupled continuity and momentum equations were solved using the pressure implicit with the splitting of the operator method. At each computing step, the time step  $\Delta t$ is automatically adjusted based on the Courant–Friedrichs–Lewy condition, where the maximum Courant number Co is set as 0.5 (Zhou et al. Reference Zhou, Shang, Chen, Chen and Hu2022). To manage the substantial computational cost associated with solving the N–S equations together with the VOF method, we focused our simulations on a reduced 3-D domain, specifically a 1/4 × 1/4 portion of the original microfluidic chip. This approach allowed us to qualitatively capture the structural complexity and the dynamics of multiphase flow processes as observed in the whole microfluidic chips. The calculation domain only contains the pore space of porous media, where an unstructured grid was used. It is worth noting that even with the current local porous structure, the calculation amount of direct numerical simulation is huge. Each case in this article approximately requires 224 cores to be calculated for more than two months, which means that it is nearly impossible to calculate the displacement in whole microfluidic porous media because the porous structure size increases 16 times, and displacement time increases four times. The discretization and meshing methods and verifications of the numerical model for capturing correct multiphase flow dynamics are presented in Appendix A. Our simulations were conducted at the High-Performance Computing Center of Tsinghua University, China.
2.4. Dynamic pore-network models
Considering the huge calculation and time consumption of direct numerical simulations for macroscopic porous media, pore-network models are intuitive and computationally inexpensive to link the pore-scale flow behaviour and macroscopic multiphase flow patterns. To simplify calculations and present the main flow dynamics, the porous geometry in the pore-network model is approximated by a pores-throats network, including series pore-throat channels and parallel pore-doublets, and the flow follows the fully developed Poiseuille flow law. The dynamic pore-network model was applied to consider the competition between viscous forces and capillary forces on displacement processes. Considering the importance of pore-scale events, such as bypass and snap-off (Singh et al. Reference Singh, Bultreys, Raeini, Shams and Blunt2022), we will improve the dynamic pore-network model to link the pore-scale events and macroscopic flow patterns in porous media. Details of improved dynamic pore-network models are introduced in Appendix B.
3. Results and discussion
In this section, forced imbibition experiments were conducted in different microfluidic chips first. These microfluidic chips have the same 2-D morphology, except that the depth variation ranges from uniform depth ( $\alpha = 1$), two different depths (
 $\alpha = 2$) to three different depths (
 $\alpha = 3$). During imbibition in porous media, the trapped non-wetting phase can be classified into three types: (i) isolated ganglia, which are trapped by the instability of water film flow along the corner (arc-menisci), also called corner flow; (ii) clusters, which occupy several pores bypassed by the main meniscus (the main terminal meniscus); and (iii) unswept non-wetting area, which occupies a continuous region skirted by the macroscopic preferential flow (preferential flow pathway). Through a combination of microfluidic experiments and direct numerical simulations, it was evident that depth variation, capillary number and wettability can significantly affect the non-wetting phase entrapment, which stems from microscopic flow dynamics including the instability of this corner flow and the velocity mismatch of the main meniscus in pore-doublets. Then, pore-scale theoretical models and corresponding phase diagrams were proposed and verified based on series pore-throat channels or pore doublets. Finally, to emphasize the importance and generality of these pore-scale events, these pore-scale events were inputted into an improved dynamic pore-network model, which can reproduce the above macroscopic flow patterns in microfluidic porous media.
3.1. Fluid entrapment during forced imbibition in microfluidic porous media
3.1.1. The effect of capillary number on the fluid entrapment scenario
The effect of capillary number on fluid entrapment and imbibition stability was explored in different microfluidic chips under strongly water-wet conditions ( $\theta \approx 30^\circ $). The air was used as the non-wetting phase which was presaturated in the microfluidic chip before the waterflooding. Dyed water (100 ppm fluorescein sodium salt, Macklin) was used as the aqueous phase. The IFT
  $\gamma $ between the two phases is 73 mN m−1. The dynamic viscosity of the wetting phase (water)
  ${\mu _w}$ is 1.0 mPa s, and the dynamic viscosity of the non-wetting phase (air)
  ${\mu _{nw}}$ is 0.018 mPa s. The water flow rate q was adjusted for different capillary numbers,
  $Ca = ({\mu _w}{u_i})/\gamma $, where
  ${u_i} = q/S$ is the characteristic velocity of the inlet cross-section of porous structure, which is located at the connection between the buffer region and the porous structure,
  $S = w\,\textrm{d}\phi $ was the area of the inlet cross-section, w = 6 mm is the width of the microfluidic porous media, d = 40 μm is the depth of buffer region and
  $\phi = 0.38$ is the 2-D porosity of the inlet cross-section, which is equal to the one-dimensional porosity of the inlet cross-section in the width direction. The contact angle of water on the thermal oxidation silicon wafer in the air is
  $\theta = 32 \pm 3^\circ $, which is measured by a contact-angle-measuring instrument (DSA25, Krüss).
Under strong imbibition ( $\theta \approx 30^\circ $), we compared experimental and simulated displacement patterns in various microfluidic chips (
 $\alpha = 1,2,3$) at different capillary numbers (Ca = 2.6 × 10⁻⁴, 2.6 × 10⁻⁵), as shown in figure 4. At higher Ca = 2.6 × 10⁻⁴, the observed patterns exhibit a cooperative pore-filling mechanism driven by the continuous fluid–fluid main meniscus within several narrow preferential flow pathways. Upon reducing the capillary number to a lower level (Ca = 2.6 × 10⁻⁵), for the uniform-depth microfluidic chip (
 $\alpha = 1$), the pore bodies are predominantly occupied either entirely by the wetting phase or the non-wetting phase (figure 4a iv). In the case of
  $\alpha = 1$, decreasing Ca results in an increase in the invading width, a finding that aligns qualitatively with the results reported by Stokes et al. (Reference Stokes, Weitz, Gollub, Dougherty, Robbins, Chaikin and Lindsay1986). However, under lower capillary number (Ca = 2.6 × 10⁻⁵), varying from uniform-depth microfluidic chip to three-different-depth microfluidic chip destabilizes the immiscible two-phase flow (figure 4a iv–vi). For the three-different-depth microfluidic chip (
 $\alpha = 3$), nearly every pore body entraps isolated non-wetting ganglia, while the wetting phase occupies pore edges and small pores by sequentially coating the perimeters of neighbouring walls (figure 5a,b). What is particularly intriguing is that the fluid entrapment within depth-variable microfluidic chips contradicts the invasion dynamics reported by Stokes et al. (Reference Stokes, Weitz, Gollub, Dougherty, Robbins, Chaikin and Lindsay1986), where decreasing Ca leads to lower water saturation Sw (figure 4c,d), and numerous isolated non-wetting fluid ganglia are trapped by the water flow in the three-different-depth microfluidic chip (figure 4a vi,b vi). Consequently, an increase in depth variation
  $\alpha $ appears to transform the main entrapment morphology from preferential flow-induced unswept areas into unstable bypass-induced clusters or corner flow-induced isolated ganglion types under strong imbibition conditions (figure 4a iv–vi).

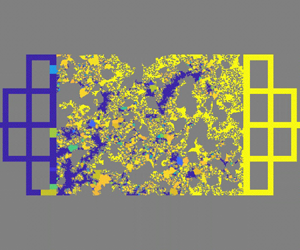
Figure 4. Capillary number effect on the invasion morphologies at the breakthrough stage when the wetting fluid reaches the outlet in experiments (a) and simulations (b). Two different capillary numbers were used in the experiments and simulations, with higher Ca = 2.6 × 10⁻⁴ (a i–iii, b i–iii) and lower Ca = 2.6 × 10⁻⁵ (a iv–vi, b iv–vi) under the same contact angle  $\theta \approx 30^\circ $. The water saturation Sw at the breakthrough stage of microfluidic experiments (c) and simulations (d) was influenced by capillary number Ca and depth variation
  $\alpha $.

Figure 5. The imbibition process in the three-different-depth microfluidic experiments and corresponding direct numerical simulations under capillary number Ca = 2.6 × 10⁻⁵ and contact angle  $\theta \approx 30^\circ $. (a) The global view of water displacing air in a three-different-depth microfluidic chip before the breakthrough stages. (b) Enlarged view of corresponding snapshots during forced strongly imbibition illustrating the water film flow and snap-off phenomena. (c) The simulated invasion morphologies until the invading fluid reaches the outlet of the calculation domain, where the calculated area is the same as the enlarged structure. The pore volume of microfluidic porous media is used to represent the dimensionless time of multiphase displacement.
It can be concluded that under higher Ca conditions, the main meniscus velocity far exceeds the corner flow velocity, so corner flow is submerged, and conversely, the water film flow will be triggered to trap the non-wetting phase. The water saturation Sw of microfluidic experiments and simulations at the breakthrough stage also presents that the invasion dynamics reported by Stokes et al. (Reference Stokes, Weitz, Gollub, Dougherty, Robbins, Chaikin and Lindsay1986) were primarily applicable to traditional uniform-depth microfluidic chips ( $\alpha = 1$), where decreasing Ca leads to a more complete displacement. Conversely, in the case of multidepth microfluidic chips (
 $\alpha = 2,3$), decreasing Ca results in a pronounced fluid entrapment with a more incomplete displacement (figure 4c,d). This fluid entrapment in multidepth microfluidic chips is rarely observed by traditional 2-D microfluidic experiments (Jung et al. Reference Jung, Brinkmann, Seemann, Hiller, Sanchez de la Lama and Herminghaus2016; Singh et al. Reference Singh, Jung, Brinkmann and Seemann2019; Cha et al. Reference Cha, Xie, Feng and Balhoff2021) and 2-D pore-scale simulations (Holtzman & Segre Reference Holtzman and Segre2015; Hu et al. Reference Hu, Lan, Wei and Chen2019; Wolf, Siebert & Surmas Reference Wolf, Siebert and Surmas2020), but is frequently encountered in 3-D porous media (Chaudhary et al. Reference Chaudhary, Bayani Cardenas, Wolfe, Maisano, Ketcham and Bennett2013; Mehmani et al. Reference Mehmani, Kelly, Torres-Verdín and Balhoff2019).
By comparing experimental invading processes and corresponding numerical simulations results in the three-different-depth microfluidic chip at the same local region (figure 4a vi,b vi), we find that the numerical method accurately captures the invading pathway and fluid entrapment behaviour, despite using only a 1/4 × 1/4 portion of the microfluidic structures due to computational limitations (figure 5). Figure 5 shows that the patterns evolve into thinner films forming patterns with branches and frequent reconnections. The thin water film forms and propagates throughout the porous media, which is far speedier than the main meniscus flow. The simulated imbibition morphologies are qualitatively consistent with the experimental results that increasing depth variation  $\alpha $ promotes isolated ganglia and small cluster formation by the unstable corner flow, as shown in figure 4(b i–vi). Our numerical results effectively reflect the main trapping characteristics, determined by the competition between corner flow and the main meniscus, during fluid displacement within the microfluidic chips.
3.1.2. The effect of wettability on the fluid entrapment scenario
To investigate the impact of wettability on the entrapment of non-wetting fluids, we varied the wettability from strongly water-wet ( $\theta \approx 30^\circ $) to weakly water-wet (
 $\theta \approx 60^\circ $). The experimental conditions remained consistent, except that dyed decane (100 ppm Nile red) was used as the non-aqueous phase to adjust the wettability to weakly water-wet conditions. The IFT between the two phases is 49 mN m−1. The viscosity of the non-wetting phase (decane)
  ${\mu _{nw}}$ is 0.838 mPa s. The contact angle of water on the thermal oxidation silicon wafer immersed in decane is
  $\theta = 61 \pm 5^\circ $, which is measured by a contact-angle-measuring instrument (DSA25, Krüss). The viscous instability can also be ignored due to the viscosity ratio (
 $M = {\mu _w}/{\mu _{nw}} = 1.2$) being much larger than 10−2 (Lenormand, Touboul & Zarcone Reference Lenormand, Touboul and Zarcone1988; Primkulov et al. Reference Primkulov, Pahlavan, Fu, Zhao, Macminn and Juanes2021).
As wettability transitions from strongly water-wet to weakly water-wet conditions in depth-variable microfluidic chips ( $\alpha = 2,3$), the non-wetting fluid entrapment will transform from isolated ganglia to clusters or unswept areas because the corner flow was overwhelmed (figure 6a ii,iii). Simulation results also support this trend, indicating that an increase in the contact angle
  $\theta $ stabilizes the imbibition interface and transfers the corner flow instability-induced snap-off to stable main meniscus flow (figure 6b ii,iii). Conversely, in uniform-depth microfluidic chips (
 $\alpha = 1$), decreasing the contact angle
  $\theta $ can promote main meniscus flow advances in small channels, resulting in the emergence of more small branches from the preferential flow pathway, as shown in both experimental results (figure 6a i,iv) and simulation results (figure 6b i,iv), which are also consistent with previous studies (Holtzman & Segre Reference Holtzman and Segre2015; Jung et al. Reference Jung, Brinkmann, Seemann, Hiller, Sanchez de la Lama and Herminghaus2016).

Figure 6. Wettability effect on the invasion morphologies at the breakthrough stage when the wetting fluid reaches the outlet in experiments (a) and simulations (b). Two different contact angles were used in the experiments and simulations, with a higher contact angle  $\theta \approx 60^\circ $ (a i–iii,b i–iii) and a lower contact angle
  $\theta \approx 30^\circ $ (a iv–iv,b iv–vi) under the same capillary number (Ca = 2.6 × 10⁻⁵). The water saturation Sw at the breakthrough stage of microfluidic experiments (c) and direct numerical simulations (d) was influenced by contact angle
  $\theta $ and depth variation
  $\alpha $.
The water saturation Sw of microfluidic experiments and simulations at the breakthrough stage also presents that for the uniform-depth microfluidic chip ( $\alpha = 1$), the water saturation Sw increases as decreasing contact angle
  $\theta $, which results in a more complete displacement; in contrast, for depth-variable microfluidic chips (
 $\alpha = 2,3$), decreasing the contact angle
  $\theta $ causes a reduction in water saturation, indicating a strengthening of fluid entrapment in this scenario (figure 6c,d).
3.2. Pore-scale theoretical models and phase diagrams
Considering that local direct numerical simulations exhibit a similar trend to that observed in microfluidic chips (figures 4–6), the pore-scale mechanism of the trapped ganglia and clusters formation during the forced imbibition process in uniform-depth and depth-variable microfluidic chips plays an important role in fluid entrapment. The complex porous structure can be dissected into a series of idealized series pore-throat channels and parallel pore doublets (figure 7). Corresponding pore-scale trapping events can be classified as snap-off and bypass modes. It is worth noting that the morphology of preferential flow pathways in the microfluidic chips appears to be nearly consistent (figures 4 and 6), potentially controlled by fluid properties, such as viscous instability (Zhao et al. Reference Zhao, Macminn and Juanes2016) and elastic flow instability (Browne et al. Reference Browne, Huang, Zheng and Datta2023) and the spatial correlation of pore spaces (Siena et al. Reference Siena, Iliev, Prill, Riva and Guadagnini2019). Here we ignored this complex formation of preferential flow pathways and mainly focused on the formation of isolated ganglia and clusters, which is dominated by capillary forces at the microscopic scale.

Figure 7. Schematic diagram of the geometry and liquid–liquid interface of (a i–iii) the series pore-throat channel and (b i–iii) pore doublets. (a i,b i) Top view of channels. (a ii,b ii) The main view of channels. (a iii,b iii) The side view of channels. (a iv,b iv) Multiphase distribution and fluid–fluid interface. The blue line is the fluid–fluid interface.
To gain physical insight into isolated ganglia formation, the snap-off criterion was proposed under strongly water-wet conditions. We develop a critical capillary number  $C{a_c}$ that incorporates the contribution of the contact angle
  $\theta $ and quantifies the relative importance of main meniscus flow and corner flow in the series pore-throat channel. Furthermore, the depth-variation effect on the snap-off phenomenon was discussed. For the microscopic mechanism of cluster formation, the bypass criterion was proposed to separate stable and unstable (bypass) displacement patterns. We develop a critical contact angle
  ${\theta _c}$, which incorporates the contribution of the geometry factor
  $\varPsi $ and quantifies the competition relation of different main meniscus flow in parallel large and small channels.
3.3.1. Snap-off criteria in series pore-throat channels
The criterion for the occurrence of snap-off in a series pore-throat channel is determined by the instability of the water flow, which is controlled by three conditions: (i) wettability condition,  $\theta < ({\rm \pi} - \varphi )/2$, where
  $\varphi $ is the corner angle and the contact angle in our microfluidic chips for corner flow should satisfy
  $\theta < 45^\circ $, which can maintain the existence of corner flow in the angular channel (Concus & Finn Reference Concus and Finn1969); (ii) geometry condition (Roof Reference Roof1970; Lenormand, Zarcone & Sarr Reference Lenormand, Zarcone and Sarr1983),
  $(1/{W_p} + 1/{D_p}) - (1 - \textrm{tan}\,\theta )/\textrm{min}({w_t},{d_t}) < 0$,
  ${W_p}$ and
  ${D_p}$ are the width and depth of the pore, respectively,
  ${w_t}$ and
  ${d_t}$ are the width and depth of the throat, respectively (figure 7a). It can cause the unstable interface of the water film at the throat by
  $\Delta {P_c} = {p_{c - p}} - {p_{c - {t_{cir}}}} < 0$, where
  ${p_{c - p}}$ is the capillary pressure at the main meniscus in the pore and
  ${p_{c - {t_{cir}}}}$ is critical capillary pressure when the corner flow interface merges at the throat; (iii) capillary number condition,
  $Ca < C{a_c}$, where
  $C{a_c}$ is the critical capillary number, which can determine the domination role of the precursor corner flow. The detailed derivation of the snap-off criterion is presented in Appendix C.
Snap-off events only occur under strongly water-wet conditions ( $\theta < 45^\circ $ for rectangular channels), but the occurrence of snap-off was also controlled by the pore geometry and capillary number, as shown in figure 4. The snap-off criterion depends on the relative value of these geometry-dependent capillary pressures, when the following criterion is satisfied, snap-off will occur in the series pore-throat channel:
 \begin{equation}\Delta {P_c} = 2\gamma \,\textrm{cos}\,\theta \left[ {\left( {\frac{1}{{{W_p}}} + \frac{1}{{{D_p}}}} \right) - \frac{{1 - \textrm{tan}\,\theta }}{{\min ({w_t},{d_t})}}} \right] < 0.\end{equation}
 In depth-variable microfluidic chips, a larger pore width will have a larger pore depth, thus the depth of the pore channel will be several times that of the throat,  ${D_p} = \alpha {d_t}$. Therefore, compared with uniform-depth microfluidic chips (
 $\alpha = 1$), depth-variable microfluidic chips can satisfy the geometry conditions (3.1) more easily, described as follows:
 \begin{equation}\Delta {P_c}(\alpha \ge 1) - \Delta {P_c}(\alpha = 1) = \left( {\frac{1}{\alpha } - 1} \right)\frac{1}{{{d_t}}} \le 0.\end{equation}
 It can be concluded that increasing depth variation  $\alpha $ will promote the occurrence of snap-off, as shown in figure 4. However, the above geometric criteria are only valid under lower capillary numbers where the corner flow velocity is much higher than the main meniscus flow velocity. By comparing the mean flow velocity of corner flow and main meniscus flow, the critical capillary number
  $C{a_c}$ can be determined by
 \begin{equation}C{a_c} = 2a{(6K\beta \tau )^{ - 1/2}},\end{equation}
where  $\beta = \mathcal{C}/[2{\hat{g}_w}{(\textrm{cos}\,\theta - \textrm{sin}\,\theta )^4}]$ is the dimensionless flow resistance as a function of contact angle
  $\theta $, where
  ${\hat{g}_w}$ is the dimensionless conductance of the wetting phase proposed by Patzek & Kristensen (Reference Patzek and Kristensen2001). Other parameters are constant, such as a is a parameter introduced by the trial function, and the parameter K is calculated by a variational method. For a tube with rectangular corners, a and K are 0.59 and 1.447 (Ransohoff & Radke Reference Ransohoff and Radke1988), respectively. Here
  $\tau = {10^4}$ is the dimensionless time for snap-off phenomena based on previous experimental observation (Gauglitz, St. Laurent & Radkle Reference Gauglitz, St. Laurent and Radkle1987).
When  $Ca > C{a_c}$, the corner flow from the moving meniscus will not be fully developed, thus snap-off phenomena will be suppressed. The theoretical results illustrate how
  $C{a_c}$ varies as a function of contact angle
  $\theta $ and the snap-off criterion under different contact angles
  $\theta $ are presented in figure 8. Figure 8(a) illustrates that the analytically predicted
  $C{a_c}$ agrees well with the numerical results in distinguishing between the stable and snap-off for all combinations of the capillary number Ca and contact angle
  $\theta $. In the simulations, a series pore-throat channel with a square cross-section was used. The geometry condition
  $1/{W_p} + 1/{D_p} - (1 - \textrm{tan}\,\theta )/\textrm{min}({w_t},{d_t}) < 0$ is satisfied in this pore-throat channel. A typical evaluation of two-phase distributions in the pore-throat geometry at different Ca under strongly water-wet conditions is present in figure 8(b). The competition between the main meniscus and precursor corner flow is also presented well in figure 8(b), which numerically supports our theoretical analysis in (3.3).

Figure 8. Increasing the capillary number Ca over the critical value Cac will suppress the snap-off event. (a) Semilog simulation plot showing the relationship between Ca and θ. The solid line indicates the analytically predicted Cac (3.3). The symbols are the results obtained by the direct numerical simulations, where filled and open symbols represent the snap-off and stable displacement, respectively. (b) Time evaluation of two-phase distributions in the pore-throat geometries by the direct numerical simulation at the different Ca but  $\theta = 30^\circ $. The widths of the pore channel and the throat channel are 120 and 60 μm, respectively, and the depths of the pore channel and the throat channel are 80 and 40 μm, respectively.
An important finding from our simulations is that under strongly water-wet conditions ( $\theta < 45^\circ $), the impact of the contact angle
  $\theta $ on the critical capillary number
  $C{a_c}$ remains relatively constant, showing a weakly linear relationship, with
  $C{a_c}$ typically falling within the range of around 10−3–10−4. The trend is qualitatively consistent but the value is slightly higher than our microfluidic experiments (figure 4) and the previous porous media studies summarized by Hu et al. (Reference Hu, Wan, Yang, Chen and Tokunaga2018). This slight discrepancy may be attributed to the geometric disparities between the simplified pore-throat channel used in our simulations and the complex porous structures.
3.3.2. Bypass criteria in pore-doublet channels
Bypass events are generated by the velocity mismatch of the main meniscus flow in pore doublets, as shown in figure 7(b). Our analysis focuses solely on scenarios in which fluid–fluid interfaces within these pore doublets are connected. Here the smaller channel as an interior edge will influence the interfacial stability, which plays an important role in capillarity-driven flow. This pore-scale model aligns with our microfluidic experiments, where shallow channels surround the deeper channel in a multidepth microfluidic chip designed and the merging of fluid–fluid interfaces occurs frequently, otherwise, the previous pore network model for separate main meniscus should be considered as well as the competition between viscous force and capillary force (Chatzis & Dullien Reference Chatzis and Dullien1983; Gu et al. Reference Gu, Liu and Wu2021). Moreover, we assume that the capillary force in the large channel is not affected by the small channel, but the critical value of the capillary force in the small channel is affected by the large channel, this assumption is also validated by the simulation results (figure 9b). The detailed derivation of the bypass criterion is presented in Appendix D.

Figure 9. Increasing the contact angle  $\theta $ over the critical value
  ${\theta _c}$ will inhibit the bypass event. (a) Simulation plot showing the relationship between
  $\theta $ and
  $\varPsi $. The solid line indicates the analytically predicted critical
  $\textrm{cos}\,{\theta _c}$, which is a solution of the bypass criterion predicted by (3.6). The filled and open symbols represent the bypass and stable displacement, respectively. The widths of the large and small channels are set as 120, 80 μm (square); 200, 60 μm (circle); 160, 100 μm (triangle); 160, 140 μm (rhombus), respectively. The depth of the small channel is set as 40 μm, and the large channel is set as 80 μm (red) or 120 μm (blue). Blue samples will have larger
  $\varPsi $ than red samples. (b) Time evaluation of two-phase distributions in the paralleled large and small channels by the direct numerical simulation under different
  $\theta $ but
  $\varPsi = 0.67$. The widths of the large and small channels are set as 120 μm and 80 μm. The depths of the large and small channels are set as 80 and 40 μm.
If the capillary force difference in the large channel and small channel  $\Delta {P_c} < 0$, the interface in the small channel will invade preferentially and the bypass phenomenon will occur,
 \begin{gather}\Delta {P_c} = 2\gamma \left[ {\textrm{cos}\,\theta \left( {\frac{1}{{{W_l}}} + \frac{1}{{{D_l}}}} \right) - \left( {\textrm{cos}\,\theta \frac{1}{{{d_s}}} - \frac{{1 - \textrm{cos}\,\theta }}{{2{w_s}}}} \right)} \right] < 0,\end{gather}
 \begin{gather}\textrm{cos}\,\theta > \textrm{cos}\,{\theta _c} = \frac{1}{{2{w_s}\left( {\dfrac{1}{{{d_s}}} - \dfrac{1}{{{W_l}}} - \dfrac{1}{{{D_l}}}} \right) + 1}},\end{gather}
where  ${\theta _c}$ is the critical contact angle for bypass phenomena, using the dimensionless geometry factor of the parallel channels
  $\varPsi = 2{w_s}(1/{d_s} - 1/{W_l} - 1/{D_l})$ gives rise to the bypass criterion,
 \begin{equation}\textrm{cos}\,{\theta _c} = \frac{1}{{\varPsi + 1}}.\end{equation}
 In our microfluidic experiments, the large channel has a larger width  ${W_l}$, thus the depth of the large channel will be several times that of the throat,
  ${D_l} = \alpha {d_s}$. We find the larger depth variation
  $\alpha $ will lead to a higher
  $\varPsi $, which will result in a higher critical contact angle
  ${\theta _c}$,
 \begin{equation}\varPsi (\alpha \ge 1) - \varPsi (\alpha = 1) = {w_s}\frac{1}{{{d_s}}}\left( {1 - \frac{1}{\alpha }} \right) \ge 0.\end{equation}
 It can be concluded that increasing depth variation  $\alpha $ will promote the occurrence of the bypass event. The theoretical results illustrate how
  ${\theta _c}$ varies as a function of
  $\varPsi $ and the bypass criterion under different
  $\varPsi $ is presented in figure 9. Figure 9(a) illustrates that the analytically predicted
  ${\theta _c}$ agrees well with the numerical results in distinguishing between the stable and unstable front (bypass) for all combinations of contact angle
  $\theta $ and geometry factor
  $\varPsi $. In the simulations, pore doublets (parallel large and small channels) with a square cross-section were accepted. A typical time evaluation of two-phase distributions in the pore doublets geometry at different
  $\theta $ is present in figure 9(b). The competition of the main meniscus in parallel small and large channels numerically supports our theoretical analysis in (3.6) and (3.7), as shown in figure 9.
We can find that smaller  $\theta $ will result in the main meniscus flow in the small channel far exceeding this in the large channel, thus the bypass mode occurs more easily in smaller
  $\theta $. This pore-scale phenomenon explains that decreasing contact angle leads to more small channel branches and clusters in porous media. The critical contact angle
  ${\theta _c}$ will decrease with increasing geometry factor
  $\varPsi $, which is also consistent with the flow patterns in porous media that increasing depth variation
  $\alpha $ can trigger the bypass mode, as shown in figure 6(a i–iii).
3.3. Linking pore-scale events to macroscopic imbibition patterns
To demonstrate the dominance of these pore-scale events (snap-off and bypass) and give a quantitative comparison between experiments and simulations, we simulated the macroscopic imbibition patterns in microfluidic porous media by the improved dynamic pore-network model, where the snap-off and bypass behaviours are incorporated in the model. The simulated macroscopic imbibition patterns and quantification analysis of wetting phase saturation are presented in figure 10. Since the pore network model can only present the saturation of each pore but not the specific fluid distribution state in the pore, we use the distribution of water saturation in each pore to represent the multiphase distribution in microfluidic porous media, as shown in figure 10(a–i). Purple represents completely occupied by water, yellow represents occupied by non-aqueous phase and the colour between purple and yellow means aqueous and non-aqueous phases occupy the same pore at the same time. The morphology of imbibition patterns simulated by the improved dynamic pore-network model is similar to that of microfluidic experiments, where increasing depth variation  $\alpha $ can promote fluid entrapment, whereas increasing capillary number Ca and contact angle
  $\theta $ yield the opposite effect (figure 10a–i). The water saturation variation Sw affected by capillary number Ca or contact angle
  $\theta $ also fits with the experimental results and the difference in the water saturation value Sw between the dynamic pore-network model and microfluidic experiments is less than 5 % (figure 10j,k).

Figure 10. Linking pore-scale flow behaviour to macroscopic imbibition patterns by the improved dynamic pore-network model. (a–f) The invasion morphologies and local water saturation distribution at the breakthrough stage: higher Ca = 2.6 × 10⁻⁴ (a–c) and lower Ca = 2.6 × 10⁻⁵ (d–f) under the same contact angle θ = 30°. (d–i) The invasion morphologies and local water saturation distribution at the breakthrough stage under two different wettability: lower θ = 30° (d–f) and higher θ = 60° (g–i) under the same capillary number Ca = 2.6 × 10⁻⁵. (j,k) The quantitative comparison between microfluidic experiments and dynamic pore-network model simulations about water saturation Sw in microfluidic porous media affected by (j) capillary number and (k) contact angle at the breakthrough stage.
3.4. Implications and discussion
According to microfluidic experiments, theoretical analysis and simulations, we can conclude: (i) increasing depth variation  $\alpha $ results in incomplete displacement by triggering snap-off or bypass or their combinations; (ii) higher capillary number Ca can lead to complete displacement by suppressing the snap-off event when
  $\theta \le 45^\circ $, and increased contact angle
  $\theta $ can lead to complete displacement by inhibiting the bypass event when
  $\theta < 90^\circ $. These microscopic pore-scale conclusions can explain the complex capillary phenomena of microfluidic experiments, which has been demonstrated by the improved pore-network model, which establishes a bridge between our understanding of interfacial behaviour at the single pore scale and the formation of displacement patterns in porous media. However, it should be noted that the capillary forces are dominant, and the viscous instability of the fluid–fluid interface is ignored in this work, so our microscopic flow dynamic mechanisms and macroscopic fluid entrapment should be revisited when the viscosity ratio
  $M = {\mu _w}/{\mu _{nw}}$ is smaller than 10−2 (Lenormand et al. Reference Lenormand, Touboul and Zarcone1988; Primkulov et al. Reference Primkulov, Pahlavan, Fu, Zhao, Macminn and Juanes2021). Thin films from the moving meniscus will lead to different entrapment scenarios considering the Saffman–Taylor instability (Levaché & Bartolo Reference Levaché and Bartolo2014; Odier et al. Reference Odier, Levaché, Santanach-Carreras and Bartolo2017). The coupling of viscous instability and strong imbibition will present more complex entrapment patterns even in uniform-depth microfluidic chips (Zhao et al. Reference Zhao, Macminn and Juanes2016). In addition, the surface roughness will influence the precursor film flow behaviour to trigger snap-off phenomena (Sun, Mehmani & Torres-Verdín Reference Sun, Mehmani and Torres-Verdín2021). Preferential flow conditions can also promote imbibition instability and trigger fluid entrapment (Lei et al. Reference Lei, Lu, Liu and Wang2022a). The Haines jump will lead to a clear initial effect, especially under strong drainage conditions, which may result in different snap-off events (McKinley & Renardy Reference Mckinley and Renardy2011; He et al. Reference He, Yang, Qin, Wen and Zhang2017). All those problems will be analysed to modify those models in future work.
4. Conclusions
In this study, we have introduced an innovative fabrication technique for multidepth microfluidic chips with complex porous geometry. Compared with traditional uniform-depth microfluidic chips, these multidepth microfluidic chips can release the geometric confinement to mimic the wide pore size distribution as naturally 3-D porous structures. The geometric confinement-induced capillarity limitations differ in uniform-depth, two-different-depth and three-different-depth microfluidic chips. These depth-variable microfluidic chips could be an advanced tool for adjusting geometric confinements of porous media and reflecting different fluid dynamics and fluid entrapment during forced imbibition in different geometric-confined porous media.
The experiments of forced imbibition have elucidated the complex interplay of depth variation  $\alpha $, capillary number Ca and wettability
  $\theta $ on flow behaviours and fluid entrapment. Different from the imbibition behaviour in traditional uniform-depth microfluidic chips (
 $\alpha = 1$), increasing depth variation
  $\alpha $ to release the geometric confinement can promote fluid entrapment during forced imbibition experiments, whereas increasing capillary number Ca and contact angle
  $\theta $ yield the opposite effect. These microfluidic experiments and corresponding direct numerical simulations enabled us to purify the complex capillarity and classify the basic microscopic transport modes as snap-off and bypass phenomena. Increasing depth variation
  $\alpha $ in microfluidic chips can enhance the instability of corner flow or the main meniscus. However, the higher capillary number Ca will suppress the corner flow instability-induced snap-off phenomena, and the larger contact angle
  $\theta $ will weaken the main meniscus flow instability-induced bypass phenomena. We proposed a theoretical model to elucidate the combined effect of geometric confinement, capillary number and wettability on the snap-off and bypass phenomena. These phase diagrams predicted by the theoretical model describe the pore-scale imbibition behaviour transition from stable flow to snap-off or bypass modes, which were numerically verified. By incorporating these pore-scale events into pore-scale flow behaviours, we establish the link between the microscopic flow dynamics and macroscopic flow patterns in porous media.
Our study not only sheds light on the coupling effects of 3-D pore structure, capillary number and wettability on non-wetting phase entrapment in porous media but also delves into the dynamics of the microscopic main meniscus and water film, offering insights into macroscopic flow patterns. This analysis provides the understanding of CO2 storage in the deep stratum for hydrocarbon reservoirs, contaminant transport in underground aquifers and hydrocarbon recovery processes, the optimization of multiphase behaviour during liquid-infused material fabrication or operational guidelines for the 3-D geometry design of microfluidic chips for controlling multiphase flow patterns.
Funding
This work is financially supported by the NSF grant of China (no. 12272207) and the National Key Research and Development Program of China (no. 2019YFA0708704).
Declaration of interests
The authors report no conflict of interest.
Appendix A. Details and verifications of numerical methods
In our simulations, ICEM software is used for meshing for direct numerical simulations. Only the pore space of porous media is described by unstructured mesh (figure 11), and the pore space of series pore-throat channels or parallel pore doublets is described by a structured mesh (figure 12).

Figure 11. Mesh size and element number of local microfluidic porous media with three different depths. To balance the accuracy and calculation amount of multiple flow calculations in porous media, we set the size of the unstructured mesh to vary from 0.5 to 4 μm, and the total mesh number is 5 490 000.

Figure 12. Validation of numerical simulation of corner flow under strong imbibition conditions ( $\theta = 30^\circ $). (a) The geometry is a 150 μm × 50 μm rectangle capillary tube, whose size is in the region of the pore size distribution of our microfluidic chips. (b) Theoretical analysis of the evolution of invading fluid saturation distribution versus time, which is solved by the finite difference method. (c) The dimensionless type of simulated results of invading fluid saturation and its comparison with the theoretical results. (d) The comparison of the spreading length of invading fluid between simulations and theoretical analysis (Weislogel Reference Weislogel2012).
Here, we introduce a benchmark case to validate the numerical model, focusing particularly on corner flow in rectangular channels under strong imbibition conditions. For a rectangular channel, the invading fluid saturation Sinv is defined as the fraction of the cross-section area occupied by the invading fluid. The spreading length of the corner flow  ${x_f}$ can be analytically expressed by solving the following equation (Weislogel Reference Weislogel2012):
 \begin{equation}\frac{{\partial {S^\ast }}}{{\partial t}} = \frac{{\gamma {F_i}\,\textrm{si}{\textrm{n}^2}\,\varphi S_0^{1/2}}}{{2\mu f}}\frac{{\partial ({S^{{\ast} 1/2}}\partial {S^\ast }/\partial x)}}{{\partial x}},\end{equation}
where the dimensionless invading fluid saturation at a given cross-section is  ${S^\mathrm{\ast }} = {S_{inv}}/{S_0}$, the area of the wetting fluid at the junction of the corner flow and main meniscus is
  ${S_0}$ (figure 12a). Here
  ${S_0} = {R^2}C/Wd$, where R is the hydraulic radius at the junction of the corner low and main meniscus (
 ${S_{inv}} = {S_0}$),
 \begin{equation}R = Wd/(W + d)\left( {\frac{{\textrm{cos}\,\theta - \sqrt {({\rm \pi} /4 - \theta ) + \textrm{sin}\,\theta \,\textrm{cos}\,\theta } }}{{\theta - {\rm \pi} /4 + {{\cos }^2}\theta - \textrm{sin}\,\theta \,\textrm{cos}\,\theta }}} \right),\end{equation}
the shape factor can be expressed as  $C = 4(\textrm{cos}\,\theta \,\textrm{cos}({\rm \pi} /4 + \theta )/\textrm{sin}({\rm \pi} /4) - ({\rm \pi} /4 - \theta ))$, where
  $\theta $ is the contact angle, t is the imbibition time,
  $\gamma $ is the fluid–fluid IFT, Fi as a viscous resistance coefficient can be determined numerically for complex sections, a detailed calculation of Fi is proposed by Weislogel (Reference Weislogel2012),
  $\varphi $ is the half-angle of the corner,
  $\mu $ is the invading fluid viscosity. Here
  $f = \textrm{sin}\,\varphi /(\textrm{cos}\,\theta - \textrm{sin}\,\varphi )$. The corresponding parameters used in (A1) are shown in table 1.
Table 1. The key parameters of the theoretical and simulation analysis.

The simulation model is shown in figure 12(a), and the reasonable mesh size in the simulations is determined as  $\Delta x = \Delta y = \Delta z = 1\;{\rm \mu}\mathrm{m}$. To realize the corner flow only without the main meniscus flow in this channel, the flow velocity is set as 100 μm s−1, which can maintain the main meniscus does not move compared with corner flow. The invading fluid saturation Sinv is solved from (A1) by the finite difference method, and their evolution is present in figure 12(b). The dimensionless invading fluid saturation
  ${S^\mathrm{\ast }}$ distributions were obtained from the simulation results, which fit well with the theoretical results, as shown in figure 12(c). Figure 12(d) presents the spreading length of the corner flow, where the numerical results are selected when the invading fluid saturation at the cross-section is less than 0.05 %.
The numerical simulation results are in good agreement with the theoretical solution, both the distribution of the corner fluid S* and the spreading length  ${x_f}$ in the simulated results can be predicted by the theoretical analysis, which proves the correctness of the numerical method used in this paper.
For the convergence tests, we construct four different mesh sizes for the same geometry, as shown in figure 13(a). The displacements calculated by different mesh sizes are shown in figure 13(b). However, parameters with a uniform depth (40 μm) do not satisfy snap-off criteria. As is seen, the coarsest mesh (mesh size is 4 μm) is not enough to correctly capture the occurrence of snap-off phenomena, while the other smaller meshes are sufficient. In this study, considering the balance of the efficiency and accuracy of the calculation, we employ the structured meshing method with a mesh size of 1 μm for all numerical simulations related to pore-throat channels and pore doublets in the main text.

Figure 13. Convergence tests of the displacement simulations. (a) Self-adaptive mesh at the interface is 0.5 μm and the mesh size at the other region is 1 μm, the mesh size in the whole region is 1, 2 and 4 μm. (b) The displacement results in the pore-throat channel that the simulations with mesh size = 4 μm are not enough to describe the corner flow and snap-off phenomena. The widths of the pore channel and the throat channel are 120 and 60 μm, respectively, and the depth of the pore channel and the throat channel is 40 μm. The red colour is the non-wetting phase (air) and the blue colour is the wetting phase (water).
Appendix B. Improved dynamic pore-network model
To achieve multiphase distribution and pressure field evolution, we utilize the dynamic pore network model with the two-pressure algorithm. Each pore body can be filled with two distinct phases and each phase in pore body i is assumed to have its pressure  $P_i^\beta $ (
 $\beta = w$ for the wetting phase,
  $\beta = n$ for the non-wetting phase). The local capillary pressure in pore body i defined by Thompson (Reference Thompson2002) is denoted as
  $P_i^c = P_i^n - P_i^w = f(S_i^w)$, where
  $S_i^w$ represents the wetting phase saturation and
  $P_i^n$ and
  $P_i^w$ are the local pressure for the non-wetting and wetting phases, respectively. For each fluid, a flow flux
  $Q_{ij}^\beta $ is assigned in a throat ij, where the throat ij is connected to pore i and pore j. The balance of total volumetric flux for pore i
  $\sum\nolimits_{j = 1}^{{N_i}} {(Q_{ij}^w + Q_{ij}^n)} = 0$ and the corresponding volumetric flux in pore throat ij
  $Q_{ij}^\beta ={-} K_{ij}^\beta (P_i^\beta - P_j^\beta )$ should be maintained, where
  ${N_i}$ is the coordinate number of pore i in the pore system, and
  $K_{ij}^\beta $ is the throat conductance. Therefore, the volume balance in a pore body i for each fluid can be expressed as
  ${V_i}(\Delta S_i^\beta /\Delta t) + \sum\nolimits_{j = 1}^{{N_i}} {Q_{ij}^\beta } = 0$, where
  $\Delta S_i^\beta $ is the saturation variation of fluid
  $\beta $ in pore body i at a time interval
  $\Delta t$,
  ${V_i}$ is the volume of the pore body i.
During the imbibition process, the entry capillary pressure for each pore throat is determined through the solution of nonlinear equations derived from the Mayer–Stowe–Princen theory (Mayer & Stowe Reference Mayer and Stowe1965; Princen Reference Princen1969),
 \begin{align}\left.\begin{array}{@{}c@{}}
{A_n} = ({L_{nw}} + {L_{ns}}\,\textrm{cos}\,\theta )r =
\begin{cases} A - 4{r^2}\left( {\textrm{cos}\,\theta
(\textrm{cos}\,\theta - \textrm{sin}\,\theta ) + \theta -
\dfrac{{\rm \pi} }{4}} \right)&(\theta < 45^\circ )\\
A&(\theta \ge 45^\circ ) \end{cases},\\ \displaystyle
L_{ns} = \frac{R}{{2G}} - 8b,\\[10pt] \displaystyle L_{nw}
= 8r\,\arcsin \left( {\frac{{\sqrt 2 b}}{{2r}}}
\right),\\[14pt] b =
r\,\textrm{max}(0,\textrm{cos}\,\theta -
\textrm{sin}\,\theta),
\end{array}\right\}\end{align}
\begin{align}\left.\begin{array}{@{}c@{}}
{A_n} = ({L_{nw}} + {L_{ns}}\,\textrm{cos}\,\theta )r =
\begin{cases} A - 4{r^2}\left( {\textrm{cos}\,\theta
(\textrm{cos}\,\theta - \textrm{sin}\,\theta ) + \theta -
\dfrac{{\rm \pi} }{4}} \right)&(\theta < 45^\circ )\\
A&(\theta \ge 45^\circ ) \end{cases},\\ \displaystyle
L_{ns} = \frac{R}{{2G}} - 8b,\\[10pt] \displaystyle L_{nw}
= 8r\,\arcsin \left( {\frac{{\sqrt 2 b}}{{2r}}}
\right),\\[14pt] b =
r\,\textrm{max}(0,\textrm{cos}\,\theta -
\textrm{sin}\,\theta),
\end{array}\right\}\end{align}
where G and A are the geometry factor and cross-section area of a pore-throat channel, the subscript n represents the non-wetting phase,  ${L_{nw}}$ and
  ${L_{ns}}$ indicate the length of the immiscible interface and the non-wetting-wall interface, respectively. Here b is the meniscus-apex distance,
  $\theta $ is the contact angle on the wall, r is the curvature radius of the arc-menisci interface, R is the inscribed radius.
This standard dynamic pore-network model has been validated in our previous work by comparing the microfluidic experiments and simulation results (Lei et al. Reference Lei, Gong and Wang2023a). However, based on our direct numerical simulation results and theoretical analysis on multidepth microfluidic chips, we should improve this conventional dynamic pore-network model by integrating the snap-off criterion in instances of strong imbibition and strong drainage, it is worth noting that the bypass criterion is automatically implemented in the dynamic pore-network model. In cases of snap-off during strong imbibition ( $\theta < 45^\circ $), it is essential to consider both the critical capillary number condition and the geometrical condition for the pore-throat channel to discern pore-scale flow behaviour,
 \begin{equation}\left.{\begin{array}{@{}c@{}} {P_{ij}^c \le P_c^{snap\textrm{ - }off} = \dfrac{\gamma }{{{R_{ij}}}}(\textrm{cos}\,\theta - \textrm{sin}\,\theta )\quad (\theta < \; 45^\circ ),}\\[11pt] {Ca < C{a_c}\quad (\theta < \; 45^\circ ),} \end{array}} \right\}\end{equation}
where  $\gamma $ is the interface tension of the immiscible fluid,
  $\theta $ is the contact angle and
  ${R_{ij}}$ is the inscribed radius in each pore throat. The critical capillary number
  $C{a_c}$ is used to determine the domination of the main meniscus and corner flow. When the local capillary number is below the critical value, a snap-off event will take place in the pore-throat, adhering to the geometry conditions. The pore network of whole microfluidic porous media can be composed of a pore body with void volume and a pore throat with channel resistance. To address the constraints associated with a first-order approximation for the partial differential of the local capillary pressure, we employed an automatic differentiation algorithm. This strategy facilitated the implicit solution of the saturation equation, treating the local capillary pressure as a function of fluid saturation at the current time step. In this dynamic pore-network model, the pressure equation is explicitly solved, while the hydraulic conductance remains constant throughout a small time interval.
Appendix C. Derivations of snap-off criterion
To derive the geometry condition in the pore-throat channel of microfluidic porous media, capillary pressures at pores and throats with rectangular cross-sections are proposed by (Lenormand et al. Reference Lenormand, Zarcone and Sarr1983)
 \begin{gather}{p_{c - p}} = 2\gamma (1/{W_p} + 1/{D_p})\,\textrm{cos}\,\theta ,\end{gather}
 \begin{gather}{p_{c - {t_{cir}}}} = 2\gamma (\textrm{cos}\,\theta - \textrm{sin}\,\theta )/{R_t},\end{gather}
where  ${R_t}$ is the critical hydraulic diameter at the throat. The critical capillary pressure at the throat can be described as
  ${p_{c - {t_{cir}}}} = 2\gamma \,\textrm{cos}\,\theta (1 - \textrm{tan}\,\theta )/\textrm{min}({w_t},{d_t})$.
The snap-off criterion depends on the difference between these capillary pressures (Roof Reference Roof1970; Lenormand et al. Reference Lenormand, Zarcone and Sarr1983), when the following criterion is satisfied, snap-off will occur:
 \begin{equation}\Delta {P_c} = {p_{c - p}} - {p_{c - {t_{cir}}}} = 2\gamma \,\textrm{cos}\,\theta \left[ {\left( {\frac{1}{{{W_p}}} + \frac{1}{{{D_p}}}} \right) - \frac{{1 - \textrm{tan}\,\theta }}{{\textrm{min}({w_t},{d_t})}}} \right] < 0.\end{equation}
The flow rate of a wetting fluid along the corners of a square capillary tube can be described as (Dong & Chatzis Reference Dong and Chatzis1995)
 \begin{equation}{Q_c} = aC{(2K)^{ - 1/2}}{(\gamma /\mu \beta )^{1/2}}{R^{5/2}}{t^{ - 1/2}},\end{equation}
where a is a parameter introduced by the trial function, and the parameter K is calculated by a variational method. Here  $\beta $ is the dimensionless flow resistance which is a function of contact angle
  $\theta $, μ is the viscosity of the wetting fluid,
  $\mathcal{C} = 4(\textrm{cos}\,\theta \,\textrm{cos}({\rm \pi} /4 + \theta )/\textrm{sin}({\rm \pi} /4) - ({\rm \pi} /4 - \theta ))$ is a shape factor. The relation of water saturation S at the cross-section and corresponding interfacial curvature radius R is
  $\mathcal{C}{R^2} = S$. The flow rate of the main meniscus is the total flow rate can be determined by the Darcy velocity
  $v = \gamma \,Ca/\mu $,
 \begin{equation}{Q_t} = {D_c}{W_c}v = {D_c}{W_c}\gamma \,Ca/\mu ,\end{equation}
where  ${D_c}$ is the channel depth and
  ${W_c}$ is the channel width.
Therefore, the flow volume ratio  ${V^\ast } = \int_0^t {{Q_c}\,\textrm{d}t} /\int_0^t {{Q_t}\,\textrm{d}t} $ of the corner flow and total flow during the imbibition time (t) can be expressed as
 \begin{equation}{V^\mathrm{\ast }} = V_{cir}^\mathrm{\ast }(2{R^{1/2}}/{(\gamma t/\mu )^{1/2}})(a{(2K\beta )^{ - 1/2}}/Ca),\end{equation}
where the critical flow volume ratio  $V_{cir}^\mathrm{\ast }$ of corner flow and total flow can be defined as the average velocity of the corner flow and total flow rate being equal, therefore
  $V_{cir}^\ast = \mathcal{C}{R^2}/{D_c}{W_c}$ can be determined by the cross-section ratio of corner flow and total flow. Comparing the actual flow volume ratio and the critical flow volume ratio, we find
 \begin{equation}\mathcal{R} = {V^\mathrm{\ast }}/V_{cir}^\mathrm{\ast } = 2a{(2K\beta )^{ - 1/2}}{(3\tau )^{ - 1/2}}C{a^{ - 1}},\end{equation}
where  $\tau = 10\;000$ is the dimensionless time for snap-off phenomena (Gauglitz et al. Reference Gauglitz, St. Laurent and Radkle1987). When
  $\mathcal{R} = 1$, the critical capillary number
  $C{a_c}$ is derived as
 \begin{equation}C{a_c} = 2a{(6K\beta \tau )^{ - 1/2}}.\end{equation}
It is worth noting that  $\beta $ is the dimensionless flow resistance which is a function of contact angle
  $\theta $, therefore, the critical capillary number
  $C{a_c}$ is also a function of contact angle
  $\theta $, as shown in figure 8(a).
Appendix D. Derivations of bypass criterion
According to the interfacial geometric relation in parallel pore-doublets (figure 7b), the curvature diameter in the horizontal direction of the small channel can be derived as  $- (1 - \textrm{cos}\,\theta )/2{w_s}$ and in the depth direction it can be expressed as
  $\textrm{cos}\,\theta /{d_s}$. Therefore, according to the capillary pressure in a duct channel (Lenormand et al. Reference Lenormand, Zarcone and Sarr1983), critical capillary force in parallel pore-doublets with the large channel and small channel can be described as
 \begin{gather}{P_{c - l}} = 2\gamma \,\textrm{cos}\,\theta \left( {\frac{1}{{{W_l}}} + \frac{1}{{{D_l}}}} \right),\end{gather}
 \begin{gather}{P_{c - {s_{cri}}}} = 2\gamma \left( {\textrm{cos}\,\theta \frac{1}{{{d_s}}} - \frac{{1 - \textrm{cos}\,\theta }}{{2{w_s}}}} \right),\end{gather}
where  ${W_l}$ and
  ${w_s}$ are the width of the large channel and small channel, respectively. Here
  ${D_l}$ and
  ${d_s}$ are the depth of the large channel and small channel, respectively (figure 7b). Here
  ${P_{c - l}}$ is the capillary pressure in the large channel,
  ${P_{c - {s_{cri}}}}$ is the largest capillary pressure that can be generated in the small channel, which can be determined by the solid boundary and fluid–fluid boundary.
The bypass criterion depends on the difference between these capillary pressures, when the following criterion is satisfied, the bypass will occur in the pore-throat channel:
 \begin{equation}\Delta {P_c} = {P_{c - l}} - {P_{c - {s_{cri}}}} = 2\gamma \left[ {\textrm{cos}\,\theta \left( {\frac{1}{{{W_l}}} + \frac{1}{{{D_l}}}} \right) - \left( {\textrm{cos}\,\theta \frac{1}{{{d_s}}} - \frac{{1 - \textrm{cos}\,\theta }}{{2{w_s}}}} \right)} \right] < 0.\end{equation}
 Therefore, the critical contact angle  ${\theta _c}$ for the bypass can be derived as
 \begin{equation}\textrm{cos}\,{\theta _c} = \frac{1}{{2{w_s}\left( {\dfrac{1}{{{d_s}}} - \dfrac{1}{{{W_l}}} - \dfrac{1}{{{D_l}}}} \right) + 1}}.\end{equation}


