Hostname: page-component-cd9895bd7-dk4vv Total loading time: 0 Render date: 2024-12-23T18:11:03.017Z Has data issue: false hasContentIssue false

Flow transitions and effective properties in multiphase Taylor–Couette flow

Published online by Cambridge University Press:  15 March 2024
Arthur B. Young
Affiliation:
Harvard Paulson School of Engineering and Applied Sciences, Harvard University, Cambridge, MA 02134, USA Division of Engineering and Applied Science, California Institute of Technology, Pasadena, CA 91125, USA
Abhishek Shetty
Affiliation:
Rheology Division, Advanced Technical Center, Anton Paar USA, Ashland, VA 23005, USA
Melany L. Hunt*
Affiliation:
Division of Engineering and Applied Science, California Institute of Technology, Pasadena, CA 91125, USA
*
Email address for correspondence: [email protected]

Abstract

The properties of multiphase flows are challenging to measure, and yet effective properties are fundamental to modelling and predicting flow behaviour. The current study is motivated by rheometric measurements of a gas-fluidized bed using a coaxial rheometer in which the fluidization rate and the rotational speed can be varied independently. The measured torque displays a range of rheological states: quasistatic, dense granular flow behaviour at low fluidization rates and low-to-moderate shear rates; turbulent toroidal-vortex flow at high shear rates and moderate-to-high fluidization rates; and viscous-like behaviour with rate-dependent torque at high shear rates and low fluidization or at low shear rates and high fluidization. To understand the solid-like to fluid-like transitions, additional experiments were performed in the same rheometer using single-phase liquid and liquid–solid suspensions. The fluidized bed experiments are modelled as a Bingham plastic for low fluidization rates, and as a shear-thinning Carreau liquid at high fluidization rates. The suspensions are modelled using the Krieger–Dougherty effective viscosity. The results demonstrate that, by using the effective properties, the inverse Bingham number marks the transition from solid-like to viscous-flow behaviour; a modified gap Reynolds number based on the thickness of the shear layer specifies the transition from solid-like to turbulent vortical flow; and a gap Reynolds number distinguishes viscous behaviour from turbulent vortical flow. The results further demonstrate that these different multiphase flows undergo analogous flow transitions at similar Bingham or Reynolds numbers and the corresponding dimensionless torques show comparable scaling in response to annular shear.

Type
JFM Papers
Copyright
© The Author(s), 2024. Published by Cambridge University Press

1. Introduction

Since the early studies by Couette (Reference Couette1890) and Mallock (Reference Mallock1896), concentric cylinder rheometers have been used to determine the viscosity or effective viscosity of Newtonian and non-Newtonian fluids, suspensions and multiphase flows (Larson Reference Larson1999; Coussot Reference Coussot2005). For Newtonian fluids, the dynamic viscosity, $\mu$, is determined from the ratio of the shear stress, $\tau$, and the shear rate, $\dot {\gamma }$. However, the flow Reynolds number, $Re_b$, must be below the critical value, $Re_{b,c}$, associated with the development of Taylor vortices (Taylor Reference Taylor1923). For the rotation of the inner cylinder, the gap Reynolds number is defined as

(1.1)\begin{equation} Re_b = \frac{\rho \omega_i r_i (r_o-r_i)}{\mu} = \frac{\rho \omega_i r_i b}{\mu}, \end{equation}

where $\rho$ is the fluid density, $r_i$ and $\omega _i$ denote the radius and angular velocity of a rotating inner cylinder and the characteristic length, $b$, is the gap width between the inner cylinder and the stationary outer wall. In rheological measurements of suspensions, the Reynolds number based on the particle diameter, $D$, is given as $Re_D = \rho \dot {\gamma } D^2/ \mu$, and is typically several orders smaller than the corresponding gap Reynolds number. Like Newtonian fluids, the apparent viscosity of non-Brownian neutrally buoyant suspensions, $\mu _{app}$, can be determined from the ratio of the measured shear stress to the Newtonian shear rate (Acrivos, Mauri & Fan Reference Acrivos, Mauri and Fan1993). Studies have successfully modelled the apparent viscosity of such suspensions as a function of the volumetric solid fraction, $0 \leq \phi < \phi _m$, and the maximum random packing factor, $0 < \phi _m < 1$ (Krieger & Dougherty Reference Krieger and Dougherty1959; Krieger Reference Krieger1972).

Rheometers are also used to study sheared granular materials and powders (Nedderman Reference Nedderman1992; Larson Reference Larson1999). The Savage number and the inertia number establish regimes in sheared granular flows with a confining normal stress. The Savage number is the ratio of particle inertia to the normal consolidating stress and is defined as $Sa = \rho _b D^2 \dot {\gamma } ^2 / \sigma$, where $\rho _b = \rho _s \phi + \rho _f (1 - \phi )$ denotes the bulk density of the mixture, $\rho _s$ is the density of the solid phase and $\sigma$ is the consolidating stress (Lu, Brodsky & Kavehpour Reference Lu, Brodsky and Kavehpour2007). The inertial number, $I$, is defined similarly with $I = D \dot {\gamma } / ( P/ \rho _b ) ^{1/2}$, using $P$ as an imposed normal pressure (Forterre & Pouliquen Reference Forterre and Pouliquen2008). When subjected to weak shearing, particles remain in physical contact with their neighbours, and stresses are transmitted through frictional stress chains that span the bed. The stress measurements are quasistatic and independent of the shear rate for $Sa < 1 \times 10^{-6}$. Without a confining stress, particles may lose contact with their neighbours and become entrained within the flow. In the intermediate values of $1 \times 10^{-6} < Sa < 1$, the stresses depend on a non-trivial combination of both frictional and collisional interactions (Lu et al. Reference Lu, Brodsky and Kavehpour2007; Gutam, Mehandia & Nott Reference Gutam, Mehandia and Nott2013).

For viscous flows beyond a critical Reynolds numbers, $Re_{c}$, axisymmetric and three-dimensional Taylor-vortex structures arise in pure fluids due to centrifugal instabilities (Taylor Reference Taylor1923). Hence, a key consideration in using concentric cylinder rheometers is to determine $Re_c$, which varies with the rheometer geometry, to ensure a linear relation between the shear stress and the shear rate. For suspensions, unconfined granular flows and fluidized beds, it is important to establish similar flow criteria, especially when making rheological measurements. Toroidal vortices have been observed in gaseous fluidized beds (Conway, Shinbrot & Glasser Reference Conway, Shinbrot and Glasser2004), unfluidized granular media (Krishnaraj & Nott Reference Krishnaraj and Nott2016) and neutrally buoyant particle suspensions (Linares-Guerrero, Hunt & Zenit Reference Linares-Guerrero, Hunt and Zenit2017; Majji, Banerjee & Morris Reference Majji, Banerjee and Morris2018; Ramesh, Bharadwaj & Alam Reference Ramesh, Bharadwaj and Alam2019; Dash, Anantharaman & Poelma Reference Dash, Anantharaman and Poelma2020; Alam & Ghosh Reference Alam and Ghosh2022; Singh, Ghosh & Alam Reference Singh, Ghosh and Alam2022). Despite their similar appearance, these vortical flows differ in their structure as well as in their inciting mechanisms. Few prior studies, however, have compared the rheological nature of these phenomena across various multiphase flows.

The current research focuses on torque measurements collected on Newtonian liquids, particle suspensions, and gas-fluidized powders sheared in a unique concentric cylinder rheometer accommodating all three sample types. The rheometer has a low aspect ratio, $\zeta = L/(r_o - r_i) = 2.8$, where $L$ denotes the length of the rotating and measuring inner cylinder, and therefore end effects impact the measurements. Using this rheometer, benchmark measurements of the torque, $T_z$, using Newtonian liquids were performed over a range of gap Reynolds numbers spanning four orders of magnitude. Additional experiments on particle suspensions provide insight into the effect of particle density on the torque measurements and the critical shearing velocity associated with the onset of linear instability.

The suspension experiments provide context for the regime transitions and flow states observed in the sheared gas-fluidized beds. The fluidized bed experiments were taken over a range of fluidization rates, $q$, where $q$ is defined as the ratio of the upward fluidization velocity to that for incipient fluidization, as well as using two sizes of glass beads, $D=49$ and 113 $\mathrm {\mu }$m, which exhibit different fluidization behaviour. As the fluidization and shear rates are increased for both sizes of particles, the flows transition from quasistatic, rate-independent solid-like behaviour to fully turbulent fluid-like toroidal vortical behaviour at high shear rates and moderate-to-high fluidization velocities. Hence, the experiments using fluidized glass beads span from granular flow behaviour to turbulent vortex flow. A goal of this research is to measure the dependence of the torque on $\omega _i$ and $q$ and determine the critical dimensionless parameters using the effective properties. The current work uses both the Bingham plastic and Carreau fluid models to define and compute effective properties, which are used to compare the results of all experiments on common dimensionless axes.

This work describes a process for the definition of effective properties and dimensionless parameters that illustrates transitions in rheological behaviour found throughout many geophysical and industrially relevant flows. Recent rheological measurements of soils in areas that experience debris flows show a transition from rate-independent behaviour to fluid-like behaviour (Kostynick et al. Reference Kostynick, Matinpour, Pradeep, Haber, Sauret, Meiburg, Dunne, Arratia and Jerolmack2022), similar to that found in the current experiments. The current results are also relevant to the rheological modelling of flows that combine fluidization and shear, such as in the feeding of additive manufacturing powders (Iams et al. Reference Iams, Gao, Shetty and Palmer2022), in flow enhancement of sand for mould and coremaking processes (Bakhtiyarov, Overfelt & Siginerm Reference Bakhtiyarov, Overfelt and Siginerm2002), handling of fine cohesive powders (Mishra et al. Reference Mishra, Liu, Shetty and Hrenya2020Reference Mishra, Molnar, Hwang, Shetty and Hrenya2022), aeration effects in vibratory powder conveyer (Hartig et al. Reference Hartig, Shetty, Conklin and Weimer2022) and in clinical grade manufacturing of 3D printed devices in personalized medicine (Ramaraju et al. Reference Ramaraju, Landry, Sashidharan, Shetty, Crotts, Maher, Goudy and Hollister2022).

2. Prior studies

Measurements of the apparent viscosity using a concentric cylinder rheometer can be affected by the dimensions of annular geometry as well as the fluid dynamic transitions that occur as the shear rate is increased. This section reviews prior studies that have investigated flow transitions, especially for wide gaps and for short columns, as found in the current experiments. Additional background is provided on inertial suspensions and fluidized beds in annular rheometers.

2.1. Taylor–Couette flows for a Newtonian fluid

For an idealized annular flow, the torque is constant and independent of radial position, $r$. The momentum balance for the circumferential direction, $\theta$, is given by

(2.1)\begin{equation} \frac{1}{r^2} \frac{{\rm d}}{{\rm d} r} [ r^2 \tau_{r \theta} (r) ] = 0, \end{equation}

where $\tau _{r \theta } (r)$ is the shear stress at $r$ in the $\theta$ direction acting on the surface with normal in the $r$ direction. By integrating (2.1) and evaluating at either the inner radius, $r_i$, or outer radius, $r_o$, the product of the shear stress and the square of the radial position is constant across the annulus

(2.2)\begin{equation} \left.\begin{array}{c} r^2 \tau_{r \theta} = r_i^2 \tau_{i} = r_o^2 \tau_{o}, \\ \implies T_z = 2 {\rm \pi}L r^2 \tau_{r \theta} = 2 {\rm \pi}L r_i^2 \tau_{i} = 2 {\rm \pi}L r_o^2 \tau_{o}, \end{array}\right\} \end{equation}

denoting $\tau _{i}$, $\tau _{o}$ as the wall stress at the inner and outer cylinder, and $T_z$ as the torque about the axis, $z$, of the concentric cylinders. For a Newtonian fluid at low shear rates, the steady, laminar flow between concentric cylinders with inner cylinder rotation is unidirectional with azimuthal velocity, $u_{\theta } (r)$, dependent on the radial coordinate (Couette Reference Couette1890). The shear stress is evaluated as

(2.3)\begin{equation} \tau_{r \theta} (r) = \mu \left| r \frac{{\rm d}}{{\rm d} r} \left( \frac{u_{\theta}(r)}{r} \right) \right| = \mu | \dot{\gamma}_N(r) |, \end{equation}

where $\dot {\gamma }_N(r)$ is the Newtonian shear rate. Neglecting end effects and applying no-slip conditions at the inner and outer walls, $u_{\theta }(r_i) = {r_i} \omega _i$ and $u_{\theta }(r_o)=0$, the velocity distribution for a Newtonian fluid in circular Couette flow is

(2.4)\begin{equation} u_{\theta} (r) = \frac{\omega_i r_i r_o }{r_o^2 - r_i^2} \left( \frac{r_i r_o}{r} - \frac{r_i r}{r_o} \right), \end{equation}

and the shear rate follows as

(2.5)\begin{equation} \dot{\gamma}_N(r) = r \frac{d }{d r} \left( \frac{u_{\theta}(r)}{r} \right) ={-} 2 \left( \frac{\omega_i r_i^2 r_o^2}{r_o^2 - r_i^2} \right) \frac{1}{r^2} \leq 0 , \end{equation}

where ${u_{\theta } (r)}/{r}$ is the angular velocity of the fluid at a position $r$; $\omega _i$ is the angular speed of the inner cylinder. The torque for a Newtonian fluid in circular Couette flow, $T_{N}$, is therefore

(2.6) \begin{equation} T_{N} = 4 {\rm \pi}{r_i^2} {r_o^2} L \mu \omega_i /({r_o^2}-{r_i^2}). \end{equation}

At a critical rotational speed, the flow field departs from the solution given by (2.4) and develops steady, counter-rotating axisymmetric vortices that span the length of the annulus. Taylor (Reference Taylor1923) predicted the onset of the vortices at a critical value of the inner cylinder rotational speed by assuming that the flow can be idealized as being sheared between infinitely long concentric cylinders, $L \rightarrow \infty$, with a narrow gap such that the radius radio, $\eta = r_i /r_o$, approaches $\eta \rightarrow 1$.

Since Taylor's (Reference Taylor1923) work, studies have examined different geometries with either the inner cylinder rotating, the outer rotating or both (Chandrasekhar Reference Chandrasekhar1960; Coles Reference Coles1965; Snyder Reference Snyder1969; Lewis & Swinney Reference Lewis and Swinney1999; Racina & Kind Reference Racina and Kind2006; Ravelet, Delfos & Westerweel Reference Ravelet, Delfos and Westerweel2010). The work by Dubrulle et al. (Reference Dubrulle, Dauchot, Daviaud, Longaretti, Richard and Zahn2005) introduced a parameterization that aids the general stability analysis of Newtonian Taylor–Couette flows with differing rotation scenarios. Using this approach, the typical shear rate for Newtonian fluid flow is defined as

(2.7)\begin{equation} \tilde{S} = \dot{\gamma}_N(\tilde{r}) = \frac{2 \omega_i r_i r_o}{r_o^2 - r_i^2} = \eta \dot{\gamma}_N(r_i), \end{equation}

where the typical radius $\tilde {r} = \sqrt {r_i r_o}$ is the geometric average of the system's radial dimensions. Dubrulle et al. (Reference Dubrulle, Dauchot, Daviaud, Longaretti, Richard and Zahn2005) defined a shear Reynolds number as

(2.8)\begin{equation} Re_s = \frac{\rho U (r_o - r_i)}{\mu}, \end{equation}

which uses a characteristic velocity that is defined using $\tilde {S}$ as $U = \tilde {S} \times (r_o-r_i)$, and is related to the gap Reynolds number by $Re_s = [ 2r_o/(r_i + r_o) ] Re_b$ for systems with a rotating inner cylinder and stationary outer cylinder.

More recent evidence suggests that the values of $Re_s$ associated with the transition to Taylor vortices, as well as supercritical flow transitions at even higher shear rates, are related to the annular geometry and the axial boundaries of the flow volume. The early study by Cole (Reference Cole1976) concludes that for aspect ratios $6 < \zeta < 60$ and radius ratios $0.89 < \eta < 0.95$, the annulus length has negligible impact on the critical speed for the development of Taylor vortices. However, close inspection of Cole's (Reference Cole1976) results for the visual onset of vortical flow shows a gradual decrease in the critical speed as $\zeta \rightarrow 6$. The stability analysis by Esser & Grossman (Reference Esser and Grossman1996) provides an analytical expression for critical Reynolds numbers as a function of $\eta$, which compares well with experiments found in the literature (Taylor Reference Taylor1923; Donnelly & Fultz Reference Donnelly and Fultz1960; Coles Reference Coles1965; Snyder Reference Snyder1968a).

For a wide gap, such as that in the experiments by Donnelly & Fultz (Reference Donnelly and Fultz1960) with $\eta = 0.5$, the critical Reynolds number is lower than found for systems of $\eta \rightarrow 1$ or $\eta \rightarrow 0$ (Snyder Reference Snyder1968b; Cole Reference Cole1976; Deng et al. Reference Deng, Arifin, Mak and Wang2009). Numerical and experimental studies by Czarny et al. (Reference Czarny, Serre, Bontoux and Lueptow2003) and Deng et al. (Reference Deng, Arifin, Mak and Wang2009) conducted using short-aspect-ratio annular cells investigate the influence of end effects on the flow field. The simulation results by Czarny et al. (Reference Czarny, Serre, Bontoux and Lueptow2003) showed that Ekman vortices, which emerge due to radial flow within the boundary layer at the axial constraints and not due to centrifugal instability, can develop and impact the bulk flow within a concentric cylinder system of $\zeta = 6$ and $\eta = 0.75$ at Reynolds numbers below those associated with Taylor vortices. The experimental and numerical work by Deng et al. (Reference Deng, Arifin, Mak and Wang2009) investigated an annular geometry of $2.6 < \zeta < 5.2, \eta = 0.61$ and reported a critical Reynolds number of $Re_{s,c} \approx 77$ for the development of Taylor vortices, which is lower than the value of $91.9$ predicted by Esser & Grossman (Reference Esser and Grossman1996) for $\eta = 0.61$. Deng et al. (Reference Deng, Arifin, Mak and Wang2009) found using Particle Image Velocimetry (PIV) that Taylor vortices underwent super-critical transition to wavy vortices at Reynolds numbers much higher than that according to the $L \rightarrow \infty$ assumption, and speculated that the formation of Ekman vortices in their short-aspect-ratio system may have influenced the developing flow field.

Table 1 presents reported values from the literature of critical Reynolds numbers alongside associated values of $\zeta$ and $\eta$. The selected results include those by Lewis & Swinney (Reference Lewis and Swinney1999), Racina & Kind (Reference Racina and Kind2006) and Ravelet et al. (Reference Ravelet, Delfos and Westerweel2010); torque measurements from these studies are used in later comparisons. As found in table 1, the boundary conditions at the end of the annulus, either stationary, rotating or free surface, also impact the flow transitions (Czarny et al. Reference Czarny, Serre, Bontoux and Lueptow2003). The table also includes the data for the rheometer used in the current experiments along with the values of $Re_{s,c}$ and $Re_{b,c}$; these measurements are described in detail in § 4.

Table 1. Critical shear Reynolds numbers ($Re_{s,c}$) and gap Reynolds numbers ($Re_{b,c}$) from investigations into Taylor–Couette flow for systems with a rotating inner cylinder and stationary outer cylinder. The aspect ratio, $\zeta = L/(r_o-r_i)$, and the radius ratio, $\eta = r_i/r_o$, shift the critical Reynolds numbers in Taylor–Couette flow (Chandrasekhar Reference Chandrasekhar1960; Donnelly & Fultz Reference Donnelly and Fultz1960; Deng et al. Reference Deng, Arifin, Mak and Wang2010). The axial boundary conditions (BC) are known to have distinct effects on the development of Ekman vortices in short annular columns (Czarny et al. Reference Czarny, Serre, Bontoux and Lueptow2003) as indicated in the table using free surface (FS) and stationary surface (SS). Also included are the results of experiments on neutrally buoyant particles by Ramesh et al. (Reference Ramesh, Bharadwaj and Alam2019) and this study.

2.2. Neutrally buoyant suspensions and the Krieger–Dougherty effective viscosity model

Particle suspension rheology was studied by Einstein (Reference Einstein1926) in the context of Brownian motion. At the dilute limit, where the solid-particle volumetric fraction, $\phi$, approaches $0$, Einstein (Reference Einstein1926) analytically characterized the relative viscosity, $\mu _r$, around an isolated sphere suspended in fluid to be given by

(2.9)\begin{equation} \mu_r = \frac{\mu_{eff}}{\mu_f} = 1 + [\mu] \phi, \end{equation}

where $\mu _{eff}$ is the effective viscosity, $\mu _f$ is the dynamic viscosity of the suspending fluid and $[\mu ]$ is the intrinsic viscosity, which is a property of the particle shape with $[\mu ] = 2.5$ for spheres (Einstein Reference Einstein1906).

Following Einstein's (Reference Einstein1926) study at the dilute limit, many studies have been conducted over broader flow conditions to measure and model the effective viscosity. Krieger & Dougherty (Reference Krieger and Dougherty1959) developed an analytical prediction of the relative viscosity of suspended spherical particles based on two parameters: the volumetric solid fraction, $\phi$, and the maximum random packing fraction, $\phi _m$. Their model accounts for the interaction between adjacent particles in a ‘crowded’ state and incorporates Brownian motion. The Krieger–Dougherty relative viscosity is given as

(2.10)\begin{equation} \frac{\mu_{eff}}{\mu_f} = \left( 1 - \frac{\phi}{\phi_m} \right)^{-[\mu] \phi_m}, \end{equation}

where $[\mu ]$ is Einstein's intrinsic viscosity. Krieger (Reference Krieger1972) substituted the quantity $[\mu ] \phi _m$ with $1.82$ to obtain an optimal fit with experimental data, yielding the form of the Krieger–Dougherty (KD) model widely used today

(2.11)\begin{equation} \frac{\mu_{eff}}{\mu_f} = \left( 1 - \frac{\phi}{\phi_m} \right)^{{-}1.82}. \end{equation}

The KD effective viscosity model, sometimes with minor modifications, has been applied in a variety of flow scenarios (Phillips et al. Reference Phillips, Armstrong, Brown, Graham and Abbott1992; Matas, Morris & Guazzelli Reference Matas, Morris and Guazzelli2003; Mueller, Llewellin & Mader Reference Mueller, Llewellin and Mader2010; Mahbubul, Saidur & Amalina Reference Mahbubul, Saidur and Amalina2012; Mendoza Reference Mendoza2017; Baroudi, Majji & Morris Reference Baroudi, Majji and Morris2020; Singh et al. Reference Singh, Ghosh and Alam2022). Using an annular rheometer with a stationary inner cylinder and rotating outer cylinder, Hunt et al. (Reference Hunt, Zenit, Campbell and Brennen2002) used a variation of (2.10) to explain prior experiments by Bagnold (Reference Bagnold1954). By accounting for the contribution of the vortices formed by the end walls and using the KD model, the torque measurements reported by Bagnold (Reference Bagnold1954) were accurately predicted, suggesting that the increase in torque with shear rate was not a result of particle–particle collisions, as posited by Bagnold (Reference Bagnold1954), but rather from the transition to toroidal flow. Using the KD viscosity for their experimental measurements, Linares-Guerrero et al. (Reference Linares-Guerrero, Hunt and Zenit2017) showed that neutrally buoyant suspensions transition to turbulent flow at Reynolds numbers slightly below that of Newtonian fluids in equivalent shear scenarios, which they attribute to velocity fluctuations resulting from particle motions that enhance the bulk-flow momentum transport.

Recent investigations by Majji et al. (Reference Majji, Banerjee and Morris2018) and Ramesh et al. (Reference Ramesh, Bharadwaj and Alam2019) and the review by Baroudi et al. (Reference Baroudi, Majji, Peluso and Morris2023) provide detailed insight into the characteristics of Taylor–Couette flow for neutrally buoyant suspensions. In a concentric cylinder cell of $5.5 \leq \zeta \leq 11$ and $0.84 \leq \eta \leq 0.914$, Ramesh et al. (Reference Ramesh, Bharadwaj and Alam2019) collected simultaneous measurements of torque and PIV observations, and discovered a variety of flow regimes developing in response to several variables, including $\zeta$, $\eta$, solid fraction (which varied in the range $0.1 < \phi < 0.25$) and rotational acceleration (increasing from rest or decreasing from maximum speed). Their findings agree with and expand upon the research of Majji et al. (Reference Majji, Banerjee and Morris2018). Experiments by Ramesh et al. (Reference Ramesh, Bharadwaj and Alam2019) are included in table 1 and the results are compared with this study. More recent works by Dash et al. (Reference Dash, Anantharaman and Poelma2020), Singh et al. (Reference Singh, Ghosh and Alam2022) and Alam & Ghosh (Reference Alam and Ghosh2022) document the flow bifurcation sequence that leads to turbulence and the variations in the corresponding torque for inner-rotating and counter-rotating rheometers.

2.3. Suspensions with particles of unmatched density and gas-fluidized beds

For multiphase flows in which the densities are not matched between the phases, there have been a range of approaches using modifications to the KD model or using a non-Newtonian model to define the effective viscosity. Investigations by Leighton & Acrivos (Reference Leighton and Acrivos1986) on liquid–solid mixtures with particles that are denser than the surrounding fluid have treated the relative viscosity as a function of the local volumetric solid fraction, which is in turn related to shear-induced particulate migration effects (Leighton & Acrivos Reference Leighton and Acrivos1986Reference Leighton and Acrivos1987; Acrivos et al. Reference Acrivos, Mauri and Fan1993; Acrivos, Fan & Mauri Reference Acrivos, Fan and Mauri1994). In the case of liquid-fluidized beds, the apparent viscosity is modelled using expressions similar to the KD model based on the solid fraction (Gibilaro et al. Reference Gibilaro, Gallucci, Felice and Pagliani2007). For gas-fluidized beds, a simple solid-fraction-based effective viscosity model is insufficient to capture the complex flow conditions. Prior studies have found a range of apparent viscosities that depend on particulate size, density and shape at different fluidization rates (Davidson, Cliff & Harrison Reference Davidson, Cliff and Harrison1985; Rees et al. Reference Rees, Davidson, Dennis and Hayhurst2005). Modelling the stresses in a gaseous fluidized bed has involved various approaches, including dense gas kinetic theory, in which the shear viscosity depends on the square root of the granular temperature, the particle density and the particle diameter (Gu, Chialvo & Sundaresan Reference Gu, Chialvo and Sundaresan2014).

Concentric cylinder rheometers have been previously used to determine an effective viscosity in gas-fluidized beds. Anjaneyulu & Khakhar (Reference Anjaneyulu and Khakhar1995) performed measurements on particle beds sheared at fluidization rates using a short-aspect-ratio annular cell of $\zeta = 3.02$ and $3.72$. They modelled the gas-fluidized bed as a Bingham plastic, and presented fitted results of the yield stress, $\tau _y$, and plastic viscosity, $\mu _p$, at fluidization velocities within $\pm 20\,\%$ of the incipient fluidization velocity. Their results suggest that $\tau _y$ and $\mu _p$ were independent of particle size and shear rate, but varied with the upward fluidization velocity, $u_{z}$, at and below $u_{inc}$. Using tracer particles, they observed a plug region near the stationary outer wall that is consistent with the assumptions of the Bingham model.

The gas-fluidized bed work by Conway et al. (Reference Conway, Shinbrot and Glasser2004) found Taylor-vortex-like structures in an apparatus of aspect ratio $\zeta = 4.46$ and radius ratio $\eta = 0.70$. The primary flow bifurcation resembled that of Taylor vortices, but at higher shear rates, secondary vortices spawned from the primary bifurcations in a manner previously unobserved in either Newtonian or granular flows. Through further experimentation, Conway et al. (Reference Conway, Shinbrot and Glasser2004) concluded that centrifugal instability incites the observed vortical flow state. Unlike experiments in liquids, in which the torque increases due to flow transitions, their torque measurements are mostly independent of rotational speed, but markedly decreased with increasing fluidization rate. Their experiments used a binary mixture of glass beads, $D = 140$ and $460\ {\mathrm {\mu }}$m, and the authors observed a segregation between the particle types. The fluidization rates presented in their study are estimated to be below $u_{inc}$. Similar experiments were conducted by Colafigli et al. (Reference Colafigli, Massei, Lettieri and Gibilaro2009) using a longer apparatus with aspect ratio $\zeta = 17.6$ and radius ratio $\eta = 0.75$ for a small range of rotational speeds. Their experiments used silica powder of $D = 26~\mathrm {\mu }$m, and examined different solid fractions by varying the fluidization rate. Similar to Conway et al.'s (Reference Conway, Shinbrot and Glasser2004) results, the torque measurements were nearly independent of rotational speed; from the torque, both studies computed the apparent viscosity, which showed decreasing values with increasing speed.

In unfluidized granular material subjected to annular shear, Krishnaraj & Nott (Reference Krishnaraj and Nott2016) observed through experiments and discrete element simulations a single vortical structure. Unlike the findings of Conway et al. (Reference Conway, Shinbrot and Glasser2004), Krishnaraj & Nott (Reference Krishnaraj and Nott2016) determined that their observed vortex did not develop due to centrifugal instability, but instead due to a combination of shear-induced particulate dilation and gravitational forces. Their experiments used a concentric cylinder geometry of $\zeta = 16.7, \eta = 0.8$, while their simulations varied the column height so that $1.9 \leq \zeta \leq 5.6$ for fixed radius ratio $\eta = 0.70$. In all configurations, the vortex manifested as a singular torus with downward flow along the inner cylinder spanning the full annular gap when sheared at a fixed rotational speed equivalent to $Sa = 3.3 \times 10^{-6}$. Similar experiments by Gutam et al. (Reference Gutam, Mehandia and Nott2013) showed a change in the direction of the vertical shear stress with shearing of the inner cylinder as compared with the local stress measurements for an unsheared granular material.

3. Rheometer and overview of experiments

The concentric cylinder rheometer (Anton Paar MCR-302) is equipped with a powder cell accessory for measurements on gas-fluidized beds (Mishra et al. Reference Mishra, Liu, Shetty and Hrenya2020; Iams et al. Reference Iams, Gao, Shetty and Palmer2022) and is detailed in figure 1. The design has a wide gap and a low aspect ratio ($\zeta =2.79$; $\eta =0.48$). The rheometer measures resistance torque using a ‘smooth-wall’ inner cylinder suitable for pure fluid experiments, and a ‘rough-wall’ profiled cylinder for experiments on granular materials to reduce particle–wall slippage (Koos et al. Reference Koos, Linares-Guerrero, Hunt and Brennen2012). These two inner cylinders have equivalent effective radii. Following calibration, the resistance torque measured on the inner cylinder varies in the range $1 \times 10^{-8} \leq T_z \leq 2 \times 10^{-1}\ \textrm {N}\textrm {m}$ with rotational speeds in the range $1 \times 10^{-3} \leq \dot {n} \leq 1.2 \times 10^{3}$ rpm. To perform the liquid and suspension experiments, the powder cell was outfitted with two aluminium disks to replace the powder frit that forms the floor of the annulus and the diffuser that interfaces with a detachable volumetric flow controller, which can be swapped for other controllers with alternative flow-rate specifications. The flow controller used in this work delivers fluidizing air at volumetric flow rates in the range $5 \times 10^{-2} \leq Q \leq 5$ l min$^{-1}$.

Figure 1. Schematic of the Anton Paar MCR-302 rheometer with two different concentric cylinder experimental configurations. The powder cell configuration is equipped with a ‘smooth cylinder’ ($sc$) measuring tool and a ‘profile cylinder’ (‘pc’, or ‘rough’) measuring tool.

Table 2 lists the specifications for the samples studied in this work. As found in the table, the experiments include gas-fluidized beds for two different sizes of particles (FB1 and FB2), pure liquids (PL), neutrally buoyant particles (NB), negatively buoyant particles (UB) and positively buoyant particles (XB). The FB1 and FB2 experiments used monodispersed glass particles with equivalent density $\rho _s = 2500~\textrm {kg}~\textrm {m}^{-3}$ and particle diameters of $D = 113$ and $49\ \mathrm {\mu }$m, respectively. Prior to measuring periods for the FB experiments, the air flow controller was cycled on and off so that the particles were initially uniformly settled. For the pure fluid and suspension experiments, table 2 provides the fluid and solid properties, as well as the bulk density of the glycerine–water–particulate mixtures, and the KD effective viscosity based on the solid fraction and $\phi _m =0.61$. Polystyrene particles of mean diameter $D = 900\ \mathrm {\mu }$m and density $\rho _{p}=1040$ kg m$^{-3}$ were used to create the liquid–solid mixtures. The samples were prepared gravimetrically using measured densities, and all experimentation and sample preparation was conducted at the laboratory temperature of $21\,^\circ$C.

Table 2. Properties of liquids and solids for the gas-fluidized beds (FB), pure liquids (PL) inner cylinders of differing surface roughness (SR), neutrally buoyant particles (NB), negatively buoyant particles (UB) and positively buoyant particles (XB). The table lists the volumetric solid fraction ($\phi$), the particle diameter ($D$), the fluid density ($\rho _f$), the solid-particle density ($\rho _s$), the bulk density ($\rho _b$), the fluid dynamic viscosity ($\mu _f$) and the KD effective viscosity ($\mu _{eff}$) for each experiment using $\phi _m=0.61$.

A typical set of measurements is collected by computing the sample mean and standard deviation of steady-state values of resistance torque over several rotations at the set speed, $\omega _i$, which is held fixed after acceleration of the cylinder from rest. The FB2 measurements are averaged values recorded from ‘up’ and ‘down’ velocity sweeps of the inner cylinder between rest and the maximum rotational speed $\dot {n} = 1200$ rpm.

In the experiments the Reynolds number, $Re_b$, spans from subcritical to supercritical for the fluidized bed and suspension experiments. In these experiments, the particle Reynolds numbers, $Re_D$, are less than $1$ for FB experiments and less than $120$ in the case of the particle suspensions. The maximum Stokes numbers, $St = \rho _p \dot {\gamma }_N D^2/9 \mu$, are comparable between the suspension experiments ($St < 15$) and those of the FB1 ($St < 30$) and FB2 ($St < 6$) fluidized bed experiments. However, a key experimental difference is the particle-to-fluid density ratio, $\rho _p / \rho _f$, which is at most 1.03 in the suspension experiments and approximately 2000 in the fluidized bed experiments. Under these conditions, particle–particle collisions in the suspensions are not expected to be significantly contribute to momentum transport (Joseph et al. Reference Joseph, Zenit, Hunt and Rosenwilkel2001; Linares-Guerrero et al. Reference Linares-Guerrero, Hunt and Zenit2017), but collisional interactions contribute to the fluidization process.

4. Results

In this section, measurements of the resistance torque from the annular shear experiments are presented in dimensional form. The results given in § 4.1 pertain to the supporting experiments on Newtonian liquids and particle suspensions, while those of the FB1 and FB2 gas-fluidized particle beds are found in § 4.2. The smooth-wall inner cylinder was used in the PL1 Newtonian liquid experiment, while all other experiments used the rough-wall profiled cylinder.

4.1. Experiments on Newtonian liquids and particle suspensions

To establish the basic fluid-dynamical behaviour associated with this study's low-aspect-ratio concentric cylinder system, shear-rate sweep experiments using pure Newtonian liquids (PL) were performed in the modified MCR-302 powder cell. In addition, comparable measurements using neutrally buoyant suspensions (NB) and liquid–solid mixtures with either positively (XB) or negatively (UB) buoyant particles were taken to study the effect of particles on the transition. By varying the density of the suspending liquid and the solid fraction, the impact of the mixture's normal consolidating stresses as well as the rate of particle–particle/particle–fluid interaction are compared with analogous phenomena appearing in the gas-fluidized particle bed experiments.

Figure 2(a) shows $T_z$ against $\omega _i$ for aqueous–glycerine mixtures PL1 and PL2. Below $\omega _i = 2$ rad s$^{-1}$ for PL1 and $\omega _i = 0.5$ rad s$^{-1}$ for PL2, the measured torque varies directly with the rotational speed. Beyond these critical speeds, $T_z$ shows a higher-order dependence on $\omega _i$ for both PL experiments, indicating the development of Taylor vortices in the annular column (Lewis & Swinney Reference Lewis and Swinney1999; Racina & Kind Reference Racina and Kind2006). In this supercritical flow state, the measured torque of the smooth-wall PL1 experiment varies with $\omega _i$ at an approximate order of $\alpha = 1.5$ (Ravelet et al. Reference Ravelet, Delfos and Westerweel2010), whereas the torques associated with the rough-walled PL2 experiment follow an order $\alpha = 1.7$ relationship (van den Berg et al. Reference van den Berg, Doering, Lohse and Lathrop2003).

Figure 2. Measured torque against rotational speed for Newtonian liquids (PL, a), neutrally buoyant particle suspensions (NB, b), negatively buoyant particle suspensions (UB, c) and positively buoyant particle suspensions (XB, d).

The results for the NB1 ($\phi = 0.2$), NB2 ($\phi = 0.3$) and NB3 ($\phi = 0.4$) suspension experiments, depicted in figure 2(b), also have an $\alpha = 1.7$ torque dependence in the supercritical flow state (Linares-Guerrero et al. Reference Linares-Guerrero, Hunt and Zenit2017), but show an initially weaker dependence on rotational speed prior to transition. Because of slight differences between the polystyrene particle density and that of the suspending aqueous–glycerine mixtures, the particles were not homogeneously distributed within the annulus at the lowest rates of shear. This experimental challenge has been noted in prior studies (Acrivos et al. Reference Acrivos, Fan and Mauri1994), and in the case of NB1, the density of the suspending fluid exceeded that of the particles by less than $1\,\%$, as recorded in table 2, which was sufficient to create a packed layer of particles at the free surface of the sample volume. As a result, the measured torque in the slowly sheared NB1 experiment includes a contribution from frictional interactions between packed particles within the shear region. The subsequent NB2 and NB3 experiments were conducted with a short period of premixing prior to each measuring period so that the particles were more uniformly distributed throughout the sample. This routine proved particularly important for accurate measurements at low rotational speeds, where measuring periods could take over an hour to achieve several full rotations. At low shear rates, the NB1 torque values vary with $\omega _i$ at an order of $\alpha < 1$ before abruptly transitioning to an $\alpha \approx 1.7$ relationship at $\omega _i = 4.2$ rad s$^{-1}$. In contrast, the low–shear rate torques for the NB2 and NB3 experiments vary linearly with the rotational speed until $\omega _i = 1.2$ and $3.1$ rad s$^{-1}$, respectively, beyond which both experiments follow the same $\alpha \approx 1.7$ relationship seen in the NB1 results.

Noting the effects of the densely packed particles on the NB1 torque measurements, additional experiments were performed using liquid–solid mixtures with deliberately mismatched densities between phases. Figures 2(c) and 2(d) show $T_z$ against $\omega _i$ for negatively buoyant suspensions (UB1 and UB2) and positively buoyant suspensions (XB1 and XB2), respectively. The bulk solid fractions used for these two types of samples were chosen to ensure that the full length of the inner cylinder remained in contact with particles in their respective packed states. Both the positively and negatively buoyant suspensions transition to vortical-flow around $\omega _i \approx 20$ rad s$^{-1}$ with $\alpha \approx 1.7$, similar to that found for the PL2 and NB experiments. In the subcritical flow state, the UB and XB torque measurements are largely independent of the rotational speed and dependent on frictional interaction between the particles and the wall. At speeds between 10 and 20 rad s$^{-1}$, the torque measurements show slight shear weakening ($\alpha < 0$) in which particles begin to expand from a packed state.

4.2. Experiments on sheared gas-fluidized particles

Following the supporting experiments found in § 4.1, this section presents results for experiments for the 113 $\mathrm {\mu }$m FB1 (Geldart group B) and 49 $\mathrm {\mu }$m FB2 (Geldart group A) gas-fluidized particles. For FB1 and FB2, preliminary experiments were performed of the pressure drop across the bed vs air flow rate, $Q$, at $\omega _i = 0$ and $10.5$ rad s$^{-1}$. The incipient fluidization rate for $\omega _i = 0$ is $Q_{inc} = 1.2$ l min$^{-1}$ for FB1 and $0.2$ l min$^{-1}$ for FB2, equivalent to mean upward flow velocities of $\bar {u}_z = 1.3 \times 10^{-2}$ and $2 \times 10^{-3}\ \textrm {m}\ \textrm {s}^{-1}$ through the annular gap. At $\omega _i = 10.5$ rad s$^{-1}$, the minimum fluidization rate is slightly lower than that found at $\omega _i = 0$. For simplicity, the averaged values associated with $\omega _i = 0$ are used to define incipient velocity, $u_{inc}$; the fluidization rate for each experiment is given in terms of the ratio $q = Q/Q_{inc} = u_z/u_{inc}$. Without shearing, the effect of particle size is most significant at fluidization rates near the minimum or incipient fluidization velocity, $u_{inc}$. The larger particles have a higher value of $u_{inc}$ and show bubbling behaviour for fluidization rates near and beyond $u_{inc}$. The smaller particles expand uniformly without significant bubbling as the fluidization rate is increased to $u_{inc}$ and beyond.

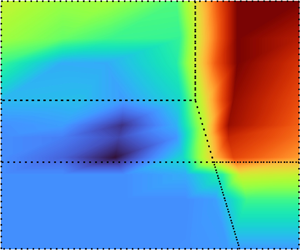
With rotation, measurements of the fluidized bed solid fraction show a dependence on both the fluidization rate and the rotational speed. Figure 3 presents measurements of the average solid fraction as a function of $q$ and $\omega _i$ for the FB1 particle bed. For $q<1$, the particle bed gradually expands, and the solid fraction decreases from $\phi = 0.58$ at $q = 0$ to $\phi \approx 0.55$ at $q=1$. In the absence of shear, sporadic, localized bubbles appear in the FB1 particle bed at flow rates as low as $q = 1.1$. Increasing the flow rate results in more regular bubbling up to $q \approx 1.5$, beyond which intermittent to continuous bubbling is observed throughout the particle bed. Beyond $q = 1.7$, vigorous bubbling occurs throughout the sample. The onset of bubbling results in an increase in the apparent bed volume. Although not presented, comparable patterns in the decrease of $\phi$ with respect to $q$ are also observed in the FB2 particle bed.

Figure 3. Measurements of the solid fraction $\phi$ as a function of normalized fluidization rate $q$ and rotational speed $\omega _i$ for FB1 with mean diameter $D = 113\ \mathrm {\mu }$m. At $\omega _i = 0$, intermittent bubbling can be seen within the bed volume starting at $q=1.1$. Beyond this flow rate, the estimated volumetric solid fraction, $\phi$, decreases with respect to $q$, as found for $\omega _i= 0.01$, 10 and 100 rad s$^{-1}$ in (b), (c) and (d).

The rotation of the inner cylinder impacts the bubbling behaviour of the fluidized particles. The data at $\omega _i$ at 0.01 and 10 rad s$^{-1}$ show similar variation of $\phi$ with $q$. Beyond $\omega _i = 20$ rad s$^{-1}$, the development of bubbles is mitigated, and localized bubbling is scarce. However, even at high rotational speeds, an increase in the apparent bed volume takes place in the range $0.9 \lesssim q \lesssim 1.1$. When sheared at rotational speeds in excess of $\omega _i \approx 50$ rad s$^{-1}$, the solid fraction decreases slowly with increasing $q$, varying in the range $0.53 < \phi < 0.56$ for $1.1 < q < 3$. As found for $\omega _i =100$ rad s$^{-1}$, the solid fraction appears to level out to $\phi \rightarrow 0.53$ for $q>1.5$.

Figure 4 presents average torque measurements for FB1 (a) and FB2 (b) over rotational speeds $10^{-2} < \omega _i < 1.26 \times 10^{2}$ rad s$^{-1}$. Experiments using the larger FB1 particles involve $q$ in the range $0.0 \leq q \leq 2.0$, while experiments using smaller FB2 particles occur across a wide range of fluidization rates, $0.0 \leq q \leq 15$. Several distinct regimes in the flow behaviour were identified via visual inspection through the rheometer's glass outer cylinder as well as analysis of the measured torques. These regimes are delineated in figure 5, and have been named according to their characteristics.

Figure 4. Measured torque as a function of angular velocity and fluidization rate for the FB1 (a) and FB2 (b) experiments. At different values of $q$ and $\omega _i$, the torque measurements show quasistatic or viscous stress behaviour. Both FB1 and FB2 exhibit shear weakening near $q \approx 1$ and at intermediate rotational speeds.

Figure 5. Flow regimes identified from observations of the FB1 (a) and FB2 (b) experiments and analysis of the torque measurements. The flow regimes include quasistatic (DGF), viscous (FRS, SGF, FGM) and inertial (TTV) rheological behaviour depending on the normalized fluidization rate, $q$, and the inner cylinder rotational speed, $\omega _i$. Estimates of the torque growth order, $\alpha \approx d (\log T_z) / d (\log \omega _i)$, are illustrated in the colour scale. Critical values of $q$ and $\omega _i$ delineating the boundaries of each regime are estimated from the experiments.

At fluidization rates $q \lesssim 0.7$ for FB1 and $q \lesssim 0.9$ for FB2, the measured torque, $T_z$, is quasistatic and independent of the angular speed for $\omega _i < 10$ rad s$^{-1}$; in figure 5, this regime is labelled as dense granular flow (DGF). The torque decreases with $q$ such that

(4.1)\begin{equation} T_z = T_{q=0} (1-q), \end{equation}

where $T_{q=0}$ denotes $T_z$ for $q=0$ at low shear rates (Tardos, Khan & Schaeffer Reference Tardos, Khan and Schaeffer1998). At the free surface, the shear region along the rotating inner cylinder contains an inwardly directed velocity component, indicating the presence of a single dilation-driven vortex, a phenomenon first described by Krishnaraj & Nott (Reference Krishnaraj and Nott2016); the region became wider with increasing $\omega _i$. Beyond the shear region, a plug region extends outwards up to $r_o$, which is consistent with the observations of Anjaneyulu & Khakhar (Reference Anjaneyulu and Khakhar1995). At rotational speeds $\omega _i > 10$ rad s$^{-1}$, there is a marked rise in $T_z$ with respect to $\omega _i$, varying as $T_z \propto \omega _i^{\alpha }$ for $0 < \alpha < 1$. Figure 5 designates this regime as a frictional suspension (FRS), where a combination of rotational shear and weak fluidization amounts to a decreasing $\phi$ and increasingly rate-dependent resistance torque. In the FRS regime, stresses transmit through frictional interactions, and in the absence of dominant secondary flows, stress–strain dependency varies at a rate that is less than or equal to a linear relationship (Koval et al. Reference Koval, Roux, Corfdir and Chevoir2009; Koos et al. Reference Koos, Linares-Guerrero, Hunt and Brennen2012). From the torque measurements, the FRS regime starts at around $\omega _i \approx 100$ rad s$^{-1}$ for $q=0$ for FB1 and FB2, but decreases for both sets of particles at around $\omega _i = 20$ rad s$^{-1}$ at $q \approx 1$.

Near the minimum fluidization velocity, $0.7 \lesssim q \lesssim 1.2$ for FB1 and $0.9 \lesssim q \lesssim 2$ for FB2, the torque diminishes in magnitude far more rapidly with increasing $q$ than predicted by the linear model of (4.1) and remains independent of the rotational speed for $\omega _i < 10$ rad s$^{-1}$. This transition region, labelled sheared granular flow (SGF) in figure 5, approximately overlaps with the region of rapid bed expansion visible in figure 3, which precedes the development of noticeable bubbling. Within a range of rotational speeds around $\omega _i \approx 5$ rad s$^{-1}$, a distinct shear-weakening pattern can be seen in the torque measurements, which resembles the behaviour observed in the ‘intermediate’ region described by Lu et al. (Reference Lu, Brodsky and Kavehpour2007) in their experiments using a parallel plate rheometer as well as the supporting UB and XB experiments at slightly higher rotational speeds. This range of $\omega _i$ values narrows with increasing $q$. The SGF regime transitions to states in which $T_z \propto \omega _i^{\alpha }$, where $\alpha > 0$, beyond roughly $\omega _i = 20$ rad s$^{-1}$. Like DGF, SGF that is fluidized below the minimum fluidization velocity transitions to a FRS with $\alpha < 1$ at the highest values of $\omega _i$.

At the highest values of $q$ and for $\omega _i < 10$ rad s$^{-1}$, the particle bed becomes fluidized granular material (FGM), as indicated in figure 5. In this state, $T_z$ is related to $\omega _i^{\alpha }$ according to $0 \leq \alpha \leq 1$, where $\alpha \approx 1$ at low rotational speeds and high values of $q$. The value of $\alpha$ decreases with increasing $\omega _i$ up to approximately $10$ rad s$^{-1}$, then rapidly rises beyond $\alpha = 1.5$ as the fluidized granular material transitions to turbulent toroidal vortices (TTV), as found in figure 5. In the TTV regime, particles flow radially outwards at the free surface of the particle bed and downwards along the transparent outer cylinder of the rheometer, in a fashion opposite to the radial flow observed in the DGF regime.

5. Effective properties and dimensionless quantities for rheological measurements

To compare the results found in § 4, dimensionless quantities were computed using effective properties. In § 5.1, the particle suspensions are idealized as Newtonian fluids using the bulk densities and the KD effective viscosities. The FB results are parameterized as Bingham plastics and Carreau fluids as described in § 5.2.

5.1. Dimensionless torque and Reynolds numbers using KD viscosity

Rheological measurements on fluids are often considered in terms of dimensionless torque, $G$, defined as

(5.1)\begin{equation} G = \frac{T_z \rho}{L \mu^2 }. \end{equation}

For a Newtonian fluid in circular Couette flow, the predicted dimensionless torque, $G_{cc}$, at $r = r_i$ is calculated from the solution provided by (2.6) as

(5.2)\begin{equation} G_{cc} = \frac{2 {\rm \pi}r_i^2 \rho}{\mu} | \dot{\gamma}_N(r_i) | = \frac{2 {\rm \pi}r_o r_i} {(r_o-r_i)^2} Re_s = \frac{4 {\rm \pi}r_i r_o^2}{(r_o^2 - r_i^2)(r_o-r_i)} Re_b, \end{equation}

where $G_{cc}$ has been written in terms of both $Re_s$ and $Re_b$. The ratio of these quantities, $\mathcal {G}_{cc} = G/G_{cc}$, simplifies to

(5.3)\begin{equation} \mathcal{G}_{cc} = \frac{G}{G_{cc}} = \frac{T_z}{T_N} = \frac{T_z}{2 {\rm \pi}r_i^2 L \mu } \frac{1}{| \dot{\gamma}_N(r_i) |}. \end{equation}

From figure 6, the torque ratio is plotted against $Re_s$ for the PL, NB, UB and XB experiments. For Newtonian fluids, (5.1) and (5.3) are computed using the fluid density and dynamic viscosity. In the case of particle suspensions, both $\mathcal {G}_{cc}$ and $Re_s$ are determined by using the effective viscosities given by (2.11) and the sample bulk density as found in table 2.

Figure 6. The torque ratio, $\mathcal {G}_{cc}$, against shear Reynolds number, $Re_s$, for pure liquids (a), neutrally buoyant (b), underbuoyant (c) and overbuoyant (d) suspensions. The neutrally buoyant suspension experiments from Ramesh et al. (Reference Ramesh, Bharadwaj and Alam2019) as found in (b) were collected in a $\zeta \geq 5.5, \eta \geq 0.84$ annular cell. Newtonian fluids in circular Couette flow follow the black dashed line of $\mathcal {G}_{cc} = 1$, and power laws of order $\alpha - 1 \in [0,1]$ in a state of Taylor-vortex flow. Power laws of form $\mathcal {G}_{cc} = \beta Re_s^{\alpha -1}$ and orders $\alpha - 1 = 0.5$ and $0.7$ are shown as dotted–dashed and dotted black lines, respectively, where both assume $\beta = Re_{s,c}^{1-\alpha }$ for $Re_{s,c} = 70$.

In figure 6(a), the Newtonian liquids transition to vortex flow at $Re_{s,c} = 70$ and an equivalent value of $Re_{b,c} = 50$. These values are included in table 2 and are lower than other studies. As noted previously, the rheometer has a wide gap and short column height, and therefore the results of figure 2 are shown using $Re_s$ on the horizontal axes for easier comparison with the results of other studies. In the Taylor-vortex regime, the dimensionless torque values for the PL1 experiment are related to $Re_s$ by an order of $\alpha \approx 1.5$, whereas those of the PL2 experiment increase according to $\alpha \approx 1.7$. The higher-order growth in the supercritical PL2 measurements is attributed to the surface roughness of the profiled measuring cylinder (van den Berg et al. Reference van den Berg, Doering, Lohse and Lathrop2003). These order $\alpha = 1.5$ and $1.7$ relationships between $G$ and $Re_s$ correspond to order $0.5$ and $0.7$ relationships between $\mathcal {G}_{cc}$ and $Re_s$, as found in figure 6 as dotted–dashed and dotted black lines, respectively.

Figure 6(b) presents $\mathcal {G}_{cc}$ and $Re_s$ for the neutrally buoyant suspensions. With this scaling, the effect of mismatching phase densities in the NB1 experiment is clearly visible at lower Reynolds numbers where the dimensionless torque exceeds that for circular Couette flow. Beyond critical rates of shear, the dimensionless quantities of each suspension experiment follow the $\alpha = 1.7$ relationship with supercritical dimensionless torque values matching those of the PL2 experiment. Visual inspection of the suspensions at these high shear rates confirmed the toroidal-vortex flow. In figure 6(b), the results for $\phi = 0.1$ and $\phi = 0.2$ neutrally buoyant suspensions, presented in Ramesh et al.'s (Reference Ramesh, Bharadwaj and Alam2019) study, are plotted alongside this work's NB results. Their experiments cover a smaller range of Reynolds numbers and the torque measurements transition to an order $\alpha > 1$ relationship around $Re_s = 95$ and $85$ for their $\phi = 0.1$ and $\phi = 0.2$ experiments, respectively. Ramesh et al.'s (Reference Ramesh, Bharadwaj and Alam2019) suspension measurements vary in orders of $1.5 < \alpha < 1.7$, which is consistent with their use of a smooth measuring cylinder in their rheometer.

The results for UB and XB are plotted in figure 6(c,d). For these experiments, the behaviour of $\mathcal {G}_{cc}$ as a function of $Re_s$ shows an inverse dependence in the quasistatic regime followed by a transition to a positive relationship with $Re_s$ of order $\alpha = 1.7$. For UB, the supercritical values of dimensionless torque are greater than that of Newtonian fluids at equivalent shear Reynolds numbers. At the highest rates of shear, the UB samples had a visibly higher concentration of particles near the bottom of the annular cell; these observations, coupled to the measured values of torque, suggest that locally concentrated particles affect the supercritical UB measurements. The density difference between the phases may also lead to a radial variation in particle concentration. An additional consideration is that the UB experiments correspond to the highest values of the particle Reynolds number with $Re_D \approx 100$. Under these conditions, inertial effects of the particle phase may become important and act to increase the effective viscosity of the suspension.

5.2. Fitted Bingham plastic and Carreau fluid models

Returning to the results of the gas-fluidized bed experiments, the non-Newtonian torque measurements found in figure 4 cannot be modelled using the KD effective viscosity. Instead, Bingham plastic and Carreau fluid model parameters are fitted to the subcritical torque measurements of each flow rate to capture the shear-thinning behaviour found in the FB experiments. The Bingham plastic model, which has been previously used to model multiphase flows (Alibenyahia et al. Reference Alibenyahia, Lemaitre, Nouar and Ait-Messaoudene1995; Anjaneyulu & Khakhar Reference Anjaneyulu and Khakhar1995; Balmforth, Frigaard & Ovarlez Reference Balmforth, Frigaard and Ovarlez2014), considers two parameters: the yield stress, $\tau _y$, and the plastic viscosity, $\mu _p$. The Bingham constitutive equation for annular shear is

(5.4)\begin{equation} \tau_{r \theta} (r) = \mu_p \left| r \frac{{\rm d}}{{\rm d} r} \left( \frac{u_{\theta} (r)}{r} \right) \right| + \tau_y = \mu_p | \dot{\gamma}_B(r) | + \tau_y. \end{equation}

For shear stresses less than $\tau _y$, the Bingham shear rate, $\dot {\gamma }_B(r)$, is zero. As a result of the rate-independent yield stress term, a Bingham plastic sheared between concentric cylinders has a ‘plug’ region of zero flow. According to the constant torque assumption in (2.2), this plug region occupies a region at and beyond the radial position $r_c = r_i \sqrt {\tau _i / \tau _y}$ for inner-wall shear stresses $\tau _i < \tau _y / \eta ^2$. If the wall stress exceeds $\tau _y / \eta ^2$, then the critical radius is taken to be $r_o$, and the resultant velocity distribution is called a ‘shear’ flow (Landry, Frigaard & Martinez Reference Landry, Frigaard and Martinez2006). Hence, the boundary conditions used to solve (5.4) are $u_{\theta } (r_i) = r_i \omega _i$ and $u_{\theta } (r_c) = 0$, where

(5.5)\begin{equation} r_c = \left\{ \begin{array}{cc} r_i \sqrt{\tau_i / \tau_y} & \tau_i \leq \tau_y / \eta^2 \text{ (plug flow)} \\ r_o & \tau_i > \tau_y / \eta^2 \text{ (shear flow)} \end{array} \right. . \end{equation}

Given values for $\mu _p$ and $\tau _y$, applying the boundary conditions to (2.2) and (5.4) yields

(5.6)\begin{equation} u_{\theta} (r) = \frac{r}{\mu _p} \left[ \tau_y \log ( r/r_c ) + \frac{\omega_i \mu_p + \tau_y \log (r_c/r_i) }{ r_c^2 - r_i^2 } \left( \frac{r_c^2 r_i^2}{r^2} - r_i^2 \right) \right], \end{equation}

and reduces to the Newtonian fluid solution, (2.4), in the case of $\tau _y=0$. The torque follows as

(5.7) \begin{equation} T_B = 4 {\rm \pi}{r_i}^2 {r_c^2} L [ \mu_p \omega_i + \tau_y \log(r_c /r_i) ]/({r_c^2}-{r_i^2}), \end{equation}

which can be coupled to (5.5) and numerically solved to predict torque as a function of $\omega _i$ and the Bingham model parameters.

The Carreau constitutive equation applies to materials that behave as a Newtonian fluid with viscosity $\mu _0$ at low shear rates, a power-law fluid of index $n \in [0,1]$ at intermediate shear rates, and as a Newtonian fluid of viscosity $\mu _{\infty }$ at high shear rates (Carreau Reference Carreau1972). Often, the limiting viscosity, $\mu _{\infty }$, is neglected because it is several orders smaller than $\mu _0$ (Masuda et al. Reference Masuda, Horie, Hubacz, Ohta and Ohmura2016). With $\mu _{\infty } = 0$, the abbreviated Carreau constitutive equation is

(5.8)\begin{equation} \tau_{r \theta} (r) = [ \mu_{C} ( \dot{\gamma}_{C}(r) )] \times | \dot{\gamma}_C(r) | = [ \mu_{0} ( 1 + ( \lambda \dot{\gamma}_C (r) )^2 )^{({n-1})/{2}} ] \times | \dot{\gamma}_C (r) |, \end{equation}

where $\mu _C$ denotes the rate-dependent Carreau viscosity, $\dot {\gamma }_C$ denotes the shear rate of the Carreau fluid and $\lambda$ is the relaxation time. For Carreau shear rates with $\dot {\gamma }_C \gtrsim 1/\lambda$, the shear stress scales as an $n < 1$ power-law fluid. While (5.8) has no analytic solution in $u_{\theta }(r)$ for annular shear flows, enforcing the no-slip condition at the inner cylinder implies that $\dot {\gamma }_C (r_i) = -k \omega _i$, where the constant $k \in \mathbb {R}_+$ is related to the radius ratio. Masuda et al. (Reference Masuda, Horie, Hubacz, Ohta and Ohmura2016) investigated the variation of $k$ with respect to radius ratios $0.5 < \eta < 0.9$ for indices in the range $0.3 \leq n \leq 0.7$, finding that $k$ varies between $k = 2$ for $n=0.7$ and $k=3.5$ for $n = 0.3$ in their widest gap configurations. Hence, given $k$ and the model parameters, the torque predicted by the Carreau model can be determined using the inner cylinder boundary condition as

(5.9)\begin{equation} T_C = 2 {\rm \pi}L r_i^2 ( \mu_C (\dot{\gamma}_C(r_i)) \times \dot{\gamma}_C (r_i) ) = 2 {\rm \pi}L r_i^2 [ \mu_0 ( 1 + (\lambda k \omega_i)^2 )^{({n-1})/{2}} ] k \omega_i . \end{equation}

Using (5.7) and (5.9), the fitted Bingham and Carreau model parameters for the FB experiments are found in figures 7 and 8, respectively. The fits are generated using MATLAB's Levenberg–Marquardt nonlinear least squares optimization method using subcritical $\omega _i$ and $T_z$ pairs from the FB1 and FB2 data sets, excluding measurements from the vortical regime at and beyond roughly $\omega _i \approx 10$ rad s$^{-1}$. Note that the objective function for the fits to the Bingham model accounts for the changing boundary conditions associated with the transition from plug flow to shear flow. The Carreau model optimization assumes that $\gamma _C (r_i) \propto -\omega _i$ with the factor $k = 2 r_o^2/(r_o^2 - r_i^2) = 2.61$; this formulation of $k$ sets the scaling of $\dot {\gamma }_C (r_i)$ as equal to the Newtonian shear rate per (2.5), and the resultant value of $k = 2.61$ coincides with the range found by Masuda et al. (Reference Masuda, Horie, Hubacz, Ohta and Ohmura2016) for their lowest values of $\eta$. In general, the fitted Bingham models accurately predict measured torque for the $q \ll 1$ FB experiments, while the fitted Carreau models are extremely accurate for $q \gg 1$. Both models fail to capture the shear weakening behaviour within the intermediate flow rates of $q \approx 1$ and rotational speeds $0.1 \lesssim \omega _i \lesssim 10$ rad s$^{-1}$, as both models assume strictly increasing $T_z$ with respect to $\omega _i$.

Figure 7. Fitted Bingham plastic parameters as found in (5.4) against the normalized fluidization rate for the FB experiments; symbol legends are found in figure 4. Panels (b) and (d) show data for $q<2$. The yield stress, $\tau _y$, is shown relative to the average quasistatic shear stress with $\tau _{q=0} = 225$ Pa for FB1 and $160$ Pa for FB2. The yield stress measurements for the DGF flow regime in figure 5 ($q \leq 0.5$ for FB1 and $q \leq 0.8$ for FB2) follow the relationship $\tau _y = \tau _{q=0} (1 - q)$ as shown by the dashed black line in (a,b). Panels (c) and (d) show the plastic viscosity, $\mu _p$, against $q$.

Figure 8. Fitted Carreau fluid parameters for the FB experiments as found in (5.8) against the normalized fluidization with (b), (d) and (f) showing $q<2$. The initial viscosity, $\mu _0$, is shown in (a) and (b) and the relaxation time, $\lambda$, in (c) and (d). Panels (e) and (f) show the power index, $n$, which varies between $0$ and $1$ for shear-thinning Carreau fluids. The FB2 experiments show a maximum with $n=0.19$, whereas the FB1 experiments increase up to $n = 0.56$.

Figure 7 reports the Bingham model parameters $\tau _y$ and $\mu _p$ as functions of the normalized fluidization rate, $q$. The yield stresses are scaled by the value of $\tau _{q=0}$, which is the average, quasistatic shear stress for $q=0$. For values of $q<0.7$, the figure includes the relation $\tau _y/\tau _{q=0} =1-q$. This expression fits well in the DGF regions for FB1 and FB2. The analysis by Gutam et al. (Reference Gutam, Mehandia and Nott2013) can be used to estimate $\tau _{q=0}$ for a sheared annular column. In that work, the stress increases exponentially with depth. Because the current experiments use a short column, the stress distribution can be approximated as varying linearly with depth. As a result, an average shear stress at the wall can be estimated as $\tau _{q=0} \approx \mu _w (\rho _b-\rho _f) gL/(2 \eta ^2)$ with $\rho _b$ evaluated in a packed state with $\phi =0.585$ and the wall friction coefficient, $\mu _w \approx 0.2$ for FB1 and 0.15 for FB2. This estimate works well for $q=0$ but not as $q$ is increased and the solid fraction begins to drop. As found in figure 3 for $\omega _i \approx 0$, the measured solid fraction based on the average height of the bed remains relatively constant with $\phi =0.59$ for $q<0.7$. Presumably, there are small changes in solid fraction and the wall friction that result in the drop in $\tau _y$; these variations are beyond the resolution of the experimental techniques. For $q>0.7$, the drop in $\tau _y$ does correspond with the drop in $\phi$. As Anjaneyulu & Khakhar (Reference Anjaneyulu and Khakhar1995) found for their Bingham plastic fits, the fitted yield stresses tend to zero as $q \rightarrow \infty$. The plastic viscosities increase from $\mu _p \approx 3 \times 10^{-3}\ \textrm {Pa}\ \textrm {s}$ when the bed is quasistatic for $q=0$, then level out to $\mu _p \approx 0.2$ and $0.09\ \textrm {Pa}\ \textrm {s}$ for FB1 and FB2 as the flows show viscous behaviour and as $\tau _y$ drops.

Whereas the Bingham model features a rate-independent constant $\tau _y$, the Carreau model assumes that $\tau _{r \theta } \rightarrow 0$ as $\omega _i \rightarrow 0$. Hence, the fitted values of $\mu _0$ for the quasistatic stress experiments for $q < 1$ are approximately four orders higher than the fitted Bingham plastic viscosities, and accompanied by high values of the relaxation time, $\lambda$, to predict appropriately large magnitudes of torque. For FB1, the value of $\mu _o$ is relatively constant for $q<0.7$, corresponding to approximately constant values of $\phi$; beyond $q\approx 0.7$, both $\mu _o$ and $\phi$ decrease. Over this range of $q$, the index $n$ is near zero, so that torque predictions using the fitted Carreau models resemble a step function in $\omega _i$. Despite this inelegant compensating behaviour, the Carreau model predicts measured torque in the $q<1$ FB experiments with reasonable accuracy, and performs best for higher $q$, such as $q > 1.2$ for FB1 particles and $q > 2.5$ for FB2 particles. The inclusion of the power index $n$ in the Carreau model allows predicted values of torque to scale with $\omega _i$ more accurately than those computed from the Bingham model. The fitted values of $n$ generally increase with $q$, and those associated with the FB1 experiments increase up to $n = 0.56$ for $q = 2.0$, while the FB2 experiments with pronounced shear-thinning behaviour climb to $n = 0.19$.

6. Discussion

Can representative dimensionless quantities, computed using effective properties, be used to compare the rheology and flow transitions found in suspensions, fluidized beds and granular flows? Figure 9 addresses this question by comparing the dimensionless torque, $G$, as a function of the gap Reynolds number, $Re_b$. Overall, the relation between $G$ and $Re_b$ for the fluidized beds shows similar rheological behaviour to that found for the suspensions over a wide range of flow conditions. The data can also be compared with the pure fluid experiments for the smooth and rough walls, as shown in figure 9(a). Because of the density difference between the fluid and solid phases, the NB1 data are not included in the figure.

Figure 9. Dimensionless torque, defined in (5.1), against gap Reynolds number for all experiments. The black dashed lines show the analytical relationship between $G$ and $Re_b$ for Newtonian fluids in circular Couette flow, as specified in (5.2). Power-law relationships of form $G = \beta Re_b^{\alpha }$ are shown for $\alpha = 1.5$ (dotted–dashed) and $1.7$ (dotted) as black lines. In both cases, the scaling is taken to be $\beta = 4 {\rm \pi}r_i r_o^2 / [ (r_o^2 - r_i^2 ) (r_o - r_i) ] Re_{b,c}^{1-\alpha }$, where $Re_{b,c} = 50$.

For the suspensions, the parameters $G$ and $Re_b$ are computed using the sample bulk density and the KD effective viscosity as given by table 2. Consequently, each of the samples featured in figure 9(bd) are modelled as effective Newtonian fluids, and their properties as functions of $\phi$ and those of their constitutive liquid and solid phases. For gas-fluidized particles, the idealized fluid density is also taken to be the sample bulk density estimated from the investigation in § 4.2, but the measurements shown in figure 9(e,f) are modelled as either a Bingham pseudo-plastic or a shear-thinning Carreau fluid. In particular, the fitted Bingham plastic viscosities, $\mu _p$, shown in figure 7 are used in $G$ and $Re_b$ for $q \leq 1.2$ in the FB1 experiments and in the $q \leq 2.5$ FB2 experiments. The rate-dependent Carreau viscosity, $\mu _C$, corresponding to the bracketed term in (5.8), is used for the dimensionless results of the high-flow-rate experiments. Computing $G$ and $Re_b$ with $\mu _C$ collapses the shear-thinning/weakening behaviour found in the dimensional results onto a linear relationship, but these patterns remain apparent in the dimensionless profiles of the FB measurements parameterized by $\mu _p$.

Using the effective density and viscosity, the experimental results are organized into three basic dimensionless profiles: viscous, quasistatic and $\alpha \geq 1.5$ power law. The viscous behaviour, typified by the PL experiments and shared by the well-mixed NB and strongly fluidized FB results, show linear variation between $G$ and $Re_b$ up to the critical Reynolds number $Re_{b,c} \approx 50$. Quasistatic torque is found for the UB, XB and $q \lesssim 1$ FB experiments up to and beyond $Re_{b,c}$. Finally, both viscous and quasistatic dimensionless torque profiles may transition to power-law relationships of the form $G \propto Re_b^{\alpha }$ with $\alpha > 1.5$, corresponding to the development of toroidal-vortex flow in which the local shear rates are no longer directly related to the rotational speed. The experiments showing initially viscous behaviour transition to power-law scaling at $Re_{b,c} = 50$, whereas those displaying quasistatic torque behaviour transition at higher gap Reynolds numbers that scale roughly with the magnitude of their rate-independent dimensionless torque.

Figure 9(a,b,e,f) shows similar subcritical behaviour between the Newtonian fluids, neutrally buoyant suspensions and strongly fluidized particle beds, but there are several differences in the transition to high-order torque growth. For instance, the onset of vortical flow for Newtonian fluids and well-mixed neutrally buoyant suspensions is marked by an abrupt change in the slope of $G$ with respect to $Re_b$. In contrast, the corresponding transition for the FB measurements parameterized using $\mu _C$ is gradual, with local estimates of $\alpha = d( \log G)/d(\log Re_b)$ varying from $\alpha = 1$ to $\alpha \geq 1.5$ over a window of roughly 50 with respect to the gap Reynolds number. Moreover, fitting $G = \beta Re_b^{\alpha }$ to the combined supercritical FB results yields approximately $\beta = 0.6, \alpha = 1.9$, which is a higher-order variation than the $\alpha = 1.7$ relationship for the PL2 and NB results. While the Newtonian fluid estimates of $\alpha$ compare well with those found by van den Berg et al. (Reference van den Berg, Doering, Lohse and Lathrop2003), Ravelet et al. (Reference Ravelet, Delfos and Westerweel2010) and Lewis & Swinney (Reference Lewis and Swinney1999), the mechanism driving the supercritical variation of $\alpha$ for sheared fluidized beds remains unclear.

The dimensionless torque and gap Reynolds number formulations used in figure 9 effectively capture the viscous and inertial states of the PL, NB and $q\gg 1$ FB flows, but fail to standardize the transition behaviour of measurements showing quasistatic torque. Equations (1.1) and (5.1) do not account for rate-independent stress contributions resulting from friction between particles in their packed state; the KD effective viscosity used for the dimensionless UB and XB results assumes that $\phi$ is homogenous, and the Bingham plastic viscosity used for the weakly fluidized FB results is associated with only the viscous shear stress component in (5.4). To formulate dimensionless quantities that represent all contributions to the stress state, the data for DGF fluidized beds and the UB and XB suspensions are compared in figure 10 using the thickness of the sheared layer, $r_c -r_i$ rather than $r_o - r_i$, where $r_c$ is the Bingham critical radius as computed from (5.5). Using $r_c-r_i$ as the characteristic length scale, the horizontal axis of figure 10(a) is the plug-corrected gap Reynolds number

(6.1)\begin{equation} Re^*_b = \frac{\rho_b \omega_i r_i (r_c - r_i)}{\mu_p}. \end{equation}

For Bingham shear flow ($\tau _i = T_z / 2 {\rm \pi}r_i^2 L \geq \tau _y / \eta ^2$), $Re^*_b$ is equivalent to the conventional gap Reynolds number defined by (1.1). The use of $r_c - r_i$ as the appropriate length scale is supported by prior studies (Landry et al. Reference Landry, Frigaard and Martinez2006; Jeng & Zhu Reference Jeng and Zhu2010). The torque ratio is with respect to the Bingham model, $\mathcal {G}_{B} = T_z / T_B(\omega _i)$, where $T_B$ is computed as in (5.7). In addition to the FB fitted results shown in figure 7, Bingham model parameters were determined for the UB and XB suspension experiments, and are provided in the caption of figure 10. An estimate for $\tau _y$ follows the analysis of the yield stress for the fluidized beds with $\tau _y \approx \mu _w ( \rho _b - \rho _f) g L/(2 \eta ^2)$ in which $\rho _b$ is evaluated for $\phi =0.58$ with $\mu _f$ ranging from 0.16 to 0.22.

Figure 10. Comparison between DGF fluidized beds and gravimetrically imbalanced suspensions using fitted Bingham models. Panel (a) features the torque ratio, $\mathcal {G}_{B}$, equal to the measured torque relative to that predicted by the Bingham model, plotted against the corrected gap Reynolds number, $Re_b^*$, which accounts for the evolving width of the shear region, $r_c-r_i$. The dotted black line shows the power-law relationship of order $\alpha - 1 = 0.7$, where the coefficient is $\beta = Re_{b,c}^{1-\alpha }, Re_{b,c} = 50$. Inset (b) shows the quasistatic stress ratio, $\tau ^*$, against the inverse Bingham number, $\varGamma$, where the black dashed line is the idealized relationship $\tau ^* = \varGamma + 1$. The UB1 and UB2 data use $\tau _y = 4.00$ and $1.97$ Pa and plastic viscosities $\mu _p = 2.49 \times 10^{-2}$ and $2.01 \times 10^{-2}\ \textrm {Pa}\ \textrm {s}$, respectively; the XB1 and XB2 data use $\tau _y = 2.84$ and $3.55$ Pa, and $\mu _p = 2.73 \times 10^{-2}$ and $4.73 \times 10^{-2}\ \textrm {Pa}\ \textrm {s}$.

Figure 10(a) depicts the rheological transition of sheared packed particles to supercritical flow. By accounting for the rate-independent yield stress featuring in (5.4), the corrected gap Reynolds number shows that the onset of linear instability occurs at roughly $Re^*_{b,c} = 50$, similar to the $Re_{b,c}$ found for pure fluids and neutrally buoyant suspensions. The order $\alpha -1 = 0.7$ power-law relationship between $\mathcal {G}_{B}$ and $Re_b^*$ is shown as a black dotted line in figure 10(a).

Figure 10(b) shows the developing viscous behaviour of the packed particulate flows by comparing the quasistatic stress ratio, $\tau ^* = \tau _i / \tau _y$, against the inverse Bingham number

(6.2)\begin{equation} \varGamma = \mu_p\ \dot{\gamma}_B(r_i) / \tau_y . \end{equation}

This representation is similar to the master curve developed by Kostynick et al. (Reference Kostynick, Matinpour, Pradeep, Haber, Sauret, Meiburg, Dunne, Arratia and Jerolmack2022) for soil samples that transition from quasistatic behaviour to a viscous regime in which the stresses scale linearly with shear rate. Note that figure 10(b) includes the data used to fit the Bingham and Carreau models and excludes data from the toroidal-vortex regime. Equivalent values of $\mathcal {G}_{B}$ and $Re_b$ for the data featured in figure 10(b) are contained within the dotted box in figure 10(a). The Bingham shear rate, $\dot {\gamma }_B$, is computed from the derivative of (5.6) with respect to $r$ evaluated at $r_i$. As the inverse Bingham number exceeds $\varGamma = 0.1$, viscous contributions come to dominate the measured stress; within the intermediary region of $0.1 < \varGamma < 1$, $\tau _i$ varies approximately linearly with the rotational speed. The idealized $\tau ^* = \varGamma + 1$ relationship used in Kostynick et al. (Reference Kostynick, Matinpour, Pradeep, Haber, Sauret, Meiburg, Dunne, Arratia and Jerolmack2022) is plotted as a dashed black line in figure 10(b).

7. Conclusion

In this study, experimental measurements on sheared Newtonian liquids, particle suspensions and gas-fluidized beds were performed in a low-aspect-ratio concentric cylinder rheometer below and beyond the threshold of linear instability. The results of these experiments were compared as dimensionless quantities computed using effective properties of density, viscosity and characteristic length scales derived from idealized fluid-mechanical models. Despite vast physical differences between the sheared materials, the dimensionless representations of the measurements showed either quasistatic or viscous rheological behaviour in their sub-critical flow state, and followed order $\alpha \geq 1.5$ power-law scaling during centrifugally unstable toroidal-vortex flow.

While previous investigations have compared pure fluid and neutrally buoyant Taylor–Couette flows, the analogous flow transitions exhibited by gas-fluidized particle beds have been studied in less detail. Hence, this research focuses on the classification of the fluidized bed behaviour, as found in figure 5, in response to variation of the fluidization rate and shearing velocity. A regime map delineated the flow behaviour using dimensional experimental measurements and observations. To summarize, particle beds weakly fluidized below the minimum fluidization velocity ($q\ll 1$) resist shear quasistatically up to moderate rotational speeds as a DGF, then develop rate-dependent contributions to the torque at exceptionally high rotational speeds as the bed becomes a FRS. In contrast, ($q\gg 1$) FGM shows viscous behaviour at all rates of shear, transitioning to turbulent TTV in response to centrifugal instability. Sheared granular flows, with $q \approx 1,$ are a transition region between two distinct flow behaviours, showing both quasistatic and viscous torque behaviour at low-to-moderate rates of shear, but also developing toroidal-vortex flow at high rotational speeds. Estimates of the bed bulk solid fraction and previous studies on sheared granular material suggest that this intermediate regime involves competing effects of fluidization, particle–particle Coulombic friction and shear-induced bed dilation. Future work involving visualization of the flow could help to better define this region.

The DGF and FRS rheologies suitably fit the Bingham plastic equation, and the FGM flows are successfully modelled as shear-thinning Carreau fluids. While neither model accurately describes the SGF behaviour, both models were used to generate Reynolds numbers and dimensionless representations of torque that clearly illustrate the observed flow transitions. In particular, the dimensionless torque computed using the Carreau viscosity shows transition to vortical flow at the same critical Reynolds number, $Re_{b,c} = 50$, found for the Newtonian liquids and neutrally buoyant suspensions parameterized using the KD effective viscosity. Similarly, using the Bingham model prediction of the shear layer width yields a critical gap-corrected Reynolds number of $Re_{b,c}^* = 50$. The Bingham model was also used to define an inverse Bingham number displaying the fluidized bed torque transition from quasistatic DGF to viscous FRS at $\varGamma = 0.1$. Comparison between the $q \lesssim 1$ fluidized beds and density-mismatched particle suspensions, which were also fitted to the Bingham model, reveals similar rheological transitions on the dimensionless axes. Despite the dynamical differences between these materials, the similarities support the hypothesis that the shear-thinning/weakening features observed in the gas-fluidized beds may be driven by the shear-induced particle migration accounting for the same behaviour in negatively and positively buoyant suspensions.

Using simple rheological models, this investigation outlines an empirical framework for the identification and comparison of common flow features found across a myriad of multiphase flows, especially for distinguishing subcritical and inertial states. Complete explanations of multiphase flow phenomena may only be possible on a case-by-case basis; however, elementary physical concepts such as momentum and friction govern all flowing material, and comparisons based on these essential features inform the study of more complicated cases, such as the SGF fluidized beds. Future simulated and experimental investigations are necessary to elucidate the transition regions identified in the current experiments and to incorporate additional complexities, such as properties variations associated with the density differences between phases. In addition, the measurements show that the boundary between the viscous FRS regime and supercritical TTV flow roughly coincides with the minimum fluidization rate, but the direct transition between these two flow states was not measured in the torque experiments. Finally, further studies should include detailed visualization of the TTV velocity field, which would improve understanding of the bulk momentum transport properties measured in this work.

Acknowledgements

We would like to thank Professor J. Brady for access to the Anton-Parr MCR-302 rheometer and to Professor J. Kornfield and her research group for their sharing of their laboratory space. We thank Professor C. Hrenya at University of Colorado, Boulder for providing the sieved particles used in the FB2 experiments; Dr H.-H. Lin for his valuable experience operating the MCR-302 rheometer; Professor M. Alam and Professor F. Ravelet for graciously sharing their results to allow for the direct comparison of measurements; and the Office of Student Faculty Programs at the California Institute of Technology for their long-standing support of the first author.

Funding

This research is based upon work supported by the National Science Foundation under grant no. 1706166.

Declaration of interests

The authors report no conflict of interest.

References

Acrivos, A., Fan, X. & Mauri, R. 1994 On the measurement of the relative viscosity of suspensions. J. Rheol. 38 (5), 12851296.CrossRefGoogle Scholar
Acrivos, A., Mauri, R. & Fan, X. 1993 Shear–induced resuspension in a Couette device. Intl J. Multiphase Flow 19 (5), 797802.CrossRefGoogle Scholar
Alam, M. & Ghosh, M. 2022 Unifying torque scaling in counter-rotating suspension Taylor–Couette flow. Phil. Trans. A 381, 20220226.Google Scholar
Alibenyahia, B., Lemaitre, C., Nouar, C. & Ait-Messaoudene, N. 1995 Revisiting the stability of circular Couette flow of shear-thinning fluids. J. Non-Newtonian Fluid Mech. 183–184, 3751.Google Scholar
Anjaneyulu, P. & Khakhar, D.V. 1995 Rheology of a gas-fluidized bed. Powder Technol. 83, 2934.CrossRefGoogle Scholar
Bagnold, R.A. 1954 Experiments on a gravity-free dispersion of large solid spheres in a newtonian fluid under shear. Proc. R. Soc. Lond. A 225, 4963.Google Scholar
Bakhtiyarov, S.I., Overfelt, R.A. & Siginerm, D. 2002 Progress in an Industrial Application of Fluidized Beds: Advances in the Sand Core Making Process, 2nd edn, pp. 187–222. Taylor & Francis.Google Scholar
Balmforth, N.J., Frigaard, I.A. & Ovarlez, G. 2014 Yielding to stress: recent developments in viscoplastic fluid mechanics. Annu. Rev. Fluid Mech. 46, 121146.CrossRefGoogle Scholar
Baroudi, L., Majji, M.V. & Morris, J.F. 2020 Effect of inertial migration of particles on flow transitions of a suspension Taylor–Couette flow. Phys. Rev. Fluids 5, 114303.CrossRefGoogle Scholar
Baroudi, L., Majji, M.V., Peluso, S. & Morris, J.F. 2023 Taylor–Couette flow of hard-sphere suspensions: overview of current understanding. Phil. Trans. A 381, 20220125.Google ScholarPubMed
van den Berg, T.H., Doering, C.R., Lohse, D. & Lathrop, D.P. 2003 Smooth and rough boundaries in turbulent Taylor–Couette flow. Phys. Rev. E 68 (3), 036307.CrossRefGoogle ScholarPubMed
Carreau, P.J. 1972 Rheological equations from molecular network theories. J. Rheol. 16 (1), 99127.Google Scholar
Chandrasekhar, S. 1960 The stability of non-dissipative Couette flow in hydromagnetics. Proc. Natl Acad. Sci. USA 46 (2), 253257.CrossRefGoogle ScholarPubMed
Colafigli, A., Massei, L., Lettieri, P. & Gibilaro, L. 2009 Apparent viscosity measurements in a homogeneous gas-fluidized bed. Chem. Engng Sci. 64, 144152.CrossRefGoogle Scholar
Cole, J.A. 1976 Taylor-vortex instability and annulus-length effects. J. Fluid Mech. 75 (1), 115.CrossRefGoogle Scholar
Coles, D. 1965 Transition in circular Couette flow. J. Fluid Mech. 21 (3), 385425.CrossRefGoogle Scholar
Conway, S.L., Shinbrot, T. & Glasser, B.J. 2004 A Taylor vortex analogy in granular flows. Nature 43, 433437.CrossRefGoogle Scholar
Couette, M.M. 1890 Études sur le frottement des liquides. In Annales de chimie et de physique, vol. 6–21, pp. 433–510. G. Masson.Google Scholar
Coussot, P. 2005 Rheometry of Pastes, Suspensions, and Granular Materials. Wiley.CrossRefGoogle Scholar
Czarny, O., Serre, E., Bontoux, P. & Lueptow, R.M. 2003 Interaction between ekman pumping and the centrifugal instability in Taylor–Couette flow. Phys. Fluids 15 (3), 467477.CrossRefGoogle Scholar
Dash, A., Anantharaman, A. & Poelma, C. 2020 Particle-laden Taylor–Couette flows: higher-order transitions and evidence of azimuthally localized wavy vortices. J. Fluid Mech. 903, A20.CrossRefGoogle Scholar
Davidson, F., Cliff, R. & Harrison, D. 1985 Fluidization. Academic Press.Google Scholar
Deng, R., Arifin, D.Y., Mak, Y.C. & Wang, C.-H. 2009 Characterization of Taylor vortex flow in a short liquid column. Am. Inst. Chem. Engrs 55 (12), 30563065.CrossRefGoogle Scholar
Deng, R., Arifin, D.Y., Mak, Y.C. & Wang, C.H. 2010 Taylor vortex flow in presence of internal baffles. Chem. Engng Sci. 65 (16), 45984605.CrossRefGoogle Scholar
Donnelly, R.J. & Fultz, D. 1960 Experiments on the stability of viscous flow between rotating cylinders II. Visual observations. Proc. R. Soc. Lond. Ser. A 258, 101123.Google Scholar
Dubrulle, B., Dauchot, O., Daviaud, F., Longaretti, P.-Y., Richard, D. & Zahn, J.-P. 2005 Stability and turbulent transport in Taylor–Couette flow from analysis of experimental data. Phys. Fluids 17, 095103.CrossRefGoogle Scholar
Einstein, A. 1906 Calculation of the viscosity-coefficient of a liquid in which a large number of small spheres are suspended in irregular distribution. Ann. Phys. 19, 286306.Google Scholar
Einstein, A. 1926 Investigations on the Theory of Brownian Movement. Dover.Google Scholar
Esser, A. & Grossman, S. 1996 Analytical expression for Taylor–Couette stability boundary. Phys. Fluids 8, 18141818.CrossRefGoogle Scholar
Forterre, Y. & Pouliquen, O. 2008 Flows of dense granular media. Annu. Rev. Fluid Mech. 40, 124.CrossRefGoogle Scholar
Gibilaro, L.G., Gallucci, K., Felice, R.D. & Pagliani, P. 2007 On the apparent viscosity of a fluidized bed. Chem. Engng Sci. 62, 294300.CrossRefGoogle Scholar
Gu, Y., Chialvo, S. & Sundaresan, S. 2014 Rheology of cohesive granular materials across multiple dense-flow regimes. Phys. Rev. E 90, 032206.CrossRefGoogle ScholarPubMed
Gutam, K.J., Mehandia, V. & Nott, P.R. 2013 Rheometry of granular materials in cylindrical Couette cells: anomalous stress caused by gravity and shear. Phys. Fluids 25, 070602.CrossRefGoogle Scholar
Hartig, J., Shetty, A., Conklin, D.R. & Weimer, A.W. 2022 Aeration and cohesive effects on flowability in a vibrating powder conveyor. Powder Technol. 408, 117724.CrossRefGoogle Scholar
Hunt, M.L., Zenit, R., Campbell, C.S. & Brennen, C.E. 2002 Revisiting the 1954 suspension experiments of R.A. Bagnold. J. Fluid Mech. 452, 124.CrossRefGoogle Scholar
Iams, A.D., Gao, M.Z., Shetty, A. & Palmer, T.A. 2022 Influence of particle size on powder rheology and effects on mass flow during directed energy deposition additive manufacturing. Powder Technol. 396, 316326.CrossRefGoogle Scholar
Jeng, J. & Zhu, K.Q. 2010 Numerical simulation of Taylor Couette flow of bingham fluids. J. Non-Newtonian Fluid Mech. 165 (19), 11611170.CrossRefGoogle Scholar
Joseph, G.G., Zenit, R., Hunt, M.L. & Rosenwilkel, A.M. 2001 Particle-wall collisions in a viscous fluid. J. Fluid Mech. 433, 329346.CrossRefGoogle Scholar
Koos, E., Linares-Guerrero, E., Hunt, M.L. & Brennen, C.E. 2012 Rheological measurements of large particles in high shear rate flows. Phys. Fluids 24 (1), 013302.CrossRefGoogle Scholar
Kostynick, R., Matinpour, H., Pradeep, S., Haber, S., Sauret, A., Meiburg, E., Dunne, T., Arratia, P. & Jerolmack, D. 2022 Rheology of debris flow materials is controlled by the distance from jamming. Proc. Natl Acad. Sci. 119 (44), e2209109119.CrossRefGoogle ScholarPubMed
Koval, G., Roux, J.N., Corfdir, A. & Chevoir, R. 2009 Annular shear of cohesionless granular materials: from the inertial to quasistatic regime. Phys. Rev. E Stat. Nonlinear Soft Matt. Phys. 79 (2), 021306.CrossRefGoogle ScholarPubMed
Krieger, I.M. 1972 Rheology of monodisperse latices. Adv. Colloid Interface Sci. 3, 111135.CrossRefGoogle Scholar
Krieger, I.M. & Dougherty, T.J. 1959 A mechanism for non-Newtonian flow in suspensions of rigid-spheres. Trans. Soc. Rheol. 3, 137152.CrossRefGoogle Scholar
Krishnaraj, K.P. & Nott, P.R. 2016 A dilation-driven vortex flow in sheared granular materials explains a rheometric anomaly. Nat. Commun. 7, 10630.CrossRefGoogle ScholarPubMed
Landry, M.P., Frigaard, I.A. & Martinez, D.M. 2006 Stability and instability of Taylor–Couette flows of a bingham fluid. J. Fluid Mech. 560, 321353.CrossRefGoogle Scholar
Larson, R.G. 1999 The Structure and Rheology of Complex Fluids. Oxford University Press.Google Scholar
Leighton, D. & Acrivos, A. 1986 Viscous resuspension. Chem. Engng Sci. 41 (6), 13771384.CrossRefGoogle Scholar
Leighton, D. & Acrivos, A. 1987 The shear-induced migration of particles in concentrated suspensions. J. Fluid Mech. 181 (1), 415439.CrossRefGoogle Scholar
Lewis, G.S. & Swinney, H.L. 1999 Velocity structure functions, scaling, and transitions in high-Reynolds-number Couette–Taylor flow. Phys. Rev. E 59 (5), 54575467.CrossRefGoogle ScholarPubMed
Linares-Guerrero, E., Hunt, M.L. & Zenit, R. 2017 Effects of inertia and turbulence on rheological measurements of neutrally buoyant suspensions. J. Fluid Mech. 811, 525543.CrossRefGoogle Scholar
Lu, E., Brodsky, E.E. & Kavehpour, H.P. 2007 Shear-weakening of the transitional regime for granular flow. J. Fluid Mech. 587, 347372.CrossRefGoogle Scholar
Mahbubul, I.M, Saidur, R. & Amalina, M.A. 2012 Latest developments on the viscosity of nanofluids. Intl J. Heat Mass Transfer 55, 874885.CrossRefGoogle Scholar
Majji, M.V., Banerjee, S. & Morris, J.F. 2018 Inertial flow transitions of a suspension in Taylor–Couette geometry. J. Fluid Mech. 835, 936969.CrossRefGoogle Scholar
Mallock, A. 1896 Experiments on fluid viscosity. Phil. Trans. R. Soc. Lond. A 183, 4156.Google Scholar
Masuda, H., Horie, T., Hubacz, R., Ohta, M. & Ohmura, N. 2016 Prediction of onset of Taylor–Couette instability for shear-thinning fluids. Rheol. Acta 56 (2), 7384.CrossRefGoogle Scholar
Matas, J.-P., Morris, J.F. & Guazzelli, E. 2003 Transition to turbulence in particulate pipe flow. Phys. Rev. Lett. 90 (1), 014501.CrossRefGoogle ScholarPubMed
Mendoza, C.I. 2017 A simple semiemperical model for the effective viscosity of multicomponent suspensions. Rheol. Acta 56 (5), 113.CrossRefGoogle Scholar
Mishra, I., Liu, P., Shetty, A. & Hrenya, C.M. 2020 On the use of a powder rheometer to probe defluidization of cohesive powders. Chem. Engng Sci. 214, 115422.CrossRefGoogle Scholar
Mishra, I., Molnar, M.J., Hwang, M.Y., Shetty, A. & Hrenya, C.M. 2022 Experimental validation of the extraction of a particle-particle cohesion model (square-force) from simple bulk measurements (defluidization in a rheometer). Chem. Engng Sci. 259, 117782.CrossRefGoogle Scholar
Mueller, S., Llewellin, E.W. & Mader, H.M. 2010 The rheology of suspensions of solid particles. Proc. R. Soc. Lond. A 466, 12011228.Google Scholar
Nedderman, R.M. 1992 Statics and Kinematics of Granular Materials. Cambridge University Press.CrossRefGoogle Scholar
Phillips, R.J., Armstrong, R.C., Brown, R.A., Graham, A.L. & Abbott, J.R. 1992 A constitutive equation for concentrated suspensions that accounts for shear-induced particle migration. Phys. Fluids A 4, 3040.CrossRefGoogle Scholar
Racina, A. & Kind, M. 2006 Specific power input and local micromixing times in turbulent Taylor–Couette flow. Exp. Fluids 41, 513522.CrossRefGoogle Scholar
Ramaraju, H., Landry, A.M., Sashidharan, S., Shetty, A., Crotts, S.J., Maher, K.O., Goudy, S.L. & Hollister, S.J. 2022 Clinical grade manufacture of 3d printed patient specific biodegradable devices for pediatric airway support. Biomaterials 289, 121702.CrossRefGoogle ScholarPubMed
Ramesh, P., Bharadwaj, S. & Alam, M. 2019 Suspension Taylor–Couette flow: co-existence of stationary and travelling waves, and the characteristics of Taylor vortices and spirals. J. Fluid Mech. 870, 253257.CrossRefGoogle Scholar
Ravelet, R., Delfos, R. & Westerweel, J. 2010 Influence of global rotation and Reynolds number on the large-scale features of a turbulent Taylor–Couette flow. Phys. Fluids 22, 055103.CrossRefGoogle Scholar
Rees, A.C., Davidson, J.F., Dennis, J.S. & Hayhurst, A.N. 2005 The rise of a buoyant sphere in a gas-fluidized bed. Chem. Engng Sci. 60, 11431153.CrossRefGoogle Scholar
Singh, S.P., Ghosh, M. & Alam, M. 2022 Counter-rotating suspension: pattern transition, flow multiplicity and the spectral evolution. J. Fluid Mech. 944, A18.CrossRefGoogle Scholar
Snyder, H.A. 1968 a Stability of rotating Couette flow. I. Asymmetric waveforms. Phys. Fluids 11 (4), 728734.CrossRefGoogle Scholar
Snyder, H.A. 1968 b Stability of rotating Couette flow. II. Comparison with numerical results. Phys. Fluids 11 (8), 15991605.CrossRefGoogle Scholar
Snyder, H.A. 1969 Change in wave-form and mean flow associated with wavelength variations in rotating Couette flow. Part 1. J. Fluid Mech. 35 (2), 337352.CrossRefGoogle Scholar
Tardos, G.I., Khan, M.I. & Schaeffer, D.G. 1998 Forces on a slowly rotating, rough cylinder in a Couette device containing a dry, frictional powder. Phys. Fluids 10, 335341.CrossRefGoogle Scholar
Taylor, G.I. 1923 Stability of a viscous liquid contained between two rotating cylinders. Phil. Trans. R. Soc. Lond. Ser. A 223, 289343.Google Scholar
Figure 0

Table 1. Critical shear Reynolds numbers ($Re_{s,c}$) and gap Reynolds numbers ($Re_{b,c}$) from investigations into Taylor–Couette flow for systems with a rotating inner cylinder and stationary outer cylinder. The aspect ratio, $\zeta = L/(r_o-r_i)$, and the radius ratio, $\eta = r_i/r_o$, shift the critical Reynolds numbers in Taylor–Couette flow (Chandrasekhar 1960; Donnelly & Fultz 1960; Deng et al.2010). The axial boundary conditions (BC) are known to have distinct effects on the development of Ekman vortices in short annular columns (Czarny et al.2003) as indicated in the table using free surface (FS) and stationary surface (SS). Also included are the results of experiments on neutrally buoyant particles by Ramesh et al. (2019) and this study.

Figure 1

Figure 1. Schematic of the Anton Paar MCR-302 rheometer with two different concentric cylinder experimental configurations. The powder cell configuration is equipped with a ‘smooth cylinder’ ($sc$) measuring tool and a ‘profile cylinder’ (‘pc’, or ‘rough’) measuring tool.

Figure 2

Table 2. Properties of liquids and solids for the gas-fluidized beds (FB), pure liquids (PL) inner cylinders of differing surface roughness (SR), neutrally buoyant particles (NB), negatively buoyant particles (UB) and positively buoyant particles (XB). The table lists the volumetric solid fraction ($\phi$), the particle diameter ($D$), the fluid density ($\rho _f$), the solid-particle density ($\rho _s$), the bulk density ($\rho _b$), the fluid dynamic viscosity ($\mu _f$) and the KD effective viscosity ($\mu _{eff}$) for each experiment using $\phi _m=0.61$.

Figure 3

Figure 2. Measured torque against rotational speed for Newtonian liquids (PL, a), neutrally buoyant particle suspensions (NB, b), negatively buoyant particle suspensions (UB, c) and positively buoyant particle suspensions (XB, d).

Figure 4

Figure 3. Measurements of the solid fraction $\phi$ as a function of normalized fluidization rate $q$ and rotational speed $\omega _i$ for FB1 with mean diameter $D = 113\ \mathrm {\mu }$m. At $\omega _i = 0$, intermittent bubbling can be seen within the bed volume starting at $q=1.1$. Beyond this flow rate, the estimated volumetric solid fraction, $\phi$, decreases with respect to $q$, as found for $\omega _i= 0.01$, 10 and 100 rad s$^{-1}$ in (b), (c) and (d).

Figure 5

Figure 4. Measured torque as a function of angular velocity and fluidization rate for the FB1 (a) and FB2 (b) experiments. At different values of $q$ and $\omega _i$, the torque measurements show quasistatic or viscous stress behaviour. Both FB1 and FB2 exhibit shear weakening near $q \approx 1$ and at intermediate rotational speeds.

Figure 6

Figure 5. Flow regimes identified from observations of the FB1 (a) and FB2 (b) experiments and analysis of the torque measurements. The flow regimes include quasistatic (DGF), viscous (FRS, SGF, FGM) and inertial (TTV) rheological behaviour depending on the normalized fluidization rate, $q$, and the inner cylinder rotational speed, $\omega _i$. Estimates of the torque growth order, $\alpha \approx d (\log T_z) / d (\log \omega _i)$, are illustrated in the colour scale. Critical values of $q$ and $\omega _i$ delineating the boundaries of each regime are estimated from the experiments.

Figure 7

Figure 6. The torque ratio, $\mathcal {G}_{cc}$, against shear Reynolds number, $Re_s$, for pure liquids (a), neutrally buoyant (b), underbuoyant (c) and overbuoyant (d) suspensions. The neutrally buoyant suspension experiments from Ramesh et al. (2019) as found in (b) were collected in a $\zeta \geq 5.5, \eta \geq 0.84$ annular cell. Newtonian fluids in circular Couette flow follow the black dashed line of $\mathcal {G}_{cc} = 1$, and power laws of order $\alpha - 1 \in [0,1]$ in a state of Taylor-vortex flow. Power laws of form $\mathcal {G}_{cc} = \beta Re_s^{\alpha -1}$ and orders $\alpha - 1 = 0.5$ and $0.7$ are shown as dotted–dashed and dotted black lines, respectively, where both assume $\beta = Re_{s,c}^{1-\alpha }$ for $Re_{s,c} = 70$.

Figure 8

Figure 7. Fitted Bingham plastic parameters as found in (5.4) against the normalized fluidization rate for the FB experiments; symbol legends are found in figure 4. Panels (b) and (d) show data for $q<2$. The yield stress, $\tau _y$, is shown relative to the average quasistatic shear stress with $\tau _{q=0} = 225$ Pa for FB1 and $160$ Pa for FB2. The yield stress measurements for the DGF flow regime in figure 5 ($q \leq 0.5$ for FB1 and $q \leq 0.8$ for FB2) follow the relationship $\tau _y = \tau _{q=0} (1 - q)$ as shown by the dashed black line in (a,b). Panels (c) and (d) show the plastic viscosity, $\mu _p$, against $q$.

Figure 9

Figure 8. Fitted Carreau fluid parameters for the FB experiments as found in (5.8) against the normalized fluidization with (b), (d) and (f) showing $q<2$. The initial viscosity, $\mu _0$, is shown in (a) and (b) and the relaxation time, $\lambda$, in (c) and (d). Panels (e) and (f) show the power index, $n$, which varies between $0$ and $1$ for shear-thinning Carreau fluids. The FB2 experiments show a maximum with $n=0.19$, whereas the FB1 experiments increase up to $n = 0.56$.

Figure 10

Figure 9. Dimensionless torque, defined in (5.1), against gap Reynolds number for all experiments. The black dashed lines show the analytical relationship between $G$ and $Re_b$ for Newtonian fluids in circular Couette flow, as specified in (5.2). Power-law relationships of form $G = \beta Re_b^{\alpha }$ are shown for $\alpha = 1.5$ (dotted–dashed) and $1.7$ (dotted) as black lines. In both cases, the scaling is taken to be $\beta = 4 {\rm \pi}r_i r_o^2 / [ (r_o^2 - r_i^2 ) (r_o - r_i) ] Re_{b,c}^{1-\alpha }$, where $Re_{b,c} = 50$.

Figure 11

Figure 10. Comparison between DGF fluidized beds and gravimetrically imbalanced suspensions using fitted Bingham models. Panel (a) features the torque ratio, $\mathcal {G}_{B}$, equal to the measured torque relative to that predicted by the Bingham model, plotted against the corrected gap Reynolds number, $Re_b^*$, which accounts for the evolving width of the shear region, $r_c-r_i$. The dotted black line shows the power-law relationship of order $\alpha - 1 = 0.7$, where the coefficient is $\beta = Re_{b,c}^{1-\alpha }, Re_{b,c} = 50$. Inset (b) shows the quasistatic stress ratio, $\tau ^*$, against the inverse Bingham number, $\varGamma$, where the black dashed line is the idealized relationship $\tau ^* = \varGamma + 1$. The UB1 and UB2 data use $\tau _y = 4.00$ and $1.97$ Pa and plastic viscosities $\mu _p = 2.49 \times 10^{-2}$ and $2.01 \times 10^{-2}\ \textrm {Pa}\ \textrm {s}$, respectively; the XB1 and XB2 data use $\tau _y = 2.84$ and $3.55$ Pa, and $\mu _p = 2.73 \times 10^{-2}$ and $4.73 \times 10^{-2}\ \textrm {Pa}\ \textrm {s}$.