Hostname: page-component-cd9895bd7-fscjk Total loading time: 0 Render date: 2025-01-05T13:45:50.530Z Has data issue: false hasContentIssue false

Flame acceleration and detonation transition in premixed and inhomogeneous supersonic flows

Published online by Cambridge University Press:  13 December 2024
Wandong Zhao
Affiliation:
College of Aerospace Science and Engineering, National University of Defense Technology, Changsha 410073, PR China
Ralf Deiterding
Affiliation:
AMROC CFD, Brookweg 167, 26127 Oldenburg, Germany
Xiaodong Cai
Affiliation:
College of Aerospace Science and Engineering, National University of Defense Technology, Changsha 410073, PR China
Jianhan Liang*
Affiliation:
College of Aerospace Science and Engineering, National University of Defense Technology, Changsha 410073, PR China
Xiong Yang
Affiliation:
College of Aerospace Science and Engineering, National University of Defense Technology, Changsha 410073, PR China
Mingbo Sun*
Affiliation:
College of Aerospace Science and Engineering, National University of Defense Technology, Changsha 410073, PR China
*
 Email addresses for correspondence: [email protected], [email protected]
 Email addresses for correspondence: [email protected], [email protected]

Abstract

The reactive Navier–Stokes equations with adaptive mesh refinement and a detailed chemical reactive mechanism (11 species, 27 steps) were adopted to investigate a detonation engine considering the injection and supersonic mixing processes. Flame acceleration and deflagration-to-detonation transition (DDT) in a premixed/inhomogeneous supersonic hydrogen–air mixture with and without transverse jet obstacles were addressed. Results demonstrate the difficulty in undergoing DDT in the premixed/inhomogeneous supersonic mixture within a smooth chamber. By contrast, multiple transverse jets injected into the chamber aid detonation transition by introducing perturbed vortices, shock waves and a suitable blockage ratio. Increasing distance between the leading shock and the flame tip impedes detonation transition due to an insufficient blockage ratio. The extremely perturbed distributions of fuel-lean and fuel-rich mixtures lead to more complicated flame structures. Also, a larger flame thickness appears in the inhomogeneous mixture compared with the premixed mixture, resulting in a lower combustion temperature. The key findings are that the DDT, detonation quenching and reinitiation are generated in the inhomogeneous supersonic mixture, but both DDT mechanisms are ascribed to a strong Mach stem with the Zel'dovich gradient mechanism. Additionally, the obtained results demonstrate that an intensely fuel-lean mixture (equivalence ratio = 0.15) results in a partially decoupled flame front. However, detonation reinitiation and subsequent self-sustained detonation occur when a fierce shock wave propagates through a highly sensitive mixture, even within a smaller and elongated area. Moreover, the inhomogeneous mixture also augments the propagation speed and detonation cell structure instabilities and delays the sonic point resulting from the extending non-equilibrium reaction.

Type
JFM Papers
Copyright
© The Author(s), 2024. Published by Cambridge University Press

1. Introduction

Flame acceleration (FA) and deflagration-to-detonation transition (DDT) are common phenomena in industrial scenarios, such as in coal mines and fuel leakage in fuel storage or pipelines (Oran, Chamberlain & Pekalski Reference Oran, Chamberlain and Pekalski2020; Fan & Xiao Reference Fan and Xiao2022). However, FA and DDT can also be employed within a detonation-based engine with high thermal efficiency thanks to its approximate isovolumic combustion, such as a pulse detonation engine (PDE) and rotate detonation engine (RDE) (Roy et al. Reference Roy, Frolov, Borisov and Netzer2004). Consequently, there has been significant interest in recent decades in understanding the processes and mechanisms of FA and achieving rapid detonation transition.

A most robust and effective approach to obtain the onset of detonation is to utilize FA without a direct initiation that requires highly transient energy deposition. Flame acceleration would generate a detonation transition condition in the region of the deflagration flame and leading shock wave (LSW). Consequently, solid objects such as a wedge, orifice, ring or Shchelkin spiral are applied to stimulate FA. The effects of blockage ratio (Br) (Goodwin, Houim & Oran Reference Goodwin, Houim and Oran2016), types of mixtures (Sun & Lu Reference Sun and Lu2020), types of solid obstacles (Xiao & Oran Reference Xiao and Oran2020) and arrangements of the solid object (Gamezo, Ogawa & Oran Reference Gamezo, Ogawa and Oran2007; Gamezo, Bachman & Oran Reference Gamezo, Bachman and Oran2021) on FA and DDT mechanisms were reported by many former studies. Concerning an air-breathing detonation engine, a large number of solid objects arranged within the combustion chamber would result in high pressure or propulsion loss (Cooper et al. Reference Cooper, Jackson, Austin, Wintenberger and Shepherd2002; Roy et al. Reference Roy, Frolov, Borisov and Netzer2004). Subsequently, transverse jet obstacles injected into the chamber have been introduced to shorten the DDT run-up time (TDDT) and DDT run-up distance (LDDT). After this idea was first proposed by Ahmed & Forliti (Reference Ahmed and Forliti2009) and Knox et al. (Reference Knox, Forliti, Stevens, Hoke and Schauer2011), the effects of the components of jet obstacle, jet pressure and jet size (Frolov et al. Reference Frolov, Smetanyuk, Aksenov and Koval’2017; McGarry & Ahmed Reference McGarry and Ahmed2017; Peng et al. Reference Peng, Huang, Deiterding, Luan, Xing and You2018, Reference Peng, Huang, Deiterding, You and Luan2019; Cheng et al. Reference Cheng, Zhang, Liu and Wang2020, Reference Cheng, Zhang, Liu and Wang2021a,Reference Cheng, Zhang, Ng, Liu and Wangb; Tarrant et al. Reference Tarrant, Chambers, Joo and Ahmed2020; Zhang et al. Reference Zhang, Qiao, Liang, Wang, Ding, Yang and Sun2024) on FA and DDT were studied comprehensively in recent years. It was found that the transverse jet obstacle has a dramatic impact on the performance in regard to triggering the detonation transition as it introduces a lot of turbulence flows and vortices and also provides an appropriate Br.

Many brilliant studies related to FA and DDT have been investigated in detail using numerical and experimental means when employing transverse jet obstacles. Nevertheless, the mixtures in most of the above studies are considered stoichiometric and in a quiescent state. By contrast, most mixtures in real-world accidents are maldistributions with large temperature, pressure and concentration gradients. As such, to address more practical scenarios, the effects of the non-uniform mixture with horizontal or transverse concentration gradients or inert gas on FA (Vollmer, Ettner & Sattelmayer Reference Vollmer, Ettner and Sattelmayer2012; Boeck, Hasslberger & Sattelmayer Reference Boeck, Hasslberger and Sattelmayer2014; Zheng et al. Reference Zheng, Kaplan, Houim and Oran2019; Saeid, Khadem & Emami Reference Saeid, Khadem and Emami2021), DDT (Ishii & Kojima Reference Ishii and Kojima2007; Vollmer et al. Reference Vollmer, Ettner and Sattelmayer2012; Ettner, Vollmer & Sattelmayer Reference Ettner, Vollmer and Sattelmayer2013; Zheng et al. Reference Zheng, Kaplan, Houim and Oran2019) and detonation propagation (Thomas, Sutton & Edwards Reference Thomas, Sutton and Edwards1991; Fang et al. Reference Fang, Hu, Teng, Jiang and Ng2017; Iwata, Nakaya & Tsue Reference Iwata, Nakaya and Tsue2017; Mi et al. Reference Mi, Higgins, Ng, Kiyanda and Nikiforakis2017; Han, Wang & Law Reference Han, Wang and Law2019; Iwata et al. Reference Iwata, Imamura, Akihama, Yamasaki, Nakaya and Tsue2021; Yao et al. Reference Yao, Yang, Teng, Chen and Wang2022) characteristics have been investigated through experimental and numerical tools.

Thomas et al. (Reference Thomas, Sutton and Edwards1991) conducted prior research on the detonation behaviour in the concentration gradient mixture that was generated by a sliding valve to control the diffusion time in a vertical tube. They revealed that FA would be generated in a fuel concentration gradient, resulting in a second shock wave, and the onset of detonation is more likely to occur in the smooth concentration, whereas the DDT may fail in the steeper concentration mixture. In Oran, Jones & Sichel's (Reference Oran, Jones and Sichel1992) study, a series of shock-detonation structures were revealed in the two layers formed by differently diluted hydrogen–oxygen mixtures and an inert gas when an overdriven detonation wave or Chapman–Jouguet (CJ) detonation propagates into these layers. Kuznetsov et al. (Reference Kuznetsov, Alekseev, Dorofeev, Matsukov and Boccio1998) experimentally found that the sharpness of the concentration gradient mixture with variable width in a less reactive acceptor mixture has a dramatic influence on the detonation propagation and reported that a donation wave propagates in the downstream tube without decay in the smooth gradient, but it always decays in a steep gradient. Sochet, Lamy & Brossard (Reference Sochet, Lamy and Brossard2000) presented experimental research on the detonability in a hemispherical mixture through the gaseous mixture diffusing to air due to molecular diffusion, gravity and turbulence. The limit time between the two explosion behaviours was proposed, and the limit time delay was studied according to the degree of the mixture concentration gradient by changing the mixture component and confining volume. A variation of detonation propagation cellular structure from a diamond to a parallelogram profile obtained by smoke foil was revealed in the inhomogeneous mixture in Ishii & Kojima's (Reference Ishii and Kojima2007) research. A calibrated one-step reaction model was employed to simulate the detonation propagation in low-activation and high-activation energy mixtures with a normal concentration gradient in Kessler, Gamezo & Oran's (Reference Kessler, Gamezo and Oran2011, Reference Kessler, Gamezo and Oran2012) research. The fuel-lean and fuel-rich mixtures near the wall resulted in a complex detonation front structure. Ettner et al. (Reference Ettner, Vollmer and Sattelmayer2013) numerically simulated the detonation front profile under the effect of a concentration gradient by using the Euler equation with eight species components, and they reported that, in a steep concentration, a Mach stem is formed and results in an asymmetric pressure load on the channel wall. Boeck et al. (Reference Boeck, Berger, Hasslberger and Sattelmayer2016) studied the detonation propagation in a mixture with a transverse concentration gradient. They suggested that single-head detonation wave propagation with an intense transverse wave is formed in the fuel-rich region, and a large amount of unburned mixture is generated. Meanwhile, Boulal, Vidal & Zitoun (Reference Boulal, Vidal and Zitoun2016) also experimentally studied the detonation quenching mechanism in an inhomogeneous mixture. The detonation quenching took place in the equivalence ratio (ER) distribution from a large lean to lean gradient, and they suggested that, with the inhomogeneous mixture, researchers should pay more attention to a detonation engine, especially the detonation dynamic that firstly quenches then the re-initiates it. In order to study the deficit of the flame propagation velocity and the flame front structure, Han et al. (Reference Han, Wang and Law2019) conducted a comprehensive study on the mechanisms of the detonation propagation in H2–O2 mixtures with linear transverse concentration gradients, and the cellular instability is increased in a high-concentration gradient, resulting in a more unburned H2 pocket downstream and a deficit of the detonation velocity owing to the non-equilibrium chemical reaction.

Recently, a tulip flame propagation in the concentration gradient mixture was revealed in the Sun & Lu (Reference Sun and Lu2020) work. In Song, Han & Cao's (Reference Song, Han and Cao2020) research, the detonation propagation in an inhomogeneous mixture that has a sinusoidal distribution was studied by employing a high mesh resolution and a detailed chemical reaction mechanism. Multi-head and single-head modes were formed in the low-concentration and high-concentration gradients, respectively. Besides that, by employing the OpenFOAM CFD toolbox, Jiang et al. (Reference Jiang, Pan, Weng, Li and Quaye2022a,Reference Jiang, Pan, Zhu, Li, Chen and Quayeb) also studied detonations that propagate into a 90-degree bifurcated channel with a transverse concentration gradient. The mechanisms of detonation diffraction, quenching and reinitiation were revealed.

Furthermore, the detonation propagation with inert gas has also received increasing attention. Mi et al. (Reference Mi, Higgins, Ng, Kiyanda and Nikiforakis2017) numerically conducted detonation propagation research in spatially inhomogeneous mixtures. The averaged propagation velocity was consistent with the theoretical CJ value when the non-uniformity was small, while it had a higher propagation velocity when there was enough of the inhomogeneous mixture. The detonation propagation in an inhomogeneous mixture with an inert layer was also investigated in Wang et al.'s (Reference Wang, Huang, Deiterding, Chen and Chen2020) work, and they found that the detonation reinitiation and detonation failure depend on the spacing and thickness between the two inert layers. Metrow, Gray & Ciccarelli (Reference Metrow, Gray and Ciccarelli2021) carried out experimental and numerical research on the detonation propagation in a mixture with inert gas. They reported that the detonation cellular size is just slightly larger than in the stoichiometric mixture. More recently, Tang-Yuk et al. (Reference Tang-Yuk, Mi, Lee, Ng and Deiterding2022) presented one- and two-dimensional investigations of the detonation transmission as it passes through the inert gas. They revealed that the critical thickness of the inert gas in the successful detonation reinitiation is related to the Zel'dovich–von Neumann–Döring (ZND) induction length and effective activation energy.

On the other hand, FA and DDT processes under the influence of the concentration gradient mixture are also studied. Vollmer et al. (Reference Vollmer, Ettner and Sattelmayer2012) researched the inhomogeneous mixture within a solid-laden combustion chamber. It was found that predicting DDT becomes more challenging in the inhomogeneous mixture than in the premixed mixture, and it depends on the configuration of the Br and the length scale of the chamber. Like Vollmer et al.'s (Reference Vollmer, Ettner and Sattelmayer2012) study, Boeck et al. (Reference Boeck, Hasslberger and Sattelmayer2014) also experimentally studied FA and DDT in the hydrogen/air inhomogeneous mixture, by controlling the diffusion time. It was found that a higher flame surface area is formed in the non-uniform mixture compared with the premixed mixture in the smooth chamber.

In contrast, within the solid chamber, the concentration gradient can either enhance or diminish the FA. Wang & Wen (Reference Wang and Wen2017) numerically studied the FA and DDT in an inhomogeneous mixture using the set-up proposed by Ettner et al. (Reference Ettner, Vollmer and Sattelmayer2013). They observed many unburned pockets behind the detonation wave, particularly in the areas with high hydrogen concentration. Azadboni et al.'s (Reference Azadboni, Heidari, Boeck and Wen2019) investigated the FA and DDT processes in both premixed and inhomogeneous mixtures, both experimentally and numerically. They obtained similar results, showing that transverse concentration gradients can either enhance or reduce FA.

Recently, Zheng et al. (Reference Zheng, Kaplan, Houim and Oran2019) conducted a high mesh resolution simulation of the FA and DDT in non-uniform mixtures. They found that, in the inhomogeneous mixture, there is continuous mixing after the flame front that results in a larger flame surface area than that in the premixed mixture, but the local heat release rate is low. More recently, the FA and DDT mechanisms in the inhomogeneous mixture were numerically studied in chambers with different obstacle spacing through the OpenFOAM CFD toolbox (Saeid, Khadem & Emami Reference Saeid, Khadem and Emami2021). It was found that the DDT is only formed in the inhomogeneous mixture in the 30 % Br chamber with a 15 % average concentration, and at the 30 % average concentration, the DDT takes place in both premixed and inhomogeneous mixtures. Further on, the effect of diffusion time on the FA and DDT in the non-uniform mixture was also investigated in Saeid et al.'s (Reference Saeid, Khadem, Emami and Ghodrat2022) work, and they found three different regimes of the DDT mechanism in the fuel-rich non-uniform mixture.

Amid the works mentioned above, most mixtures can be considered as one-dimensional gradients in parallel or perpendicular directions. Nevertheless, a real-world mixture would have a more uneven distribution with more complicated temperature, pressure and ER gradients rather than an artificial distribution with a linear or sinusoidal relationship. The concentration mixture is usually set in a static state. However, in practical scenarios, the inhomogeneous mixture may have a high velocity before mixture ignition, especially in the PDE and RDE.

Consequently, the FA or detonation propagation in real-world scenarios may be complicated, and the onset of detonation may pose greater challenges (Zhao et al. Reference Zhao, Deiterding, Liang, Cai and Wang2023a). Most investigations related to the flame front structure focus on the time evolution during the detonation propagation stage. However, there is a noticeable lack of studies on the DDT mechanism and flame propagation in the inhomogeneous supersonic mixture with perturbed concentration gradients. Therefore, studying the FA, DDT, detonation quenching and propagation is crucial when considering a more realistic detonation engine under ejection and mixing processes.

For these reasons, the motivation of the current investigation is to understand the effect of inhomogeneous supersonic mixtures with perturbed concentration gradients considering the ejection and mixing processes on the FA, DDT, detonation quenching and detonation propagation under a supersonic flow condition. The flame front structures during the FA period in the premixed and inhomogeneous mixtures are reported in detail. The successful and unsuccessful DDT mechanisms in inhomogeneous mixtures are also revealed comprehensively. Moreover, the key findings of the DDT, detonation quenching and detonation reinitiation evolution are revealed. The corresponding critical ER for detonation quenching and DDT mechanisms is also reported. Learning from the previous studies, multiple transverse jet obstacles, as discussed above, are employed to activate the DDT in the inhomogeneous supersonic mixture.

Of note, here, we focus solely on a single case involving an inhomogeneous supersonic mixture undergoing the mixing process with Ma = 1.5 (where Ma is the Mach number), derived from a practical air-breathing PDE with a new type of inlet valve. The unsteady, reactive and compressible Navier–Stokes (N-S) equations are employed to carry out the mixing, FA, DDT and detonation propagation in a two-dimensional (2-D) combustion chamber with a detailed chemistry reaction mechanism and a high mesh resolution deploying a structured adaptive mesh refinement (AMR) technique. The solver is based on the AMROC (AMR object-oriented C++), successfully applied to resolve FA and detonation propagation (Cai et al. Reference Cai, Deiterding, Liang and Mahmoudi2017, Reference Cai, Liang, Deiterding, Mahmoudi Larimi and Sun2018; Peng et al. Reference Peng, Huang, Deiterding, Luan, Xing and You2018). The chemical reaction is modelled by an Arrhenius-type equation from a detailed chemical reaction mechanism with 11 species and 27 reactive steps proposed by Burke et al. (Reference Burke, Chaos, Ju, Dryer and Klippenstein2012).

2. Physical and numerical models

2.1. Computational configuration

Schematic illustrations of the configuration and boundary conditions are provided in figure 1 for both the premixed and inhomogeneous mixtures, considering the fuel injection and mixing processes under supersonic flow conditions. Both configurations feature inlet isolation and combustion chamber sections. Two hot spots, located in the upper and lower walls between the connection parts, are employed to ignite the premixed and inhomogeneous mixtures after closing the inlet valve. This approach has been widely adopted in DDT simulations in former studies (Gamezo, Ogawa & Oran Reference Gamezo, Ogawa and Oran2008; Goodwin et al. Reference Goodwin, Houim and Oran2016; Peng et al. Reference Peng, Huang, Deiterding, Luan, Xing and You2018; Xiao & Oran Reference Xiao and Oran2020; Gamezo et al. Reference Gamezo, Bachman and Oran2021). The premixed hydrogen–air mixture and incoming air with temperature T = 281.7 K and pressure p = 0.09 MPa are filled into the combustion chamber of configurations A and B, respectively. The detailed parameters of the initial premixed mixture are given in table 1. The theoretical parameters of the post-shock, CJ state and laminar flame properties for the currently premixed mixture are also illustrated in table 1, which are obtained from Cantera (Goodwin, Moffat & Speth Reference Goodwin, Moffat and Speth2009) using Burke et al.'s (Reference Burke, Chaos, Ju, Dryer and Klippenstein2012) mechanism. Of note, the detonation cellular size is calculated by the empirical correlation model provided by Ng, Ju & Lee (Reference Ng, Ju and Lee2007) that considers the ZND reaction zone as well as the reaction structure.

Figure 1. Schematic illustration of the combustion configuration and boundary conditions for an air-breathing PDE with (configuration A) premixed and (configuration B) inhomogeneous mixtures in a supersonic flight condition.

Table 1. The thermodynamic properties of the premixed hydrogen–air mixture and the corresponding CJ parameters.

Regarding configuration A, two cases without and with transverse jet obstacles are selected during the FA after the mixture ignition, corresponding to case 1 and case 2. Concerning configuration B, two groups of head-on transverse fuel jets are located in the isolation section when t = 0.2–1.04 ms. After the end of the mixing process, the hydrogen–air inhomogeneous mixture is formed in the combustion chamber under the supersonic incoming air. Similarly, as in configuration A, two cases without and with transverse jet obstacles are also considered during the FA, corresponding to case 3 and case 4. All parameters of the current cases are illustrated in table 2. Details of components for the incoming mixture, fuel jet and jet obstacle for different cases are listed in table 3.

Table 2. The current cases employed for the FA and DDT.

Table 3. Parameters of component molar ratio of incoming air, fuel jet and transverse jet obstacles for the employed cases.

The domain sizes of the isolation section and combustion chamber are Li × Ly = 180 mm × 20 mm and Lc × Ly = 800 mm × 20 mm, respectively. The fuel jet pressure is 1.0 MPa. The width of the fuel jet is 0.2 mm. Four groups of head-on transverse jet obstacles are employed, which are adopted to introduce a host of turbulent flows and also provide a suitable Br by acting as solid objects, as reported by previous studies (Knox et al. Reference Knox, Forliti, Stevens, Hoke and Schauer2011; Cheng et al. Reference Cheng, Zhang, Liu and Wang2021a; Zhao et al. Reference Zhao, Liang, Deiterding, Cai and Wang2021). The pressure of the first and second groups of jet obstacles is p = 0.6 MPa and p = 1.2 MPa to accommodate the pressure gain combustion in the FA process. The transverse jet obstacles are successively injected into the combustion chamber after the mixture ignition. The operation times for the first, second, third and fourth head-on jets in case 4 are 1.1–1.3 ms, 1.15–1.4 ms, 1.3–1.5 ms and 1.4–1.6 ms, respectively. The width of all jet obstacles is d = 2 mm. The fuel jet exit gap is defined as S 1, and the distance between the centre of the hot spot and the nearest fuel jet is defined as S 2, as illustrated in figure 1(b). The values of S 1 and S 2 are set as S 1 = 20 mm and S 2 = 30 mm, respectively. The spacing interval between the jet obstacles is S 3 = 90 mm.

Concerning the boundary condition (BC), a supersonic velocity (U = 504.76 m s−1) inlet BC is first applied on the right side of the computational domain to simulate the mixing process. In the next process, after closing the inlet valve, the velocity inlet BC is changed to a no-slip and adiabatic wall owing to the air-breathing PDE operation during the FA and DDT processes. Furthermore, two hot spots with temperature T = 2500 K and slightly high-pressure p = 0.5 MPa are employed to ignite the premixed and inhomogeneous mixtures. The pressure inlet BC is utilized for all jets. A no-slip and adiabatic wall BC is adopted in the upper and lower walls of the computational domain. It is worth mentioning that the adiabatic wall BC may result in a slightly faster FA compared with the isothermal wall BC. The detailed results of the effect of the isothermal wall on the FA and DDT can be found in former literature (Han et al. Reference Han, Huang, Gu, Wang and Law2020; Yhuel, Ribert & Domingo Reference Yhuel, Ribert and Domingo2023). The current study focuses on the premixed and non-uniform mixtures; hence, we do not consider the isothermal wall's influence. Additionally, an outflow BC is specified on the right side of the computational domain.

2.2. Governing equations and numerical methods

The unsteady reactive 2-D N-S equations are employed to solve the multiple species flows, FA and DDT processes in the current study, and the governing equations are given as follows with a conservation flux vector (Cai et al. Reference Cai, Liang, Deiterding, Mahmoudi Larimi and Sun2018):

(2.1)\begin{equation}\frac{{\partial \boldsymbol{U}}}{{\partial t}} + \frac{{\partial ({\boldsymbol{F}_x} - {\boldsymbol{G}_x})}}{{\partial x}} + \frac{{\partial ({\boldsymbol{F}_y} - {\boldsymbol{G}_y})}}{{\partial y}} = {S_{chem}},\end{equation}

where U is the vector of the state parameter. Here, ${\boldsymbol{F}_x}$ and ${\boldsymbol{F}_y}$ denote the convection fluxes, and the quantity ${S_{chem}}$ is the source term that is given by the mixture's chemical reaction (Zhao et al. Reference Zhao, Deiterding, Liang, Wang, Cai and Duell2023b). These vector-valued quantities are

(2.2ad)\begin{align}\boldsymbol{U} = \left[ \begin{array}{c} {\rho_i}\\ \rho u\\ \rho v\\ \rho E \end{array} \right],\quad {\boldsymbol{F}_x} = \left[ \begin{array}{c} {\rho_i}u\\ \rho {u^2} + p\\ \rho uv\\ u(\rho E + p) \end{array} \right],\quad {\boldsymbol{F}_y} = \left[ \begin{array}{c} {\rho_i}v\\ \rho uv\\ \rho {v^2} + p\\ v(\rho E + p) \end{array} \right],\quad {S_{chem}} = \left[ \begin{array}{c} {{\dot{\boldsymbol{\omega}}}_i}\\ 0\\ 0\\ 0 \end{array} \right],\end{align}

in which u, v and e are the horizontal velocity, the normal velocity and total energy, respectively (Cai et al. Reference Cai, Liang, Deiterding, Mahmoudi Larimi and Sun2018). Also, $\rho$ in (2.2) denotes the component density and i equals 1, 2, 3 …, Nsp, with Nsp denoting the total number of species. The total energy E is given by

(2.3)\begin{equation}E = \sum\limits_{n = 1}^{{N_{sp}}} {{Y_i}} {h_i} - \frac{p}{\rho } + \frac{1}{2}({u^2} + {v^2}),\end{equation}

where ${h_i}$ denotes the specific enthalpy of the species and p is obtained by a partial pressure equation for each species with perfect gas theory that reads

(2.4)\begin{equation}p = \sum\limits_{n = 1}^{{N_{sp}}} {{p_i}} = \sum\limits_{n = 1}^{{N_{sp}}} {\rho {Y_i}{R_i}T} ,\quad \textrm{with}\;{R_i} = R/{W_i},\end{equation}

in which R denotes the universal gas constant, Wi is the molar mass of the ith species and ${\dot{\boldsymbol{\omega}}_i}$ in (2.2) are the mass generation rates obtained from a specific chemical reaction mechanism J as

(2.5)\begin{equation}{\dot{\boldsymbol{\omega}}_i} = \sum\limits_{j = 1}^J {(v_{ji}^r - v_{ji}^f)\left[ {k_j^f\prod\limits_{n = 1}^{{N_{sp}}} {{{\left( {\frac{{{\rho_n}}}{{{W_n}}}} \right)}^{v_{jn}^f}}} - k_j^r\prod\limits_{n = 1}^{{N_{sp}}} {{{\left( {\frac{{{\rho_n}}}{{{W_n}}}} \right)}^{v_{jn}^f}}} } \right]} ,\quad i = 1, \ldots ,{N_{sp}},\end{equation}

where $v_{ji}^r$ and $v_{ji}^f$ denote the stoichiometric coefficients of forward and reverse chemical reactions. The elementary chemical reaction with an Arrhenius equation was adopted to evaluate the reaction rates (Ivanov, Kiverin & Liberman Reference Ivanov, Kiverin and Liberman2011; Cai et al. Reference Cai, Liang, Deiterding, Mahmoudi Larimi and Sun2018; Han et al. Reference Han, Huang, Gu, Wang and Law2020) as

(2.6)\begin{equation}k_j^{f/r} = A_j^{f/r}{T^{\beta _j^{f/r}}}\exp \left( { - \frac{{E_j^{f/r}}}{{RT}}} \right).\end{equation}

The chemical kinetics package CHEMKIN is utilized to evaluate equations (2.5) and (2.6) in accordance with a specific chemical reactive mechanism. The quantities ${\boldsymbol{G}_x}$ and ${\boldsymbol{G}_y}$ in (2.1) represent the diffusion fluxes (Cai et al. Reference Cai, Liang, Deiterding, Mahmoudi Larimi and Sun2018)

(2.7)\begin{align}{\boldsymbol{G}_x} & = (\rho {D_i}(\partial {Y_i}/\partial x),{\tau _{xx}},{\tau _{xy}},u{\tau _{xx}} + v{\tau _{xy}} - {q_x}),\end{align}
(2.8)\begin{align}{\boldsymbol{G}_y}& = (\rho {D_i}(\partial {Y_i}/\partial y),{\tau _{yx}},{\tau _{yy}},u{\tau _{yx}} + v{\tau _{yy}} - {q_y}).\end{align}

The shear stress terms in (2.6) and (2.7) are further governed by

(2.9ac)\begin{align}{\tau _{xx}} = \mu \left( {\frac{4}{3}\frac{{\partial u}}{{\partial x}} - \frac{2}{3}\frac{{\partial v}}{{\partial y}}} \right),\quad {\tau _{yx}} = {\tau _{xy}} = \mu \left( {\frac{{\partial v}}{{\partial x}} + \frac{{\partial u}}{{\partial y}}} \right),\quad {\tau _{yy}} = \mu \left( {\frac{4}{3}\frac{{\partial v}}{{\partial y}} - \frac{2}{3}\frac{{\partial u}}{{\partial x}}} \right),\end{align}

in which $\mu$ is the dynamic viscosity of the mixture. The heat fluxes in (2.7) and (2.8) are determined by

(2.10)\begin{align}{q_x} & ={-} k\partial T/\partial x - \rho \sum\limits_{i = 1}^n {{h_i}{D_i}} \partial {Y_i}/\partial x,\end{align}
(2.11)\begin{align}{q_y} & ={-} k\partial T/\partial y - \rho \sum\limits_{i = 1}^n {{h_i}{D_i}} \partial {Y_i}/\partial y,\end{align}

where k and D are the mixture-averaged thermal conductivity and mass diffusivities, respectively. The coefficients for the dynamic viscosity $\mu$ and the thermal conductivity k of the mixture are calculated by the formulas of Bird, Stewart & Lightfoot (Reference Bird, Stewart and Lightfoot2006) and Mathur, Tondon & Saxena (Reference Mathur, Tondon and Saxena1967). The mass diffusion coefficients for an averaged molecular species are modelled by a simplified equation that is inversely proportional to the pressure. The transport variables, including viscosity, conductivity and diffusion, are calculated by the CHEMKIN-II package.

2.3. Numerical methods and chemical reaction mechanism

The governing equations mentioned above were solved in the open-source codes in the AMROC with the AMR approach. In terms of the numerical scheme, a hybrid Roe–HLL (Harten–Lax–van Leer) Riemann solver in AMROC was utilized to discretize the upwind fluxes to avoid some unphysical total density and internal energy near vacuum as a result of the Roe linearization (Deiterding Reference Deiterding2003; Zhao et al. Reference Zhao, Liang, Deiterding, Cai and Wang2022a,Reference Zhao, Wang, Gao, Wang and Zhub). By setting a refactor function, the MUSCL (monotone upwind scheme for conservation laws) scheme together with the Minmod limiter was employed for the reconstruction of the conservation flux vector. The central difference scheme was used to discretize the diffusion term in (2.1). Concerning the chemical reaction source, the Godunov splitting scheme with first-order accuracy was applied, which has enough accuracy compared with Strang splitting, as reported by Deiterding (Reference Deiterding2003). For the time discretization, a semi-implicit generalized Runge–Kutta scheme with fourth-order precision was adopted for the integration of the chemical kinetics (Kaps & Rentrop Reference Kaps and Rentrop1979), and a dynamic time step was assumed under a fixed Courant–Friedrichs–Lewy number of 0.18. The code has been successfully applied to resolve FA (Peng et al. Reference Peng, Huang, Deiterding, Luan, Xing and You2018; Zhao et al. Reference Zhao, Deiterding, Liang, Cai and Wang2023a,Reference Zhao, Deiterding, Liang, Wang, Cai and Duellb), detonation propagation, supersonic combustion (Cai et al. Reference Cai, Deiterding, Liang and Mahmoudi2017, Reference Cai, Liang, Deiterding, Mahmoudi Larimi and Sun2018; Peng et al. Reference Peng, Huang, Deiterding, You and Luan2019; Wang et al. Reference Wang, Huang, Deiterding, Chen and Chen2020) and RDE (Yuan et al. Reference Yuan, Zhou, Mi and Ng2019; Luan et al. Reference Luan, Huang, Gao and You2022) simulations.

Concerning the chemical reaction, the FA, DDT and detonation combustion include a wide range of pressures (0.9–100 bar) and temperatures (280–3500 K), hence such a wide range makes it difficult to predict the simulation. However, the hydrogen–air mechanism proposed by Burke et al. (Reference Burke, Chaos, Ju, Dryer and Klippenstein2012) gives a good prediction of the ignition delay time in such a wide range of temperatures and pressures. The hydrogen–air chemical reaction of Burke et al.'s (Reference Burke, Chaos, Ju, Dryer and Klippenstein2012) mechanism includes 11 species and 27 steps. The detailed species contain H2, O2, H2O, H, O, OH, HO2, H2O2, N2, CO and CO2. All reaction rates are built on the Arrhenius-type equations of (2.6). The specific details can be found in the original references. Such a hydrogen–air reaction mechanism is also similar to the San Diego mechanism (Boivin et al. Reference Boivin, Jiménez, Sánchez and Williams2011). The ignition delay time has been widely verified in previous literature when coping with the wide range of temperature and pressure combustions for the FA and detonation simulations (Ogawa, Gamezo & Oran Reference Ogawa, Gamezo and Oran2013; Han et al. Reference Han, Huang, Gu, Wang and Law2020). The current Burke et al. (Reference Burke, Chaos, Ju, Dryer and Klippenstein2012) hydrogen–air mechanism has been extensively employed for FA, DDT and detonation simulation in previous literature (Haghdoost et al. Reference Haghdoost, Edgington-Mitchell, Nadolski, Klein and Oberleithner2020; Li et al. Reference Li, Wang, Xu and Kong2021; Fan & Xiao Reference Fan and Xiao2022; Zhao et al. Reference Zhao, Deiterding, Liang, Cai and Wang2023a,Reference Zhao, Deiterding, Liang, Wang, Cai and Duellb). In addition, Burke et al.'s (Reference Burke, Chaos, Ju, Dryer and Klippenstein2012) chemical reaction mechanism has been implemented into the AMROC framework, and we have also successfully employed it in our former FA and DDT simulation (Zhao et al. Reference Zhao, Liang, Deiterding, Cai and Wang2021, Reference Zhao, Liang, Deiterding, Cai and Wang2022a, Reference Zhao, Deiterding, Liang, Wang, Cai and Duell2023b, Reference Zhao, Fan, Deiterding, Li, Liang and Yang2024).

To validate the numerical model for handling FA and DDT related to shock waves, AMR and chemical reactions, we conducted validation simulations and compared them with experimental results. These simulations included shock-induced combustion under supersonic flow and FA and DDT within a solid-laden chamber. Additionally, we performed tests on three-dimensional (3-D) simulations of FA and DDT with transverse jets. Detailed results of the verified cases can be found in Appendices A–C.

2.4. Mesh resolution test in flame acceleration and DDT

An initial grid size of 4900 × 100 is utilized to discretize the computational domain, introducing the same mesh resolution in the x and y directions as dx = dy = 2.0 × 10−4 m. The governing equations were resolved in the AMROC deploying AMR. Furthermore, mesh resolution tests for FA and DDT simulation in the premixed mixture were conducted here, focusing on TDDT and LDDT. Three different refinement levels and refinement factors of L3 (2, 2), L4-1 (2, 2, 2) and L4-2 (2, 4, 2) were considered, generating a maximum refined mesh sizes of 5.0 × 10−5 m, 2.5 × 10−5 m, 1.25 × 10−5 m, respectively, corresponding to meshes A, B and C. Note that a slightly high ignition pressure for hot spots is utilized to ignite the mixture. The axial positions of the flame front during the FA and DDT in three different mesh resolution cases are superimposed in figure 2, where the DDT occurs at points A, B and C, respectively. It is observed that the flame front position in mesh B and mesh C almost collapsed into one with time evolution. There is a 2.36 % deviation of TDDT in the case of mesh B compared with mesh C, as shown at points B and C, but LDDT values in mesh B and mesh C are almost the same. Additionally, the obtained result also demonstrates that the DDT mechanism is the same in the L4-1 and L4-3 cases. Consequently, the mesh resolution in the fourth level, L4-1, is sufficient to resolve the FA and DDT.

Figure 2. The (a) flame front position and the corresponding (b) flame front propagation velocity with time evolution for three mesh resolution cases.

These mesh resolution test results are consistent with former research on DDT simulations (Gamezo et al. Reference Gamezo, Ogawa and Oran2007, Reference Gamezo, Ogawa and Oran2008; Kessler, Gamezo & Oran Reference Kessler, Gamezo and Oran2010). More recently, Xiao & Oran (Reference Xiao and Oran2020) also reported that more than 10 cells per laminar flame thickness and 5 cells per half-reaction thickness were enough to deal with all flow and flame propagation characteristics associated with FA and DDT, and the corresponding DDT mechanism could also be obtained adequately. Our previous DDT studies also confirmed this (Zhao et al. Reference Zhao, Deiterding, Liang, Wang, Cai and Duell2023b, Reference Zhao, Fan, Deiterding, Li, Liang and Yang2024).

The mesh resolution in L4-1 generates 14.4 cells per laminar flame thickness. As such, to balance the computing resource and simulation accuracy, the fourth level, L4-1, is employed for the current simulations having large time and space scales (1 m), generating 31.36 million cells using a uniform mesh under the current mesh resolution.

It is worthwhile mentioning that the computational mesh is dynamically refined by the AMR technique, which is mainly controlled by two threshold criteria. The first criterion of the surrounding cell differences of a scalar quantity is applied to the temperature, pressure and density, while the second criterion of estimating the local truncation error by Richardson extrapolation is employed for the species mass fractions. Detailed AMR threshold selections are given in Appendix B. All cases listed in table 2 were computed using the Tianhe-1 supercomputer, utilizing 660 cores for the computations. Each case required approximately 220 000 cpu × h.

3. Results and discussion

3.1. Flame acceleration and DDT in the supersonic mixture

3.1.1. Mixing process

The mixture generally has a non-uniform state with temperature, pressure and ER gradients (Boulal et al. Reference Boulal, Vidal and Zitoun2016) in practical detonation-based engines. Here, considering a more realistic engine, the mixing process is simulated under the supersonic air flow and transverse fuel injection before the mixture ignition. The mixing process time is set as t = 0.84 ms, and two groups of transverse fuel jets with high stagnate pressure are injected into the chamber, as presented in figure 1(b). As a result, an inhomogeneous hydrogen–air mixture is generated in the combustion chamber under the influence of the main supersonic flow. The snapshots of the mass fraction of H2 during the mixing process under the main flow are given in figure 3. Thanks to the high dynamic pressure of the main flow, the fuel jet is deflected rapidly because of the low dynamic pressure ratio between the fuel and air. As a blockage effect is generated by the fuel jets, the penetration depth is gradually increasing. With the aid of Kelvin–Helmholtz (K-H) instability, vast fuel vortices propagate in the downstream chamber. Under the influence of the flow instability and diffusion effect, the uniformity of the hydrogen–air mixture is augmented. Since a high Br and low diffusion effect is formed in the 2-D simulation, a high mass fraction of H2 in the upper and lower walls is observed.

Figure 3. Variations of H2 mass fraction during the mixing process under supersonic incoming air: (at = 0.22, (b) t = 0.26, (c) t = 0.34, (d) t = 0.50, (e) t = 0.70 and ( f) t = 0.82 ms.

After the end of the mixing process, the distributions of mixture fraction along the horizontal and transverse directions in the selected domain of x = 0–40 cm are plotted in figure 4. The mixture fraction is defined as follows:

(3.1)\begin{equation}f = \frac{{(1/2{M_H})({Y_H} - {Y_{H,2}}) - (1/{M_O})({Y_O} - {Y_{O,2}})}}{{(1/2{M_H}({Y_{H,1}} - {Y_{H,2}})) - (1/{M_O})({Y_{O,1}} - {Y_{O,2}})}},\end{equation}

where M denotes molecular weight, Y represents elements mass fraction and subscripts 1 and 2 denote fuel jet and incoming air, respectively. Note that the molecular and mass fraction of H in the fuel jet is 1, while the molecular and mass weight of O is 0.

Figure 4. The mixture fraction distribution in the (a) horizontal and (b) transverse dictions at the end of the mixing process.

In figure 4(a), a highly fluctuating value is formed in the chamber between 0 and 1, while with the mixing propagating into the downstream chamber, the uniformity of the mixture is augmented. In the transverse direction, the mixture fraction still has a lot of fluctuations even in the downstream tube, and the mixture fraction value is in the range of 0.2–0.6. There is a more uniform mixture in the central domain of the chamber in contrast to the upper and lower walls. Part of the reason is that this is a 2-D simulation without a 3-D influence that has a larger diffusion effect and lower Br. Generally, the mixtures in the horizontal and transverse directions have high-concentration gradients and are far from the stoichiometric state.

3.1.2. Global flame acceleration characteristics

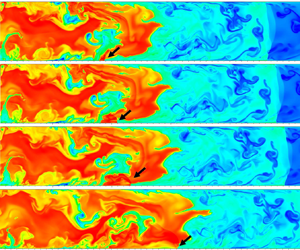
After the completion of the mixing process, the combustion evolution in the inhomogeneous mixture without fluid obstacles is depicted in figure 5, corresponding to case 3. At t = 1.09 ms, two regions with high temperatures are formed in the upper and lower walls, attributed to the hot spot ignition. The lower-temperature areas in figure 5(a) indicate the presence of fuel vortices. As seen in box A2, a substantial number of lower-temperature products are generated with the highly turbulent flow since there are a lot of fuel-rich mixtures due to the K-H and Rayleigh–Taylor (R-T) instabilities. Nevertheless, the combustion temperature significantly decreases (box A2), caused by the high H2 concentration in the upstream chamber. As the flame propagates, the temperature increases from 1700 to 2400 K; see box B1, owing to the turbulent mixing reaction, while the temperature in the flame tip is still low (circle C in figure 5e). The temperature distribution in the combustion product is, therefore, extremely uneven. Next, with the flame front further propagating, it elongates steadily, and the combustion temperature is increased; see box D in figure 5f), and therefore, the unburned mixture is preheated due to the increasing intensity of the LSW. However, the detonation transition fails because of the long-time FA and dramatically inhomogeneous mixture.

Figure 5. Snapshots of the temperature contours during the FA in the inhomogeneous supersonic mixture without transverse jet obstacles (case 3): (a) t = 1.09, (b) t = 1.12, (c) t = 1.24, (d) t = 1.54, (e) t = 1.70 and ( f) t = 1.95875 ms.

Referring to the former literature (Peng et al. Reference Peng, Huang, Deiterding, Luan, Xing and You2018; Zhao et al. Reference Zhao, Deiterding, Liang, Cai and Wang2023a), to activate DDT, the jet obstacles are employed in the premixed mixture to stimulate DDT. Four groups of transverse jets are utilized (case 2). The temperature variations are given in figure 6. After the jet is injected into the chamber, a perturbed penetration and oblique shock wave are formed, preheating the unburned mixture. Furthermore, when the flame front propagates in this region, the transverse jet also provides a blockage effect to some degree as a solid obstruction. The flame–turbulence interaction is observed accordingly, resulting in a conspicuously increasing flame surface area (box A). Influenced by K-H and R-T instabilities, a corrugated flame front is generated, feeding back to the FA (Gamezo et al. Reference Gamezo, Ogawa and Oran2008).

Figure 6. Time sequence of temperature fields showing the propagation of the flame–turbulence, flame–shock and shock–shock interactions during the FA and DDT in case 2. SW-shock wave, IHS-auto-ignited hot spot, DW-detonation wave: (a) t = 0.2450, (b) t = 0.2750, (c) t = 0.3200, (d) t = 0.3800, (e) t = 0.4550, ( f) t = 0.5000, (g) t = 0.5150, (h) t = 0.5300, (i) t = 0.5450 and ( j) t = 0.5600 ms.

Consequently, the LSW is strengthened, causing a preheated zone with high temperature at t = 0.5000 ms. The third group of the transverse jets is deflected by the main flow, and an auto-ignited hot spot is generated as manifested in figure 6fh) as a result of the intensive shock wave. Consequently, the onset of detonation occurs because the hot spot ignition evolves into detonation combustion at the upper boundary wall. This DDT mechanism is caused by the flame-kernel ignition through shock–boundary interaction, as reported in Goodwin's study, where a slightly higher Br was employed (Goodwin et al. Reference Goodwin, Houim and Oran2016). Such a DDT mechanism is also reported in Grogan & Ihme's (Reference Grogan and Ihme2015, Reference Grogan and Ihme2017) studies and it is found that the detonation transition though the flame-kernel ignition is due to the shock wave amplification by coherent energy release (SWACER) mechanism. Finally, the detonation wave propagates into the downstream chamber, as shown in figure 6(ij).

The transient temperature contour and the corresponding AMR distribution in case 2 are given in figure 7. The AMR works well in large temperature and pressure gradients, especially in the regions having shock wave, flame front and jet obstacles. These AMR regions also dynamically move as the flame tip and shock wave evolve. Hence, the current AMR threshold values are sound.

Figure 7. The transient temperature contour and the corresponding AMR distribution: (a-i) t = 0.37 and (b-i) t = 0.40 ms.

Additionally, a comparison of the flame tip versus time in case 1 and case 2 is plotted in figure 8. The flame front position in the premixed mixture without a jet is larger than the case with the transverse jet in the incipient stage. This is due to the Br influence stemming from the transverse jet when a host of fluids is injected into the chamber, introducing a high-pressure region at the beginning of the flame front, which has a negative influence on FA at the initial time. This result is also reported in our previous study (Zhao et al. Reference Zhao, Liang, Deiterding, Cai and Wang2022a).

Figure 8. Evolution of axial position of the flame front in the cases for premixed mixtures with and without transverse jet obstacles.

By contrast, the transverse jets provide vast perturbed vortices and a moderate Br, introducing plenty of flame–turbulence, flame–shock and shock–shock interactions and increasing the flow instabilities and the flame surface area, as discussed above. Subsequently, the deflagration flame evolves into detonation rapidly, as marked by circle A. Therefore, in the later stage, many transverse jets ejecting into the supersonic mixture benefit DDT when the flame front approaches the perturbed region. This is consistent with the previous research where one transverse jet obstacle is adopted in the static mixture (Frolov et al. Reference Frolov, Smetanyuk, Aksenov and Koval’2017; McGarry & Ahmed Reference McGarry and Ahmed2017; Peng et al. Reference Peng, Huang, Deiterding, Luan, Xing and You2018; Cheng et al. Reference Cheng, Zhang, Liu and Wang2021a). Furthermore, the present jet obstacles further introduce an oblique shock wave due to the supersonic flow, which is more reliable in increasing the intensity of the FA and LSW (Zhao et al. Reference Zhao, Deiterding, Liang, Cai and Wang2023a).

Consequently, inspired by case 2, four groups of head-on jets are also employed in the inhomogeneous supersonic mixture. To increase the uniformity of the mixture, the jet obstacles are composed of air. The FA and detonation transition snapshots are given in figure 9. The temperature variations in incipient time are similar in the above case. The combustion temperature is significantly as low as 1800 K; see box A1.

Figure 9. Snapshots of the temperature fields during the FA and DDT under the influence of transverse jet obstacles (case 4). F-T – flame-turbulence, SW – shock wave, LSW – leading shock wave: (a) t = 1.06, (b) t = 1.105, (c) t = 1.165, (d) t = 1.255, (e) t = 1.285, ( f) t = 1.345, (g) t = 1.405, (h) t = 1.435, (i) t = 1.475, ( j) t = 1.5225, (k) t = 1.53125 and (l) t = 1.570 ms.

Nevertheless, as the air jets are injected into the chamber, as seen in figure 9(c), oblique shock waves form. An apparent flame–turbulence interaction is observed when the flame reaches the air jet regions (see figure 9df), increasing the flame surface area dramatically, and then the flame speed augments accordingly. Furthermore, the combustion temperature is increased to 2700 K (boxes B1 and B2) due to the increasing uniformity of the mixture when introducing a lot of perturbed jet flows. As a result, preheated zones are generated ahead of the flame tip because of the strong shock wave. Many shock waves focus on and collide with the oblique shock wave generated by the transverse jet. These features result in prominent preheated zones, as shown in figure 9(gi). The elongated flame front (circle C) generates a dramatically increased flame surface area, resulting in a high energy release ratio (Gamezo et al. Reference Gamezo, Ogawa and Oran2008) and a significantly increased combustion temperature in contrast to figure 5 without jet obstacles. A stronger LSW is formed subsequently. The LSW preheats the turbulent jet, as figure 9(ik) shows. Finally, a localized explosion point is formed against the lower wall, as figure 9(i) shows. Detailed information on the DDT and the subsequent detonation propagation will be discussed in §§ 3.3 and 3.4.

For the sake of revealing the failure of the DDT in the premixed and inhomogeneous mixtures without transverse jet obstacles, the positions of the flame front, LSW and the corresponding flame front propagation velocity are superimposed in figure 10(a,b), respectively. The FA in the premixed supersonic mixture can be classified into four stages. Stage I (0.2–0.33 ms): the flame front propagation velocity is decreased rapidly due to the influence of the supersonic flow. When it is close to the flow speed of the unburned mixture, the flame front goes into stage II (0.33–0.58 ms), and the flame propagation speed continues to increase as the flame surface area increases. In the next stage (0.58–0.68 ms), the flame propagation speed remains stable, which can be considered as a deflagration flame because its speed approaches half of the CJ speed. It is observed that the speed is around 1000 m s−1, which is also close to the speed of sound in the combustion products. This means that DDT usually occurs when the flame tip propagation speed is close to the speed of sound in the product gas because there is no continuous transition from the deflagration combustion in the lower branch to the detonation model along the Hugoniot curve (Zhao et al. Reference Zhao, Liang, Deiterding, Cai and Wang2022a, Reference Zhao, Deiterding, Liang, Wang, Cai and Duell2023b).

Figure 10. The positions of the flame front, LSW and the corresponding flame propagation velocity as a time sequence in the (a) premixed (case 1) and (b) non-uniform (case 3) supersonic mixture. The blue curve denotes the flame front propagation velocity.

Nevertheless, after that, due to the lack of flow instability and blockage effect within the smooth chamber and an increasing length between the flame tip and LSW (Lfs), the flame propagation speed decreases steadily. Hence, as reported in former DDT simulations (Oran et al. Reference Oran, Chamberlain and Pekalski2020; Gamezo et al. Reference Gamezo, Bachman and Oran2021), a constant Lfs, namely, the situation of a shock–flame complex (Gamezo et al. Reference Gamezo, Ogawa and Oran2008; Oran et al. Reference Oran, Chamberlain and Pekalski2020), is an essential condition to activate the detonation transition. In contrast, an increasing Lfs results in a failure of detonation initiation. As such, DDT is difficult to form in a deflagration flame within a smooth tube despite being in a premixed supersonic mixture without considering a perturbation configuration.

In figure 10(b), flame propagation in the inhomogeneous mixture can be classified into three stages without stage VI in the inhomogeneous mixture. Stage I is the ignition time, and it has a high flame propagation speed but reduces abruptly owing to the extremely fuel-rich mixture. Under the effect of the main flow, the flame–turbulence interaction increases again in stage II. In stage II, the propagation speed continues to increase as time evolves, whereas the required time is increased from 0.3 ms to 0.6 ms compared with the FA ratio in the premixed mixture as plotted in figure 10(a); hence, the increasing ratio of the flame propagation speed is reduced and has more fluctuation. After that, in stage III, the flame speed approaches half of the CJ value, whereas its speed slightly decreases as Lfs increases. Hence, the detonation transition is still a failure.

3.2. Comparisons of flame structure in the premixed and inhomogeneous mixtures

In this part, the FA and the flame front structure between the premixed and inhomogeneous mixtures that occurred in case 1 and case 3 are discussed here. The details of the flame propagation in both cases are also investigated to elucidate the factors contributing to the failure of the DDT.

3.2.1. Premixed mixture

In the incipient stage of the FA in the premixed supersonic mixture for case 1, a typical flame front structure and the corresponding temperature variation at t = 0.3100 ms are given in figure 11. A breached flame tip is formed due to the two hot spot ignitions in the upper and lower walls, which subsequently merge in the middle region. Analysis of species mass reveals that the HO2 radical forms early in the front of the flame structure, followed by O, H and OH, initiating a chain-branching chemical reaction. In contrast, the peak value of HO2 is a lower order than the peak value of H, O and OH radicals. The peak mass fraction of HO2 reaches 1.5 × 10−5. As it is depleted rapidly, the concentrations of H, O and OH are increased significantly, accomplished by an increasing temperature from 306 to 2000 K; hence, the chain-branching chemical is continued through the consumption of HO2 and H2O2. The peak value of H, O and OH radicals reach 0.0039, 0.0217 and 0.0087 with the mass fraction of H2 and O2 decreasing through the branching reactions of H + O2 = O + OH and O + H2 = H + OH. As a result, the active reaction zone is around a range between 0.525 and 0.60, which has a single layer. This flame front structure is in agreement with that of a premixed flame, as discussed by Law (Reference Law2010). In the middle region of the flame front structure, due to the flow instability, some residual mixture exists in the downstream product; see circle B1 in figure 11(a 2). Thus, the flame front structure is more complicated, and the reaction front has two layers. As a result, there is a hump in the variations of species mass fraction and temperature curves.

Figure 11. Variations of temperature and species mass fraction across the flame front (a) near the wall and (b) middle region at the incipient FA for the premixed mixture in case 1 (t = 0.3100 ms).

As the flame front further propagates into a stable state with maximum flame propagation speed, typical flame structures in the premixed mixture, including the species mass information at different flame positions at t = 0.6800 ms, are plotted in figure 12. A lot of wrinkled flames appear in the flame front. Figure 12(a,b) gives the mass fractions at y/Ly = 0.125 and 0.625, corresponding to lines B1 and B2, respectively. The species curves show the same result: the HO2 forms early in the front of the flame structure, followed by H and O, resulting in main chain-branching reactions and mixture burning.

Figure 12. Variations of temperature and species mass fraction across the flame front in (a) lower (0.25/2.0) and (b) upper (1.25/2.0) regions at the incipient FA in case 1 at t = 0.6800 ms.

Furthermore, as the mass fraction of HO2 reaches a peak value of 3.2 × 10−4, it is consumed sharply, with the mass augmentations of OH, O and H to peak values of O = 0.018, H = 0.0037 and OH = 0.009. Hence, the chain-branching reactions keep going, forming a gradual increase in H2O product and an abrupt decrease in H2 and O2. Thus, the energy release ratio increases, increasing the combustion temperature from 428 to 2200 K. Due to the much higher pressure and temperature in the preheated mixture, the flame thickness of 1.2 × 10−3 m is much lower compared with the initial stage.

In contrast, the grid resolution can still achieve 48 points per flame thickness, which is sufficient to resolve the combustion characteristics. At the flame position y/Ly = 0.625, the species mass fraction is similar to that at y/Ly = 0.125. The HO2 mass fraction appears early at the flame tip, followed by the H, O and OH radicals. With the rapid consumption of HO2, H2 and O2, the OH and product of H2O increase, leading to an increase in the combustion temperature.

3.2.2. Inhomogeneous supersonic mixture

Concerning the FA in the inhomogeneous supersonic mixture in case 3, the flame structure information at t = 0.1540 ms, around the two finger flame tips (y/Ly = 0.125, 0.75), is shown in figure 13. In the lower flame structure, the mass fraction is hugely uneven. In the flame tip, the HO2 radical appears first, followed by H, O and OH, with the mass fraction of HO2 augments, resulting in the increased temperature from 327 to 1420 K. But the increased ratio of the temperature is relatively lower than that in the premixed mixture. Much unburned H2 is still left behind with a high mass fraction of H2 = 0.01. As such, the second combustion layer continues in the downstream product so that another flame structure layer with a hump shape appears downstream. With the HO2 increasing again, accompanied by the increases of H, O and OH radicals, the mass fractions of H2 and O2 are subsequently consumed rapidly, further increasing the temperature to 2010 K. The combustion process is, therefore, more complicated in contrast to the premixed mixture. Hence, the temperature contour near the lower wall exhibits an extreme maldistribution.

Figure 13. Variations of temperature and species mass fraction across the flame front in (a) lower (0.25/2.0) and (b) upper (1.5/2.0) regions during FA for the inhomogeneous mixture in case 3 (t = 0.1540 ms).

Line A2 has just one layer of the flame front structure. The species mass fraction shows that the peak values of H and O are 0.0072 and 0.0018, respectively, so that the H mass fraction is almost two times that of the premixed mixture due to the fuel-rich mixture. Thereby, a significantly lower peak value of OH mass fraction of 0.00078 appears, contributed by the lack of O2. Hence, this results in an extreme fuel-rich reaction, leading to a lower increased temperature from 325 to 1380 K. Consequently, many unburned fuels are left behind in the downstream chamber with a high mass fraction, H2 = 0.014. Due to the fuel-rich combustion, a large flame thickness is generated when compared with the premixed mixture.

Figure 14 further gives more detailed information on the temperature, hydrogen, ER and flame front structure with species information along the y-direction position at t = 1.54 ms. To picture the variation of temperature, hydrogen, ER and the radical element distribution, 3-D plots are presented on the right side, where the x-axis is in a range of from 30.0 cm to 36.0 cm, while discrete y-axis coordinates are selected at 0.25, 0.5, 0.75, 1.25. 1.5 and 1.75 cm. The corresponding specific values are plotted in the z-axis direction of the 3-D plot.

Figure 14. The (a) temperature, (b) equivalation ratio (ER) and flame (cg) front structure distribution at t = 0.15400 ms for the inhomogeneous supersonic mixture (case 3) along different horizontal positions in the y-direction.

A high fluctuation of the temperature distribution is observed after the flame front, especially in the regions near the lower and upper walls. A gradually increased temperature is noted near the upper and lower walls. Hence, the combustion reaction is still continued in the downstream product. Although there is a much larger flame front surface area than in the premixed mixture, the temperature at the front is still significantly lower. In Zheng et al.'s (Reference Zheng, Kaplan, Houim and Oran2019) study, the FA occurred in an ER gradient normal to the flame propagation direction, and they also found that there is a larger surface area in the inhomogeneous mixture compared with the homogenous mixture, but this does not result in a high energy release ratio. This is due to the large surface area mainly located in the fuel-lean regions. Therefore, the temperature highly depends on the ER distribution.

As shown in the H2 and ER maps, the upper wall has a much thicker fuel layer, and the ER distribution is highly uneven. A high fuel-rich condition exists in the upper half-domain, and the ER value is around 2.5. Yet, a much lower fuel concentration is observed near the middle domain (ER is approximately 0.8), resulting in two colour distributions in the combustion product. The ER map of the combustion product includes grey (ER = 0) and brown $(\textrm{ER} = \infty )$, representing that the fuel and oxidizer have been consumed, respectively. The H, O and OH mass fraction distributions also yield a high fluctuation in the downstream combustion. There is a high mass fraction of H in the upper combustion product, while a high O mass fraction is formed in the lower combustion product. Such a feature further leads to a local reaction in the downstream tube due to a further mixing process between the H2 and O2, especially in the connecting region between grey and brown; see circles C1 and C2 in figure 14(c). The HO2 concentration mainly occurs in the flame front structure, with a maximum of 2.0 × 10−5. It is an essential species for initiating induction reaction, and a much thicker induction reaction zone is formed in the fuel-rich layer. Consequently, a much lower temperature occurs in the upper flame front. In general, the temperature contour distribution is particularly uneven.

To sum up, the flame front structure in the inhomogeneous supersonic mixture is more complicated, characterized by multiple reaction layers compared with the premixed mixture. Additionally, the flame thickness in the inhomogeneous mixture is much higher than that in the premixed mixture. The presence of extreme fuel-lean and fuel-rich mixtures with a perturbed distribution results in a significantly lower combustion temperature with a highly uneven distribution, generating a lower FA ratio. However, the combustion temperature is further increased due to the continuous reaction in the downstream flame resulting from the turbulent mixing process.

3.3. Mechanisms of DDT and detonation reinitiation

The former experimental and numerical studies have extensively investigated the DDT mechanism and detonation propagation in the premixed mixture (Austin Reference Austin2003; Radulescu et al. Reference Radulescu, Sharpe, Law and Lee2007; Mahmoudi & Mazaheri Reference Mahmoudi and Mazaheri2011, Reference Mahmoudi and Mazaheri2015; Mahmoudi et al. Reference Mahmoudi, Karimi, Deiterding and Emami2014). In comparison, the successful DDT mechanism, detonation extinction, reinitiation and propagation in a more practical inhomogeneous flow mixture have not been adequately studied, especially in the detonation extinction that occurred in the limited ER region. It is vital for a detonation-based engine, as suggested by Boulal et al.'s (Reference Boulal, Vidal and Zitoun2016) experimental research, especially for an engine with non-premixed fuel injection or non-perfect mixing. As confirmed by their suggestion, numerical simulation is a significant tool to reveal these. Hence, the DDT mechanism and detonation propagation in the inhomogeneous supersonic mixture in case 4 are discussed here.

3.3.1. Mechanism of onset of detonation

Here, more instantaneous snapshots of the temperature and pressure variations surrounding the explosion point are given in figure 15, corresponding to case 4. A localized explosion point takes place, and it propagates into the downstream lower wall, as seen in the series of circles A. Meanwhile, a high-pressure region is generated in the lower wall accompanied by the detonation wave (see circles B), forming a transverse wave shedding from the detonation front.

Figure 15. Snapshots of the temperature and pressure contours showing the propagation of the explosion point for case 4: (a1) t = 1.56375, (b1) t = 1.56625, (c1) t = 1.56875 and (d1) t = 1.57500 ms.

To thoroughly picture the mechanism of detonation transition, figure 16 shows the transient variations of temperature, pressure and OH before forming the localized explosion point with a time step of 0.00125 ms. A remarkable shock wave is generated at the lower wall and propagates in the downstream mixture (figure 16a 2), forming an intense Mach stem subsequently (figure 16b 2), where the maximum pressure reaches 3.0 MPa. In addition, the fierce shock wave also results in a high combustion temperature (circle A1). As a result, a localized explosion point forms in the lower wall (figure 16c 1), forming a high explosion pressure and OH concentration (circles B1 and C1). The onset of detonation is triggered, propagating in the downstream mixture. Hence, the strong Mach stem is responsible for the current DDT mechanism, which generates a high-pressure and high-temperature spot sufficient for the detonation transition.

Figure 16. Contours of the temperature, pressure and OH variation illustrating the activation of the onset of DDT in case 4. SW – shock wave, MS – Mach stem, EP – explosion point: (a1) t = 1.56125, (b1) t = 1.56250 and (c1) t = 1.56375 ms.

Figure 17 presents a schematic depiction elucidating the progression of the shock wave and flame front evolution observed during the DDT initiation, as depicted in figure 16. Preceding the advancement of the flame front, a robust shock wave propagates downstream, with the reflected shock wave rebounding off the lower wall, thereby engendering a Mach stem configuration and thereby inducing a reactive gradient. Following this, a high-temperature explosion point manifests on the upper wall, subsequently evolving into an explosion point. Thus, the inception of the Mach stem structure emerges as a pivotal procedural facet in this phenomenon.

Figure 17. Physical illustration of the shock wave (SW), Mach stem (MS) and flame front evolution during the onset of detonation. DW – detonation wave.

The DDT mechanism is caused by the gradient mechanism (Oran et al. Reference Oran, Chamberlain and Pekalski2020). This mechanism is also reported in Gamezo et al.'s (Reference Gamezo, Ogawa and Oran2008) and Goodwin et al.'s (Reference Goodwin, Houim and Oran2016) studies, where a high Br was employed in an obstacle-laden chamber, resulting in an intense Mach stem after undergoing a series of FA.

The current DDT mechanism can be further quantitively analysed by the pressure and temperature records, as shown in figure 18, where the red curves represent the temperature, and the other lines denote the corresponding pressure variations along the x direction along the lower wall. Note that a rapidly increased pressure value from 1.17 to 2.85 MPa (circle A) is formed thanks to the Mach stem; see figure 16(b 2), and the temperature of the unburned mixture is preheated to 820 K, resulting in a reactive gradient. Under these conditions, the DDT is activated with a localized explosion point with high pressure and temperature values.

Figure 18. Variations of temperature and the corresponding pressure during the onset of detonation in case 4 along the x-direction in the lower wall, the red lines detonate the temperature. The transient time sequences are t = 1.5575 ms, 1.55875 ms, 1.5600 ms, 1.56125 ms, 1.56250 ms, 1.56375 ms and 1.56625 ms.

3.3.2. Mechanism of detonation reinitiation

The next flame propagation is further presented in figure 19. The detonation wave does not survive and is instead extinguished. As illustrated, the detonation wave is decoupled from a flame and a shock wave, as shown in the lower flame front and box A in the temperature and pressure contours, respectively. A gradually reduced temperature and pressure form. As such, a detonation quenching occurs. This is attributed to the extreme fuel-lean mixture in the downstream chamber. As shown in the series of boxes A in the ER map, a significantly lower ER value of around 0.15 exists ahead of the flame front. Such a lower ER distribution is caused by the air transverse jet obstacles located in x = 36 cm, which introduce a large amount of air, as presented in figure 9j). As a result, sustained detonation propagation highly depends on a suitable ER.

Figure 19. Snapshots of temperature, pressure and corresponding ER in the detonation extinction for case 4. SW – shock wave: (a1) t = 1.58125, (b1) t = 1.58375 and (c1) t = 1.59375 ms.

A donation reinitiation is noted after the flame further propagates into the downstream chamber; see figure 20. First, a remarkable Mach stem is generated against the lower wall; see circle B1. It propagates into the region having a high ER value (circle C2), located in the lower boundary wall compared with the middle part in circle C1. Then, a localized explosion appears (figure 20b 1), propagating in the lower wall region with a high ER value; see the series of arrows in the temperature contours. Finally, more detonation combustion is formed at t = 1.64125 ms where more areas with a high ER mixture exist. Therefore, sustaining detonation highly relies on a continuously suitable mixture. Although there is a quite small and elongated region of the suitable and sensitive mixture, the detonation wave propagation can still survive.

Figure 20. The detonation reinitiation rendered by temperature, pressure and ER evolution in the inhomogeneous supersonic mixture (case 4): (a1) t = 1.61875, (b1) t = 1.62625, (c1) t = 1.63125 and (d1) t = 1.64125 ms.

To elucidate the flow structure comprehensively, a schematic representation delineating the evolution of the shock wave, LSW and flame front antecedent to detonation initiation is provided in figure 21. Herein, the blue-coloured region demarcated along the lower periphery signifies a composition conducive to sensitivity. Initially, an incident shock wave propagates downstream adjacent to the bottom wall. Subsequent to this propagation, a Mach stem is engendered, subsequently precipitating the localization of an explosion point. This critical juncture serves as the impetus for detonation combustion, which subsequently propagates throughout the sensitive and elongated region.

Figure 21. Schematic illustration of the flow structure before the onset of detonation. SW – shock wave, SM – sensitive mixture, LSW – leading shock wave, MS – Mach stem, LEP – localized explosion point.

The temperature and pressure records during the detonation reinitiation along the x direction from t = 1.62125 to t = 1.63375 ms are also superimposed in figure 22, where the red curves denote the temperature, and the other lines represent the pressure. Increasing pressure and temperature have occurred; see arrow A, where the peak pressure and temperature reach T = 1504 K and p = 1.95 MPa at t = 1.6225 ms, respectively. Hence, under the high pressure and temperature conditions post-shock, the onset of detonation is triggered at t = 1.62375 ms. Next, the detonation propagates downstream (figure 20d 1). The DDT mechanism is, therefore, the same as the first localized explosion point, as discussed in figures 16 and 17, which is caused by the gradient mechanism because of the intense Mach stem. Such a DDT mechanism is consistent with the result reported by Lee, Knystautas & Yoshikawa's (Reference Lee, Knystautas and Yoshikawa1980) experiment study, referred to as the SWACER mechanism.

Figure 22. Temperature variations and the corresponding pressure during the detonation reinitiation in case 4 along the x direction in the lower wall. The transient time sequences are t = 1.62125 ms, 1.6225 ms, 1.62375 ms, 1.625 ms, 1.62625 ms, 1.62875 ms, 1.63125 ms and 1.63375 ms.

In summary, the inhomogeneous supersonic mixture exhibits more dynamic characteristics, including the detonation transition, quenching and reinitiation, which primarily stem from the extremely inhomogeneous ER distributions. The results indicate that the detonation cannot be sustained when the ER falls below 0.15. The DDT mechanism is ascribed to the Zel’dovich gradient mechanism (Zel'Dovich et al. Reference Zel'Dovich, Librovich, Makhviladze and Sivashinsky1970) thanks to a strong Mach stem forming in the boundary wall. As such, in the smooth tube, the DDT mechanism resembles previous numerical and experimental findings, where a robust Mach stem was generated in a solid-laden chamber with a high Br in the FA (Boeck et al. Reference Boeck, Hasslberger and Sattelmayer2014; Goodwin et al. Reference Goodwin, Houim and Oran2016) and DDT scenarios (Vollmer et al. Reference Vollmer, Ettner and Sattelmayer2012; Zheng et al. Reference Zheng, Kaplan, Houim and Oran2019) occurred in the hydrogen–air or methane–air mixtures. Moreover, the detonation reinitiation mechanism has the same DDT mechanism. Still, the formation of the DDT requires a highly sensitive mixture region so that a discretized low ER mixture can be utilized to block the detonation propagation. Yet, the detonation reinitiation can be activated later when the intense shock wave propagates in a highly sensitive mixture.

3.4. Detonation propagation in inhomogeneous supersonic mixture

3.4.1. Global propagation characteristics

The initial detonation propagation in the supersonic non-uniform mixture is illustrated in figure 23. A smooth flame front scenario is generated owing to the overdriven detonation and low increased temperature ratio between the detonation wave and post-LSW. A sudden lower-temperature region in the leading flame front is formed; see box A1; however, an increased temperature subsequently forms when the detonation wave impacts the upper wall, generating a strong Mach stem. A curved flame appears in box A2.

Figure 23. Snapshots of the detonation propagation with temperature evolution in the inhomogeneous supersonic mixture (case 4). TW – transverse wave, SL – slip line, TP – triple point, SW – shock wave: (a) t = 1.65125, (b) t = 1.6625, (c) t = 1.67125 and (d) t = 1.67750, (e) t = 1.7, ( f) t = 1.7075, (g) t = 1.715 and (ht = 1.7225 ms.

Besides that, a remarkable transverse wave occurs in the downstream combustion product. A host of vortices appear in the slip line due to the Richtmyer–Meshkov (R-M) instability (Mahmoudi et al. Reference Mahmoudi, Karimi, Deiterding and Emami2014; Mahmoudi & Mazaheri Reference Mahmoudi and Mazaheri2015); see figure 23(d). A triple point is also generated. A curved flame with a much lower temperature appears again (box A3), but an increased temperature is formed later when it propagates in the downstream region (box A4). Multiple triple points (box A5) and a partially smooth flame front (box A6) with lower temperature form in the leading flame tip; see figure 23(g,h). However, the combustion temperature in the downstream product is much higher than the initial overdriven detonation propagation. This is reasonable because the uniformity of the upstream mixture is much higher. Moreover, the consumption of the unburned pocket is further continued in the downstream flame through the diffusion effect and turbulent mixing generated by the K-H and R-M instabilities, as suggested by previous investigations (Austin Reference Austin2003; Radulescu et al. Reference Radulescu, Sharpe, Lee, Kiyanda, Higgins and Hanson2005; Radulescu et al. Reference Radulescu, Sharpe, Law and Lee2007; Mahmoudi & Mazaheri Reference Mahmoudi and Mazaheri2015; Han et al. Reference Han, Wang and Law2019). In general, dramatically complex dynamic behaviours of the detonation propagation, including the curved flame and cellular instability in the inhomogeneous supersonic mixture, occur.

For quantitively evaluating the detonation propagation, the flame front position at the embryonic stage and the corresponding averaged flame front propagation velocity with time evolution near the lower wall (y/Ly = 0.1/2.0), middle region (y/Ly = 1.0/2.0) and upper wall (y/Ly = 1.9/2.0) are plotted in figure 24(a,b), respectively. The detonation flame front first appears at the lower wall, whereas when it propagates in the upper domain and impacts the upper wall, the axial position of the flame front moves quickly, as presented in the temperature contours during the stage from t = 1.65625 to 1.68625 ms. However, the flame propagation in the middle region is more complicated under the influence of the fuel-lean mixture. Notably, there is a deviant velocity oscillation, especially in the lower and middle areas of the flame front. The average velocity in the upper region is gradually decreasing owing to the decrease of detonation overdriven degree. In the middle region flame, the flame propagation velocity decreases rapidly from 2700 to 2200 m s−1 at the developing stage but rapidly increases to 2700 m s−1 during the period of t = 0.1675–1.6825 ms and then gradually decreases to 2200 m s−1. The propagation velocity in the lower region has a similar trend.

Figure 24. The (a) axial position of the flame front and the (b) corresponding averaged flame front velocity at different y-direction positions near the lower wall (y/Ly = 0.1/2.0), middle region (y/Ly = 1.0/2.0) and upper wall (y/Ly = 1.9/2.0) in case 4.

After that, a more regular oscillation of the averaged velocity occurs with high amplitude, but the average velocity in three different positions is close to 2300 m s−1. Hence, the inhomogeneous mixture increases the instability of the propagation speed. In Han et al.'s (Reference Han, Wang and Law2019) study, a fluctuating average detonation velocity with a different amplitude was also observed in a concentration gradient with a transverse and linear distribution. They reported a much higher velocity oscillation in the fuel-rich region compared with the fuel-lean region. In the current study, an oscillation with high amplitude is also observed in the lower wall mixture, which has a high ER, but a small amplitude appears in the middle region with low ER.

Furthermore, by subtracting the flow velocity of the mixture (around 500 m s−1), the detonation propagation velocity is approximately 1800 m s−1. The theoretical CJ velocity for detonation propagation in the uniform mixture is 1974.95 m s−1, which is calculated by Cantera when using Burke et al.'s (Reference Burke, Chaos, Ju, Dryer and Klippenstein2012) chemical reaction mechanism. Consequently, there is around an 8.8 % deficit in the average propagation velocity compared with the theoretical CJ speed. This velocity deficit is consistent with previous research reported by Kessler et al. (Reference Kessler, Gamezo and Oran2012) and Han et al. (Reference Han, Wang and Law2019). The flame front is, therefore, inclined remarkably under the influence of velocity deficit with different amplitudes due to the inhomogeneous mixture.

3.4.2. Flame front characteristics in detonation quenching and reinitiation

To elucidate the macroscopic phenomena mentioned above, such as the curved flame front and velocity oscillation, figure 25 provides more detailed information on the flame propagation associated with the temperature, pressure, ER and combustion product during the initial time. The combustion ER map also consists of two colours, grey and brown, representing that the fuel and oxidizer are depleted, respectively, as discussed before. At t = 1.65625 ms, a lower ER value (0.15) exists ahead of the flame front in the upper region (box C1), but a more sensitive mixture is generated in box C2 so that there is a transverse concentration gradient. Moreover, a concentration gradient is also formed in the longitudinal direction. Hence, the ER distributions become highly complex, resulting in more propagation dynamic characteristics.

Figure 25. Snapshots of over-driven detonation propagation rendered by (first column) temperature, (second column) pressure, (third column) ER and (fourth column) product showing the decupled detonation front (case 4). DW – detonation wave, MS – Mach stem, TW – transverse wave, DC – decoupled flame, DR – detonation reinitiation: (a1) t = 1.65625, (a2) t = 1.65875, (a3) t = 1.66250, (a4) t = 1.66500, (a5) t = 1.66750 and (a6) t = 1.67125 ms.

First, an intense Mach stem is formed after the overdriven detonation wave collides with the upper wall, introducing a high-pressure region and intense detonation combustion. The transverse wave is observed subsequently; see figure 25(b 2). When the detonation wave propagates in the lower ER region, a partial flame front is decoupled with a flame and a shock wave, rapidly forming a curved flame and lower-temperature region (box A1). This is also called partial detonation quenching. The current result is in accordance with previous literature when the detonation propagates in a lower ER region from a lean to a leaner gradient. In Boulal et al. (Reference Boulal, Vidal and Zitoun2016) experimental investigation, detonation quenching occurs in an inhomogeneous mixture with a lean-to-leaner distribution. In their research, a reduced number of transverse waves is observed and even the detonation quenching occurs in the fuel-lean mixture, where the ER value is around 0.2. Hence, this value is close to the current research. It is noted that the detonation quenching does not mean combustion extinction. A detonation reinitiation occurs later. As reported by Zheng et al.'s (Reference Zheng, Kaplan, Houim and Oran2019) study, the detonation wave was rapidly decoupled into a shock and a flame when the flame front travelled through an extremely inhomogeneous mixture. Han et al. (Reference Han, Wang and Law2019) also numerically reported the decoupled flame front. They suggested the LSW is decoupled from the chemical reaction layer due to the quite fuel-lean mixture with a lower OH mass fraction. However, in their works, the inhomogeneous mixture has a linear transverse concentration gradient. A more complicated mixture is not considered.

In the current decoupled detonation flame front associated with partial detonation quenching, an accumulation of increased pressure is yielded in this front, as presented by box B1 in figure 25(b 4). When the intense shock wave propagates into these regions with a higher ER value (boxes C3 and C4), the detonation reinitiation is triggered in the partially flame front; see figure 25(b 5). The detonation reinitiation was also reported in the previous experimental study, where the detonation decay could reinitiate in the non-uniform mixture with 14.0 %–19.0 % hydrogen (Kuznetsov et al. Reference Kuznetsov, Alekseev, Dorofeev, Matsukov and Boccio1998). This value is close to the current result. Then, a more uniform flame front is observed since the flame front propagates in a region having high and uniform ER regions. Such a result also contributes to an uneven distribution of the combustion product of H2O, and a gradually increasing penetration region with a lower H2O mass fraction is generated, as shown in circles D1–D4. Accompanying the formation of detonation reinitiation, a high mass fraction of H2O is yielded again in the flame front; see circles D5 and D6. Therefore, the complicated dynamic characteristics, including the curved flame front, partially decoupled flame front and detonation reinitiation, are combined results in the high and low sensitive mixtures along the parallel and transverse directions and transverse wave.

Figure 26 depicts a schematic representation detailing the intricate evolution of detonation wave bending, quenching and subsequent reinitiation. Here, the blue region signifies combustion products, while the blue line traces the path of the detonation wave. Additionally, the red, green and yellow areas correspond to high, low and optimal ERs, respectively. When the detonation wave advances into the low ER region, the combustion expansion fails to sustain a self-sustaining detonation, owing to fuel scarcity. Consequently, this results in partial bending and decoupling of the detonation wave front. However, upon traversing into the optimal ER region represented by yellow, the detonation wave reignites, thereby restoring its flat-fronted propagation.

Figure 26. Physical illustration of the curved detonation wave, partially decoupled detonation and detonation re-initiation. DW – detonation wave, DQ – detonation quenching, DR – detonation reinitiation.

To draw the influence of an inhomogeneous mixture on the detonation propagation speed, figure 27 gives the instantaneous flame propagation velocity near the (red line) lower and (blue line) upper walls at different periods, corresponding to figure 25(a 2,a 3), respectively. All flame front propagation velocities have a high oscillation within 1750–3500 m s−1 due to the inherent unstable feature of the detonation wave (Austin Reference Austin2003). A rather higher amplitude of the flame propagation velocity in the upper wall is formed compared with the lower flame propagation velocity. This contributes to the intense Mach stem, which increases the intensity of the detonation wave.

Figure 27. Transient detonation propagation velocity near (red curve) lower wall (y/Ly = 0.1/2.0) and (blue curve) upper wall (y/Ly = 1.9/2.0) in case 4 at different periods (a) t = 1.65875–1.66045 ms, (bt = 1.6625–1.6642 ms.

3.4.3. Detonation front structure and instability

To compare the differences between the decoupled flame and detonation wave at t = 1.6625 ms, the flame front structure is superimposed in figure 28(c,d), and for lines B (y/Ly = 1.4/2.0) and C (y/Ly = 1.9/2.0) in figure 28(a). A very fuel-lean mixture is formed with a value of H2 = 0.007. After the shock wave, the H, O and OH increase rapidly, followed by HO2 and H2O2 radicals, while the peak values of H and O radicals are pretty small at H = 0.00033 and O = 0.0122. Subsequently, with the consumption of H2 and HO2, less energy release is formed, resulting in a lower increased temperature from 1054 to 1430 K. Hence, the main contribution of the increasing temperature is formed by the decoupled LSW. To thoroughly analyse the connection between the decoupled flame front's shock wave and flame structure, figure 29 gives the temperature, pressure and OH variations along line B. As demonstrated, after the intense post-shock period, the temperature of the fresh mixture is increased rapidly; then a lower increasing ratio appears within the chemical reaction. Here, a rather lower peak mass fraction of OH = 0.0056 appears. Moreover, the distance between the LSW and the reaction front is around 0.4 mm so that the LSW is decoupled from the reaction layer due to the extreme fuel-lean mixture. As a result, the simulation of the extreme fuel-lean and fuel-rich mixtures needs a detailed hydrogen–air chemistry reaction mechanism because of the complex dynamic behaviours, especially for the detonation quenching and partially decoupled flame front.

Figure 28. The (a) temperature contour, (b) OH contour, and the corresponding mass fraction of the flame front structure near the (c) decoupled detonation flame (line B, y/Ly = 1.4/2.0) and (d) upper wall (line C, y/Ly = 1.9/2.0) at t = 1.6625 ms in case 4.

Figure 29. The temperature, pressure and OH variations along line B for the decoupled detonation front at t = 1.6625 ms (see figure 28a).

In addition to the detonation front structure along line C in figure 28(d), thanks to the intense shock wave, a rapid increase of mass fraction appears in the O and H radicals, followed by HO2 and H2O2. The peak values of H, O and OH reach 0.00264, 0.04376 and 0.0206, respectively, much higher than the deflagration flame, as discussed in the premixed mixture, especially in the OH radical. Moreover, compared with the deflagration flame, the H and O radicals appear early in the flame front instead of the HO2 and H2O2. As such, the flame front structure is significantly different due to the early LSW. Moreover, the peak value of HO2 approaches 4.5 × 10−5 through the chain-breaching reaction of H + O2(+M) = HO2(+M), which is almost two times that of the deflagration flame front. This is due to the HO2 radical being associated with pressure, which is more vital for the detonation flame with high pressure. After that, with the abrupt consumption of HO2 and H2O2, the mass fraction of OH and H2O radicals is increased accordingly with the main chain-branching reactions through HO2 + H = OH + OH and HO2 + OH = H2O + O2, resulting in a high energy release ratio, and feeding back to a dramatic increase in temperature that reaches 3200 K.

Furthermore, we analysed the local detonation combustion and product. The profiles of the mass fraction of H2 and the local Ma number along lines A, B and C at t = 1.6625 ms are given in figure 30(a,b), respectively. Residual hydrogen exists in the downstream flame; see circles A and B, especially in line A, and the H2 mass fraction reaches 0.012, implying that the H2 is not consumed fully behind the detonation front. Several previous studies have also found these results in homogenous and inhomogeneous mixtures (Austin Reference Austin2003; Radulescu et al. Reference Radulescu, Sharpe, Lee, Kiyanda, Higgins and Hanson2005, Reference Radulescu, Sharpe, Law and Lee2007; Mahmoudi & Mazaheri Reference Mahmoudi and Mazaheri2015; Han et al. Reference Han, Wang and Law2019). Subbotin (Reference Subbotin1975) and Gamezo, Desbordes & Oran (Reference Gamezo, Desbordes and Oran1999) suggested that the unburned material is highly related to the detonation instability, and the unburned material appears in a highly unstable detonation propagation. In Sharpe's (Reference Sharpe2001) work, they reported that the formation of an unburned material is generated by the departure of the slip line and secondary triple point. Mahmoudi & Mazaheri (Reference Mahmoudi and Mazaheri2015) also found an unreacted mixture when using a high mesh resolution simulation considering the viscosity. More recently, the unburned material was observed in an inhomogeneous mixture (Han et al. Reference Han, Wang and Law2019), and Han et al. (Reference Han, Wang and Law2019) revealed that more unburned pockets after the detonation front are generated when steepening the mixture concentration gradient. In the present research, due to the concentration gradient in both the longitudinal and horizontal directions, the residual hydrogen appears more random and mainly depends on the ER value. At t = 1.6625 ms, the ER value is much higher ahead of the lower detonation front, as noted in figure 25(c 2) near the bottom wall. As a result, a high bulk of residual hydrogen occurs when the denotation wave propagates in these regions.

Figure 30. Variations of macroscopic variables of (a) H2 and (b) Mach number along lines A, B and C in figure 28(a).

By insight into the Mach number profile, the average Mach number ahead of the flame front is close to 1.5. A steep increase in Mach number is due to the LSW. After the combustion process, the pressure expands with a decrease in pressure and density. Regarding the Mach number, the ideal ZND solution quickly approaches the local speed of sound, namely, Ma = 1, while in the current inhomogeneous supersonic mixture, it needs more time to reach the sonic point. Such a feature is attributed to the intense flow instabilities generated by the non-equilibrium chemical reaction in the downstream chamber, where a continuous reaction of the unburned pocket appears under the influences of the R-M and K-H instabilities. In Radulescu et al.'s (Reference Radulescu, Sharpe, Law and Lee2007) study, the delayed equilibrium reaction was also reported when comparing the detonation structure and the variations of the sonic surface. By employing the same method, Han et al. (Reference Han, Wang and Law2019) also found that the non-equilibrium reaction is elongated when steeping the concentration gradient. Hence, the present result is qualitatively consistent with the previous study.

To reveal the detonation instability, figure 31 gives the next detonation propagation scenarios from x = 66 to x = 73 cm, accompanied by the pressure, ER and combustion product of H2O. First, a curved flame with a lower temperature appears due to the fuel-lean mixture (box C1 in figure 31c 1), while a detonation reinitiation is observed when this flame front propagates into a high ER mixture. A remarkable triple point is generated and propagates from the lower wall to the upper wall (circles A1–A3). At t = 1.715 ms, a complicated flame front is generated. A detonation wave is decoupled again (see DC2 in figure 31a 3) to a flame and a shock wave since it propagates in the lower ER region (circle C2), followed by a lower combustion product (circle D2), while a multiple-head detonation wave is generated in the upper flame front; see boxes B1 and B2. Yet, the cell distribution is irregular, and therefore, an irregular detonation wave is formed. At t = 1.7225 ms, the detonation wave propagates downstream, detonation reinitiation in circle D3 and a smooth flame front with a large detonation cellular size are observed (box B3). As a result, the inhomogeneous promotes the detonation instability with an irregular wave. As the flame front travels into the fuel-lean mixture, an increasing induced reaction zone forms in circle A5.

Figure 31. Snapshots of detonation propagation rendered by (first row) temperature, (second row) pressure, (third row) ER and (fourth row) product showing the partially decupled detonation front and irregular detonation cellular structure in case 4. DC – decoupled flame, TP – triple point, D-R – detonation re-initiation: (a1) t = 1.7, (a2) t = 1.7075, (a3) t = 1.715, (a4) t = 1.7225 and (a5) t = 1.7300 ms.

Figures 32 and 33 further provide detailed detonation wave structures and corresponding density schlieren enlargements for part of the time in figure 31. When the decoupled shock propagates to an appropriate ER area, detonation reinitiation occurs, and part of the detonation wave appears in a low-temperature area downstream of combustion, as shown in the green area in figure 32(a). At the same time, the structure of the detonation wave is complex. The theoretical detonation cell size in the premixed mixture is around 9.0 mm when using the Cantera tool calculation. However, an irregular detonation propagation is generated in the computational domain, where the detonation cell size is small in the upper domain. In comparison, the detonation cell size in the lower half-domain is quite large. This is mainly due to a large transverse concentration gradient in the mixture. In general, the detonation cell size is small compared with the theoretical size. The numerical results of the previous study (Hu et al. Reference Hu, Zhang, Khoo and Jiang2005) also obtained a relatively smaller cell size than the experiment, which is explained by the higher heat loss at the wall in the experiment (Fickett & Davis Reference Fickett and Davis2000). Due to the use of adiabatic wall BCs and the limitations of 2-D simulation, it is still reasonable to obtain a small cell size in the numerical simulation.

Figure 32. Flame front structure and detonation propagation instability in inhomogeneous supersonic mixture rendered by temperature contour (a) and destiny schlieren (b) at t = 1.7075 ms. TW – transverse wave, TP – triple point, SL – slipping line, MS – Mach stem.

Figure 33. Flame front structure and partial decouple flame front rendered by temperature contour (a) and destiny schlieren (b) at t = 1.7150 ms. TW – transverse wave, TP – triple point, SW – shock wave, MS – Mach stem.

The temperature distribution of the detonation wave is uneven, and the temperature in the lower half-domain is relatively high. This is mainly because the ER distribution in the longitudinal direction is particularly uneven, leading to different triple point structure distributions and an uneven temperature distribution. The density schlieren in figure 32(b) shows that multiple transverse waves are generated in a smaller range downstream of the detonation front. In contrast, high-intensity transverse waves extend to a long area downstream in the entire combustion chamber.

Figure 33 further shows the detonation extinction and complexity of the detonation wave structure. At this moment, part of the detonation wave is extinguished due to a lack of fuel near the lower wall, resulting in a low-temperature area on the flame front and downstream. But the decoupled shock wave still propagates forward. Meanwhile, multiple triple points and many transverse waves are generated in the upper part. In contrast, the stronger transverse waves in the combustion products still propagate up and down in the combustion chamber. It can, therefore, be concluded from these two moments that, in an inhomogeneous supersonic mixture, the instability and complexity of detonation wave propagation are formed due to inhomogeneous ER distribution.

4. Conclusions

In the current research, the mixing, FA and DDT in premixed and inhomogeneous supersonic mixtures are investigated comprehensively by using the N-S equations with high mesh resolution of the AMR technique and a detailed chemical reaction mechanism of 11 species and 27 steps. Of interest, the inhomogeneous mixture is generated by considering the mixing process extracted from an air-breathing detonation engine. The transverse jet obstacles are employed to trigger the DDT after mixture ignition. Comparisons of the FA between premixed and inhomogeneous mixtures are discussed. The DDT, detonation quenching, reinitiation and propagation in the inhomogeneous mixture are comprehensively reported and analysed.

  • It is challenging to undergo a DDT in premixed and inhomogeneous mixtures in a smooth tube without a particular turbulent generation, even when in a supersonic flow state before mixture ignition. With the stimulation of multiple head-on transverse jet obstacles, the DDT occurs against the boundary wall due to the auto-ignited flame kernel after the intense LSW in the premixed mixture.

  • The combustion temperature in the inhomogeneous mixture without jet obstacles is extremely lower in contrast to the premixed mixture due to the quite fuel-rich and fuel-lean mixtures. However, an increasing temperature is observed in the downstream flame thanks to the further turbulent mixing combustion. Additionally, the flame thickness in the inhomogeneous mixture is much higher than that of the premixed mixture. The front structure is also more complicated with further downstream non-equilibrium chemical reaction attributed to the further turbulent mixing process in contrast to the premixed mixture.

  • In the inhomogeneous supersonic mixture, the onset of detonation and detonation reinitiation are formed, and both DDT mechanisms are ascribed to the robust Mach stem with the Zel’dovich gradient mechanism. The detonation extinction is caused by the vast bulk of lower ER regions. Still, the detonation reinitiation can occur and survive successfully even under a rather small, elongated highly sensitive mixture. The extreme fuel-lean mixture (ER = 0.15) results in a partially decoupled flame front, but detonation reinitiation occurs when the shock wave propagates in a highly sensitive mixture.

  • The formation of detonation reinitiation requires a highly sensitive mixture region so that a discretized low ER mixture can be utilized to block the detonation propagation. However, the detonation reinitiation can be activated later when the intense shock wave propagates in a highly sensitive mixture.

  • The discrete and random inhomogeneous mixture with transverse and longitudinal concentration gradients results in a curved and partially decoupled flame front. Moreover, the extreme inhomogeneous mixture increases the instabilities of the propagation speed and cellular detonation structure, reduces the averaged detonation propagation speed and delays the sonic point thanks to the extended non-equilibrium reaction.

In the current study, 2-D simulations are employed. Although, as reported by former research (Gamezo et al. Reference Gamezo, Ogawa and Oran2007; Goodwin et al. Reference Goodwin, Houim and Oran2016; Xiao & Oran Reference Xiao and Oran2020), the DDT mechanisms between 2-D and 3-D simulations are almost the same, the mixing process, Br and diffusion effect between two and three dimensions are still different. Therefore, further investigation into 3-D simulations, closer to practical detonation-based engines, is warranted. Additionally, while the current mesh resolution is adequate for resolving FA and DDT, higher resolution is required for accurately capturing detonation propagation, especially irregular detonation propagation. Nonetheless, the current study still yields significant qualitative insights into detonation simulation, particularly in engineering applications featuring extremely long combustion chambers.

Funding

This work was supported by the National Natural Science Foundation of China (nos. 11925207, 11702323 and 91741205), the China Scholarship Council (no. 202106110005), the Natural Science Foundation of Hunan Province (nos. 2024JJ6454, 2023JJ10048) and the Youth Independent Innovation Science Foundation of National University of Defense Technology (no. ZK24-34).

Declaration of interests

The authors report no conflict of interest.

Appendix A. Shock-induced combustion

To test the numerical model and AMR technique to resolve the compressible flow and detonation combustion, the shock-induced combustion and FA test cases are carried out. Meanwhile, the obtained results are also compared with experimental data.

First, a classical shock-induced combustion conducted by Lehr is selected (Lehr Reference Lehr1972). The physical model is given in figure 34. The radius of the supersonic projectile is 7.5 mm. A half-computational domain of Lx × Ly = 12 mm × 18 mm is utilized to reduce computing resources. The cylinder symmetry is considered in a splitting approach. The incoming hydrogen–air mixture with Mach number 4.48 flows into the domain with a velocity inlet on the left side of the computational domain. The remaining three directions of the computational domain have an outflow BC. The incoming pressure and temperature are 0.42 atm and 293 K, respectively.

Figure 34. Physical illustration of the Leher's shock-indued oscillation combustion.

Of note, here, the AMR threshold selection is also introduced. The selection mainly depends on two refinement criteria. The first AMR criterion is to estimate the surrounding cells’ differences between the arbitrary scalar, which is employed for the large gradient regions such as the shock and detonation waves. The second AMR criterion is to evaluate the local truncation error by Richardson extrapolation. For the temperature, density and pressure variables, the first AMR criterion is used, and the scaled gradient thresholds are set as ${\varepsilon _T} = 500\;\textrm{K}$, ${\varepsilon _\rho } = 0.020\;\textrm{kg}\;{\textrm{m}^{ - 3}}$, ${\varepsilon _P} = 8E4\;\textrm{Pa}$, respectively. The second AMR criterion is adopted for all species. All AMR thresholds are listed in table 4, where ${S_Y}$ and ${\eta _Y}$ are scaling parameters for relative errors and absolute errors, and the detailed definition can be found in Deiterding (Reference Deiterding2011). A hydrogen–air chemical reaction mechanism with 9 species and 19 steps proposed by Jachimowski (Reference Jachimowski1988) is employed. An initial mesh is 160 × 240. Four AMR levels with (2, 2, 4) are adopted, generating a minim size of 0.0046875 mm.

Table 4. The AMR indicator parameters for shock-induced combustion.

Figure 35 exhibits the density gradient contour and the corresponding AMR distribution. It is observed that the AMR works well practically in its adept handling of the shock and reaction front. Besides that, the AMR has still refined the compressive wave. Hence, it can be inferred that the AMR threshold is efficient under the current setting parameter. The axial position of the bow shock wave versus time and fast Fourier transform for the shock's position are plotted in figures 36(a) and 36(b), respectively. A periodic oscillation of the bow shock is formed, and the obtained oscillation frequency is 422.93 kHz, as depicted in figure 36(b). The oscillation frequency obtained by Lehr's experimental data is 425 kHz. Hence, there is just a 0.48 % deviation. It is concluded that the Roe–HLL solver is accurate in addressing the complex inherent in supersonic reactive combustion.

Figure 35. Flow structure identified by (a) density gradient and the corresponding (b) AMR distribution.

Figure 36. The axial position of bow shock wave versus time and the fast Fourier transfer data under supersonic flow of Ma = 4.48.

Appendix B. Flame acceleration and DDT test

Second, the FA and DDT are simulated and compared with previous experimental and numerical data. The computational configuration is extracted from Ettner's experimental set-up (Azadboni et al. Reference Azadboni, Wen, Heidari and Wang2017) as demonstrated in figures 37(a) and 37(b). Thanks to the symmetry structure, the 3-D rectangular configuration can be reduced to a 2-D set-up, but the blockage ratio, solid obstacle's interval and tube width are kept the same. The specific parameters can be found in figure 37(b). To reduce the computational requirements, the combustion chamber length is reduced to 3.6 m. The simulation configuration has 0.6 Br and a 0.3 mole fraction of hydrogen in a homogeneous state. More detailed configuration parameters can be found in Wang & Wen (Reference Wang and Wen2017) and Azadboni et al. (Reference Azadboni, Wen, Heidari and Wang2017).

Figure 37. Physical illustration of (a, upper row) experimental configuration from Ettner et al. (Reference Ettner, Vollmer and Sattelmayer2013) and (b, lower row) reduced 2-D simulation model.

The initial mesh size is set to be ${L_x} \times {L_y} = 9000 \times 360$. Four AMR levels are adopted with r 1 = 2, r 2 = 2 and r 3 = 4. It is noted that the first AMR criterion is used for the temperature, density and pressure with ${\varepsilon _T} = 500\;\textrm{K}$, ${\varepsilon _\rho } = 0.01\;\textrm{kg}\;{\textrm{m}^{ - 3}}$, ${\varepsilon _P} = 4E4\;\textrm{Pa}$, while the second criterion is employed for key species, and the corresponding AMR thresholds are listed in table 5. Meanwhile, Burke et al.'s chemical reaction mechanism is employed for the current FA and DDT, which has been widely used for DDT simulation, as discussed before.

Table 5. The AMR indicators for the key species in FA simulation.

A weak hot spot with a temperature of 2500 K and a pressure of 0.1 MPa located in the centre of the left side of the computational domain is used for mixture ignition. The transient FA temperature, vorticity and AMR distribution contours are presented in figure 38. As shown, the highest AMR level covers the large density gradient region for shock waves, flame front and boundary walls. As a result, the AMR thresholds are efficient.

Figure 38. Temperature, vorticity and AMR distribution transient contours in FA.

The obtained flame propagation velocity and the previous literature's results are superimposed in figure 39. As such, the flame front propagation velocity obtained by the current solver is almost the same as the reference value. It is worth mentioning that the large velocity oscillation in the experimental data is due to the flame front position obtained in different monitors at different times. Further, detonation propagation is obtained after a distance of 1.6 m for the current numerical and previous literature data. Referring to the CJ velocity, the differences from the ideal value are 1.23 %, 5.18 %, 3.74 % and 0.13 % for the experiment of Ettner (Reference Ettner2013), Wang & Wen's (Reference Wang and Wen2017), Zhao et al.'s (Reference Zhao, Wang, Gao, Wang and Zhu2022b) and the current simulation data, respectively. Therefore, the present AMR and Roe solver are robust and reliable for 2-D FA and DDT scenarios.

Figure 39. The obtained flame tip propagation velocity versus flame position for the current simulation and previous literature data.

Appendix C. Difference of flame acceleration and DDT between 2-D and 3-D cases

To analyse the 2-D and 3-D differences in FA and DDT, we further carried out a 3-D simulation in the supersonic premixed mixture considering the multiple transverse jet obstacles in a rectangular combustion chamber. The incoming temperature, pressure and species are consistent with case 2, as listed in table 2. Multiple transverse jets are injected into the chamber during the FA stage, as illustrated by the dashed blue curve in figure 40. In order to reduce the computing effort, the physical domain size is set to be 450.00 mm, 15.12 mm and 15.12 mm in z-, x- and y-directions, respectively. The hot spot ignitions are also located in the upper and lower walls. The initial mesh is set to be Lx × Ly × Lz = 1250 × 42 × 42 cells, generating an identical size of dx = dy = dz = 0.36 mm. Three AMR levels with r 1 = 2 and r 2 = 4 are utilized in the whole simulation to reduce the computing cost. The corresponding AMR minimum mesh size is 0.045 mm so that around 1.1289 billion mesh will be generated if a uniform mesh is adopted.

Figure 40. Physical illustration of FA and DDT in 3-D rectangle with transverse jet.

Figure 41 shows the temperature iso-surface evolution during FA and DDT processes under a supersonic uniform mixture. It can be seen from the figure that the flame surface gradually appears as a bifurcated flame front structure (bifurcated flame front) under the influence of the transverse jet in the y-direction. Under the influence of the disturbance flow field of transverse jet obstacles, the flame surface area increases, and the flame propagation speed increases. Immediately afterward, a spherical local explosion point appears on the lower left wall in figure 41(e), which in turn leads to a rapid increase in the local combustion temperature. The localized explosion point quickly evolves into a smooth detonation combustion wave s at 0.38–0.4 ms and propagates further downstream. Therefore, the results of shock waves, certain blockage effects and flow disturbance effects generated by 3-D transverse jets in the flow field are consistent with those of 2-D transverse jets.

Figure 41. Evolution of temperature iso-surface in FA and DDT in the supersonic premixed mixture. LEP – localized explosion point, DW – detonation wave.

Figure 42 shows the local temperature enlargement contours before and after the detonation occurs at the middle plane of the z-axis. As presented, the flame front structure is complex, and many wrinkled flames are generated. When the LSW collides and converges with multiple rear shock waves, a local detonation point appears on the upper wall in front of the flame front, and this explosion point further evolves into a detonation wave.

Figure 42. Snapshot of temperature contour before and after DDT in the z-direction. LSW – leading shock wave, LEP – localized explosion point, DW – detonation wave.

Therefore, the detonation of DDT in a 3-D supersonic homogeneous mixture mainly relies on the high-pressure explosion point formed by the convergence of multiple shock waves on the upper wall and eventually evolves into a detonation wave. This detonation mechanism is the same as the 2-D case. It can be concluded that, in a supersonic homogeneous mixture, the 2-D and 3-D detonation mechanisms are basically consistent with one another, which further verifies the feasibility of 2-D simulation in revealing the DDT mechanism.

In summary, the numerical model can be extended to carry out 3-D FA and DDT simulations. Prior studies reported that 2-D numerical simulation can also reproduce the flame evolution, flame–shock interaction, shock–shock interaction, DDT and detonation propagation characteristics as provided in 3-D simulation and experimental study (Xiao & Oran Reference Xiao and Oran2019). A lot of the former literature related to the FA and DDT confirmed that 2-D simulation is in qualitative and quite quantitative agreement with the obtained results in 3-D numerical simulation and experimental studies. Numerous works have reported that the DDT mechanism between two and three dimensions is almost the same (Gamezo et al. Reference Gamezo, Ogawa and Oran2007; Ogawa et al. Reference Ogawa, Gamezo and Oran2013; Goodwin et al. Reference Goodwin, Houim and Oran2016; Xiao & Oran Reference Xiao and Oran2020). The reason is that the DDT evolution is mainly controlled by shock–shock and shock–flame interactions. Moreover, the growth rate in the R-M instability introduced by the shock–flame interaction between two and three dimensions is the same and has a linear regime (Li & Zhang Reference Li and Zhang1997). The difference is that the growth rate in the 3-D case is slightly faster than in the 2-D results. As such, the DDT mechanisms between the two and three dimensions are the same despite the fact that there is some difference in the flame propagation speed (Ogawa et al. Reference Ogawa, Gamezo and Oran2013). The current 3-D simulation also confirmed the same DDT mechanism. However, the 2-D model still has some limitations in reproducing some 3-D flow and detonation structures, such as the turbulent flow and detonation propagation structure.

References

Ahmed, K.A. & Forliti, D.J. 2009 Fluidic flame stabilization in a planar combustor using a transverse slot jet. AIAA J. 47 (11), 27702775.CrossRefGoogle Scholar
Austin, J.M. 2003 The role of instability in gaseous detonation. PhD thesis, California Institute of Technology.Google Scholar
Azadboni, R.K., Heidari, A., Boeck, L.R. & Wen, J.X. 2019 The effect of concentration gradients on deflagration-to-detonation transition in a rectangular channel with and without obstructions – a numerical study. Intl J. Hydrogen Energy 44 (13), 70327040.CrossRefGoogle Scholar
Azadboni, R.K., Wen, J.X., Heidari, A. & Wang, C. 2017 Numerical modeling of deflagration to detonation transition in inhomogeneous hydrogen/air mixtures. J. Loss Prev. Process. Ind. 49, 722730.CrossRefGoogle Scholar
Bird, R.B., Stewart, W.E. & Lightfoot, E.N. 2006 Transport Phenomena. John Wiley & Sons.Google Scholar
Boeck, L.R., Berger, F.M., Hasslberger, J. & Sattelmayer, T. 2016 Detonation propagation in hydrogen–air mixtures with transverse concentration gradients. Shock Waves 26 (2), 181192.CrossRefGoogle Scholar
Boeck, L.R., Hasslberger, J. & Sattelmayer, T. 2014 Flame acceleration in hydrogen/air mixtures with concentration gradients. Combust. Sci. Technol. 186 (10–11), 16501661.CrossRefGoogle Scholar
Boivin, P., Jiménez, C., Sánchez, A.L. & Williams, F.A. 2011 An explicit reduced mechanism for H2–air combustion. Proc. Combust. Inst. 33 (1), 517523.CrossRefGoogle Scholar
Boulal, S., Vidal, P. & Zitoun, R. 2016 Experimental investigation of detonation quenching in non-uniform compositions. Combust. Flame 172, 222233.CrossRefGoogle Scholar
Burke, M., Chaos, M., Ju, Y., Dryer, F. & Klippenstein, S. 2012 Comprehensive H2/O2 kinetic model for high-pressure combustion. Intl J. Chem. Kinet. 44 (7), 444474.CrossRefGoogle Scholar
Cai, X., Deiterding, R., Liang, J. & Mahmoudi, Y. 2017 Adaptive simulations of viscous detonations initiated by a hot jet using a high-order hybrid WENO–CD scheme. Proc. Combust. Inst. 36 (2), 27252733.CrossRefGoogle Scholar
Cai, X., Liang, J., Deiterding, R., Mahmoudi Larimi, Y. & Sun, M.-B. 2018 Experimental and numerical investigations on propagating modes of detonations: detonation wave/boundary layer interaction. Combust. Flame 190, 201215.CrossRefGoogle Scholar
Cheng, J., Zhang, B., Liu, H. & Wang, F. 2020 Experimental study on the effects of different fluidic jets on the acceleration of deflagration prior its transition to detonation. Aerosp. Sci. Technol. 106, 106203.CrossRefGoogle Scholar
Cheng, J., Zhang, B., Liu, H. & Wang, F. 2021 a The precursor shock wave and flame propagation enhancement by CO2 injection in a methane-oxygen mixture. Fuel 283, 118917.CrossRefGoogle Scholar
Cheng, J., Zhang, B., Ng, D.H., Liu, H. & Wang, F. 2021 b Effects of inert gas jet on the transition from deflagration to detonation in a stoichiometric methane-oxygen mixture. Fuel 285, 119237.CrossRefGoogle Scholar
Cooper, M., Jackson, S., Austin, J., Wintenberger, E. & Shepherd, J. 2002 Direct experimental impulse measurements for detonations and deflagrations. J. Propul. Power 18 (5), 10331041.CrossRefGoogle Scholar
Deiterding, R. 2003 Parallel adaptive simulation of multi-dimensional detonation structures. PhD thesis, Brandenburgische Technische Universität Cottbus.Google Scholar
Deiterding, R. 2011 Block-structured adaptive mesh refinement-theory, implementation and application. Esaim: Proc. 34, 97150.CrossRefGoogle Scholar
Ettner, F. 2013 Effiziente numerische Simulation des Deflagrations - Detonations - Übergangs. PhD thesis, Technische Universität München, München.Google Scholar
Ettner, F., Vollmer, K.G. & Sattelmayer, T. 2013 Mach reflection in detonations propagating through a gas with a concentration gradient. Shock Waves 23 (3), 201206.CrossRefGoogle Scholar
Fan, J. & Xiao, H. 2022 Flame acceleration and transition to detonation in non-uniform hydrogen-air mixtures in an obstructed channel with different obstacle arrangements. Fire Safety J. 133, 103660.CrossRefGoogle Scholar
Fang, Y., Hu, Z., Teng, H., Jiang, Z. & Ng, H.D. 2017 Numerical study of inflow equivalence ratio inhomogeneity on oblique detonation formation in hydrogen–air mixtures. Aerosp. Sci. Technol. 71, 256263.CrossRefGoogle Scholar
Fickett, W. & Davis, W.C. 2000 Detonation: Theory and Experiment. Courier Corporation.Google Scholar
Frolov, S.M., Smetanyuk, V.A., Aksenov, V.S. & Koval’, A.S. 2017 Deflagration-to-detonation transition in crossed-flow fast jets of propellant components. Dokl. Phys. Chem. 476 (1), 153156.CrossRefGoogle Scholar
Gamezo, V.N., Bachman, C.L. & Oran, E.S. 2021 Flame acceleration and DDT in large-scale obstructed channels filled with methane-air mixtures. Proc. Combust. Inst. 38 (3), 35213528.CrossRefGoogle Scholar
Gamezo, V.N., Desbordes, D. & Oran, E.S. 1999 Formation and evolution of two-dimensional cellular detonations. Combust. Flame 116 (1–2), 154165.CrossRefGoogle Scholar
Gamezo, V.N., Ogawa, T. & Oran, E.S. 2007 Numerical simulations of flame propagation and DDT in obstructed channels filled with hydrogen–air mixture. Proc. Combust. Inst. 31 (2), 24632471.CrossRefGoogle Scholar
Gamezo, V.N., Ogawa, T. & Oran, E.S. 2008 Flame acceleration and DDT in channels with obstacles: effect of obstacle spacing. Combust. Flame 155, 302315.CrossRefGoogle Scholar
Goodwin, D.G., Moffat, H.K. & Speth, R.L. 2009 Cantera: an object-oriented software toolkit for chemical kinetics, thermodynamics, and transport processes. Caltech.Google Scholar
Goodwin, G.B., Houim, R.W. & Oran, E.S. 2016 Effect of decreasing blockage ratio on DDT in small channels with obstacles. Combust. Flame 173, 1626.CrossRefGoogle Scholar
Grogan, K.P. & Ihme, M. 2015 Weak and strong ignition of hydrogen/oxygen mixtures in shock-tube systems. Proc. Combust. Inst. 35 (2), 21812189.CrossRefGoogle Scholar
Grogan, K.P. & Ihme, M. 2017 Regimes describing shock boundary layer interaction and ignition in shock tubes. Proc. Combust. Inst. 36 (2), 29272935.CrossRefGoogle Scholar
Haghdoost, M.R., Edgington-Mitchell, D., Nadolski, M., Klein, R. & Oberleithner, K. 2020 Dynamic evolution of a transient supersonic trailing jet induced by a strong incident shock wave. Phys. Rev. Fluids 5 (7), 073401.CrossRefGoogle Scholar
Han, W., Huang, J., Gu, G., Wang, C. & Law, C.K. 2020 Surface heat loss and chemical kinetic response in deflagration-to-detonation transition in microchannels. Phys. Rev. Fluids 5 (5), 053201.CrossRefGoogle Scholar
Han, W., Wang, C. & Law, C.K. 2019 Role of transversal concentration gradient in detonation propagation. J. Fluid Mech. 865, 602649.CrossRefGoogle Scholar
Hu, X., Zhang, D., Khoo, B.C. & Jiang, Z. 2005 The structure and evolution of a two-dimensional H2/O2/Ar cellular detonation. Shock Waves 14 (1), 3744.CrossRefGoogle Scholar
Ishii, K. & Kojima, M. 2007 Behavior of detonation propagation in mixtures with concentration gradients. Shock Waves 17 (1–2), 95102.CrossRefGoogle Scholar
Ivanov, M.F., Kiverin, A.D. & Liberman, M.A. 2011 Hydrogen-oxygen flame acceleration and transition to detonation in channels with no-slip walls for a detailed chemical reaction model. Phys. Rev. E Stat. Nonlinear 83 (5), 056313.CrossRefGoogle ScholarPubMed
Iwata, K., Imamura, O., Akihama, K., Yamasaki, H., Nakaya, S. & Tsue, M. 2021 Numerical study of self-sustained oblique detonation in a non-uniform mixture. Proc. Combust. Inst. 38 (3), 36513659.CrossRefGoogle Scholar
Iwata, K., Nakaya, S. & Tsue, M. 2017 Wedge-stabilized oblique detonation in an inhomogeneous hydrogen–air mixture. Proc. Combust. Inst. 36 (2), 27612769.CrossRefGoogle Scholar
Jachimowski, C.J. 1988 An analytical study of the hydrogen-air reaction mechanism with application to scramjet combustion. No. L-16372.Google Scholar
Jiang, C., Pan, J., Weng, J., Li, J. & Quaye, E.K. 2022 a Role of concentration gradient in the re-initiation of H2/O2 detonation in a 90° bifurcated channel. Aerosp. Sci. Technol. 120, 107281.CrossRefGoogle Scholar
Jiang, C., Pan, J., Zhu, Y., Li, J., Chen, H. & Quaye, E.K. 2022 b Influence of concentration gradient on detonation re-initiation in a bifurcated channel. Fuel 307, 121895.CrossRefGoogle Scholar
Kaps, P. & Rentrop, P. 1979 Generalized Runge-Kutta methods of order four with stepsize control for stiff ordinary differential equations. Numer. Math. 33 (1), 5568.CrossRefGoogle Scholar
Kessler, D.A., Gamezo, V.N. & Oran, E.S. 2010 Simulations of flame acceleration and deflagration-to-detonation transitions in methane-air systems. Combust. Flame 157, 20632077.CrossRefGoogle Scholar
Kessler, D.A., Gamezo, V.N. & Oran, E.S. 2011 Detonation propagation through a gradient in fuel composition. In Paper presented at the Proceedings of the 23th International Colloquium on the Dynamics of Explosions and Reacting Systems, Irvine, CA.Google Scholar
Kessler, D.A., Gamezo, V.N. & Oran, E.S. 2012 Gas-phase detonation propagation in mixture composition gradients. Phil. Trans. R. Soc. A: Math. Phys. Engng Sci. 370 (1960), 567596.CrossRefGoogle ScholarPubMed
Knox, B., Forliti, D., Stevens, C., Hoke, J. & Schauer, F. 2011 A comparison of fluidic and physical obstacles for deflagration-to-detonation transition. In 49th AIAA Aerospace Sciences Meeting Including the New Horizons Forum and Aerospace Exposition, 587.Google Scholar
Kuznetsov, M.S., Alekseev, V.I., Dorofeev, S.B., Matsukov, I.D. & Boccio, J.L. 1998 Detonation propagation, decay, and reinitiation in nonuniform gaseous mixtures. Symp. (Intl) Combust. 27 (2), 22412247.CrossRefGoogle Scholar
Law, C.K. 2010 Combustion Physics. Cambridge University Press.Google Scholar
Lee, J., Knystautas, R. & Yoshikawa, N. 1980 Photochemical initiation of gaseous detonations. In Gas Dynamics of Explosions and Reactive Systems, pp. 971–982. Elsevier.CrossRefGoogle Scholar
Lehr, H.F. 1972 Experiments on shock-induced combustion. Astr. Acta 17, 589597.Google Scholar
Li, T., Wang, X., Xu, B. & Kong, F. 2021 An efficient approach to achieve flame acceleration and transition to detonation. Phys. Fluids 33 (5), 056103.CrossRefGoogle Scholar
Li, X. & Zhang, Q. 1997 A comparative numerical study of the Richtmyer-Meshkov instability with nonlinear analysis in two and three dimensions. Phys. Fluids 9, 30693077.CrossRefGoogle Scholar
Luan, Z., Huang, Y., Gao, S. & You, Y. 2022 Formation of multiple detonation waves in rotating detonation engines with inhomogeneous methane/oxygen mixtures under different equivalence ratios. Combust. Flame 241, 112091.CrossRefGoogle Scholar
Mahmoudi, Y., Karimi, N., Deiterding, R. & Emami, S. 2014 Hydrodynamic instabilities in gaseous detonations: comparison of Euler, Navier–Stokes, and large-eddy simulation. J. Propul. Power 30 (2), 384396.CrossRefGoogle Scholar
Mahmoudi, Y. & Mazaheri, K. 2011 High resolution numerical simulation of the structure of 2-D gaseous detonations. Proc. Combust. Inst. 33 (2), 21872194.CrossRefGoogle Scholar
Mahmoudi, Y. & Mazaheri, K. 2015 High resolution numerical simulation of triple point collision and origin of unburned gas pockets in turbulent detonations. Acta Astronaut. 115, 4051.CrossRefGoogle Scholar
Mathur, S., Tondon, P. & Saxena, S. 1967 Thermal conductivity of binary, ternary and quaternary mixtures of rare gases. Mol. Phys. 12 (6), 569579.CrossRefGoogle Scholar
McGarry, J.P. & Ahmed, K.A. 2017 Flame–turbulence interaction of laminar premixed deflagrated flames. Combust. Flame 176, 439450.CrossRefGoogle Scholar
Metrow, C., Gray, S. & Ciccarelli, G. 2021 Detonation propagation through a nonuniform layer of hydrogen-oxygen in a narrow channel. Intl J. Hydrogen Energy 46 (41), 2172621738.CrossRefGoogle Scholar
Mi, X., Higgins, A., Ng, H.D., Kiyanda, C. & Nikiforakis, N. 2017 Propagation of gaseous detonation waves in a spatially inhomogeneous reactive medium. Phys. Rev. Fluids 2 (5), 053201.CrossRefGoogle Scholar
Ng, H.D., Ju, Y. & Lee, J.H. 2007 Assessment of detonation hazards in high-pressure hydrogen storage from chemical sensitivity analysis. Intl J. Hydrogen Energy 32 (1), 9399.CrossRefGoogle Scholar
Ogawa, T., Gamezo, V.N. & Oran, E.S. 2013 Flame acceleration and transition to detonation in an array of square obstacles. J. Loss Prev. Process Ind. 26 (2), 355362.CrossRefGoogle Scholar
Oran, E.S., Chamberlain, G. & Pekalski, A. 2020 Mechanisms and occurrence of detonations in vapor cloud explosions. Prog. Energy Combust. Sci. 77, 100804.CrossRefGoogle Scholar
Oran, E.S., Jones, D.A. & Sichel, M. 1992 Numerical simulations of detonation transmission. Proc. R. Soc. Lond. Ser. A: Math. Phys. Sci. 436 (1897), 267297.Google Scholar
Peng, H., Huang, Y., Deiterding, R., Luan, Z., Xing, F. & You, Y. 2018 Effects of jet in crossflow on flame acceleration and deflagration to detonation transition in methane–oxygen mixture. Combust. Flame 198, 6980.CrossRefGoogle Scholar
Peng, H., Huang, Y., Deiterding, R., You, Y. & Luan, Z. 2019 Effects of transverse jet parameters on flame propagation and detonation transition in hydrogen–oxygen–argon mixture. Combust. Sci. Technol. 00, 122.Google Scholar
Radulescu, M.I., Sharpe, G.J., Law, C.K. & Lee, J.H. 2007 The hydrodynamic structure of unstable cellular detonations. J. Fluid Mech. 580, 3181.CrossRefGoogle Scholar
Radulescu, M.I., Sharpe, G.J., Lee, J., Kiyanda, C., Higgins, A. & Hanson, R. 2005 The ignition mechanism in irregular structure gaseous detonations. Proc. Combust. Inst. 30 (2), 18591867.CrossRefGoogle Scholar
Roy, G.D., Frolov, S.M., Borisov, A.A. & Netzer, D.W. 2004 Pulse detonation propulsion: challenges, current status, and future perspective. Prog. Energy Combust. Sci. 30 (6), 545672.CrossRefGoogle Scholar
Saeid, M.H.S., Khadem, J. & Emami, S. 2021 Numerical investigation of the mechanism behind the deflagration to detonation transition in homogeneous and inhomogeneous mixtures of H2-air in an obstructed channel. Intl J. Hydrogen Energy 46 (41), 2165721671.CrossRefGoogle Scholar
Saeid, M.H.S., Khadem, J., Emami, S. & Ghodrat, M. 2022 Effect of diffusion time on the mechanism of deflagration to detonation transition in an inhomogeneous mixture of hydrogen-air. Intl J. Hydrogen Energy 47 (55), 2341123426.CrossRefGoogle Scholar
Sharpe, G.J. 2001 Transverse waves in numerical simulations of cellular detonations. J. Fluid Mech. 447, 3151.CrossRefGoogle Scholar
Sochet, I., Lamy, T. & Brossard, J. 2000 Experimental investigation on the detonability of non-uniform gaseous mixtures. Shock Waves 10 (5), 363376.CrossRefGoogle Scholar
Song, Q., Han, Y. & Cao, W. 2020 Numerical investigation of self-sustaining modes of 2D planar detonations under concentration gradients in hydrogen–oxygen mixtures. Intl J. Hydrogen Energy 45 (53), 2960629615.CrossRefGoogle Scholar
Subbotin, V. 1975 Two kinds of transverse wave structures in multifront detonation. Combust. Explos. Shock Waves 11 (1), 8388.CrossRefGoogle Scholar
Sun, X. & Lu, S. 2020 On the mechanisms of flame propagation in methane-air mixtures with concentration gradient. Energy 202, 117782.CrossRefGoogle Scholar
Tang-Yuk, K.C., Mi, X., Lee, J.H.S., Ng, H.D. & Deiterding, R. 2022 Transmission of a detonation wave across an inert layer. Combust. Flame 236, 111769.CrossRefGoogle Scholar
Tarrant, D.J., Chambers, J.M., Joo, P.H. & Ahmed, K. 2020 Influence of transverse slot jet on premixed flame acceleration. J. Propul. Power 36, 5967.CrossRefGoogle Scholar
Thomas, G.O., Sutton, P. & Edwards, D.H. 1991 The behavior of detonation waves at concentration gradients. Combust. Flame 84 (3–4), 312322.CrossRefGoogle Scholar
Vollmer, K., Ettner, F. & Sattelmayer, T. 2012 Deflagration-to-detonation transition in hydrogen-air mixtures with a concentration gradient. Combust. Sci. Technol. 184 (10–11), 19031905.CrossRefGoogle Scholar
Wang, C.J. & Wen, J.X. 2017 Numerical simulation of flame acceleration and deflagration-to-detonation transition in hydrogen-air mixtures with concentration gradients. Intl J. Hydrogen Energy 42 (11), 76577663.CrossRefGoogle Scholar
Wang, Y., Huang, C., Deiterding, R., Chen, H. & Chen, Z. 2020 Propagation of gaseous detonation across inert layers. Proc. Combust. Inst. 38, 35553563.CrossRefGoogle Scholar
Xiao, H. & Oran, E.S. 2019 Shock focusing and detonation initiation at a flame front. Combust. Flame 203, 397406.CrossRefGoogle Scholar
Xiao, H. & Oran, E.S. 2020 Flame acceleration and deflagration-to-detonation transition in hydrogen-air mixture in a channel with an array of obstacles of different shapes. Combust. Flame 220, 378393.CrossRefGoogle Scholar
Yao, K., Yang, P., Teng, H., Chen, Z. & Wang, C. 2022 Effects of injection parameters on propagation patterns of hydrogen-fueled rotating detonation waves. Intl J. Hydrogen Energy 47 (91), 3881138822.CrossRefGoogle Scholar
Yhuel, E., Ribert, G. & Domingo, P. 2023 Numerical simulation of laminar premixed hydrogen-air flame/shock interaction in semi-closed channel. Proc. Combust. Inst. 39 (3), 30213029.CrossRefGoogle Scholar
Yuan, X., Zhou, J., Mi, X. & Ng, H.D. 2019 Numerical study of cellular detonation wave reflection over a cylindrical concave wedge. Combust. Flame 202, 179194.CrossRefGoogle Scholar
Zel'Dovich, Y.B., Librovich, V.B., Makhviladze, G.M. & Sivashinsky, G.I. 1970 On the development of detonation in a non-uniformly preheated gas. Astronaut. Acta 15 (5), 313321.Google Scholar
Zhang, L., Qiao, H., Liang, J., Wang, Y., Ding, M., Yang, L. & Sun, M. 2024 Experimental study of scramjet cavity with rear edge slots and its performance in combustion enhancement. Acta Mechanica Sin. 40 (1), 323135.CrossRefGoogle Scholar
Zhao, W., Deiterding, R., Liang, J., Cai, X. & Wang, X. 2023 a Detonation simulations in supersonic flow under circumstances of injection and mixing. Proc. Combust. Inst. 39 (3), 28952903.CrossRefGoogle Scholar
Zhao, W., Deiterding, R., Liang, J., Wang, X., Cai, X. & Duell, J. 2023 b Adaptive simulations of flame acceleration and detonation transition in subsonic and supersonic mixtures. Aerosp. Sci. Technol. 136, 108205.CrossRefGoogle Scholar
Zhao, W., Fan, C., Deiterding, R., Li, X., Liang, J. & Yang, X. 2024 A new rapid deflagration-to-detonation transition in a short smooth tube. Phys. Fluids 36 (3), 036104.CrossRefGoogle Scholar
Zhao, W., Liang, J., Deiterding, R., Cai, X. & Wang, X. 2021 Effect of transverse jet position on flame propagation regime. Phys. Fluids 33 (9), 091704.CrossRefGoogle Scholar
Zhao, W., Liang, J., Deiterding, R., Cai, X. & Wang, X. 2022 a Flame–turbulence interactions during flame acceleration using solid and fluid obstacles. Phys. Fluids 34 (10), 106106.CrossRefGoogle Scholar
Zhao, X., Wang, J., Gao, L., Wang, X. & Zhu, Y. 2022 b Flame acceleration and onset of detonation in inhomogeneous mixture of hydrogen-air in an obstructed channel. Aerosp. Sci. Technol. 130, 107944.CrossRefGoogle Scholar
Zheng, W., Kaplan, C.R., Houim, R.W. & Oran, E.S. 2019 Flame acceleration and transition to detonation: effects of a composition gradient in a mixture of methane and air. Proc. Combust. Inst. 37 (3), 35213528.CrossRefGoogle Scholar
Figure 0

Figure 1. Schematic illustration of the combustion configuration and boundary conditions for an air-breathing PDE with (configuration A) premixed and (configuration B) inhomogeneous mixtures in a supersonic flight condition.

Figure 1

Table 1. The thermodynamic properties of the premixed hydrogen–air mixture and the corresponding CJ parameters.

Figure 2

Table 2. The current cases employed for the FA and DDT.

Figure 3

Table 3. Parameters of component molar ratio of incoming air, fuel jet and transverse jet obstacles for the employed cases.

Figure 4

Figure 2. The (a) flame front position and the corresponding (b) flame front propagation velocity with time evolution for three mesh resolution cases.

Figure 5

Figure 3. Variations of H2 mass fraction during the mixing process under supersonic incoming air: (at = 0.22, (b) t = 0.26, (c) t = 0.34, (d) t = 0.50, (e) t = 0.70 and ( f) t = 0.82 ms.

Figure 6

Figure 4. The mixture fraction distribution in the (a) horizontal and (b) transverse dictions at the end of the mixing process.

Figure 7

Figure 5. Snapshots of the temperature contours during the FA in the inhomogeneous supersonic mixture without transverse jet obstacles (case 3): (a) t = 1.09, (b) t = 1.12, (c) t = 1.24, (d) t = 1.54, (e) t = 1.70 and ( f) t = 1.95875 ms.

Figure 8

Figure 6. Time sequence of temperature fields showing the propagation of the flame–turbulence, flame–shock and shock–shock interactions during the FA and DDT in case 2. SW-shock wave, IHS-auto-ignited hot spot, DW-detonation wave: (a) t = 0.2450, (b) t = 0.2750, (c) t = 0.3200, (d) t = 0.3800, (e) t = 0.4550, ( f) t = 0.5000, (g) t = 0.5150, (h) t = 0.5300, (i) t = 0.5450 and ( j) t = 0.5600 ms.

Figure 9

Figure 7. The transient temperature contour and the corresponding AMR distribution: (a-i) t = 0.37 and (b-i) t = 0.40 ms.

Figure 10

Figure 8. Evolution of axial position of the flame front in the cases for premixed mixtures with and without transverse jet obstacles.

Figure 11

Figure 9. Snapshots of the temperature fields during the FA and DDT under the influence of transverse jet obstacles (case 4). F-T – flame-turbulence, SW – shock wave, LSW – leading shock wave: (a) t = 1.06, (b) t = 1.105, (c) t = 1.165, (d) t = 1.255, (e) t = 1.285, ( f) t = 1.345, (g) t = 1.405, (h) t = 1.435, (i) t = 1.475, ( j) t = 1.5225, (k) t = 1.53125 and (l) t = 1.570 ms.

Figure 12

Figure 10. The positions of the flame front, LSW and the corresponding flame propagation velocity as a time sequence in the (a) premixed (case 1) and (b) non-uniform (case 3) supersonic mixture. The blue curve denotes the flame front propagation velocity.

Figure 13

Figure 11. Variations of temperature and species mass fraction across the flame front (a) near the wall and (b) middle region at the incipient FA for the premixed mixture in case 1 (t = 0.3100 ms).

Figure 14

Figure 12. Variations of temperature and species mass fraction across the flame front in (a) lower (0.25/2.0) and (b) upper (1.25/2.0) regions at the incipient FA in case 1 at t = 0.6800 ms.

Figure 15

Figure 13. Variations of temperature and species mass fraction across the flame front in (a) lower (0.25/2.0) and (b) upper (1.5/2.0) regions during FA for the inhomogeneous mixture in case 3 (t = 0.1540 ms).

Figure 16

Figure 14. The (a) temperature, (b) equivalation ratio (ER) and flame (cg) front structure distribution at t = 0.15400 ms for the inhomogeneous supersonic mixture (case 3) along different horizontal positions in the y-direction.

Figure 17

Figure 15. Snapshots of the temperature and pressure contours showing the propagation of the explosion point for case 4: (a1) t = 1.56375, (b1) t = 1.56625, (c1) t = 1.56875 and (d1) t = 1.57500 ms.

Figure 18

Figure 16. Contours of the temperature, pressure and OH variation illustrating the activation of the onset of DDT in case 4. SW – shock wave, MS – Mach stem, EP – explosion point: (a1) t = 1.56125, (b1) t = 1.56250 and (c1) t = 1.56375 ms.

Figure 19

Figure 17. Physical illustration of the shock wave (SW), Mach stem (MS) and flame front evolution during the onset of detonation. DW – detonation wave.

Figure 20

Figure 18. Variations of temperature and the corresponding pressure during the onset of detonation in case 4 along the x-direction in the lower wall, the red lines detonate the temperature. The transient time sequences are t = 1.5575 ms, 1.55875 ms, 1.5600 ms, 1.56125 ms, 1.56250 ms, 1.56375 ms and 1.56625 ms.

Figure 21

Figure 19. Snapshots of temperature, pressure and corresponding ER in the detonation extinction for case 4. SW – shock wave: (a1) t = 1.58125, (b1) t = 1.58375 and (c1) t = 1.59375 ms.

Figure 22

Figure 20. The detonation reinitiation rendered by temperature, pressure and ER evolution in the inhomogeneous supersonic mixture (case 4): (a1) t = 1.61875, (b1) t = 1.62625, (c1) t = 1.63125 and (d1) t = 1.64125 ms.

Figure 23

Figure 21. Schematic illustration of the flow structure before the onset of detonation. SW – shock wave, SM – sensitive mixture, LSW – leading shock wave, MS – Mach stem, LEP – localized explosion point.

Figure 24

Figure 22. Temperature variations and the corresponding pressure during the detonation reinitiation in case 4 along the x direction in the lower wall. The transient time sequences are t = 1.62125 ms, 1.6225 ms, 1.62375 ms, 1.625 ms, 1.62625 ms, 1.62875 ms, 1.63125 ms and 1.63375 ms.

Figure 25

Figure 23. Snapshots of the detonation propagation with temperature evolution in the inhomogeneous supersonic mixture (case 4). TW – transverse wave, SL – slip line, TP – triple point, SW – shock wave: (a) t = 1.65125, (b) t = 1.6625, (c) t = 1.67125 and (d) t = 1.67750, (e) t = 1.7, ( f) t = 1.7075, (g) t = 1.715 and (ht = 1.7225 ms.

Figure 26

Figure 24. The (a) axial position of the flame front and the (b) corresponding averaged flame front velocity at different y-direction positions near the lower wall (y/Ly = 0.1/2.0), middle region (y/Ly = 1.0/2.0) and upper wall (y/Ly = 1.9/2.0) in case 4.

Figure 27

Figure 25. Snapshots of over-driven detonation propagation rendered by (first column) temperature, (second column) pressure, (third column) ER and (fourth column) product showing the decupled detonation front (case 4). DW – detonation wave, MS – Mach stem, TW – transverse wave, DC – decoupled flame, DR – detonation reinitiation: (a1) t = 1.65625, (a2) t = 1.65875, (a3) t = 1.66250, (a4) t = 1.66500, (a5) t = 1.66750 and (a6) t = 1.67125 ms.

Figure 28

Figure 26. Physical illustration of the curved detonation wave, partially decoupled detonation and detonation re-initiation. DW – detonation wave, DQ – detonation quenching, DR – detonation reinitiation.

Figure 29

Figure 27. Transient detonation propagation velocity near (red curve) lower wall (y/Ly = 0.1/2.0) and (blue curve) upper wall (y/Ly = 1.9/2.0) in case 4 at different periods (a) t = 1.65875–1.66045 ms, (bt = 1.6625–1.6642 ms.

Figure 30

Figure 28. The (a) temperature contour, (b) OH contour, and the corresponding mass fraction of the flame front structure near the (c) decoupled detonation flame (line B, y/Ly = 1.4/2.0) and (d) upper wall (line C, y/Ly = 1.9/2.0) at t = 1.6625 ms in case 4.

Figure 31

Figure 29. The temperature, pressure and OH variations along line B for the decoupled detonation front at t = 1.6625 ms (see figure 28a).

Figure 32

Figure 30. Variations of macroscopic variables of (a) H2 and (b) Mach number along lines A, B and C in figure 28(a).

Figure 33

Figure 31. Snapshots of detonation propagation rendered by (first row) temperature, (second row) pressure, (third row) ER and (fourth row) product showing the partially decupled detonation front and irregular detonation cellular structure in case 4. DC – decoupled flame, TP – triple point, D-R – detonation re-initiation: (a1) t = 1.7, (a2) t = 1.7075, (a3) t = 1.715, (a4) t = 1.7225 and (a5) t = 1.7300 ms.

Figure 34

Figure 32. Flame front structure and detonation propagation instability in inhomogeneous supersonic mixture rendered by temperature contour (a) and destiny schlieren (b) at t = 1.7075 ms. TW – transverse wave, TP – triple point, SL – slipping line, MS – Mach stem.

Figure 35

Figure 33. Flame front structure and partial decouple flame front rendered by temperature contour (a) and destiny schlieren (b) at t = 1.7150 ms. TW – transverse wave, TP – triple point, SW – shock wave, MS – Mach stem.

Figure 36

Figure 34. Physical illustration of the Leher's shock-indued oscillation combustion.

Figure 37

Table 4. The AMR indicator parameters for shock-induced combustion.

Figure 38

Figure 35. Flow structure identified by (a) density gradient and the corresponding (b) AMR distribution.

Figure 39

Figure 36. The axial position of bow shock wave versus time and the fast Fourier transfer data under supersonic flow of Ma = 4.48.

Figure 40

Figure 37. Physical illustration of (a, upper row) experimental configuration from Ettner et al. (2013) and (b, lower row) reduced 2-D simulation model.

Figure 41

Table 5. The AMR indicators for the key species in FA simulation.

Figure 42

Figure 38. Temperature, vorticity and AMR distribution transient contours in FA.

Figure 43

Figure 39. The obtained flame tip propagation velocity versus flame position for the current simulation and previous literature data.

Figure 44

Figure 40. Physical illustration of FA and DDT in 3-D rectangle with transverse jet.

Figure 45

Figure 41. Evolution of temperature iso-surface in FA and DDT in the supersonic premixed mixture. LEP – localized explosion point, DW – detonation wave.

Figure 46

Figure 42. Snapshot of temperature contour before and after DDT in the z-direction. LSW – leading shock wave, LEP – localized explosion point, DW – detonation wave.